
Abstract
Background:
D-mannose exhibits strong anti-inflammatory properties, but whether it has beneficial effects on preventing and treating osteoporosis remains unknown.
Methods:
Female, 12-month-old senile C57BL6/J mice (s-Man group) and 8-week-old ovariectomized C57BL6/J mice (OVX-Man group) were treated with D-mannose in drinking water for 2 months (six mice/group). Microcomputed tomography analysis and hematoxylin and eosin staining were performed to investigate the effect of D-mannose on attenuation of bone loss. Tartrate-resistant acid phosphatase staining of tissue sections, flow cytometry, enzyme-linked immunosorbent assay, quantitative real-time polymerase chain reaction, and gut microbiome biodiversity tests were used to explore the underlying mechanisms.
Results:
D-mannose-induced marked increases in cortical bone volume and trabecular bone microarchitecture in the s-Man and OVX-Man group compared with that in the s-CTRL (senile control) and OVX group, respectively. Moreover, D-mannose downregulated osteoclastogenesis-related cytokines in the bone marrow and expanded regulatory T cells in the spleen of mice. Furthermore, D-mannose reconstructed the gut microbiota and changed the metabolite composition.
Conclusion:
D-mannose attenuated bone loss induced by senility and estrogen deficiency in mice, and this effect may be mediated by D-mannose-induced proliferation of regulatory T cells and gut microbiota-dependent anti-inflammatory effects.
Introduction
As an epimer of
Notably, several recent lines of evidences suggest that D-mannose exhibits strong anti-inflammatory properties. Kranjcec and colleagues demonstrated that D-mannose powder, which exerts anti-inflammatory effects, could prevent recurrent urinary tract infection (UTI) in humans, with fewer side effects compared with nitrofurantoin, an agent used in the clinical treatment of recurrent UTI. 10 Moreover, Domenici and colleagues found that D-mannose could also be used for the treatment for acute UTI in women. 11 Zhang and colleagues reported that mannose supplementation reduced lung tissue injury by upregulating the mRNA and protein expression of mannose receptor in a rat model of severe acute pancreatitis. 12 Also, another recent study by Zhang and colleagues showed that supplementation of D-mannose suppresses immunopathology in mouse models of airway inflammation and autoimmune diabetes via a mechanism mediated by an increase in the percentage of regulatory T cells (Tregs). 8
Osteoporosis is mainly characterized by loss of bone mass and deterioration of bone tissue microarchitecture. It is primarily induced by estrogen deficiency and aging, ultimately leading to skeletal fragility. 13 As life expectancy continues to rise, the incidence of osteoporosis has rapidly increased among the elderly. 13 Osteoporosis triggers a series of severe complications, such as chronic pain, insufficiency fractures, and disability, which require clinical evaluation.
Currently, for the prevention and treatment of osteoporosis, there are two pharmacologic approaches: (1) anabolic agents, such as parathyroid hormone, which can promote bone formation, and (2) antiresorptive agents, such as raloxifene, calcitonin, and bisphosphonates, which can suppress bone resorption. 14 These drugs can indeed increase bone mineral density (BMD) and thereby reduce fracture risks; however, their long-term use in people with osteoporosis is limited due to their side effects. 15
Accumulating research suggests that aggravation of inflammation disrupts bone metabolism.16–18 Liu and colleagues showed that proinflammatory T cells inhibit bone formation mediated by bone-marrow-derived mesenchymal stem cells (BMMSCs) via interferon (IFN)-γ and tumor necrosis factor (TNF)-α. However, Treg cells can inhibit T cell excitation and reduce the production of IFN-γ and TNF-α, thereby improving BMMSC-based calvarial defect repair. 19 Moreover, Liu and colleagues found that nanofibrous spongy microspheres release certain factors to enrich Treg cells and attenuate periodontal bone loss. 20 In addition, Zaiss and colleagues showed that Treg cells inhibit osteoclast formation by direct cell–cell contact. 21
In the current study, we aimed to evaluate the effects of D-mannose supplementation on the prevention and treatment of osteopenia and osteoporosis in mice, and to explore the underlying mechanism by which it attenuates bone loss and exerts its anti-inflammatory effect in vivo and ex vivo.
Materials and methods
Ethical approval
All animal experiments were approved by the Animal Care and Use Committee of Peking University Health Science Center (approval number: LA2017153; Beijing, China) and followed the ARRIVE guidelines. Moreover, the investigators were blinded in the whole-animal experiments.
Animals and administration
All C57BL/6J mice were obtained from Vital River (Beijing, China). Mice were kept in a specific-pathogen-free environment at the Peking University School and Hospital of Stomatology and had free access to autoclaved water and sterilized maintenance diet in a 12-h light–dark cycle at a room temperature of 21 ± 2°C. D-mannose was purchased from Sigma-Aldrich (St. Louis, MO, USA).
The 12-month-old female mice were randomly grouped into two groups after acclimatization of 1 week and each group had six mice: (1) s-CTRL (senile control) group and (2) s-Man (senile D-mannose) group, which was supplemented with D-mannose (1.1 M dissolved in drinking water). In order to establish a mouse model mimicking estrogen deficiency-induced bone loss, 8-week-old mice were subjected to bilateral oophorectomy according to standard methods, 22 and were randomly grouped into OVX (ovariectomy) and OVX-Man (ovariectomy D-mannose treatment) groups (six mice/group). Meanwhile, other 8-week-old mice underwent a sham operation and were randomly grouped into Sham and Sham-Man (sham D-mannose treatment) groups. D-mannose (1.1 M) dissolved in drinking water was administered to both OVX-Man and Sham-Man groups when the mice were 12 weeks old (4 weeks after bilateral oophorectomy). At 2 months after supplementation of D-mannose, all mice were anesthetized and killed. The femurs, centrums, and mandibles were dissected to remove the soft tissue. The specimens were fixed in 4% paraformaldehyde for 1 week.
Microcomputed tomography analysis
To evaluate the differences in bone mass and microarchitecture among these groups, microcomputed tomography (CT) was performed using an Inveon MM system (Siemens, Munich, Germany). 23 Briefly, images of the proximal femur, centrum, and mandible of mice were acquired at a pixel size of 8.82 μm, current of 220 μA, voltage of 60 kV, and exposure time of 1500 ms. 24 Bone morphometric parameters and BMD (0.5–1 mm distal to the proximal epiphysis) were calculated using an Inveon Research Workplace (Siemens) based on common guidelines. 24
Proliferation and osteoclastogenesis of osteoclast-like cells
RAW 264.7 cells were cultured in vitro at 10,000 cells/well in a 24-well plate (control group) and induced to generate osteoclast-like cells (OLCs) by receptor activator of nuclear factor-kappa B ligand (RANKL; OLC group) at a concentration of 100 ng/ml as previously described.25,26 Next, D-mannose was supplemented in the above-mentioned medium at a concentration of 25 mM [OLC + low mannose (L-Man) group] and 50 mM [OLC + high mannose (H-Man) group]. The effect of D-mannose on cell proliferation was assessed using cell counting kit-8 (CCK-8; Dojindo Laboratories, Kumamoto, Japan). OLCs, which appear as red-wine-colored cells with multiple nuclei, 27 were detected by tartrate-resistant acid phosphatase (TRAP) staining using the TRAP kit (Sigma-Aldrich).
Histological assessment and tartrate-resistant acid phosphatase staining
After fixing in 4% paraformaldehyde for 1 week, the femur specimens were soaked in 10% ethylenediaminetetraacetic acid decalcification solution in a constant temperature shaker at 37°C for 2 weeks. The decalcification solution was changed once every 2 days. Sections (5 mm thick) were stained with hematoxylin and eosin (H&E) for histological observation. Osteoclasts were also detected by TRAP staining as described previously. The subchondral bone adjacent to the cartilage border was defined as the observational region.
Flow cytometry
To explore whether Treg and T helper 17 (Th17) cells have effects on reversing bone loss, mice were killed for flow cytometry (FCM) analysis after D-mannose ingestion for 2 weeks and 2 months, respectively. In brief, lymphocytes were obtained from the spleens and bone marrow of mice at a concentration of 107 cells/ml. Treg cells were then stained using fluorescein isothiocyanate (FITC) labeled anti-CD4, allophycocyanin (APC)-labeled anti-CD25, and phycoerythrin (PE)-labeled anti-Forkhead Box P3 (FOXP3) antibodies (eBioscience, San Diego, CA, USA). Th17 cells were stained using FITC-labeled anti-CD4 and PerCP-Cy5.5-labeled anti-interleukin (IL)-17A antibodies (eBioscience). The stained cells were analyzed by a BD LSRII flow cytometer (Becton, Dickinson and Company, NJ, USA). FACSDiva 6.0 software was used for Treg cell analysis.
Enzyme-linked immunosorbent assay of suspended cell supernate from the bone marrow
Bone resorption induced by osteoclastogenesis may be promoted due to anomalous activation of lymphocytes and related proinflammatory cytokines.28,29 To explore whether osteoclastogenesis was associated with proinflammatory cytokine production in the bone marrow, enzyme-linked immunosorbent assay (ELISA) was performed. In brief, 8-week-old mice were killed and their femurs and tibiae were dissected to remove the soft tissue. The tip of each bone was cut and the bone marrow was flushed by injecting Roswell Park Memorial Institute (RPMI) 1640 medium (Gibco, NY, USA) using a syringe, as previously described. 30 Next, the suspended cells seeded at 40,000 cells/well in six-well plates were cultured in maintenance medium [RPMI 1640 medium containing 10% fetal bovine serum (FBS), 100 U/ml penicillin G, and 100 mg/ml streptomycin] at 37°C in an incubator containing 95% air and 5% CO2. The cells were grouped as follows: (1) L-Man group, which received 25 mM D-mannose treatment as previously described,8,9 (2) H-Man group, which received 50 mM D-mannose treatment, and (3) CTRL (control) group, treated with maintenance medium only. After 48 h, the cell culture supernatants were centrifuged for 10 min at 3000 × g at 2–8°C to remove particulates. Mouse ELISA kits (eBioscience) were used to evaluate the levels of proinflammatory cytokines in the cell supernatants. All cell-based experiments were repeated at least three times.
Gut microbiota biodiversity testing
To evaluate whether D-mannose ingestion can regulate intestinal microbiota and further improve bone metabolism, its effects on gut microbiota were investigated. Briefly, the 16S rDNA gene in fresh fecal samples from mice was extracted, quantified, and sequenced. AnMiSeq platform by Auwigene Company (Beijing, China) was used to perform deep sequencing. The sequences were clustered into operational taxonomic units (OTUs; 97% similarity level) to assess the differences by generating rarefaction curves and calculating the richness and diversity indices. Clustering analyses and principal-component analysis (PCA) were used to examine the similarity based on the OTU information. The raw metagenomic data for fecal samples have been deposited in the Short Read Archive of the National Center for Biotechnology Information under BioProject PRJNA506640 and PRJNA564435.
Proliferation and osteogenic differentiation of human BMMSCs
Proliferation and osteoinduction (OI) assays were carried out to explore whether D-mannose decreased bone loss using human BMMSCs (hBMMSCs; Science Cell Research Laboratories, CA, USA). The cells were grouped as follows: (1) L-Man group, which received 25 mM D-mannose treatment; (2) H-Man group, which received 50 mM D-mannose treatment; and (3) CTRL (control) group, treated with maintenance medium only. For the proliferation assay, hBMMSCs were seeded at 10,000 cells/well in a 24-well plate. CCK-8 (Dojindo Laboratories) and the absorbance (optical density, OD) of the formazan dye product at 450 nm were used to measure the cell proliferation rate. For the OI assay, 10 mM β-glycerophosphate, 10 nM dexamethasone, and 50 μg/ml ascorbic acid were added to low-glucose Dulbecco’s modified Eagle’s medium supplemented with 10% FBS, 100 U/ml penicillin, and 100 mg/ml streptomycin (Gibco).
Alkaline phosphatase detection and Alizarin Red S staining
To test the osteogenic effect of D-mannose on stem cells, hBMMSCs were seeded at 40,000 cells/well in 6-well plates. For alkaline phosphatase (ALP) activity, the cells were stained using a nitrobluetetrazolium (NBT)/5-bromo-4-chloro-3-indolylphosphate (BCIP) staining kit (CoWin Biotech, Beijing, China) after OI for 7 days. To assess mineralization, cells were stained with 2% Alizarin Red S (AR-S) staining solution (Sigma-Aldrich) after OI for 14 days.
Quantitative real-time polymerase chain reaction
Total RNA was extracted by TRIzol reagent (Invitrogen, CA, USA) and first-strand cDNA was then synthesized using a PrimeScript RT Reagent Kit (Takara, Tokyo, Japan). Quantitative real-time polymerase chain reaction (rtPCR) was performed on the 7500 Real-Time PCR Detection System (Applied Biosystems, CA, USA). The following thermal settings were used: 95°C for 10 min, followed by 40 cycles of 95°C for 15 s and 60°C for 1 min. The primers used in rtPCR are listed in Table 1. Data were analyzed with the 2–ΔCT method using glyceraldehyde 3-phosphate dehydrogenase for normalization.
Sequences of the primers used in qRT-PCR.

qrtPCR, quantitative real-time polymerase chain reaction.
Statistical analysis
IBM SPSS Statistics 20.0 software (SPSS, Chicago, IL, USA) was applied to conduct statistical analysis for all parameters using an independent two-tailed Student’s t-test or one-way analysis of variance, followed by post hoc analysis using the least significant difference test. Data were expressed as mean ± standard deviation (SD). A p value <0.05 was considered statistically significant.
Results
Long-term supplementation of D-mannose induced no apparent adverse reaction in mice
D-mannose ingestion did not induce any adverse reactions in mice, such as bloating, diarrhea, and abnormal weight gain or loss. In addition, there was no significant difference in daily water consumption among the six mice groups. Moreover, no inflammatory infiltration was observed in the liver, spleen, and kidney organ slices of mice (Supplemental Figure 1).
D-mannose attenuated bone mass and microarchitecture loss in OVX mice
To explore the effects of D-mannose on OVX-induced bone loss, the bone histomorphology of the femur, centrum, and mandible was evaluated by microCT or histological staining with H&E. Representative images of the femur are shown in Figure 1(a). The OVX-Man group showed significant increases in trabecular BMD (Tb.BMD), BMD in cortical bone (Ct.BMD), bone volume (BV)/total volume (TV), trabecular thickness (Tb.Th), and trabecular number (Tb.N) compared with the OVX group (p < 0.01, p < 0.05, p < 0.05, p < 0.05, and p < 0.01, respectively). By contrast, bone surface area (BS)/BV and trabecular separation (Tb.Sp) in the OVX-Man group were markedly decreased compared with those in the OVX group [p < 0.01 and p < 0.05, respectively; Figure 1(b)]. For the centrum, the OVX-Man group showed significant increases in Tb.BMD, BV/TV, Tb.Th, and Tb.N, and decreases in BS/BV and Tb.Sp compared with the OVX group [p < 0.05; Figure 1(c)]. Moreover, for the mandible, the OVX-Man group showed a significant increase in BMD (both mandibular angle and alveolar bone) as compared with the OVX group [p < 0.05; Figure 1(d)]. There was no significant difference in BMD and bone morphometric parameters between the Sham and Sham-Man groups. Notably, the OVX group showed a significant decrease in Tb.BMD, Ct.BMD, BV/TV, Tb.Th, and Tb.N, and increase in BS/BV and Tb.Sp of both the femur and centrum compared with the Sham group (p < 0.05 or p < 0.01, respectively). Moreover, the OVX group exhibited significantly decreased BMD (mandibular angle and alveolar bone) compared with the Sham group (p < 0.01).

Supplementation of D-mannose attenuated bone loss induced by estrogen deficiency in OVX mice. (a) Representative images of femur in coronal plane reconstructed by microCT and slicing of H&E staining at 2 months. Scale bar, 1 mm. Bone histomorphometry of femur (b) and centrum (c) in senile mice. (d) BMD of mandibular angle and alveolar bone. n = 6 mice per group in all panels. Data are expressed as mean ± SD.
D-mannose prevented bone mass decrease and bone microarchitecture deterioration in senile mice
To evaluate bone mass and bone microarchitecture in senile mice, the bone morphometry of the femur, centrum, and mandible was assessed by microCT or histological staining with H&E.
After D-mannose ingestion for 2 months, representative images of the femur are showed in Figure 2(a). The s-Man group showed a significant increase in Tb.BMD, BV/TV, Tb.Th, and Tb.N compared with the s-CTRL group (p < 0.05, p < 0.01, p < 0.05, and p < 0.05, respectively). By contrast, the BS/BV and Tb.Sp were markedly decreased in the s-Man group compared with that in the s-CTRL group [p < 0.05 and p < 0.01, respectively; Figure 2(b)]. Consistently with the results of the femur, the s-Man group showed a significant increase in Tb.BMD, BV/TV, Tb.Th, and Tb.N in the centrum compared with the s-CTRL group (p < 0.05). In addition, BS/BV and Tb.Sp in the centrum were markedly decreased in the s-Man group compared with that in the s-CTRL group [p < 0.05; Figure 2(c)]. Moreover, for the mandible, the s-Man group exhibited significantly increased BMD, both in the mandibular angle and alveolar bone, compared with the s-CTRL group [p < 0.01; Figure 2(d)].

D-mannose prevented against bone mass decrease and bone microarchitecture deterioration in senile mice. (a) Representative images of femur in horizontal plane and coronal plane reconstructed by microCT or slicing of H&E staining in senile mice at 2 months. Bone histomorphometry of femur (b) and centrum (c) in senile mice. (d) BMD of mandibular angle and alveolar bone. n = 6 mice per group in all panels. Data are expressed as mean ± SD.
Supplementation of D-mannose protected against osteoclastogenesis and associated inflammatory response
Images of TRAP staining of the histological sections of the femur ex vivo are shown in Figure 3(a). TRAP-positive cells with more than three nuclei were counted as osteoclasts. 27 The representative images showed that the OVX-Man and the s-Man group had fewer numbers of osteoclasts than the OVX and the s-CTRL groups, respectively. Furthermore, the number of osteoclasts/bone surface (OC. N/BS) and osteoclast surface/bone surface (OC. S/BS) were significantly decreased in the OVX-Man and s-Man group compared with that in the OVX and s-CTRL group [p < 0.01, respectively; Figure 3(b)].
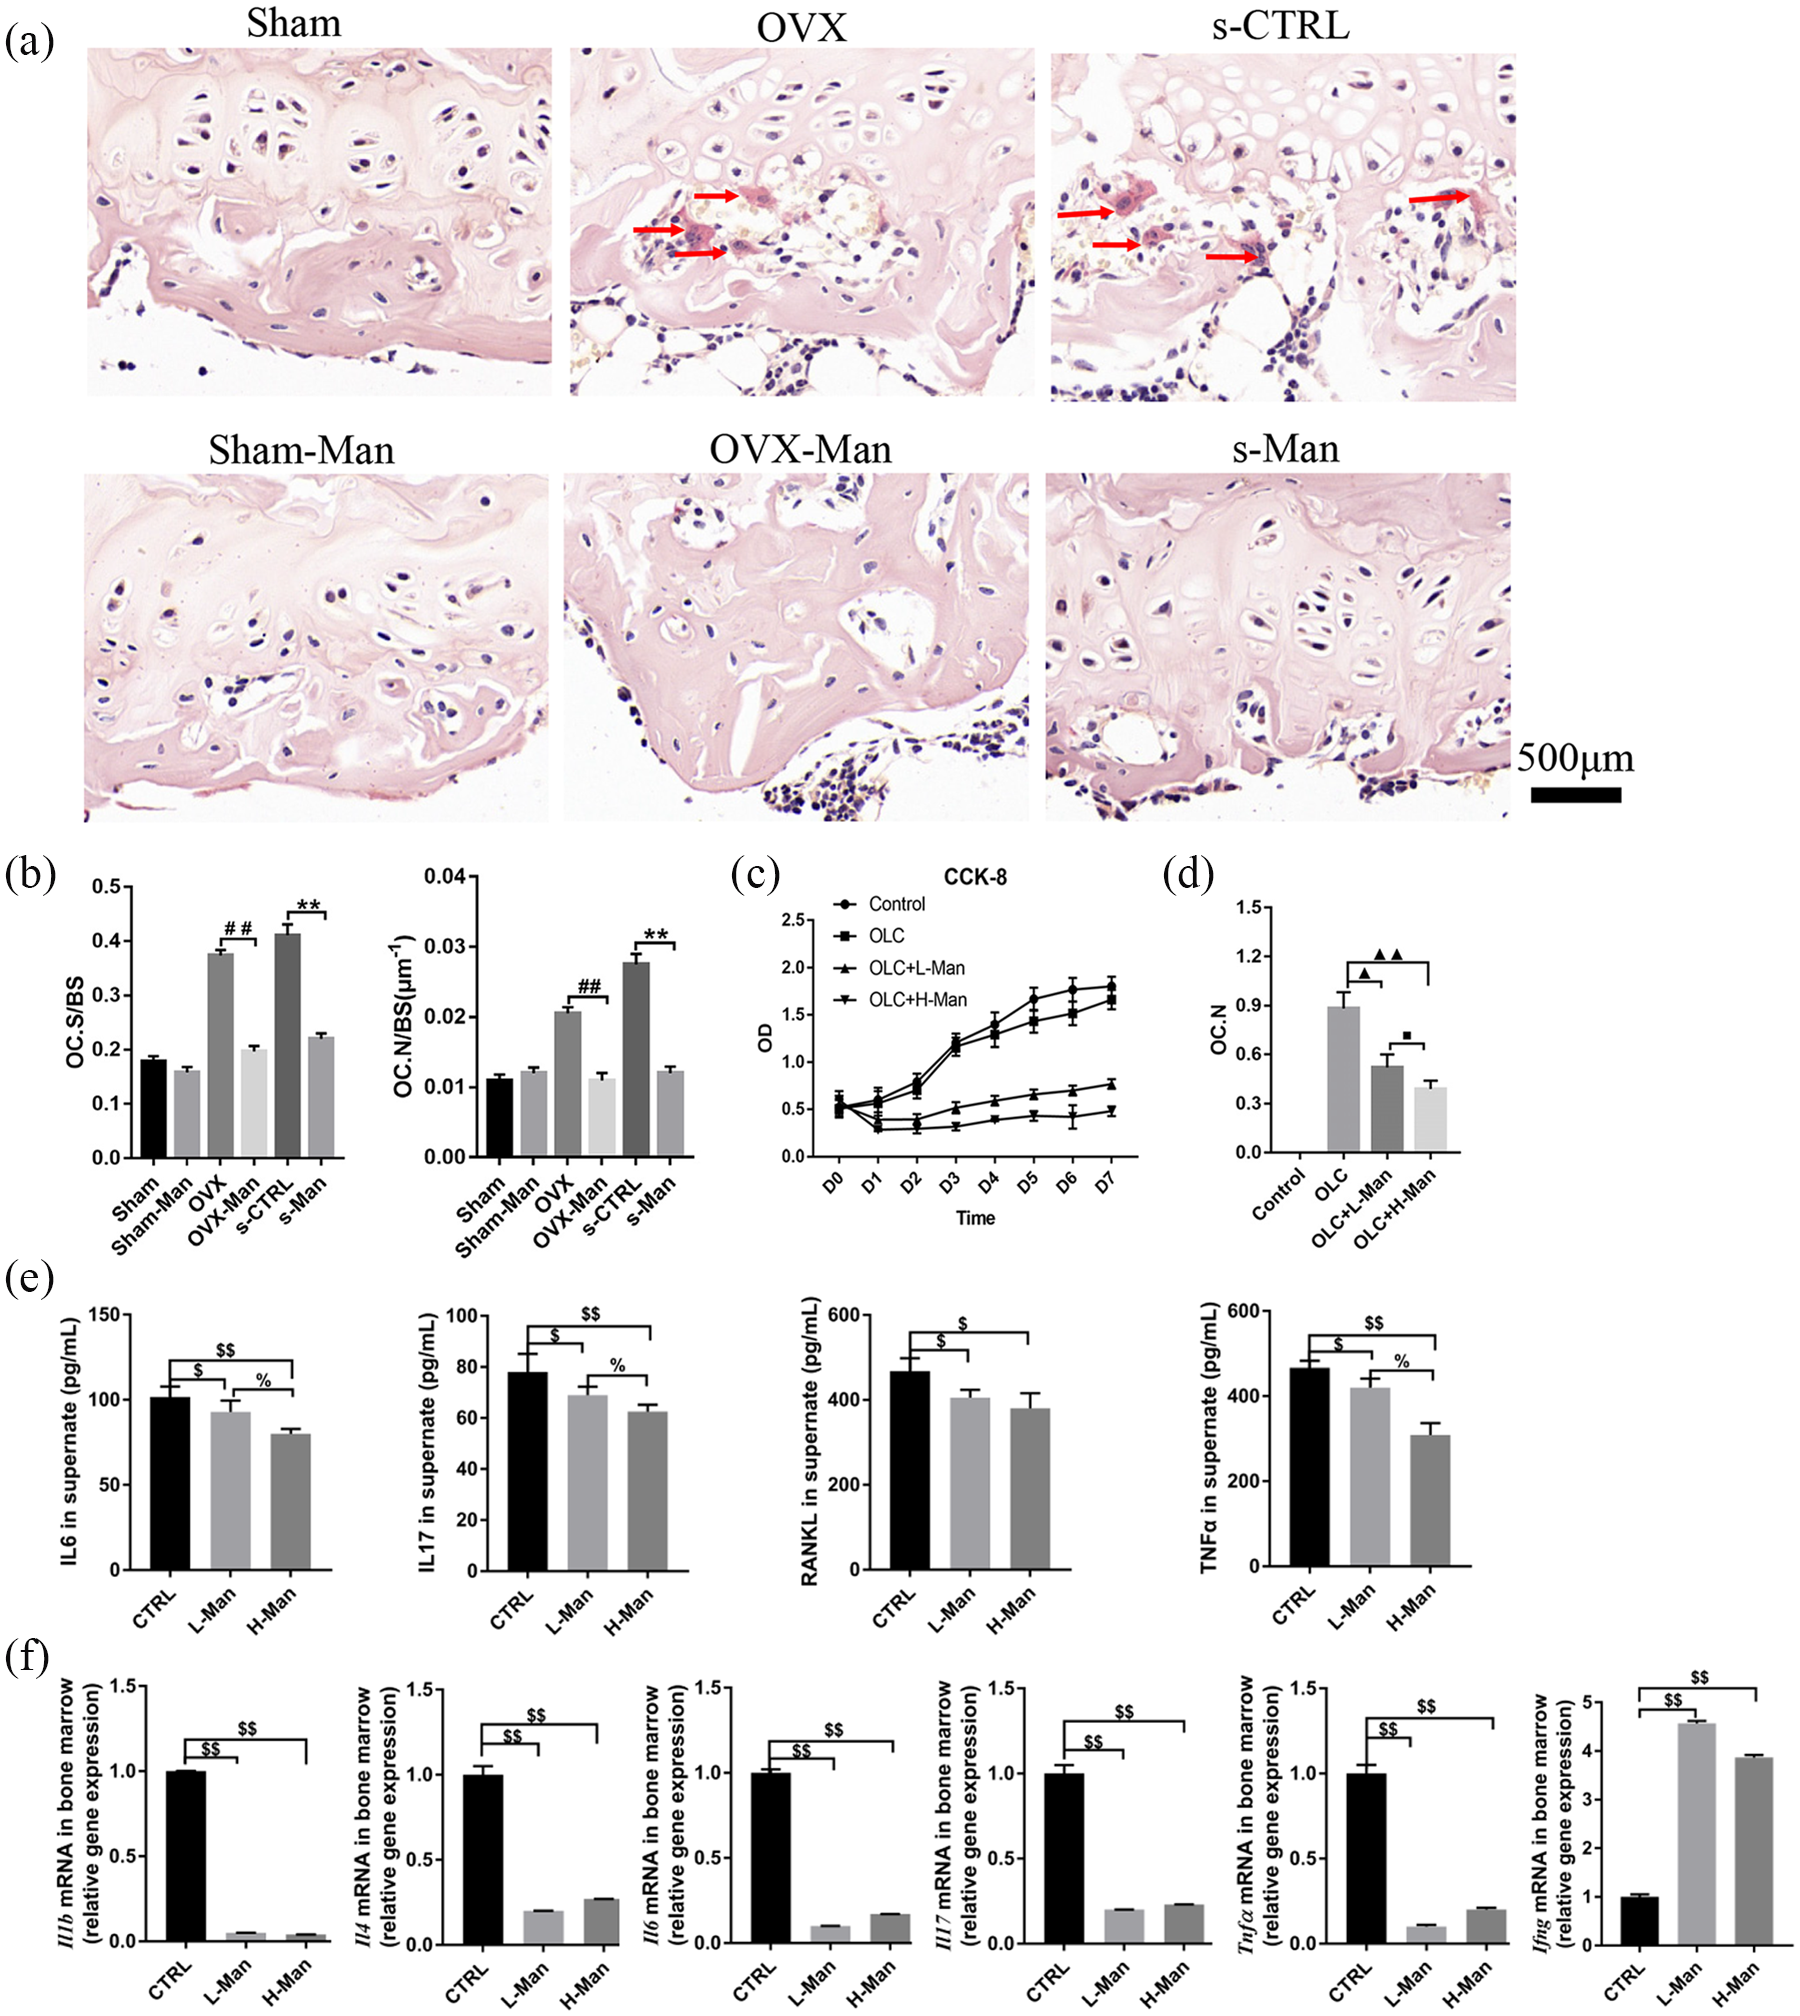
Supplementation of D-mannose protected against osteoclastogenesis and downregulated immune response in bone marrow.
Moreover, the effects of D-mannose on cell proliferation of osteoclasts and osteoclastogenesis were explored using OLCs ex vitro. The image of CCK-8 showed that the proliferative ratios of OLC + L-Man and OLC + H-Man groups were suppressed by supplementation of D-mannose compared with CTRL and OLC groups. Higher concentration of D-mannose exhibited more dramatical inhibition effect on proliferation of OLCs [Figure 3(c)]. Moreover, as shown in Figure 3(d), the number of OLCs in the OLC + L-Man and OLC + H-Man groups was significantly lower compared with OLC group (p < 0.05 and p < 0.01).
The levels of IL-6, IL-17, RANKL, and TNF-α in the cell supernatants of mice bone-marrow-derived suspended cells in both the L-Man and H-Man groups were significantly decreased compared with those in the CTRL group (p < 0.05 or p < 0.01, respectively). Moreover, the levels of IL-16, IL-17, and TNF-α in the cell supernatants of bone-marrow-derived suspended cells were significantly decreased in the H-Man group compared with those in the L-Man group [p < 0.05; Figure 3(e)]. Evaluation of the mRNA levels of proinflammatory cytokines in bone-marrow-derived suspended cells showed that there was a significant decrease in Il-1b, Il-4, Il-6, Il-17, and Tnfα levels in the L-Man and H-Man groups compared with the CTRL group (p < 0.01). However, the mRNA expression of Ifng was significantly increased in both the L-Man and H-Man groups compared with that in the CTRL group [p < 0.01; Figure 3(f)]. In addition, this downregulation of proinflammation-related mRNA expression of D-mannose may be not dependent on D-mannose concentration.
Treg cells were upregulated by D-mannose supplementation in senile and OVX mice in vivo and ex vivo
To investigate the mechanisms of the anti-inflammatory effects of D-mannose, the percentage of Treg cells in the CD4+ T cell subset was detected by flow cytometry (FACS) analysis. As shown in Figure 4(a and c), after 2 weeks of D-mannose treatment, the proportion of CD4+CD25+FOXP3+cells (Treg cells)/CD4+ T cells was significantly higher in the s-Man and OVX-Man groups compared with that in the s-CTRL and OVX groups, respectively (p < 0.05). However, statistically significant differences were not seen after administering D-mannose for 2 months in vivo [Figure 4(b and d)]. Moreover, the proportion of CD4+CD25+FOXP3+cells/CD4+ T cells was markedly higher in the s-CTRL group (which represents healthy senile mice) than that in the Sham group (which represents healthy young mice) after administering D-mannose for 2 weeks and 2 months (p < 0.05). Also, the proportion of CD4+CD25+FOXP3+ cells (Treg cells)/CD4+ T cells markedly increased in the OVX group compared with the Sham group after administering D-mannose for 2 weeks and 2 months [p < 0.05; Figure 4(a–d)].

Supplementation of D-mannose upregulated the percentages of Treg cells both in spleen and bone marrow. Representative FACS plots on ratio of Treg cells in CD4+ cell subset of spleen at 2 weeks (a) and 2 months (b). FACS analysis on Treg cells from spleen among six groups at 2 weeks (c) and 2 months (d). FACS analysis on Treg cells (e) and Th17 cells (f) of suspended cells from bone marrow in femurs supplemented various dose of D-mannose ex vivo. (g) qRT-PCR analysis measuring the transcript levels of FOXP3. N = 6 mice per group in all panels. Data are expressed as mean ± SD.
Consistently with results in vivo, similar results on the percentage of Treg cells in the CD4+ T cell subset in the cell suspension from the bone marrow of femurs supplemented with D-mannose were obtained ex vivo. The percentages of Treg cells/CD4+ T cells were upregulated in both the L-Man and H-Man groups compared with those in the CTRL group (p < 0.05), and this effect was not dependent on D-mannose concentration [Figure 4(e)]. On the contrary, the percentages of Th17 cells/CD4+ T cells were decreased in both the L-Man and H-Man groups compared with those in the CTRL group, and this effect was also independent of D-mannose concentration [p < 0.01; Figure 4(f)]. Moreover, the Foxp3 mRNA level in both the L-Man and H-Man groups was markedly increased compared with that in the CTRL group [p < 0.01; Figure 4(g)].
Gut microbiota was reconstructed by D-mannose supplementation
To evaluate the effects of D-mannose on gut microbiota, 16S rDNA pyrosequencing of the fecal samples from mice was performed. Firstly, 197 OTUs at 97% identity were used to analyze the gut microbiota of the six groups. Moreover, the Venn diagram showed that the number of unique OTUs in the Sham, Sham-Man, OVX, OVX-Man, s-CTRL and s-Man group was 12, 18, 11, 14, 162 and 22, respectively [Figure 5(a)]. Furthermore, a histogram of the linear discriminant analysis (LDA) scores showed significantly different microbiota compositions among the six groups. There were 5, 18, 15, 11, 12, and 13 in the Sham, Sham-Man, OVX, OVX-Man, s-CTRL, and s-Man group when the LDA scores were >3.6. In the Sham group, there were relatively higher proportions of Clostridium, Clostridiaceae, Rikenellaceae, and Ruminococcaceae. And in the Sham-Man group, there were higher proportions of Verrucomicrobia, Akkermansia, and Verrucomicrobiaceae. The OVX group was enriched in Bacilli and Lactobacillus. And Firmicutes and Erysipelotrichales were increased in OVX-Man group. In the s-CTRL group, there were relatively higher proportions of Bacteroidales and Bacteroidia. However, the s-Man group was enriched in Verrucomicrobia and Akkermansiaceae [Figure 5(c)]. PCA based on the weighted Uni Frac distances showed that the microbial species composition was significantly different among the six groups [Figure 5(b)]. However, the alpha diversity indices of Chao1, observed_species, PD_whole_tree, and Shannon in the OVX-Man and s-Man groups only had a decreasing trend but no statistically significant difference (Supplemental Figure 2).

D-mannose reconstructed intestinal microbial ecosystem in senile mice. (a) A Venn diagram on shared and unique OTUs at 97% identity among six groups. (b) Histogram of the LDA scores showing significantly differential microbiota compositions in six groups. (c) PCA analysis of six groups for beta diversity indices. PC1 and PC2 explained 35.46% and 21.2% of the variation observed, respectively (p < 0.001).
D-mannose cannot regulate the proliferation and differentiation of hBMMSCs
To explore the direct effects of D-mannose on hBMMSCs, proliferation and OI assays were carried out. The CCK-8 assay showed that supplementation of maintenance medium with different concentrations of D-mannose had no significant effect on the proliferation of hBMMSCs [Figure 6(a)]. The qrtPCR showed that different concentrations of D-mannose had no significant effect on relative mRNA expression of OCN, RUNX2, and ALP [Figure 6(b)]. Moreover, ALP activity [Figure 6(c)] and AR-S staining assays [Figure 6(d)] showed that D-mannose had no significant effect on the osteogenic differentiation of hBMMSCs.

Supplementation of D-mannose cannot regulate proliferation and differentiation of hBMMSCs. (a) The proliferation of hBMMSCs induced by D-mannose was assessed by CCK-8 assays. (b) qrtPCR analysis measuring the transcript levels of the OCN, RUNX2, and ALP. The osteogenic differentiation of hBMMSCs triggered by D-mannose was evaluated by ALP (c) and AR-S staining (d).
Discussion
To the best of our knowledge, this is the first study to demonstrate the effects of D-mannose on systematically attenuating bone loss induced by senility and estrogen deficiency using multiple assays. Further experiments showed that this effect may be associated with decreased number of osteoclasts, downregulated proinflammatory cytokine expression, increased number of Treg cells, and reconstruction of the gut microbiota.
Although the rate of rodent to human changes across the rodent lifespan, 1 month of mouse life is roughly equivalent to 3.54–6 years of human life.31,32 Hence, 12-month-old mice were used to mimic senile osteoporosis in our study. The 2 months of D-mannose supplementation reversed the loss of trabecular or cortical bone induced by senility and estrogen deficiency. MicroCT imaging and analysis showed that the bone mass and microarchitecture in the s-Man and OVX-Man groups were significantly improved compared with those in the s-CTRL and OVX groups. However, there was no apparent difference between the Sham and Sham-Man groups, suggesting that D-mannose may not affect the normal physiological status of the bone. Although the relationship between D-mannose and bone metabolism is still obscure, accumulating evidences have shown that saccharides, like glucose play a role in bone metabolism.33–35 For example, Kanazawa and colleagues reported that advanced glycation end-products of glucose can increase reactive oxygen species production, impair osteoblast and osteocyte activity, and eventually decrease bone formation. 35 However, as an epimer of D-glucose, D-mannose increased bone formation inversely, which may be associated with other mechanisms.
Previous research has shown that D-mannose has anti-inflammatory effects. D-mannose powder can be effectively used to prevent recurrent UTI 10 and acute cystitis. 11 Our further investigation also showed that the production of proinflammatory cytokines, such as RANKL, IL-6, IL-17, and TNF-α in the bone marrow were suppressed after D-mannose supplementation, which is consistent with the findings of previous research.8,10–12 However, numerous studies have supported the hypothesis that inflammatory response is closely associated with osteoclastogenesis, which is regulated by the production of proinflammation-related factors, such as RANKL, IL-6, IL-17, and TNF-α. As a member of the RANKL–receptor activator of nuclear factor-kappa B (RANK)–osteoprotegerin pathway, RANKL plays a vital role in osteoclastogenesis.36–38 Heymann and colleagues found that IL-6 promotes osteoclastogenesis and bone resorption29,39 and Kudo and colleagues reported that IL-6 promotes osteoclast formation via a RANKL-independent mechanism. 40 In addition, Mansoori and colleagues showed that IL-17 promotes osteoclastogenesis and bone loss through upregulation of N-cadherin and inhibition of Wnt signaling. 41 Azuma and colleagues reported that TNF-α promotes the differentiation of osteoclasts 42 and Kobayashi showed that TNF-α stimulates osteoclast differentiation through a mechanism independent of the RANKL–RANK system. 43 Hence, we concluded that D-mannose may prevent bone resorption through suppressing osteoclastogenesis. Moreover, osteoclastogenesis was suppressed by reducing inflammatory responses indirectly. In this study, the number of osteoclasts was dramatically reduced in the OVX-Man group and s-Man group compared with that in the OVX group and s-CTRL group respectively, suggesting that D-mannose indeed suppressed osteoclastogenesis trigger by sex hormone deficiency and senility. Further, CCK-8 and number of the OLCs in vitro demonstrated that D-mannose inhibited the proliferation and osteoclastogenesis of OLCs directly. Considering the IL-6- and other proinflammation-related factors, as well as proliferation and differentiation of osteoclasts, were suppressed by D-mannose in our study, we speculated that D-mannose may inhibit osteoclastogenesis through inhibiting inflammation indirectly and suppressing proliferation and osteoclastogenesis of osteoclasts directly. However, the concrete mechanism needs to be further explored.
Treg cells, as an important subgroup of CD4+ T cells, 44 play an important role in maintaining immune homeostasis and limiting the progression of autoimmune diseases. 45 Yang and colleagues showed that Treg cells exert immunomodulatory effects. 46 Moreover, Zhang and colleagues reported that D-mannose could promote the activation of the latent form of transforming growth factor-β, enhance naïve CD4+ T cell differentiation to Treg cells, and thus suppress immunopathology. 8 Also, Treg cells are associated with inhibition of osteoclast formation.21,47 In this study, we found that D-mannose supplementation indeed upregulated the ratio of Treg cells, which was consistent with the findings of Zhang and colleagues 8 Of note, our research demonstrated that the Treg cell proportion in the spleen and bone marrow was upregulated in vivo at 2 weeks after administration of D-mannose-supplemented drinking water. However, there was no significant difference in the number of Treg cells in the spleen between the two groups in vivo after administration of D-mannose for 2 months. The associated mechanisms are unclear and require further investigation.
Interestingly, the number of Treg cells was shown to increase with age in our study, which is in accordance with the findings of Rosenkranz and colleagues 48 Rosenkranz and colleagues analyzed Treg cells in patients suffering from Alzheimer’s and Parkinson’s disease as well as in nonaffected individuals, and showed that the proportion of Treg cells increased with age, which may be due to the clonal expansion of Treg cells. 48 However, the mechanism of this age-related change remains unknown and needs to be explored in the future.
In this study, 25 mM D-mannose was added to the culture medium to detect the percentage of Treg and Th17 cells or proinflammatory cytokines ex vivo, as previously described.8,9 No previous research has focused on the anti-inflammatory effect of different doses of D-mannose. To further explore whether the concentration of D-mannose can affect its anti-inflammatory ability, we selected a dose of 50 mM D-mannose (H-Man group) to perform the assays. However, the results showed that independently of the concentration (25 and 50 mM), D-mannose can dramatically upregulate the percentage of Treg cells, downregulate the percentage of Th17 cells, and reduce the levels of RANKL, IL-16, IL-17, and TNF-α in the cell supernatant. As a well-tolerated and natural product, we speculated that D-mannose may exert its anti-inflammatory effects at a wide range of concentrations, suggesting that the anti-inflammatory effects of D-mannose are not sensitive to dose variations. Our future research will explore the relationship between anti-inflammatory effects and a wide range of D-mannose concentrations.
As D-mannose was administered orally, we inferred that mannose can be absorbed by the gastrointestinal tract and may contribute to reconstruction of the gut microbiota. PCA demonstrated that the microbial species composition was significantly different between the OVX and OVX-Man groups as well as s-CTRL and s-Man groups. Furthermore, LDA analyses showed different microbiota compositions between the OVX and OVX-Man groups as well as s-CTRL and s-Man groups. Firmicutes was the most abundant phylum in the gut microbiota of the OVX-Man group. Ley and colleagues reported that the abundance of Firmicutes of gut microbiota correlated with percentage body fat.49–51
Prevotellaceae and Bacteroidaceae were the most abundant families in the gut microbiota of the s-Man group. Aidan reported that Prevotella sp. were among the most numerous microbes culturable from the rumen and hind gut of cattle and sheep, where they help breakdown protein and carbohydrates. 52 Hooper and colleagues previously demonstrated that Bacteroidaceae can help the host to decompose polysaccharides and improve nutrient utilization. 53 The recent study of Abdul Malik Tyagi and colleagues showed that the microbial metabolite butyrate could stimulate bone formation via Treg cell-mediated regulation of WNT10B expression. 54 Hence we speculated that orally administering D-mannose may firstly affect gut microbiota and further stimulate Treg cells and then regulate bone metabolism. However, the concrete mechanism by which D-mannose alters gut microbiota in mice and further affects bone metabolism remains unexplored.
Recent studies have shown that D-mannose can enhance immunomodulation of periodontal ligament stem cells via inhibiting IL-6 secretion. 55 Hence, we employed multiple assays to explore the effect of D-mannose on osteogenic differentiation of hBMMSCs. The results of ALP activity and AR-S staining assays showed that D-mannose did not promote osteogenic differentiation of BMMSCs, thereby suggesting that the effects of D-mannose on the reversal of bone loss may not directly rely on osteogenic differentiation of BMMSCs.
There were some limitations in this study. We observed that the period on D-mannose prevented bone loss in mice was only 2 months. However, its long-term effects on bone metabolism and side effects still need to be investigated. What is more, although rodents become anovulatory at a mature age (10–12 months old) they maintain a basal gonadal steroid secretion, in contrast to what happens in women. 56 Hence, the 12-month-old mice may not have exactly represented the state of osteoporosis induced by senility. In addition, the exact mechanism by which D-mannose attenuates bone loss needs to be further explored. How D-mannose regulated osteoclastogenesis by affecting Treg cells and gut microbiota is still unknown. Thus we need to carry out further studies to explore the potential mechanism.
In conclusion, to the best of our knowledge, this is the first study to report the effect of D-mannose on attenuating bone loss induced by senility and estrogen deficiency in senile and OVX mice. Moreover, this effect was shown to be associated with decreased number of osteoclasts, downregulated proinflammatory cytokine expression, increased number of Treg cells, and reconstruction of the gut microbiota.
Supplemental Material
Supplemental_Fig._1 – Supplemental material for D-mannose attenuates bone loss in mice via Treg cell proliferation and gut microbiota-dependent anti-inflammatory effects
Supplemental material, Supplemental_Fig._1 for D-mannose attenuates bone loss in mice via Treg cell proliferation and gut microbiota-dependent anti-inflammatory effects by Hao Liu, Ranli Gu, Yuan Zhu, Xiaomin Lian, Siyi Wang, Xuenan Liu, Zhang Ping, Yunsong Liu and Yongsheng Zhou in Therapeutic Advances in Chronic Disease
Supplemental Material
Supplemental__Fig._2 – Supplemental material for D-mannose attenuates bone loss in mice via Treg cell proliferation and gut microbiota-dependent anti-inflammatory effects
Supplemental material, Supplemental__Fig._2 for D-mannose attenuates bone loss in mice via Treg cell proliferation and gut microbiota-dependent anti-inflammatory effects by Hao Liu, Ranli Gu, Yuan Zhu, Xiaomin Lian, Siyi Wang, Xuenan Liu, Zhang Ping, Yunsong Liu and Yongsheng Zhou in Therapeutic Advances in Chronic Disease
Footnotes
Acknowledgements
Hao Liu and Ranli Gu contributed equally to this study.
Author contributions
Study design: YSL, and HL. Study conduct: HL, RLG, YZ, XML, SYW, and XNL. Data collection: HL, RLG, YZ, PZ, and XML. Data analysis: SYW and YSL. Data interpretation: HL, RLG, XNL, and YSL. Drafting manuscript: HL, RLG, YZ, and SYW. Revising manuscript content: HL, RLG, XML, XNL, PZ, and YSZ. Approving final version of manuscript: HL, RLG, YZ, XML, SYW, XNL, PZ, YSL, and YSZ. YSL takes responsibility for the integrity of data analysis.
Funding
The authors disclosed receipt of the following financial support for the research, authorship, and/or publication of this article: This work was supported by the National Natural Science Foundation of China (grant numbers: 81970908, 81771039, 81700935, and 81870742) and the Project for Culturing Leading Talents in Scientific and Technological Innovation of Beijing (Z171100001117169) and the Peking University Medicine Seed Fund for Interdisciplinary Research (No. BMU2018ME005 to YL).
Conflict of interest statement
The authors declare that there is no conflict of interest.
Supplemental material
Supplemental material for this article is available online.
References
Supplementary Material
Please find the following supplemental material available below.
For Open Access articles published under a Creative Commons License, all supplemental material carries the same license as the article it is associated with.
For non-Open Access articles published, all supplemental material carries a non-exclusive license, and permission requests for re-use of supplemental material or any part of supplemental material shall be sent directly to the copyright owner as specified in the copyright notice associated with the article.