
Abstract
Diagnosis and monitoring of psychiatric disorders rely heavily on subjective self-reports of clinical symptoms, which are complicated by the varying consistency of accounts reported by patients with an impaired mental state. Hence, more objective and quantifiable measures have been sought to provide clinicians with more robust methods to evaluate symptomology and track progression of disease in response to treatments. Owing to the shared origins of the retina and the brain, it has been suggested that changes in the retina may correlate with structural and functional changes in the brain. Vast improvements in retinal imaging, namely optical coherence tomography (OCT) and electrodiagnostic technology, have made it possible to investigate the eye at a microscopic level, allowing for the investigation of potential biomarkers in vivo. This review provides a summary of retinal biomarkers associated with schizophrenia, bipolar disorder and major depression, demonstrating how retinal biomarkers may be used to complement existing methods and provide structural markers of pathophysiological mechanisms that underpin brain dysfunction in psychiatric disorders.
Keywords
Introduction
Mental disorders now comprise the leading cause of disability globally. 1 They afflict people without discrimination of age, geography or income level, 2 with an estimated one in three people affected by a mental illness during their lifetime.3,4 Mental disorders are associated with a lower quality of life and significantly correlated with chronic disease (i.e. cardiovascular disease, diabetes) development.5,6 The Diagnostic and Statistical Manual of Mental Disorders (DSM) introduced a standard and operationalised diagnostic framework within which to make psychiatric diagnoses. Although its initial intent was to increase reliability of diagnoses and ensure continuity of care, clinical diagnosis and monitoring of psychiatric disorders often remain dependent on patient reports of clinical symptoms. 7 These subjective accounts may also be compromised if patients are in an impaired mental state.
In such cases, family member reports play an important role in clinical diagnosis, such as in the case of patients with Asperger syndrome and other autism spectrum disorders. 8 Moreover, clinicians differ in the process of making diagnoses as recommended by diagnostic manuals, 9 which could jeopardise the patient’s treatment and care. Clinically, the functional elements of the conditions are likely to remain the therapeutic focus; however, retinal biomarkers may be a useful adjunct in detecting or predicting any structural or functional progression of neuropsychiatric disease, although longitudinal studies are needed to validate if indeed psychiatric structural changes in the brain are reflected in the retina.
Diagnosing schizophrenia, bipolar disorder and major depression commonly involves screening scales and patient-reported outcome measures. For major depression disorder, the Patient Health Questionnaire (PHQ-9) is a commonly used tool for diagnosis, 10 but has been found not to provide a strong index for severity of disease. 11 According to a study by Kjaergaard and colleagues, other commonly used screening tools, such as the Beck Depression Inventory-II, the Montgomery and Åsberg Depression Rating Scale, were concluded to be useful for screening a major depression episode but not reliable in accurately diagnosing depression, hence necessitating the need for a comprehensive tool to guide and monitor treatment response. 12 In one study observing the reliability of patient-reported outcome measures (PROMs) in schizophrenia, differences were found in PROM self-ratings provided consequently by patients with schizophrenia. 13 Greater differences were associated with higher degrees of disorganisation and cognitive impairment, thus suggesting the lack of reliability in patient reports. It is important to note that symptoms of schizophrenia can change over time, thus making it challenging to use symptomology screening scales as the mainstay. 14 Further to this, screening tools such as the Mood Disorder Questionnaire (MDQ) for bipolar disorder have been found to have a low positive predictive value, suggesting that such scales may not be reliable tools in clinical practice. 15 Lastly, Svendsen and colleagues concluded that subjectively experienced cognitive function fails to predict objective function. 16 Therefore, in order to gain a better understanding of the neurological changes that occur, objective measures must be sought. The gap in diagnostics and monitoring has called for more objective and quantifiable measures to equip clinicians with reliable tools to assess symptomology and to track disease progression in response to treatments.
The retina’s development from the same tissue as the brain, the neuroectoderm, suggests that retinal changes may parallel structural and functions changes in the brain. 17 Noninvasive, retinal imaging technology, such as optical coherence tomography (OCT) and electrodiagnostics, have made it possible to determine potential biomarkers of neural tissue structure changes and disorder progression. 17 OCT is a quick, noninvasive imaging device that captures cross-sectional retinal images down to the individual layers through high resolution using near-infrared light (Figure 1).18,19
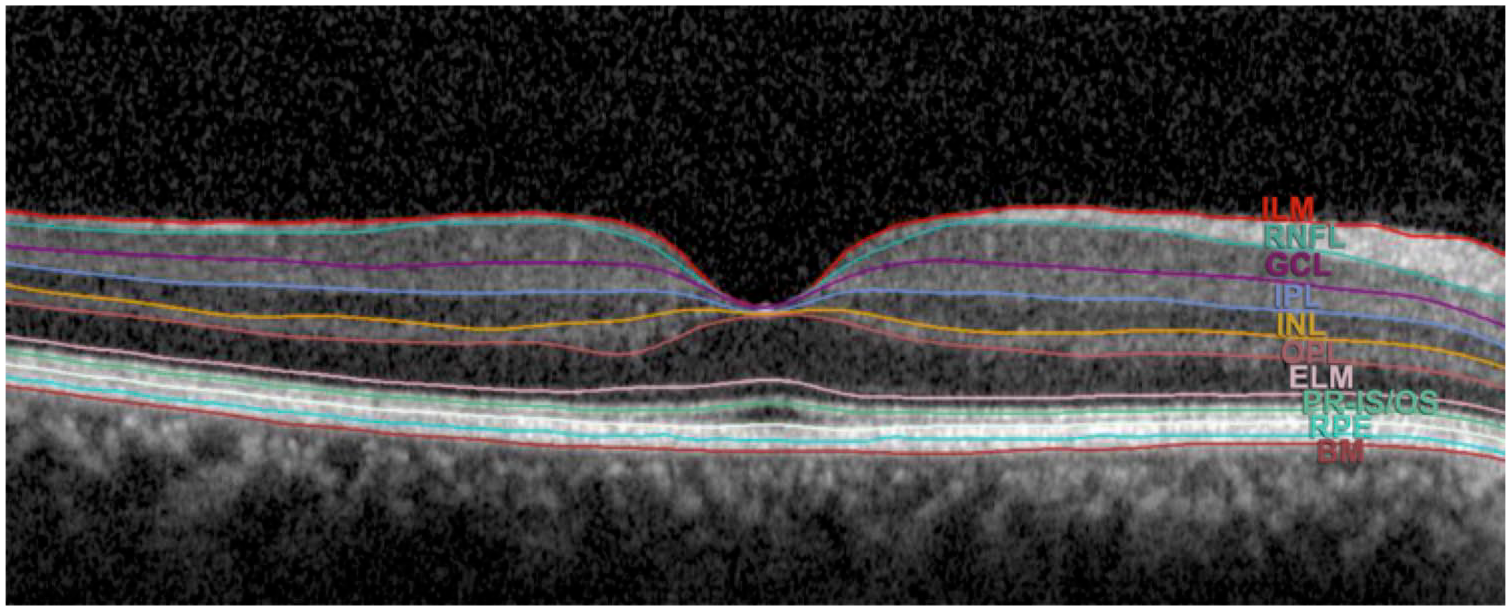
An SD-OCT cross-sectional macula scan of retinal layers.
With its power to achieve high resolution imaging, SD-OCT has allowed for a number of previously unseen changes to be assessed, such as reductions in retinal nerve fibre layer thickness in patients with schizophrenia and decreased choroidal thickness in patients with psychosis compared with healthy controls.20,21 Oberwahrenbrock and colleagues investigated the inter-rater reliability of semiautomated segmentation of OCT scans across five centres in the United States and Europe, and concluded that OCT scans are highly reliable in a neurodegenerative population. Thus, OCT scans can potentially serve as a reliable tool in clinical trials assessing retinal injury in psychiatric disorders. 22 Thus, retinal imaging allows for the possibility of surrogate biomarkers to guide clinicians and researchers and provide greater insight on diseases that have historically relied on subjective self-reports and contradictory screening scales.
Determining biomarkers may provide researchers with an opportunity to reduce cost and time in clinical trials and allow clinicians to diagnose earlier, monitor disorder progression and guide treatment. The studies in this review examine the correlation between retinal markers and disease presence, severity and duration in schizophrenia, bipolar disorder and major depression. The aims of this review are to demonstrate how retinal biomarkers may be utilised to enhance current clinical diagnostic methods and to discuss how changes in OCT measures may serve as surrogate markers of pathophysiological mechanisms that contribute to brain abnormalities in psychiatric disorders.
Schizophrenia
Schizophrenia is a chronic, debilitating psychiatric disorder that affects an estimated 4.0 per 1000 people over a lifetime, 23 and is ranked the fifth leading cause of disability worldwide in 15- to 44-year olds. 24 Diagnosis is complex and relies primarily on clinical judgement of positive symptoms (e.g. hallucinations, delusions, disorganised speech) or negative symptoms (e.g. avolition, flat affect).25,26 Symptoms may also fluctuate over time, with several other conditions acting as possible mimics including infectious, 14 neurological, metabolic and other psychological disorders.27–29 These factors make diagnosing schizophrenia challenging.
Diminished total brain volume seen on MRI is a well-established characteristic of schizophrenia. 30 In a large (352 studies) meta-analysis collating cross-sectional volume indices, longer illness duration and high doses of antipsychotics were negatively correlated with grey matter volume. Similarly, with severity of disease, grey matter volumes of the superior temporal gyrus and gyrus rectus have been found to correlate negatively with the positive scales of the Positive and Negative Syndrome Scale (PANSS), and superior temporal gyrus and anterior cingulate cortex correlated negatively with negative scales. 31
There is evidence that early identification and treatment of psychotic symptoms markedly improves clinical outcomes.32,33 Given the weak predictive value of clinical features, diagnoses based on objective biomarkers would be of paramount value.26,34 Visual impairments, including deficits in visual acuity and contrast sensitivity,35,36 are both common and have a high sensitivity for converting to psychosis compared with other symptoms. 37 Visual impairments have been associated with psychosis from the prodromal phase, 38 to first episodes,39–41 in addition to higher rates of psychosis,42,43 increased severity of illness and chronicity.42,44–46 Visual deficits may also be secondary to reduced access to healthcare in that patients’ deficits may stem from underutilising healthcare services regardless of visual changes. 47 It is uncertain to what extent visual impairments derive from the retina versus the brain. It has been suggested that structural and functional retinal changes may indicate progressive brain tissue loss in addition to explaining clinical features and perceptual visual processing deficits, 17 as established in multiple sclerosis and Alzheimer’s disease (AD).48–53
Retinal neurotransmitters in schizophrenia
N-methyl-
Electroretinogram changes in schizophrenia
Changes in retinal function over time, or how they compare to healthy controls, can serve as an important biomarker for monitoring disease progression. Electroretinogram (ERG) assesses retinal function by measuring electrical activity of neuronal populations in response to light exposure.46,67 In schizophrenia, abnormal ERG findings are well established, and have been reported in several recent studies.68–70 Using portable hand-held flash ERG (fERG), Demmin and colleagues reported diminished a-wave and b-wave amplitude and latency in both photopic (light-adapted) and scotopic (dark adapted) conditions, suggesting weakened photoreceptor and bipolar cell activity. 68 In contrast, Moghimi and colleagues saw a trend of decreasing b-wave amplitude in schizophrenia patients and healthy controls with regards to a-wave and latency, despite observing a trend towards reduced b-wave amplitude. 69 Looking at the findings from a longitudinal standpoint, Hébert reported that cone a-wave and rod b-wave amplitude reductions seen in childhood were present in adults with schizophrenia. 71 Finally, in a large study comparing medicated and stable 150 schizophrenia patients with 151 bipolar patients, both patient groups exhibited diminished cone a-wave amplitude and extended b-wave latency, whereas only schizophrenia patients exhibited diminished cone b-wave amplitude. Furthermore, bipolar and schizophrenia patients could be differentiated with 80% sensitivity and 82% specificity. 70 These studies suggest ERG could be useful to clinicians in a number of ways, including making differential diagnoses and objectively tracking neurodevelopment of the condition and use and effectiveness of antipsychotic medications.
OCT in schizophrenia
The use of OCT in schizophrenia is fairly novel, yet studies have revealed common themes, most notably retinal thinning and reduced macular thickness and macular volume (MV). Global retinal thinning has been reported in several studies.61,62,72–74 Specifically, peripapillary RNFL thinning has been observed in the nasal, inferior and, predominately, in the superior quadrants (Figure 2).74–77 In contrast, Silverstein and colleagues reported no difference in RNFL thickness between schizophrenia patients and controls, 78 and Ascaso and colleagues found these significant differences only amongst right eyes, the clinical relevance of which remains unclear (Table 1). Macular thinning and reduced MV are another reported, yet debated, finding in patients with schizophrenia compared with age-matched controls. Whereas several studies observed overall macular thinning in patients compared with age-matched controls,61,62,75,79,80 one study observed macular thinning isolated to the nasal and inferior outer macular regions. 81 In contrast, Silverstein and colleagues reported no difference in macular thinning between schizophrenia patients and age-matched controls. 78 Additionally, Chu and colleagues observed no macular thinning in schizophrenia and schizoaffective patients compared with healthy controls. However, it is unclear how the results were affected by the inclusion of schizoaffective disorder, given that the majority of studies excluding schizoaffective patients report significant macular thinning. 82

Comparison of SD-OCT pRNFL thicknesses of the right eyes in a patient with schizophrenia (a) and a healthy patient (b). Yellow sectors indicate borderline limits.
A summary of studies reporting sector analysis of peripapillary RNFL changes in schizophrenia, bipolar disorder and major depression. Effect size has been calculated as mean percentage reduction in disease versus healthy controls.

Grey shading indicates statistical significance as chosen by each study investigator.
Mean of right and left eyes.
OD significant only.
IN, inferonasal; IT, inferotemporal; OCT, optical coherence tomography; RNFL, retinal nerve fibre layer; SD, spectral domain, SN, superonasal; ST, superotemporal; TD, time domain.
On examination of the individual layers of the macula with OCT, one comprehensive study by Samani and colleagues found that total retinal thickness was significantly reduced in the foveal, nasal parafoveal, and temporal parafoveal regions, with all three zones having outer nuclear layer (ONL) and inner segment layer (ISL) thinning in common. 61 Furthermore, thinning was observed to affect the parafoveal ganglion cell layer (GCL) temporally, and the inner plexiform layer (IPL) and retinal nerve fibre layer (RNFL) nasally. 61 Of relevance to treatment potential in schizophrenia, lower macular volumes have been observed in treatment-refractory patients compared with treatment-responsive patients, possibly reflecting the duration of disease, but also with potential as a prognostic biomarker. 72 In contrast, other studies have observed no difference in global mRNFL or choroidal thickness in schizophrenia and schizoaffective disorder when compared with healthy controls (Table 2).79,82 These contrasting findings have been attributed to small sample sizes, varying illness duration and lack of OCT resolution to detect loss of unmyelinated axons in early disease. In the latter study, Chu and colleagues found specifically that the right nasal RNFL in schizoaffective patients was significantly thinner (p = 0.02) compared with schizophrenia patients 82 ; however, the clinical relevance of this finding, if any, would need to be proven with further studies.
Structural retinal characteristics of patients diagnosed with schizophrenia, BD and depression.

Positive (+) sign denotes statistically significant thinning compared with healthy controls. Negative (−) sign refers to no difference in thickness between those with disease and healthy controls. ‘n’ refers to number of patients.
Eyes.
Not reported.
RNFL, retinal nerve fibre layer; SD, standard deviation.
Wide retinal venules in schizophrenia
There is growing evidence that people with schizophrenia have higher rates of cardiovascular disease (CVD),9,89–94 and the calibre of retinal microvasculature assessed through colour fundus photography is increasingly recognised as an important biomarker of subclinical CVD. Indeed, metabolic syndrome (MetS) has been well studied in schizophrenia.95,96 MetS prevalence ranges from 5.6% in untreated schizophrenia inpatients in Brazil up to 74% in Hispanic outpatients.97,98 Patients with schizophrenia are already at elevated risk of morbidity and mortality due to CVD, so given that antipsychotic medications may potentiate the damage, especially at young ages,99,100 it is important to be able to monitor and anticipate cardiovascular changes to allay further injury from CVD.
Several familial studies have examined the association between schizophrenia or psychosis and retinal venule calibre with positive associations. The Dunedin Longitudinal Study, a birth cohort originally consisting of 1037 children, described how patients who developed schizophrenia by age 38 had distinctly wider retinal venules compared with healthy cohort members. 101 Similarly, in the Twins Eye Study in Tasmania and the Brisbane Longitudinal Twin Study, individuals who experienced psychosis had wider venules compared with unaffected co-twins and controls; however, unaffected co-twins also exhibited wide venules compared with controls. 102 These findings suggest widened retinal venules may reflect familial vulnerability to psychosis. Accordingly, genetic variants associated with both retinal vascular abnormalities and schizophrenia were described in the Dunedin study and revealed a strong genetic correlation between arterial diameter and weak correlation in venular diameter with a schizophrenia diagnosis. 103 More recently, in a study examining the relationship between adult vascular-ischemia and the neurodevelopmental hypothesis, Moises, Wollschläger and Binder described an overwhelming number of schizophrenia-associated genes also involved with vascular function, regulation and repair. 104 These findings suggest that vascular abnormalities evidenced by widened retinal venules may reflect a genotypic vulnerability to psychosis.
Magnocellular pathway dysfunction in schizophrenia
Beginning in the M-ganglion cells of the retina, the magnocellular pathway branches out into the M-layers of the lateral geniculate nucleus (LGN) of the thalamus then into the dorsal stream and visual cortex located in the parietal lobe. 105 Visual pathway deficits in schizophrenia are thought to stem from disturbances in this pathway, as evidenced by reduced visual field sensitivity,106–108 eye-tracking,109,110 motion-contrast sensitivity, 111 reading performance and smooth pursuit eye movement compared with healthy controls. 105 Deficits in the magnocellular pathway have also been implicated in some of the cognitive impairments seen,112,113 including attention and memory.107,114 Given the multiple visual symptomology in schizophrenia, various methods have been used to investigate the potential impact of magnocellular pathway deficits on vision. Functional magnetic resonance imaging (fMRI) studies have revealed right hemisphere magnocellular pathway hypoactivation in first-degree nonpsychotic relatives and patients with schizophrenia, 115 but otherwise normal pathway functioning. 116 Electroencephalography (EEG) studies measuring event-related potentials (ERPs) have shown diminished amplitudes and poor detection of low spatial frequency targets. 117 Regarding contrast sensitivity loss, a review by Skottun and Skyoles concluded that contrast sensitivity deficits were not consistent with magnocellular deficiencies. 118 However, they did acknowledge the difficulty of drawing a clear relationship between clinical symptoms of schizophrenia to deficits in the magnocellular pathway, 118 such as linking poor reading performance in schizophrenia to dyslexia, which is weakly associated. 105
More notably used in glaucoma, frequency doubling perimetry (FDT) is a small, transportable device that assesses visual field defects as well as changes in contrast sensitivity. 114 FDT works by creating an illusion at a high temporal frequency of a counter-phased flicker of a sinusoidal grating with a low spatial frequency. 114 Since processing this type of visual stimuli is believed to involve areas of the brain that process visual information that activate the magnocellular pathway, FDT is seen as a way to assess retinal ganglion cell (RGC) function.115,119,120 FDT has been used in glaucoma patients to assess the relationship between ganglion cell-inner plexiform layer (GCIPL) thickness and mean sensitivities and showed strong statistically significant positive correlations between the two, most notably in the inferotemporal and inferior sectors. 121 Several studies have explored neurological dysfunction of this pathway in patients with schizophrenia using FDT as well. Khosravani and Goodarzi reported diminished visual field sensitivity in patients with schizophrenia compared with normal controls. 106 Gracitelli and colleagues reported statistically significantly lower global mean deviation in both eyes of patients with schizophrenia compared with their parents and normal controls. 107 Similarly, Lima and colleagues showed lower global mean sensitivity in patients compared with healthy controls. 108 Indeed, these abnormalities may reflect deeper damage to neural pathways within the brain, specifically the cortex and brainstem, as similarly proposed in AD, 122 in order to offer a potential biomarker for diagnosis and monitoring of cognitive impairment in schizophrenia, thus an area of great interest for future research.
Severity and duration of schizophrenia
The correlations reported between duration of disease with retinal thickness and macular volume are mixed. Significant inverse correlations have been reported between duration of disease and thickness of the RNFL, temporal parafoveal ISL and temporal parafoveal ONL, as well as macular thinning and volume.61,62 These correlations with macula thickness and volume suggest progressive neurodegeneration seen in parallel with MRI changes of grey matter volume loss. 123 However, studies containing similar numbers of patients and controls have reported no significant correlation between RNFL thickness or macular thickness with duration of illness.74,79 The Ascaso study (n = 60) found no correlation between duration and retinal abnormalities; however, the finding of macular thinning in patients with nonrecent illness episodes suggests that changes in retinal structures may be conditional as opposed to progressive. 75 Similarly, Chu and colleagues reported no significant retinal changes between early stage schizophrenia patients and schizoaffective disorder to age and gender-matched controls. 82 The lack of disease-related retinal changes seen in these studies may be explained by the theory that lower levels of neuroinflammation in the retina can be caused by antipsychotic drug use, particularly in patients with recent illness episodes.124,125 This has been supported by a meta-analysis that included 23 studies (n = 762), which suggested antipsychotics express a systemic anti-inflammatory effect. 126 Only one study we reviewed actively assessed the role of antipsychotics on OCT abnormalities, and found no significant correlation with treatment. 61
The relationship between the severity of symptoms and retinal abnormalities is also unclear. Thinning of the RNFL, GCL and IPL have been found to significantly correlate with disease severity, measured by the Positive and Negative Symptom Scale (PANSS).72,127 Moreover, GCL and IPL volumes have been found to be lower in treatment refractory patients with schizophrenia compared to treatment responsive patients, 72 suggesting an inverse relationship with advanced disease. A more recent study observed that ONL and foveal photoreceptor thinning significantly correlated with the severity of negative symptoms, in addition to a significant inverse correlation with nasal parafoveal ONL thickness. 61 Smaller macular volume has also been related to higher severity of symptoms using the Schedules for the Assessment of Positive and Negative Symptoms (SAPS and SANS) scales.82,128 However, similar studies with respect to number of patients and age or gender-matched controls, have reported no significant correlation between RNFL thickness or macular thickness with severity measured by the Clinical Global Impression Scale-Severity (CGI-S) 129 and PANSS scores, respectively.74,79
Future possibilities in schizophrenia
Firstly, animal models representing negative symptoms are lacking. It has proven difficult to model schizophrenia in animals given that the disease impairs higher brain function resulting in human-specific symptoms such as delusions, hallucinations and disorganised speech. 130 Animal models in schizophrenia are few, and tend to focus on dopamine dysfunction driving pathophysiological changes.131,132 These have shown that retinal dopaminergic deficiency may lead to loss of a subset of retinal amacrine cells. 133 Treatments for negative and cognitive symptoms of schizophrenia are lacking, hence more work is needed to develop comprehensive models that will adequately reproduce the deficits created by these symptoms. Secondly, given the contentious nature of findings related to retinal thinning, macular thinning and macular volume deficits, larger studies that evaluate more detailed and comprehensive outcome measures are necessary. This would include higher resolution OCT scans adequate enough to visualise subtle abnormalities present in early schizophrenia. Chu and colleagues acknowledged lower resolution time-domain OCT (axial resolution 10 μm) as the main limitation of their study, whereas studies that offered better axial resolution of 5 μm yielded more significant macular thickness measurements.61,62,82 Thirdly, most schizophrenia patients in these studies were receiving antipsychotic medications at the time of data collection, therefore it was not possible to exclude the potential anti-inflammatory and neuroprotective effects of these medications that may have masked minor differences in RNFL between the different groups. 134 Finally, tobacco smoking is very common in schizophrenia and has been suggested to have a procognitive effect on positive symptoms, 135 although a recent study by Yokoyama and colleagues discovered an association between length of smoking and severe symptoms with reduced prefrontal volume on MRI. 136 Additionally, chronic tobacco smokers have been shown to have a thinner ganglion cell complex and choroid compared with age and sex-matched nonsmoking controls, suggesting that smoking may confound or modify the effect of the relationship between retinal thinning and schizophrenia (Table 2).136,137
Bipolar disorder
Bipolar disorder (BD), formerly known as manic depression, is an episodic, chronic psychiatric illness that can cause severe disability and declines in quality of life. 138 Patients with BD experience severe mood swings from intense highs (mania) to extreme lows (depression) that last for several weeks or months. An estimated 1% of the global population is affected by BD, 138 and it has been estimated that between 30% and 50% of patients with BD have been misdiagnosed with unipolar major depression because of initial presentation with a depressive episode, and may go on for years without a correct diagnosis.139–141 Delayed diagnosis, especially in children and adolescents,142,143 has been linked with poorer outcomes, including longer episodes and higher rates of recurrence.144–147 Structural brain abnormalities seen on MRI have been detected in patients as early as the first episode, with some changes progressing, including reduced grey matter in the hippocampus, temporal lobe and fusiform gyrus.148,149
RNFL changes in bipolar disorder
More recently, OCT has been used to correlate these changes in the retina. Multiple studies have demonstrated statistically significant global thinning of the pRNFL in patients (Table 1).83,84,86,150 Compared with healthy controls, statistically significant global RNFL thinning was observed in euthymic (current ‘normal’ mood) BD patients. 84 However, similar studies that age-matched controls have observed all but temporal thinning. 83 Conversely, using age and sex-matched controls led to the observation of all but nasal thinning.85,150 Studies that measured antipsychotic use did not find a correlation between prescribed medications and RNFL thinning, hence patients presented with significant RNFL thinning regardless of antipsychotic use.84,150 In addition, duration of illness has been shown to negatively correlate with RNFL thickness and GCC volume in euthymic and psychotic patients, suggesting a progressive neurodegenerative process.83,84
Multiple studies have observed lower IPL and GCL volume in BD patients,84,85,150 and a significant negative correlation between severity and duration of illness. 84 One study observed a significant compensatory thickening of the INL in the BD group, 150 contrary to previous BD studies, but similar to reported findings in Parkinson disease. 151 Therefore, the absence of more observations of total retinal thickness change in BD may be a result of masking of thinning by simultaneous thickening of other layers. 150 Newer, swept-source OCT able to image both the retina and choroid has been used to examine patients with BD, demonstrating significant thinning in the central macula, as well as in the inner temporal, nasal and inferior zones (Table 2). 86 However, no changes in choroidal thickness were observed.
ERG changes in bipolar disorder
Patients at high genetic risk for BD (n = 20) and schizophrenia (n = 9) (one parent with BD or schizophrenia) have demonstrated diminished rod b-wave amplitude and delayed latency compared with age and sex-matched healthy controls, but no statistical difference in cones. 152 A more recent and larger follow up study comparing high-risk children with age- and sex-matched healthy controls also observed diminished rod b-wave amplitude and delayed latency but also found delayed cone b-wave latency. 153 These results suggest that retinal rod response abnormalities may serve as a biomarker for the risk of developing BD.
Future possibilities in bipolar disorder
Few studies have assessed the structural and functional changes in the retina associated with BD directly. Growing evidence from OCT studies suggests neurodegeneration in BD can be characterized by RNFL, GCL and IPL thinning with increasing duration of disease.83–86 The pathophysiological changes that underpin these observations remain unclear, hence more research is needed to support these findings. A potential explanation could be that low retinal dopamine, as suggested by reduced b-wave amplitude, may play a part in hypo-arousal states (anhedonia, melancholia) as suggested in seasonal affective disorder (SAD).154,155 Still, small study size, chronic medication use and early age of onset are just a few of the barriers to establishing OCT, ERG and other similar measures as valid biomarkers to show degeneration and follow progression of BD and other psychiatric disorders.
Major depression
Major depression (MD) is a neuropsychiatric disorder that can affect individuals across a life span. MD is marked by anhedonia, low mood and cognitive disturbances. 156 According to WHO estimates, depression is the leading cause of disability worldwide. 157 It is estimated that over 322 million people suffer from depression, 4.4% of the world’s population. A number of risk factors have been identified, including female gender, high stress, family history, childhood experiences, personality traits and genetics.158–161 It has been observed that healthy patients who self-report visual impairment without visual acuity loss have almost double the odds of depression compared with visual acuity loss alone, after controlling for other risk factors. 162 This finding could either be due to changes in the brain–vision axis, or other psychological influences.
The role of neuroinflammation has recently been implicated in the aetiology of MD, as evidenced by activation of the immune system seen in depressed patients and the strong relationship observed between depression and autoimmune diseases.163–165 By one estimate, up to 50% of autoimmune patients exhibit impaired quality of life or depressive symptoms. 166 Moreover, increasing evidence has pointed to the importance of neuroinflammation in AD pathogenesis,167–170 and history of MD as a risk factor for AD.171–175 Likewise, MRI and postmortem studies have shown decreased grey matter volume and glial density in the prefrontal and cingulate cortices and decreased hippocampal volume in patients with depression, regions of the brain involved in the emotional and cognitive characteristics of depression.176–180 In MRI studies, decreased volumes in the prefrontal cortex, hippocampus and basal ganglia have been found bilaterally. 180 It is also important to note that the shape of the hippocampus has been found to be abnormal in MD patients without volume deficits through high-dimensional mapping. 181 Based on these findings, several studies have been conducted to investigate the relationship between these changes and functional and structural retinal changes related to MD.
ERG findings in major depression
ERG changes have been described in several studies of MD patients. The largest of these studies (n = 200) comparing the cone and rod ERGs between MD patients and healthy controls observed prolonged b-waves at the cone level and reduced rods/cone a-waves in medicated and unmedicated MD patients compared with controls, suggesting that these irregularities are not modifiable by medication. 182 In contrast, another smaller (n = 40) study assessing the response to duloxetine in MD patients and healthy controls found that treatment-responsive MD patients had significantly higher baseline rod b-wave amplitudes compared with nonresponders and healthy controls; however, no statistical difference between all groups was found at 12 weeks. 183 Their findings suggest that rod b-wave amplitude alterations could be state-dependent or potentially predict response to antidepressants in subtypes of depression.
Significant reductions in pattern electroretinogram (PERG) amplitude have been observed in MD patients compared with controls; unmedicated and medicated MD patients displayed significantly lower retinal contrast gain compared with controls. In addition, studies have found a strong correlation between contrast gain and depression severity. 184 In those patients who achieved remission, MD patients with low baseline contrast gains normalised on par with controls, whereas patients not achieving remission continued to show reduced RGC function, providing evidence that retinal contrast gains may be state-dependent and therefore useful as a prognostic biomarker. 185 Moreover, as mentioned previously and similar to BD, reduced b-wave amplitude may be indicative of low retinal dopamine, contributing to hypo-arousal as seen in SAD.154,155
Wide retinal venules
There is strong evidence from longitudinal studies that patients with MD are at increased risk of developing cardiovascular disease.186–192 In light of this risk, a large (n = 865) cross-sectional study based on the cohorts from the Brisbane Longitudinal Twin Study and the Twin Eye Study in Tasmania examined whether an association existed between depression and anxiety with retinal vessel calibre. In the adolescents and young adults who participated, depression and anxiety symptoms were associated with wider retinal venules, even after adjusting for other cardiovascular risk factors. 193
OCT in major depression
In vivo visualization of the retina via OCT in MD patients has been explored by several studies, with mixed findings (Table 1). Significantly reduced GCL, IPL and global and temporal superior RNFL thickness have been observed in recurrent MD patients compared with first episode patients, and in all MD patients compared with healthy controls. 194 However, most of the evidence comparing MD patients with healthy controls to date found no statistically significant difference in OCT measures although differences within MD groups were more profound (Table 1).87,88,195 Duration and severity of disease was observed to correlate negatively with GCL and IPL volumes and positively with global RNFL thickness; however, the evidence is weak for all measures possibly owing to the majority of MD patients taking psychotropic medication.87,194 Finally, the total retinal volume of the left eye has been shown to be greater than the right eye in MD patients, indicating a possible hemisphere-specific lateralisation of cognitive processing. 195 This idea has been compounded by positron emission tomography (PET) studies showing increased orbitofrontal and prefrontal activity in healthy volunteers during temporary states of sadness,196,197 with MD patients more often having altered left prefrontal functioning.198–201
Future possibilities in major depression
Compared with other diseases included in this review, there is a dearth of evidence defining the structural and functional changes in the retina in MD. More studies are required to confirm the presence or absence of retinal changes between MD patients and healthy controls, severity of symptoms, duration of illness, timing of depressive episodes, effect of antidepressant use and how they may relate to future neurodegeneration. The lack of differences between MD patients and controls seen in studies may be a real absence of effect, or alternatively due to small study numbers, insufficient resolution of OCT or other methodological issues. For example, retinal thickness has been found to fluctuate according to diurnal variations in healthy patients, yet no study reviewed here reported timing of examinations, which could explain the lack of difference seen between MD patients and the control group, if not standardized.202–205 As suggested by the monoamine deficiency hypothesis, the pathophysiology of MD may result from deficiencies in norepinephrine, serotonin and dopamine.206–208 Therefore, if retinal dopamine, released by amacrine cells in the INL, is diminished, subsequent input to retinal ganglion cells is reduced and could lead to atrophy in these layers as noted on OCT. 209 Therefore, OCT may be an important tool to track neurodegeneration in patients with MD, yet few studies have investigated its role longitudinally, possibly due to the statistically insignificant findings thus far. 194 Advancements in OCT imaging technology assure high-resolution images that will, in the future, allow any structural changes to be detected with greater sensitivity, in particular the GCL. 210
Conclusion
The studies reviewed propose that various changes in structure and function of the retina reflect changes in the brain and could thus serve as important biomarkers in psychiatric disorders. In schizophrenia, the hyper- and hypoactivity of NMDA glutamatergic receptor found at the fovea could potentially be associated with functional changes, but more studies are needed, observing retinal changes over time. It is well accepted that dopamine abnormalities, which also may be linked to positive and negative symptoms, impair visual function. Additionally, OCT has revealed retinal thinning and reduced macular volume and thickness in schizophrenia; however, it is unclear if these findings correlate with duration and severity of symptoms. Moreover, it is unknown how RNFL thinning relates to atrophy of specific regions of the brain in schizophrenia and MD. 78 In particular, if occipital atrophy does occur, knowing when it occurs in relation to RNFL thinning could help explain why some studies have found no difference in RNFL thickness between patients with schizophrenia and controls despite visual symptomology. 82 Lessons may be learned from a similar finding of absent retinal thinning with visual disturbances in anti-NMDA receptor encephalitis, pointing, instead, to potential dysfunction in the anterior and posterior visual pathways and thus demonstrating deeper cortical and subcortical processing impairments in the brain. 211 It also must be noted that the majority of studies reviewed reported exclusion of patients with concomitant ocular diseases; however, it is less clear whether diseases that could inevitably affect ocular structure and function, such as diabetes, were excluded or controlled for.
In BD, OCT has demonstrated pRNFL thinning, and lower IPL and GCL with increasing duration of disease, thus proposing a potential method to aid in early diagnosis of this disease. Moreover, ERG has allowed for observation of diminished rod b-wave amplitude and delayed cone b-wave latency in bipolar patients with high genetic risks. On the other hand, in major depression, prolonged b-waves at the cone level were found, suggesting that ERG could serve as a valuable tool to evaluate antidepressant response and differentiate between bipolar disorder and depression during diagnosis. Despite many structural and functional changes in the retina of patients with MD, there is a gap in understanding how these biomarkers can aid practice at the clinical level. In all these conditions, if a long-term biomarker (over decades) might be found in the retina, it is unlikely to replace functional and behavioural outcomes, as these are what are assumed to cause the disability in these psychiatric illnesses as opposed to poor vision. However, it may serve as a surrogate endpoint.
Major advances in retinal imaging in recent years, specifically with OCT, have enabled the discovery of these potential biomarkers. The results from these studies demonstrate how retinal biomarkers could help robust clinical diagnostic methods and the monitoring of disease progression. Since much of the existing research is limited by cross-sectional designs, further studies utilising more robust methods, such as cohorts, with large and sufficiently powered sample sizes are key to developing a more comprehensive understanding the relationship between OCT measures and psychiatric disorders and establishing retinal biomarkers that are reliable enough to diagnose psychiatric conditions early on, potentially predicting disease onset and severity before symptoms manifest.