
Abstract
Background:
The aim of this study was to identify modifiable risk factors associated with isolated impaired fasting glucose (IFG), isolate impaired glucose tolerance (IGT), or combined IFG-IGT in men and women aged 50 years and older.
Methods:
Cross-sectional analyses were performed in 703 men and women aged between 50 and 80 years old from NHANES (2007–2008). Outcome variables: IFG and IGT (ADA 2003), estimated body composition, cardiometabolic profile, and socio-demographic, dietary, and lifestyle factors.
Results:
First, 235 had normal glucose tolerance (men = 38.3%, women = 61.7%), 243 had IFG (men = 61.7%, women = 38.3%), 67 had IGT (men = 40.3%, women = 59.7%) and 158 had both conditions (men = 57.0%, women = 43.0%). The only common determinant of both IFG and IGT was triglyceride levels. High total fat mass index (FMI) and high total fat-free mass index (FFMI) were independently associated with IFG; while high C-reactive protein (CRP) levels were independently associated with IGT. Finally, combined IFG-IGT was associated with inadequate fiber intake, high FMI, FFMI, and CRP levels.
Conclusions:
Middle-age and older individuals presented different modifiable risk factors depending on whether they had IFG or IGT. IFG was associated with deteriorated body composition and lipids, whereas IGT was associated with deteriorated lipids and inflammatory factors. IFG-IGT, on the other hand, was associated with a larger number of risk factors, including worsen body composition, cardiometabolic and dietary factors. To prevent the transition to type 2 diabetes, specific clinical interventions targeting these risk factors should be considered.
Introduction
Prediabetes represents an intermediate state of glucose dysregulation that falls between normal glucose homeostasis and type 2 diabetes mellitus (T2D). We distinguish three states of prediabetes, characterized by isolated impaired fasting glucose (IFG), isolated impaired glucose tolerance (IGT), or a combination of both IFG and IGT (IFG-IGT).1,2
Studies suggest that both IFG and IGT are related to a state of insulin resistance and a dysregulation in insulin secretion. 3 However, others showed that the site of insulin resistance and insulin secretion differs between IFG and IGT.4,5 Although both have been associated with an increased risk of developing T2D,6,7 previous studies reported that IFG and IGT are two heterogeneous conditions. According to a few longitudinal studies ranging from 3 to 5 years, 25% of individuals with IFG or IGT eventually develop T2D, 50% remain in the same state, and 25% return to normal glucose tolerance (NGT).8–10 Hence, in order to prevent the transition to T2D, it appears important to better understand the various factors associated with each of these conditions.
Studies that investigated risk factors associated with hyperglycemia showed that there might be differential nonphysiological factors that could contribute to develop each of these conditions other than just pathophysiological abnormalities such as peripheral and hepatic insulin resistance and defective insulin secretion.3,11–13 Hence, although both IFG and IGT lead to T2D, their respective risk factors should be clearly distinguished to prevent and treat each condition more effectively. In this sense, it would be important to better understand the respective risk factors of IFG, IGT, or the combination of both with NGT individuals, including a vast array of physiological and lifestyle variables such as nutritional intake.
Therefore, because IFG, IGT, or combined IFG-IGT likely have different socio-demographic, cardiometabolic and lifestyle determinants, the present study aimed to identify and compare risk factors for each condition in a large cohort of men and women aged 50 years and older.
Research design and methods
This study was conducted using data from the National Health and Nutrition Examination Survey (NHANES) 2007–2008. NHANES uses a multistage, stratified, and weighted sampling design to recruit individuals representative of the US population. The information regarding the background and design can be found elsewhere. 14 In brief, NHANES procedures involved a household interview and a thorough health examination. Participants were asked questions about education level, health status, and lifestyle behaviors, including alcohol intake, smoking, and physical activities. Health examinations were performed in a Mobile Examination Center. All participants provided written and informed consent and the protocol was approved by the National Center for Health Statistics.
The initial study sample for the present study consisted of 5935 men and women aged 20–80 years old. From these, 3074 individuals were aged 50 years or older. We excluded individuals with diagnosed diabetes (self-reported), fasting plasma glucose ⩾7.0 mmol/l, 2-h plasma glucose ⩾11.1 mmol/l during the oral glucose tolerance test (OGTT), and missing data for fasting plasma glucose and 2-h plasma glucose during the OGTT. Consequently, 703 individuals (357 men and 346 women) were included in the present study.
Identification of IFG and IGT participants
The 2003 modified ADA criteria were used to determine participant’s glycemic status as follows 15 : isolated IFG: fasting plasma glucose between 5.6 and 7.0 mmol/l and 2-h plasma glucose <7.8 mmol/l; isolated IGT: fasting plasma glucose <7.0 mmol/l and 2-h plasma glucose between 7.8 and 11.1 mmol/l; IFG + IGT: fasting plasma glucose between 5.6 and 7.0 mmol/l and 2-h plasma glucose between 7.8 and 11.1 mmol/l; and NGT: fasting plasma glucose <5.6 mmol/l and 2-h plasma glucose <7.8 mmol/l.
Socio-demographic factors
Information was obtained about ethnicity (Mexican-American, non-Hispanic white, non-Hispanic black, and other race), marital status (married, widower, divorced, or single), highest grade or level of education completed (middle school, high school, and university) and total annual family income (Low: < US $25,000; mid–low: US $25,000–54,999; mid–high: US $55,000–99,999; and high: > US $100,000).
Dietary factors
Participants completed 24-h dietary recalls during an interview in the Mobile Examination Center, from which were estimated total daily energy intakes (kcal/day), nutrients, and other food components (proteins, carbohydrates, fibers, total fat, total saturated fat, cholesterol, and sodium).
Diet quality was determined as the attainment of US Department of Agriculture’s (UADA) recommendations for seven different macronutrients: proteins (10% to 35% of total calories), carbohydrates (40% to 45% of total calories), total fat (20% to 35% of total calories), saturated fat (<10% of total calories), cholesterol (<300 mg/day), fiber (>25 g/day for women, >30 g/day for men), and sodium (<2,400 mg/day). 16 A score of 1 was given for each component attaining the recommendation, and then summed to create a diet quality index ranging from 0 to 7. This strategy has been used previously. 17
Anthropometric and body composition measures
Body weight and height were measured to the nearest 0.1 kg and 0.1 cm, respectively, and body mass index (BMI) was then calculated [weight (kg)/height (m2)]. Waist circumference (WC) was measured to the nearest 0.1 cm at above the uppermost lateral border of the right ilium at minimal respiration. 14
Because dual-energy X-ray absorptiometry (DXA) were not available in this cohort, Janmahasation’s equations, 18 which were developed using DXA, were used to estimate fat-free mass for men [FFM = 9270 * weight (kg)/6680 + 216 * BMI] and women [FFM = 9270 * weight (kg)/8780 + 244 * BMI]. 18 Fat mass (FM) was afterwards calculated as body weight (kg) – FFM. Both equations provide a reliable estimation of FFM [r2 = 0.93, mean error = –0.77, root mean square error = 3.33 (approximately 6% of mean)].
Finally, FM index [FM index = FM (kg)/height (m2)] and FFM index [FFM index = FFM (kg)/height (m2)] were computed to adjust for body stature. 19
Lipid profile
Total-cholesterol, triglycerides (TG), high-density lipoprotein-cholesterol (HDL-Chol) and C-reactive protein (CRP) levels were measured after an overnight fast (min of 9 h). Blood samples were stored at −20°C, and shipped to Fairview Medical Center Laboratory at the University of Minnesota for analysis, based on the NHANES laboratory protocol. 14
Resting blood pressure
Resting systolic (SBP) and diastolic (DBP) blood pressure were measured using a mercury sphygmomanometer. 14 Participants were instructed to sit quietly for 5 min prior to measurements. Four measurements were recorded, and then the average value was used for SBP and DBP.
Glucose homeostasis
Blood samples were collected after a 9-h fasting, and used to measure fasting plasma glucose and serum insulin levels. A 2-h OGTT was also performed. After the initial venipuncture, participants were asked to drink a standardized dose (75 g of glucose) of TrutolTM and had a second venipuncture 2 h (± 15 min) later. Procedures for measuring glucose and insulin after fasting and during the 2-h OGTT were precisely described. 14
Metabolic syndrome
According to the harmonized definition, metabolic syndrome (MetS) was based on the presence of at least three of the following criteria: elevated waist circumference (>102 cm in men; >88 cm in women), hypertriglyceridemia (⩾1.69 mmol/l), low HDL-C (<1.30 mmol/l in women and <1.03 mmol/l in men), high resting blood pressure (⩾130/85 mm Hg or pharmacological treatment for hypertension), and elevated fasting plasma glucose levels (⩾5.6 mmol/l or pharmacological treatment for diabetes). 20
Statistical analysis
Continuous data are presented as mean ± SD, whereas categorical variables are presented as N and (%). One way ANOVAs were performed to identify differences for continuous variables among groups. Games-Howell and Bonferroni post hoc analyses were performed to identify groups differences. The choice of the Games-Howell test is supported by the difference in variance observed between groups. 21 The Bonferroni test was used to guarantee control of type I errors. Chi-square tests were also used to identify differences between groups for categorical variables.
Univariate multinomial logistic regressions were used to identify potential factors associated with IFG, IGT, or combined IFG-IGT. Then, we performed multiple multinomial logistic regressions to quantify the independent effect of variables with p value < 0.20 in the univariate multinomial logistic regression. Given the large number of variables used in these analyses, this step was necessary to avoid over adjustment by including an excessive number of variables. Finally, a multinomial logistic regression analysis, using a backward stepwise method, was performed to remove nonsignificant variables from the models. All analyses were performed using the SPSS 20 program for windows (IBM Corp, Armonk, NY, USA), with statistical significance set at p < 0.05.
Results
General characteristics of the study sample
Men (50.8%) and women (49.2%) were represented equally. Mean age was 65.3 ± 9.6 years (range 50–80 years), and mean BMI was 29.2 ± 6.2 kg/m2 (range 15.2–50.5 kg/m2). A majority of individuals were non-Hispanic Black (57.9%) and light drinkers (30.0%); 47.4% never smoked, 48.2% had a university degree, and 41.4% had MetS.
The cohort displayed a wide range of values for blood lipids (total cholesterol: 5.17 ± 1.12 mmol/l; triglycerides: 1.68 ± 1.41 mmol/l; LDL-chol: 3.02 ± 0.96 mmol/l; HDL-chol: 1.35 ± 0.41 mmol/l, and total cholesterol/HDL-chol ratio: 4.11 ± 1.48), glucose homeostasis (fasting insulin: 13.4 ± 12.9 μU/ml; fasting glucose: 6.61 ± 2.45 mmol/l) and resting systolic (133.6 ± 21.1 mm Hg) and diastolic (71.1 ± 12.1 mm Hg) blood pressure.
Socio-demographic factors
No significant difference between groups for ethnicity and education levels was observed (Table 1). Mean age was significantly higher in IGT and IFG-IGT compared with NGT and IFG (p ⩽ 0.05). The proportion of married men was significantly higher in IFG compared with the other groups (p ⩽ 0.05). Also, a higher prevalence of low annual household income was found in IGT individuals compared with the other groups (p < 0.05). On the other hand, univariate multinomial logistic regression analyses showed that ethnicity, age, and gender were potential risk factors associated with IFG, IGT, or IFG-IGT (p ⩽ 0.05) (data not shown).
Socio-demographic factors associated with IFG, IGT, or IFG-IGT.
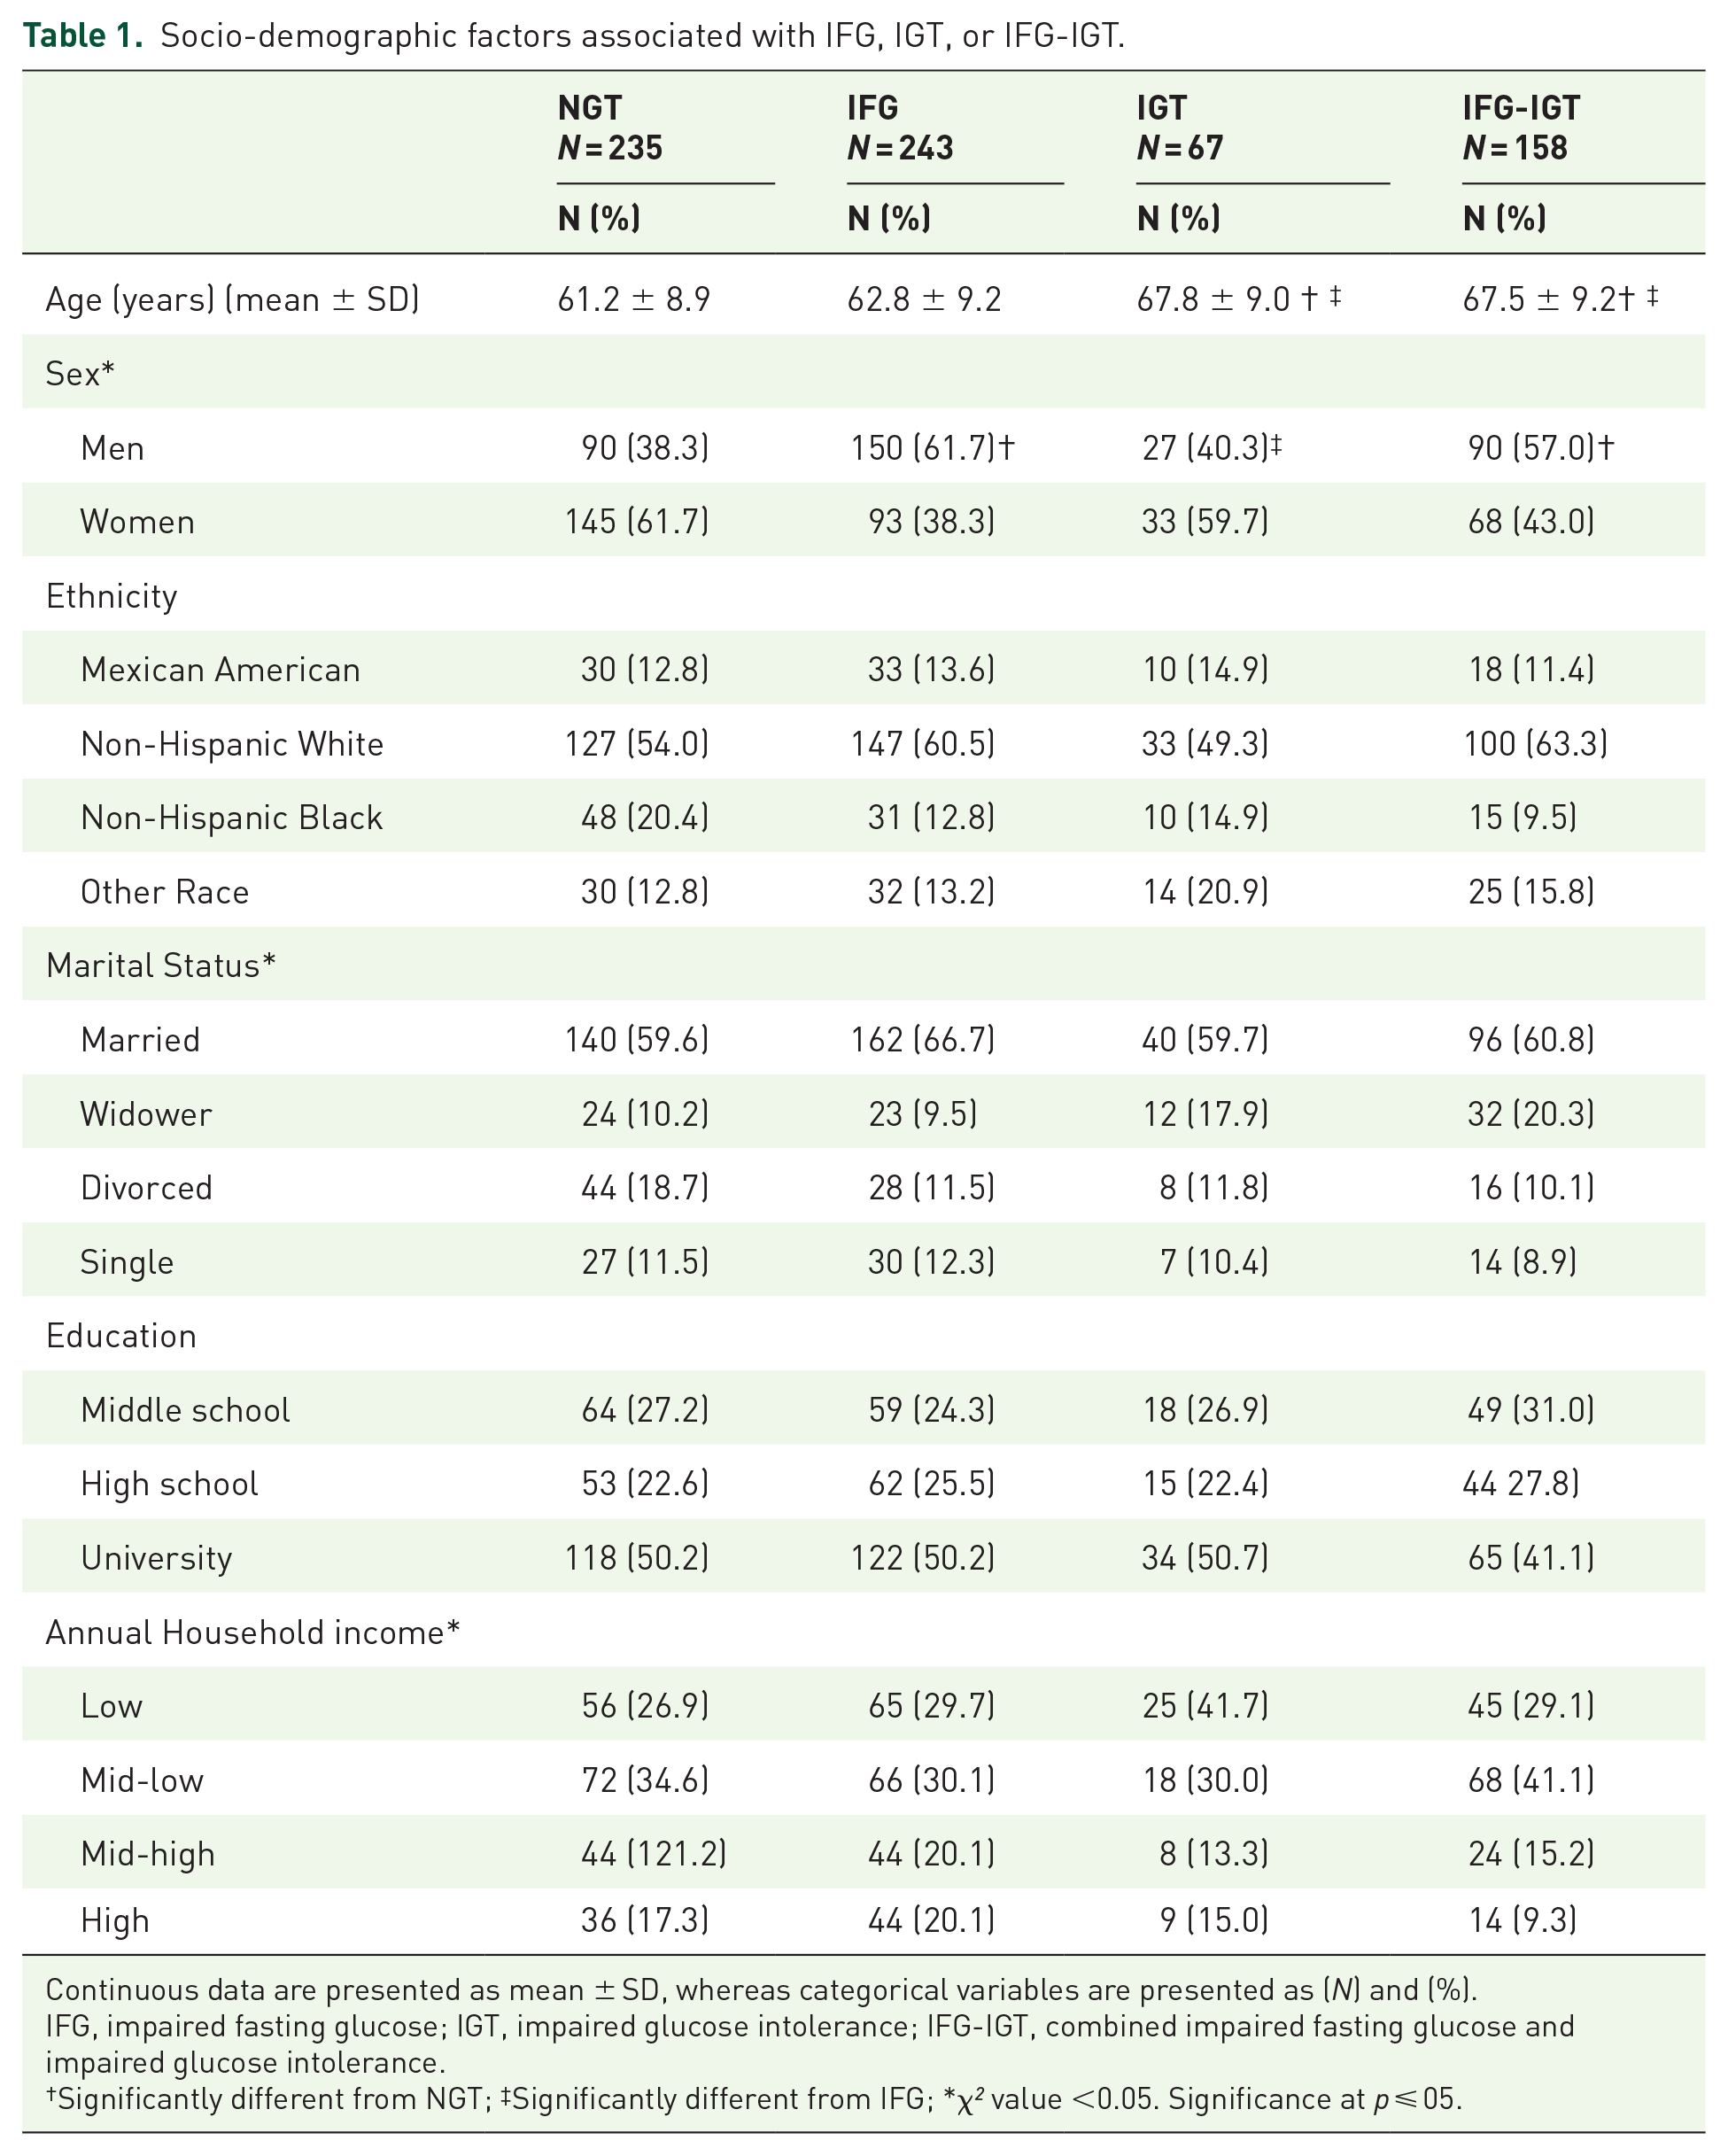
Continuous data are presented as mean ± SD, whereas categorical variables are presented as (N) and (%).
IFG, impaired fasting glucose; IGT, impaired glucose intolerance; IFG-IGT, combined impaired fasting glucose and impaired glucose intolerance.
Significantly different from NGT; ‡Significantly different from IFG; *χ² value <0.05. Significance at p ⩽ 05.
Diet quality
Compared with the others, the IFG group had higher value for total energy and sodium intake, and protein consumption (Table 2) (p < 0.05). Results of univariate multinomial regression analyses showed that only lower fiber intakes were a risk factor for IFG-IGT (data not shown).
Dietary factors associated with IFG, IGT, or IFG-IGT.

Continuous data are presented as mean ± SD.
IFG, impaired fasting glucose; IGT, impaired glucose intolerance; IFG-IGT, combined impaired fasting glucose and impaired glucose intolerance.
Significantly different from IFG, significance at p ⩽ 05.
Body composition and cardiometabolic profile
Overall, IFG and IGT showed an intermediate health profile between NGT and IFG-IGT groups (Table 3). As such, IFG-IGT individuals had higher body weight, BMI and waist circumference compared with NGT and IGT (p ⩽ 0.05). Both IFG and IFG-IGT groups had higher total FFM, FFM index, total FM, and FM index compared with NGT and IGT groups (p ⩽ 0.05). Compared with the NGT group, IFG-IGT individuals had a more atherogenic metabolic profile with higher values for triglycerides, total cholesterol/HDL-chol ratio, CRP and resting systolic blood pressure; and lower HDL-chol levels (p ⩽ 05). Also, a significant difference between IFG and NGT for HDL-chol was observed; while no significant difference between IGT and NGT groups for all cardiometabolic variables was found.
Body composition and cardiometabolic factors associated with IFG, IGT, or IFG-IGT groups.

Data are presented as means ± SD.
BMI, body mass index; FM, Fat mass; FFM, Fat free mass; Total FFM_index, Total fat free mass index; Total FM_index, Total fat mass index; CRP, C-reactive protein; IFG, impaired fasting glucose; IGT, impaired glucose intolerance; IFG-IGT, combined impaired fasting glucose and impaired glucose intolerance; HDL-chol, high-density lipoprotein-cholesterol.
Significantly different from NGT; ‡Significantly different from IFG; §Significantly different from IGT. Significance at p ⩽ 05.
Results from univariate multinomial regression analyses showed that higher body weight, BMI, waist circumference, FFM, FFM index, and FM increase the risk of having IFG and IFG-IGT (p ⩽ 0.05). For the cardiometabolic factors, the majority of variables were associated at a high risk of developing at least one of the three conditions. Higher triglyceride levels were found to increase the odds of having IFG and IFG-IGT. Total cholesterol/HDL-chol ratio, systolic blood pressure, and CRP levels were found to be associated with a higher risk of IFG-IGT. Finally, only CRP levels were associated with a high risk of IGT (p ⩽ 0.05) (data not shown).
Lifestyle habits
Contrary to our expectations, no difference was found between groups for the variables of interest (Figure 1).

Lifestyle Factors Associated with IFG, IGT, or IFG-IGT.
Multivariate multinomial logistic regression analysis with backward stepwise method to identify factors influencing glucose homeostasis status
Our results showed that male gender, high FM index, FFM index, and triglyceride levels remained significantly associated with IFG state (Table 4). Greater age, and high triglyceride and CRP levels were significantly associated with IGT state. Finally, being a man, advancing in age, Mexican-American, non-Hispanic white, fiber intake below recommendations, FM index, FFM index, and high CRP levels were significantly associated with combined IFG-IGT state.
Multivariate multinomial logistic regression analysis with backward stepwise method of factors associated with IFG, IGT, or IFG-IGT.
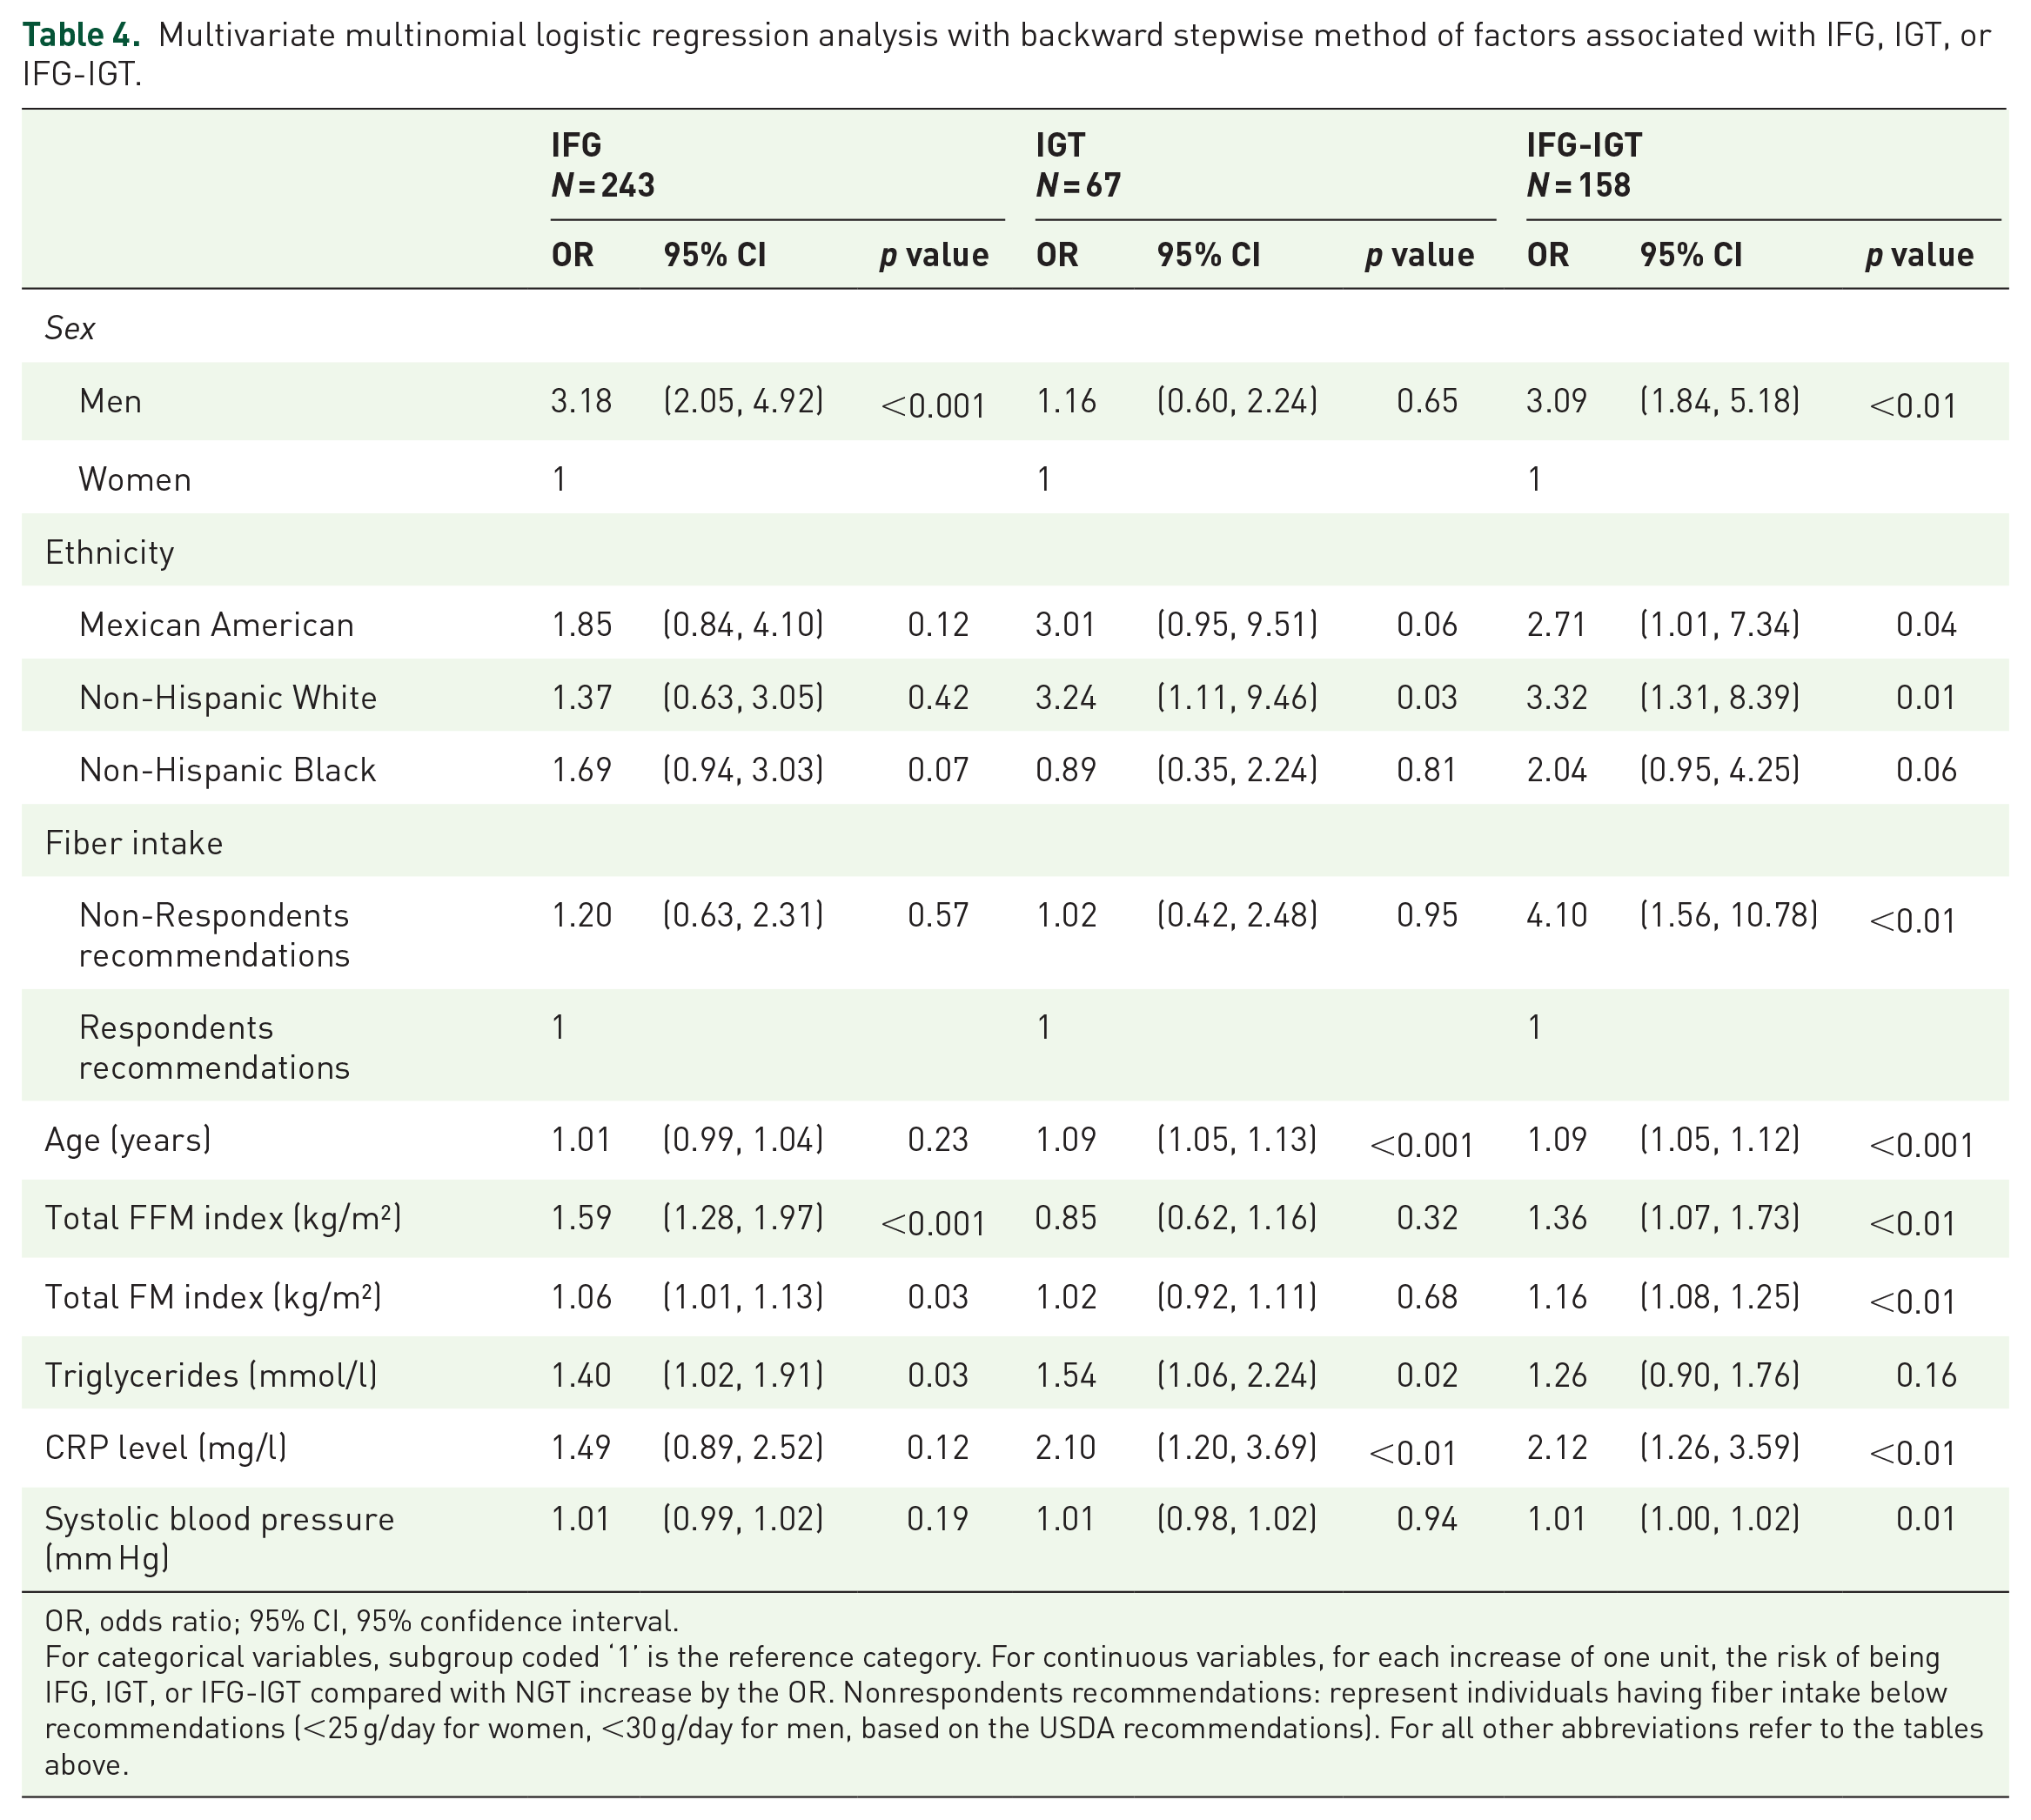
OR, odds ratio; 95% CI, 95% confidence interval.
For categorical variables, subgroup coded ‘1’ is the reference category. For continuous variables, for each increase of one unit, the risk of being IFG, IGT, or IFG-IGT compared with NGT increase by the OR. Nonrespondents recommendations: represent individuals having fiber intake below recommendations (<25 g/day for women, <30 g/day for men, based on the USDA recommendations). For all other abbreviations refer to the tables above.
Discussion
It has been proposed that IFG and IGT are two physiologically distinct conditions that manifest distinct metabolic abnormalities. 22 The present study is the first, to our knowledge, aimed at identifying distinctive modifiable risk factors, such as body composition, dietary, and lifestyle factors, associated with isolated IFG, isolated IGT, or combined IFG-IGT in men and women aged 50 years and older. Overall, we showed that IFG was associated with deteriorations in body composition and fasting lipid profile, whereas IGT was associated with more deteriorated fasting lipids and inflammatory factors. As expected, combined IFG-IGT was associated with a larger number of risk factors, including worsen body composition, cardiometabolic, and dietary factors. Finally, descriptive analyses showed that IFG, IGT, and IFG-IGT displayed different physical, metabolic, and sociodemographic characteristics. Although, IFG-IGT was the worst condition with higher values for BMI, fat mass, and lipids, it was IFG individuals who reported the greatest total daily energy, protein, and sodium intakes compared with other groups.
The negative association between FM and glucose homeostasis is well known. 23 Furthermore, it is well accepted that higher FFM is associated with greater glucose disposal and better glucose homeostasis.24,25 Nevertheless, results from the present study do not support this concept, as we rather observed the opposite. In fact, IFG and IFG-IGT groups displayed higher FFM (absolute and adjusted for height) compared with NGT and IGT groups. This important result is supported by previous findings by our group and others,19,26,27 although mechanisms that may explain this association are not well understood at this point. For example, Lebon and colleagues suggested that accumulations of intramuscular adipose tissue (particularly diacylglycerides and ceramides) and the reduced ability of muscles to oxidize lipids (which induces an alteration of the insulin signaling cascade in skeletal muscle) are negatively associated with insulin-stimulated glucose uptake. 28 Another possible hypothesis relates to the unfavorable ratio of type II to type I muscle fibers frequently observed in older individuals having larger muscle mass. 29 Indeed, aging is associated with a loss of muscle mass, particularly a loss of type II muscles fibers, which are recognized as glycolytic fibers. 29 Others have also suggested that high levels of interleukin 18 (a diabetogenic and pro-atherogenic cytokine strongly associated to muscle mass) might be involved in the glucose homeostasis deteriorations. 30 More mechanistic studies are obviously needed to elucidate this intriguing association.
Another interesting finding of the present study is that TG levels were the only common determinant of both IFG and IGT states. Although some studies showed that elevated TG is an independent risk factor for the development of IFG and T2D,31,32 Lin and colleagues showed that elevated TG levels (>150 mg/dl) were only moderately associated with the risk of IFG [HR = 1.46 (95% CI 1.28–1.65)]. 33 Compared with the results of Lin and colleagues, our results showed that elevated TG (>150 mg/dl) was significantly associated with both IFG [OR = 1.48 (95% CI 1.28–1.65)] and IGT [OR = 1.62 (95% CI 1.01, 2.60)] (data not shown). Mechanisms explaining this association are complex, and the direction of the relationship between TG and glucose metabolism abnormalities is not well understood. However, it has been shown that compensatory hyperinsulinemia associated with insulin resistance reduces lipolysis in adipose tissue as well as increases TG hepatic secretion, which results in increases of fatty acids in the circulation. 34
Contrary to IFG and IFG-IGT, which share similarities with regards to body composition and lipid variables, IGT and IFG-IGT rather share inflammation as a risk factor (CRP) such as previously reported. 35 There is no consensus, however, on pathophysiological mechanisms to explain this association. It has been suggested that visceral fat contributes to an excessive production of interleukin-6, then leading to an important release of CRP by the liver. 36 Others suggested that systemic inflammation, characterized by a high level of CRP and other inflammatory biomarkers, is a response to the chronic hyperglycemia state observed in IGT and IGT-IFG. 37 Altogether, this indicates that the direction of the relationship is not clear at this point.
Another important finding of the present study is that presenting both IGT and IFG significantly increases the risk of further metabolic complications compared with each condition individually. Our results showed that an inadequate fiber intake, based on USDA recommendations, increases the risk of IFG-IGT, which is in line with the well documented effects of fiber intake on glycemic control and prediabetes incidence.38,39 Finally, classic risk factors, such as sex, ethnicity, and aging were also associated with higher odds of having IFG, IGT, or IFG-IGT, which is in agreement with other studies.40–43
This study has some limitations. First, the cross-sectional nature of this study limits our ability to distinguish cause from effect. Second, available data does not allow to investigate mechanisms that could explain our observations. Third, the lack of dual-energy X-ray absorptiometry data and the use of prediction equations to estimate body composition, as well as the self-reported questionnaires to assess dietary and lifestyle habits could influence accuracy of some variables. Fourth, measures of visceral adiposity or energy expenditure would have been of great interest considering the aim of the study. Finally, characteristics of individuals considered for analyses may appear to be slightly different compared with those who were excluded, and, thus, not be fully representative of the US population. However, no statistical difference was found. Despite these limitations, to the best of our knowledge, the present study is the first aimed at identifying distinctive socio-demographic, body composition, dietary, lifestyle, physiologic, and metabolic factors associated with isolated IFG, isolated IGT or combined IFG-IGT in men and women aged 50 years and older.
Conclusion
The present study identified several different modifiable risk factors related to IFG, IGT, and IFG-IGT that could be targeted to prevent glucose homeostasis abnormalities and T2D. From a clinical standpoint, results of this study provide potential therapeutic avenues to personalize IFG, IGT, and IFG-IGT related interventions. Finally, middle-age and older men and women having IFG-IGT should benefit from a more extensive intervention targeting improvement of body composition and cardiometabolic profile.
Footnotes
Author contributions
AG contributed to the review of literature, database design, statistical analysis, interpretation of the data, and drafting of the manuscript. MB and ID contributed to the drafting and revision of the manuscript. All of the authors approved the final manuscript prior to submission and they are guarantors of this work and take responsibility for the integrity of the data and the accuracy of the data analysis.
Funding
The author(s) disclosed receipt of the following financial support for the research, authorship, and/or publication of this article: This work was supported by grant from the Canada Research Chair on Exercise Recommendations for a Healthy Aging.
Conflict of interest statement
The author(s) declared no potential conflicts of interest with respect to the research, authorship, and/or publication of this article.