
Abstract
Background:
Next-generation sequencing (NGS) offers a method for measurable residual disease (MRD) assessment by detecting leukemia-associated genetic mutations.
Objective:
This study aimed to evaluate the clinical implications and prognostic value of NGS-based MRD assessment in acute myeloid leukemia (AML).
Design:
Sixty-nine adult AML patients were included for NGS (targeted sequencing of AML-related 47 genes), of which 56 patients at initial diagnosis, 69 patients in the first day of consolidation therapy (C1D1), and 51 patients during 2-year MRD monitoring (detection following the C1D1) were enrolled.
Methods:
Mutation data were categorized into gene mutations, somatic mutations and somatic mutations excluding clonal hematopoiesis of indeterminate potential (CHIP) for analysis. The study also integrated multiparameter flow cytometry (MFC) and NGS data at C1D1 to evaluate the prognostic significance of combining the two MRD techniques.
Results:
Mutation detection rates were 98.21%, 69.57%, and 84.31% for AML patients at initial diagnosis, C1D1 stage, and MRD monitoring, respectively, identified by targeted sequencing. During MRD monitoring, the ETV6 mutation frequency was significantly higher in relapsed patients than in non-relapsed patients (p < 0.05). The mean variant allele frequency (VAF) was significantly higher in the 2-year MRD monitoring period (0.160 ± 0.155) compared to the C1D1 period (0.058 ± 0.087; p < 0.05) in relapsed patients. Survival analysis revealed that patients with a mean VAF (somatic mutations excluding CHIP) ⩽0.004 in the C1D1 stage and ⩽0.020 during MRD monitoring had a better prognosis. Furthermore, the combination of MFC and NGS-based MRD (somatic mutations excluding CHIP) at C1D1 stage showed that patients who were negative for two tests had longer survival than those who were negative for only one.
Conclusion:
The combined assessment of MFC-MRD and NGS-MRD status provides a refined prognostic stratification, with the absence of somatic mutations and MFC-MRD negativity correlating with improved progression-free survival, which is expected to improve clinical prognostic assessment of AML patients.
Introduction
Acute myeloid leukemia (AML) is a clinically aggressive hematological malignancy characterized by the uncontrolled proliferation of immature myeloid cells, which supplant normal hematopoiesis and leads to bone marrow failure. 1 The relapse following remission is a significant barrier to long-term survival of AML patients.2,3 In clinical practice, more accurate prognostic judgments could help doctors to identify relapsed risk and provide early intervention.
Measurable residual disease (MRD) refers to the presence of subclinical levels of leukemic cells that persist after therapy, below the detection limits of conventional methods such as morphology and cytogenetics.4,5 MRD assessment has emerged as a critical component in the management of AML, providing a sensitive and dynamic measure of treatment efficacy and a powerful prognostic indicator that is crucial for personalized medicine by informing therapy intensity, guiding intervention timing, and predicting relapse risk.4,6,7 Currently, several techniques are available for evaluating MRD in AML patients, each with its unique advantages and limitations. Multiparameter flow cytometry (MFC) is a widely used method that identifies aberrant antigen expression on AML cells, allowing real-time and rapid analysis.8,9 However, MFC is limited by its dependence on the expression of specific cell surface markers, which may not be present in all AML subtypes or may be modulated by therapy, leading to potential underestimation of MRD. 10 Reverse transcription polymerase chain reaction (RT-PCR) is another valuable tool, particularly for detecting known AML mutations like NPM1 and fusion genes.11,12 However, its reliance on specific mutations limits its applicability, and it is labor-intensive and technically demanding. 13 Digital PCR offers absolute quantification with high sensitivity, making it a promising technique for MRD detection. 14 Nonetheless, it is limited by fewer multiplexing capabilities and higher costs compared to conventional PCR methods. 15
The emergence of next-generation sequencing (NGS) has introduced a paradigm shift in MRD detection, providing a molecular method with high sensitivity and specificity.16,17 NGS allows for the identification of MRD at the DNA level, offering a comprehensive analysis of the genetic mutations associated with AML that include those not identifiable by MFC, and tracking their evolution over the course of treatment. 17 For example, NGS has been successfully used to monitor NPM1, RUNX1, and FLT3 mutations as well as chimeric gene fusions.7,18 In addition, the application of NGS has revealed the complexity of the leukemic clone and the dynamics of subclonal evolution, which may influence treatment response and disease progression.19,20 For example, a study revealed that a subclone of ASXL3 mutation presented (<1%) at diagnosis and was expanding (60%) at relapse in AML patients 21 ; in another study, paired sequencing of diagnostic and relapse samples from 23 AML patients to detect patterns of FLT3-ITD clonal evolution showed that rising internal tandem duplication (ITD) levels during serial biopsies were a harbinger of impending relapse, which further revealed clonal dynamics in FLT3-ITD-positive AML patients. 22 Notably, a study of MRD in adult patients with acute lymphoblastic leukemia showed that 46% of remission samples that were MRD-negative by MFC testing were MRD-positive by NGS testing, and that this group of patients remained at significant risk of relapse (5-year cumulative incidence of relapse: 39%), which suggested that the use of a highly sensitive (0.0001%) NGS assay for the early assessment of MRD could not only add clinically relevant MFC approach to the prognostic information but also to identify patients at risk of relapse. 23 However, the application of NGS as a standalone method or in combination with other techniques for MRD assessment in AML patients still need to be continually explored to improve prognostic accuracy and guide personalized treatment strategies.
In this study, we evaluated gene mutations in AML patients at different periods of initial diagnosis and MRD monitoring, and analyzed the correlation between patient prognosis and gene mutations at different periods. Finally, a prognostic assessment in AML patients is conducted utilizing both MFC and targeted sequencing of 47 genes, aims to enhance the understanding of disease dynamics and to improved patient stratification and clinical management in AML.
Patients and methods
Patient cohort
This project was approved by the Ethics Committee of the First Hospital of Harbin (Ethical approval No. 2016-001), and followed the rules of the Helsinki Declaration. A total of 69 AML patients from the First Hospital of Harbin between May 2018 and September 2022 were included and retrospectively analyzed in this study. Total patients were diagnosed with primary AML according to the World Health Organization classification criteria 24 and were 18 years of age or older at the time of diagnosis. Samples from patients who achieved complete remission (CR) or complete remission with incomplete hematologic recovery (CRi) following the induction chemotherapy were included in the MRD monitoring analysis for 2 years starting from consolidation therapy. General clinical information included sex, age, French-American-British (FAB) classification, white blood cells, red blood cells, platelets, hemoglobin, and bone marrow blasts were collected. Among total cases, the NGS data was successfully collected for 231 samples from three phases: 56 samples from initial diagnosis of 56 patients, 69 samples from first day of consolidation therapy (C1D1) of 69 patients, 106 samples collected within 2 years following the C1D1 (CT-2Y) of 51 patients (Figure 1).

Overview of sample collection timeline.
Targeted sequencing
Genomic DNA (gDNA) was used to generate the sequencing library by MultipSeq Custom Panel of 47 genes (ASXL1, BCOR, BCORL1, CALR, CBL, CCND2, CEBPA, CSF3R, CUX1, DDX41, DNMT3A, EP300, ETV6, EZH2, FLT3, GATA2, IDH1, IDH2, IKZF1, JAK2, KIT, KMT2A, KRAS, MECOM, MPL, NF1, NPM1, NRAS, PHF6, PTEN, PTPN11, RAD21, RUNX1, SETBP1, SF1, SF3B1, SH2B3, SMC1A, SMC3, SRSF2, STAG2, STAT3, TET2, TP53, U2AF1, WT1, ZRSR2) (Rightongene Biotechnology Co., Ltd., Shanghai, China) based on the manufacturer’s protocols. The library construction process was as follows: gDNA was amplificated by PCR using multiple primers, and the amplified products were combined and purified by Agencourt AMPure XP magnetic beads (Beckman, Brea, CA, USA); next, purified products were amplificated by PCR using adapter primers and purified by magnetic beads again; finally, the library concentration was recorded by Qubit dsDNA HS Assay Kit (Thermo, Waltham, MA, USA), and the length and purity of the library fragment were measured by Qsep100 automated nucleic acid protein analysis system. The sequencing was performed on the NovaSeq (Illumina, San Diego, USA) sequencing platform.
Bioinformatic analysis
The original sequencing was consistent with the human reference genome GRCh37. Single nucleotide variants (SNVs) as well as insertions and deletions (Indels) were screened by Shanghai Rightongene Biotechnology Co., Ltd. based on the following criteria: (1) SNVs or Indels with a mutation allele frequency <0.001 in databases of 1000 genomes project, Exome Aggregation Consortium (ExAC) all or ExAC East Asian and Genome Aggregation Database (gnomAD) were retained; (2) SNVs or Indels with a variant allele frequency (VAF) ⩾1% was retained (VAF of noninitial diagnostic samples of ⩾0.1%); (3) SNVs or Indels including stopgain, stoploss, frameshift, nonframeshift, and splicing sites were retained. In addition, according to retrospective sample data, we defined variants with ⩽40% VAF ⩽60% or VAF ⩾90% and less than 5% VAF change on two or more consecutive detections with more than 1-month interval as germline mutations; and variants with a VAF change of less than 3% across two or more consecutive detections spaced more than 1 month apart and the VAF consistently ⩾2% as clonal hematopoiesis of indeterminate potential (CHIP). Data of CT-2Y period from the same patient were merged. Then, data were analyzed in terms of number of patients.
MFC analysis
MFC testing was performed according to the recommended method. 4 The percentage of residual disease was defined as the number of leukemia-associated immunophenotypic cells in the total white blood cell compartment. The threshold between residual disease and no residual disease was determined to be 0.1% according to flow cytometry.
Statistical analysis
The statistical analysis was performed using OriginPro 9.8 software (OriginLab Corporation, Northampton, USA). Survival estimates were calculated using the Kaplan–Meier curves with log-rank test. Overall survival (OS) was calculated from date of diagnosis to date of death resulting from any cause; progression-free survival (PFS) was calculated from date of diagnosis to date of progression, relapse, or death resulting from any cause. The differences in clinical characteristics and gene mutation frequencies among patients were evaluated using Chi-square test or Fisher’s exact test, as appropriate. p < 0.05 was considered to indicate a statistically significant difference.
Results
Clinical characteristics of AML patients at diagnosis and C1D1
In this study, 56 of the 69 AML patients had the available targeted sequencing data at diagnosis (Figure 1), and their clinical characteristics are shown in Table 1. The male to female ratio of patients in the diagnostic period was 1:1.1 (27/29). The age ranged from 29 to 84 years, of which the median age was 50.5 years. The 3-year survival rate in the relapse cohort was 32.5%, and no mortality was counted in the non-relapse cohort. No significant difference was found in the initial clinical characteristics between relapsed and non-relapsed patients (relapsed vs non-relapsed, p > 0.05). In addition, the study compared the clinical characteristics of 69 patients in C1D1 by dividing into MFC-negative and positive subgroups (Table 2). The results showed that MFC-negative patients had significantly higher red blood cells and platelets than MFC-positive patients (positive vs negative, p < 0.05). Among MFC-positive patients, 58.8% (10/17) of patients experienced relapses; among MFC-negative patients, 26.9% (14/52) of patients experienced relapses, although the proportion of relapses was lower (positive vs negative, p = 0.001).
Clinical characteristics of AML patients at diagnosis.

AML, acute myeloid leukemia; FAB, French-American-British.
Clinical characteristics of AML patients on the first day of consolidation therapy.

AML, acute myeloid leukemia; C1D1, first day of consolidation therapy; MFC, multiparameter flow cytometry.
Gene mutation landscape of AML patients at different stages
We analyzed the mutation frequency and VAF value of genes in AML patients at three stages: diagnosis, C1D1, and CT-2Y, respectively. The results showed that 98.21% (55/56) of the patients at diagnosis had mutations, among which FLT3-ITD (27%, 15/56), FLT3-nonITD (21%, 12/56), NPM1 (20%, 11/56), and NRAS (20%, 11/56) were the top three most common mutation genes (Figure 2(a)). Mutations were found in 69.57% (48/69) of patients in the C1D1 stage, of which the top three genes with the higher frequencies of mutations were DNMT3A (16%, 11/69), BCORL1 (10%, 7/69), and TET2 (10%, 7/69; Figure 2(a)). Meanwhile, 84.31% (43/51) of patients in CT-2Y stage had gene mutations, of which the top three genes were DNMT3A (22%, 11/51), ASXL1 (14%, 7/51), and TP53 (12%, 6/51; Figure 2(a)). In addition, compared with the diagnostic period, the mutation frequencies of FLT3 (ITD and non-ITD), NRAS, KRAS, BCOR, PTPN11, and RAD21 genes were lower in the C1D1 and CT-2Y periods, and there was a significant difference in mutation frequencies among the three periods (diagnosis vs C1D1 vs CT-2Y, p < 0.05; Figure 2(b)), implying that these mutations may have an impact on the disease progression of patients.
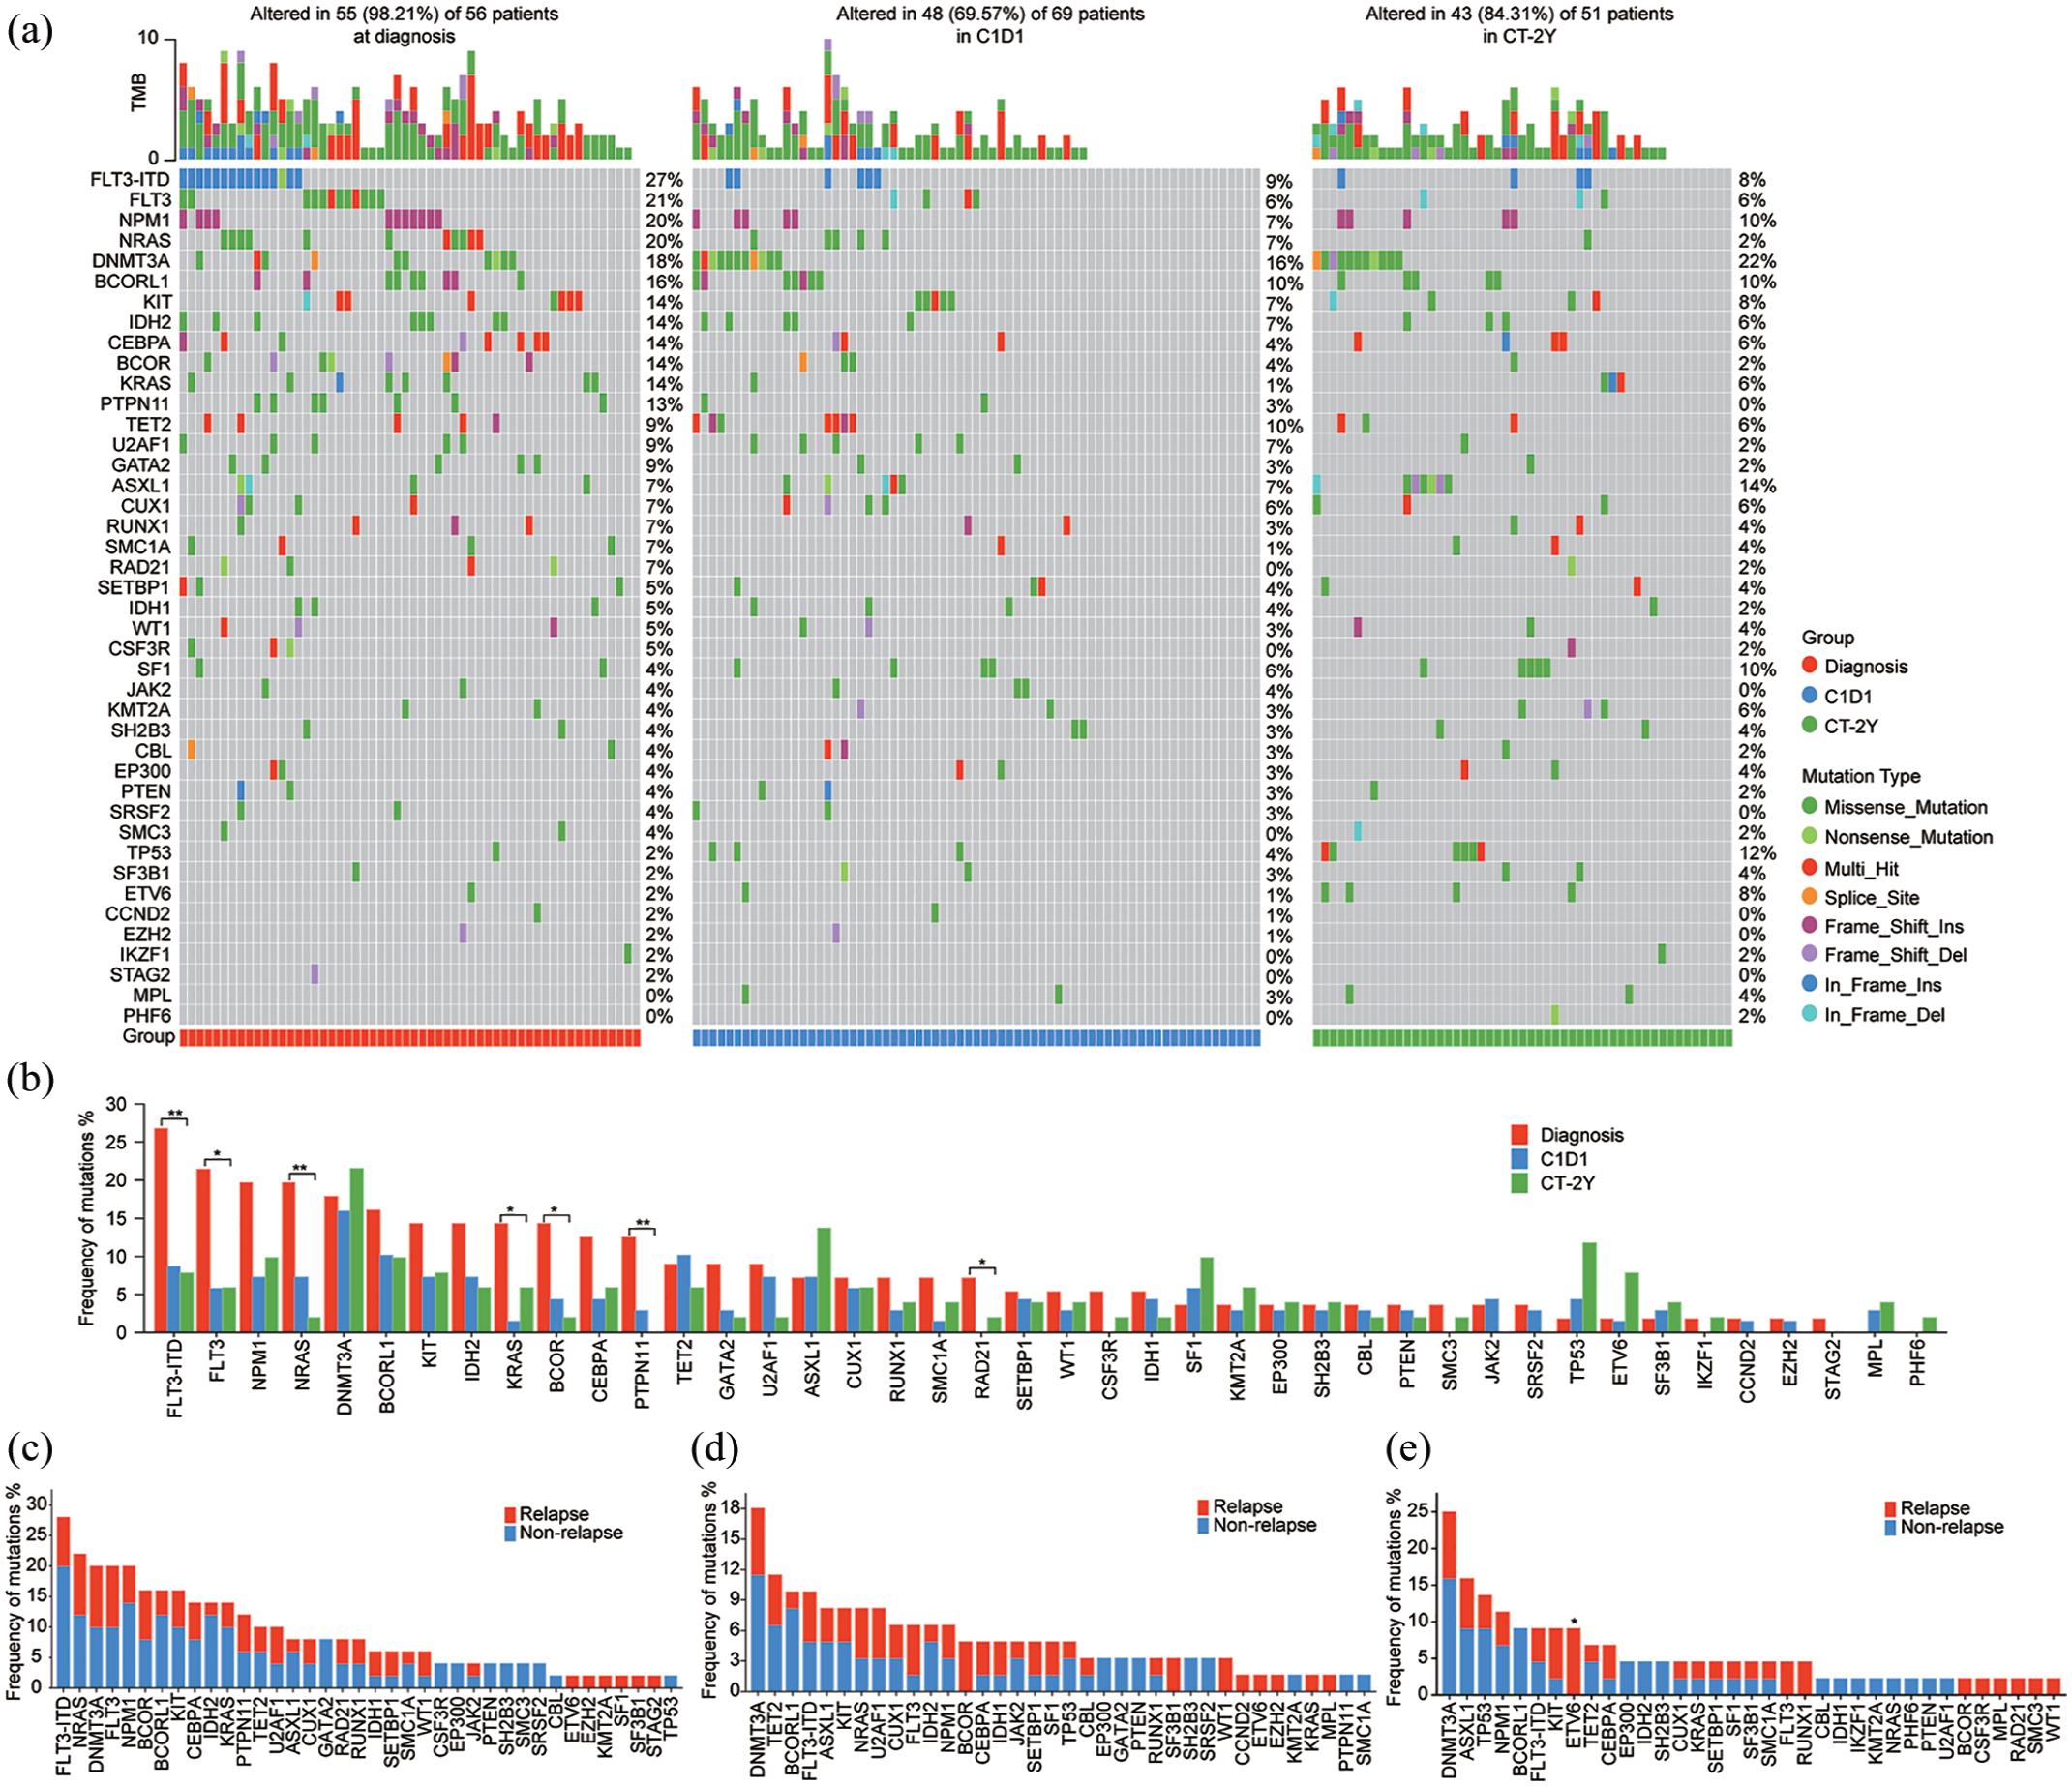
Overview of gene mutations. (a) Summary of gene mutations at different times (diagnosis n = 56, C1D1 n = 69, CT-2Y n = 106); (b) Frequency of gene mutations at different times; (c) Frequency of gene mutations at the initial diagnosis grouped by relapse (n = 50); (d) Frequency of gene mutations in C1D1 phase grouped by relapse (n = 61); (e) Frequency of gene mutations during CT-2Y grouped by relapse (n = 103).
Correlation analysis of gene mutations in relapsed and non-relapsed patients
Excluding patients undergoing hematopoietic stem cell transplantation, the remaining patients were divided into relapsed and non-relapsed subgroups for analyzing the role of these mutations in prognosis. No statistical difference in mutation frequency was found between relapsed and non-relapsed subgroups in the diagnostic or C1D1 stage (Figure 2(c) and (d)), but during CT-2Y period, ETV6 mutation frequency was significantly higher in relapsed patients than in non-relapsed patients (relapse vs non-relapse, p < 0.05; Figure 2(e)). Further, no significant difference in mean VAF between relapsed and non-relapsed patients at different stages was observed with counting VAF of gene mutations (Figures 3(a) and S1(A)); however, when counting VAF of somatic mutations, there was a significant difference between the relapsed and non-relapsed subgroups in the CT-2Y period (Figures 3(b) and S1(B)); then, the p values were all down-regulated by counting VAF of somatic mutations excluding CHIP (Figures 3(c) and S1(C)). As such, the analysis of somatic mutations excluding CHIP might have a potential implication in judging the prognosis of the patients.

General overview of mean VAF in AML patients. (a) VAF from gene mutations; (b) VAF from somatic mutations; (c) VAF from somatic mutations except potential CHIP; (d) VAF changes in somatic mutations excluding potential CHIP; (e) VAF from somatic mutations except potential CHIP in relapsed patients; (f) VAF from somatic mutations except potential CHIP in patients without relapse; (g) VAF changes in somatic mutations excluding potential CHIP from initial diagnosis to C1D1 stage; (h) VAF changes in somatic mutations excluding potential CHIP from C1D1 stage to CT-2Y stage.
All patients had a significant decrease in mean VAF from the initial diagnosis to the C1D1 period (diagnosis vs C1D1, p < 0.001; Figure 3(e) and (f)), but there was no significant difference in the change value of VAF between the relapsed and non-relapsed groups (relapse vs non-relapse, p > 0.05; Figures 3(g) and S1(F) and (G)). For relapse patients, the mean VAF in CT-2Y period was significantly higher than those in C1D1 period (C1D1 vs CT-2Y, p = 0.006), whereas in non-relapse patients, the mean VAF did not change significantly in the two periods (C1D1 vs CT-2Y, p = 0.664; Figures 3(d)–(f) and S1(D) and (E)). And the change in mean VAF from the C1D1 to CT-2Y period for relapse patients was +0.123 ± 0.143, compared with only +0.008 ± 0.079 for non-relapsed patients, showing a significant difference between the two groups (relapse vs non-relapse, p = 0.002; Figures 3(h) and S1(H) and (I)). These suggested that monitoring subsequent VAF changes with VAF of C1D1 period as a baseline might be useful in predicting the disease progression.
Subsequently, we also analyzed the VAF changes of different genes. For all patients, the VAF of most genes showed a decreasing trend from diagnosis to C1D1 period (Figures 4(a) and S2). For relapsed patients, the VAF of ASXL1, CEBPA, CSF3R, DNMT3A, ETV6, KIT, KRAS, NPM1, RAD21, RUNX1, TET2, and WT1 mutations was obviously elevated from C1D1 to CT-2Y period (Figures 4(b) and S3). Moreover, we longitudinally investigated mutations in relapse patients who had data from three testing periods and a greater than 0.2 change in VAF from C1D1 to CT-2Y period. For patient AML-7, NPM1 p.L258fs, TET2 p.L1965fs, and TET2 p.Q1664X mutations were detected at initial diagnosis (mean VAF = 0.413); after induction therapy, the mean VAF decreased to 0.05, but during MRD monitoring, TET2 p.L1965fs and TET2 p.Q1664X were occurred again, as well as the NPM1 p.L287fs and RUNX1 p.R471G were occurred for the first time (mean VAF = 0.254; Figure 4(c)). For patient AML-16, mutations of CEBPA p.K313dup and p.Q83fs were detected at initial diagnosis (mean VAF = 0.434); after induction therapy, the VAF of all these mutations decreased to 0, but they were occurred again (mean VAF = 0.299) during the CT-2Y period (Figure 4(d)). These findings highlighted that focusing on somatic mutations from the C1D1 to CT-2Y period, especially recurrence of mutant sites at initial diagnosis, could help to infer patient prognosis.

The VAF of somatic mutations excluding potential CHIP of AML patients detected from diagnosis to CT-2Y. (a) Changes in VAF from initial diagnosis to C1D1 stage; (b) Changes in VAF from C1D1 stage to CT-2Y stage; (c) Patient AML-7 was a female, 58 years old, with a relapse at 24 months of follow-up; (d) Patient AML-16 was a male, 34 years old, with a relapse at 17 months of follow-up.
Correlation analysis between survival and mutation VAF of different periods
The study correlated survival data with changes of VAF in patients at different stages to find the potential optimal cut-off value. The results showed that no optimal cut-off values were found to be significant at the initial diagnostic stage (Figures 5(a) and S4(A) and (B)). In the C1D1 stage, the mean VAF (somatic mutations excluding CHIP) ⩽0.004 was more favorable to the prognosis of the patients (Figure 5(b), other VAF in Figure S4(C) and (D)). Similarly, during the CT-2Y period, patients with a mean VAF (somatic mutations excluding CHIP) ⩽0.020 exhibited a better prognosis (Figure 5(c), other VAF in Figure S4(E) and (F)). In addition, the findings demonstrated that when using the VAF from the C1D1 period as the baseline, patients with a VAF increase (somatic mutations excluding CHIP) of ⩽0.018 during the CT-2Y period exhibited a favorable prognosis (Figure 5(d) and (e), other VAF in Figure S4(G)–(J)). Conversely, patients with a VAF increase of >0.012 within the first year following the C1D1 period were more prone to relapse (Figure S5). Collectively, monitoring the VAF values and their changes among the C1D1 and CT-2Y phases might be instructive in survival prediction.

Correlation analysis between prognosis and VAF of somatic mutations excluding potential CHIP. (a) Effect on prognosis by VAF at initial diagnosis; (b) Effect on prognosis by VAF in C1D1 stage; (c) Effect on prognosis by VAF during CT-2Y stage; (d) Effect to prognosis by VAF changing from initial diagnosis to C1D1 stage; (e) Effect to prognosis by VAF changing from C1D1 stage to CT-2Y stage.
Combined application of MFC and NGS at the C1D1 stage for predicting prognosis in AML patients
According to the above findings, focusing on targeted sequencing results (somatic mutations excluding CHIP) in C1D1 stage was important for prognostic judgment of patients (Figures 6(a) and (b) and S4(K)). However, the sensitivity and specificity of relapse prediction by results of somatic mutations excluding CHIP were 58.3% and 56.8%, respectively (Table S1). In addition, although the survival of MFC-negative patients with C1D1 stage was significantly longer than that of positive patients (p < 0.01; Figure 6(c)), the sensitivity of independent MFC for predicting relapse was only 41.7% (specificity 81.1%; Table S1). Therefore, the study combined the two detection techniques in the expectation of proposing a more optimal tool for prognostic judgment. The results showed that in C1D1 stage, the combination detection of MFC and somatic mutations excluding CHIP had a sensitivity and specificity of 62.5% and 54.1%, respectively, for inferring relapse in patients (Table S1). More importantly, the patients who were negative for both MFC and somatic mutations excluding CHIP in C1D1 stage had longer PFS and OS than those with positive results (MFC−NGS− vs MFC+NGS+, p < 0.05; Figure 6(d)–(f)). In summary, combining non-CHIP somatic mutation status and MFC results might better differentiate the prognostic classification of AML patients.

General overview of prognostic survival curves. (a) Survival curve with gene mutations as NGS-positive; (b) Survival curves with somatic mutations except potential CHIP as NGS-positive; (c) Survival curves classified by MFC; (d–f) Survival curve classified by MFC and NGS ((d) gene mutations as NGS-positive; (e) somatic mutations as NGS-positive; (f) somatic mutations other than potential CHIP as NGS-positive).
Discussion
The quest for precision in oncology has led to significant advancements in the management of AML, with MRD assessment emerging as a cornerstone in prognostication and therapeutic decision-making. 25 In this study, mutation frequency and VAF changes in AML patients were investigated by targeted sequencing of 47 genes and assessed during three periods of initial diagnosis, C1D1 and CT-2Y, and the prognostic status of patients was also evaluated using a combination of MFC and NGS. Our findings provide a comprehensive analysis of clinical and molecular genetic factors associated with AML, offering insights into the complex interactions between gene mutations and clinical outcomes.
Our results highlight the significance of FLT3-ITD, FLT3-nonITD, NPM1, and NRAS mutations at the time of diagnosis, which are consistent with previous findings that these mutations are among the most prevalent in AML. 26 The mutational landscape shifts during the course of the disease, with DNMT3A, BCORL1, and TET2 mutations emerging as predominant in the C1D1 stage, and DNMT3A, ASXL1, and TP53 mutations in the CT-2Y stage. In fact, DNMT3A mutations have been demonstrated to be early events in leukemogenesis and were considered strong prognostic markers, with certain mutations predicting a higher risk of relapse.6,27 These dynamic patterns of mutations suggest that disease progression in AML is associated with changes in the genomic landscape, which may be indicative of disease evolution and potential therapeutic targets.
ETV6 gene plays an important role in hematopoietic and hematologic malignancies.28,29 Zhang et al. have reported an association between heterozygous germline ETV6 mutations and hematologic malignancies in three families, and showed that the three amino acid sites (p.R369Q, p.R399C, and p.P214L) correspond to the hotspots of recurrent somatic mutations in malignant tumors. 30 ETV6 mutations were frequently observed in cancers, but more work was needed to help definitively distinguish disease-associated alleles from harmless polymorphisms or passenger mutations.31,32 In this study, we found that relapsed patients had a higher ETV6 mutation frequency during CT-2Y period compared to non-relapsed patients, and for relapsed patients carrying somatic ETV6 mutations, the VAF of ETV6 was increased in the CT-2Y stage. This suggests that the monitoring of ETV6 mutations could be a potential predictor of relapse.
Furthermore, the misclassification of germline variants as somatic events could lead to false-positive MRD assessments, potentially resulting in overtreatment and unnecessary clinical interventions.33,34 Meanwhile, it has been reported that detection of persistent mutations such as DNMT3A, TET2, and ASXL1, which were typically present in patients with clonal hematopoiesis, did not correlate with an increased relapse rate; the presence of MRD detected after exclusion of these mutations was associated with a significantly higher relapse rate. 6 In this study, the correlation analysis between gene mutations and survival data revealed that mean VAF of somatic mutations excluding CHIP was associated with prognosis, with lower VAF values correlating with better outcomes. This is in line with studies showing that the burden of mutant alleles can impact treatment response and survival in AML patients.35,36 Interestingly, the change in mean VAF from the C1D1 to CT-2Y period was significant for relapsed patients but not for non-relapsed patients, indicating that monitoring VAF changes over time may be a useful strategy for predicting disease progression.
On the other hand, the independent prognostic value of MFC and NGS was well known. For example, Terwijn et al. demonstrated that MFC detection after the induction treatment had a high prognostic impact in AML patients, with those positive for MFC having significantly shorter relapse-free survival and OS compared to those who were MFC-negative. 37 Ravandi et al. found that persistence of MRD as detected by MFC was highly prognostic in younger AML patients, emphasizing its utility in risk stratification. 38 Grob et al. showed that molecular MRD detection (FLT3-ITD) by NGS had significant independent prognostic value for relapse and survival rates in AML patients. 39 Their multivariate analysis confirmed that FLT3-ITD MRD detection during CR serves as an independent prognostic factor for both relapse and survival, showing superiority over most established clinical and molecular prognostic markers. 39 Additionally, Li et al. demonstrated that NGS can detect MRD with high sensitivity and specificity in AML patients. 40 Using a customized 42-gene panel with a detection limit of 0.0024% VAF, they monitored somatic mutations identified at diagnosis in post-treatment samples. Their study revealed that patients with persistent MRD positivity after induction chemotherapy exhibited significantly shorter OS and time to relapse compared to MRD-negative patients. Notably, 45% of patients who achieved CR via traditional non-molecular methods still had detectable MRD through NGS, underscoring its superior analytical sensitivity and clinical relevance as a prognostic biomarker for predicting long-term outcomes. 40 In our study, a 47-gene panel was used for analysis, and the results indicated that patients with a VAF increase of >0.018 within 2 years after induction therapy exhibited a poorer prognosis. More importantly, our study highlighted the importance of integrating MFC and NGS for MRD detection, underscoring the value of multimodal MRD assessment in AML. The combined application of MFC and NGS in the C1D1 stage showed potential for improving prognostic accuracy. Patients who were negative for both MFC and somatic mutations excluding CHIP had longer PFS and OS, suggesting that this combined approach may enhance our ability to risk-stratify AML patients and inform treatment decisions.
Conclusion
The current study underscored the potential of targeted sequencing (somatic mutations excluding CHIP) to enhance MRD assessment in AML, offering a detection tool of residual disease. The integration of NGS with MFC may provide a more comprehensive evaluation of MRD, improving prognostic accuracy and informing personalized treatment strategies. Future research should focus on validating these findings in larger, prospective studies and on the development of standardized methodologies for NGS-based MRD assessment.
Supplemental Material
sj-docx-1-tah-10.1177_20406207251349261 – Supplemental material for The clinical utility and prognostic value of next-generation sequencing for measurable residual disease assessment in acute myeloid leukemia
Supplemental material, sj-docx-1-tah-10.1177_20406207251349261 for The clinical utility and prognostic value of next-generation sequencing for measurable residual disease assessment in acute myeloid leukemia by Yu Liu, Huanchen Cheng, Meng Sun, Tiejun Gong and Jun Ma in Therapeutic Advances in Hematology
Supplemental Material
sj-tif-2-tah-10.1177_20406207251349261 – Supplemental material for The clinical utility and prognostic value of next-generation sequencing for measurable residual disease assessment in acute myeloid leukemia
Supplemental material, sj-tif-2-tah-10.1177_20406207251349261 for The clinical utility and prognostic value of next-generation sequencing for measurable residual disease assessment in acute myeloid leukemia by Yu Liu, Huanchen Cheng, Meng Sun, Tiejun Gong and Jun Ma in Therapeutic Advances in Hematology
Supplemental Material
sj-tif-3-tah-10.1177_20406207251349261 – Supplemental material for The clinical utility and prognostic value of next-generation sequencing for measurable residual disease assessment in acute myeloid leukemia
Supplemental material, sj-tif-3-tah-10.1177_20406207251349261 for The clinical utility and prognostic value of next-generation sequencing for measurable residual disease assessment in acute myeloid leukemia by Yu Liu, Huanchen Cheng, Meng Sun, Tiejun Gong and Jun Ma in Therapeutic Advances in Hematology
Supplemental Material
sj-tif-4-tah-10.1177_20406207251349261 – Supplemental material for The clinical utility and prognostic value of next-generation sequencing for measurable residual disease assessment in acute myeloid leukemia
Supplemental material, sj-tif-4-tah-10.1177_20406207251349261 for The clinical utility and prognostic value of next-generation sequencing for measurable residual disease assessment in acute myeloid leukemia by Yu Liu, Huanchen Cheng, Meng Sun, Tiejun Gong and Jun Ma in Therapeutic Advances in Hematology
Supplemental Material
sj-tif-5-tah-10.1177_20406207251349261 – Supplemental material for The clinical utility and prognostic value of next-generation sequencing for measurable residual disease assessment in acute myeloid leukemia
Supplemental material, sj-tif-5-tah-10.1177_20406207251349261 for The clinical utility and prognostic value of next-generation sequencing for measurable residual disease assessment in acute myeloid leukemia by Yu Liu, Huanchen Cheng, Meng Sun, Tiejun Gong and Jun Ma in Therapeutic Advances in Hematology
Supplemental Material
sj-tif-6-tah-10.1177_20406207251349261 – Supplemental material for The clinical utility and prognostic value of next-generation sequencing for measurable residual disease assessment in acute myeloid leukemia
Supplemental material, sj-tif-6-tah-10.1177_20406207251349261 for The clinical utility and prognostic value of next-generation sequencing for measurable residual disease assessment in acute myeloid leukemia by Yu Liu, Huanchen Cheng, Meng Sun, Tiejun Gong and Jun Ma in Therapeutic Advances in Hematology
Footnotes
References
Supplementary Material
Please find the following supplemental material available below.
For Open Access articles published under a Creative Commons License, all supplemental material carries the same license as the article it is associated with.
For non-Open Access articles published, all supplemental material carries a non-exclusive license, and permission requests for re-use of supplemental material or any part of supplemental material shall be sent directly to the copyright owner as specified in the copyright notice associated with the article.