
Abstract
Aims:
This study quantifies the value of survival gains attributable to novel treatments approved since 2003 for United States (US) patients with relapsed/refractory multiple myeloma (RRMM).
Methods:
We estimated the increase in survival attributable to lenalidomide and bortezomib for multiple myeloma (MM) patients in the 1983–2013 Surveillance, Epidemiology, and End Results (SEER) registry. To estimate the survival benefit of treatments approved since 2015 (carfilzomib, elotuzomab, daratumumab, used in combination with lenalidomide and dexamethasone) we used clinical trial data to calibrate survival estimated using the SEER data. We then conducted an economic valuation of the estimated shift in survival curves for all therapies. Finally, we estimated the share of the value accruing to patients and manufacturers using treatment costs estimated from MarketScan data.
Results:
The introduction of bortezomib in combination with dexamethasone (Vd) and lenalidomide in combination with dexamethasone (Rd) resulted in substantial survival gains and societal value for multiple myeloma patients, generating 1.7 additional life-years per RRMM patient. More recently, approved novel treatments have improved survival over effective treatments (i.e. Rd/Vd) by an additional 2.5 life-years – the monetary value of this incremental survival benefit far exceeds the incremental cost of treatment. At the patient level, the incremental benefit of Rd/Vd is $335,500 and with novel treatments is $565,000. Applying this benefit to all future cohorts of US RRMM patients translates into a value of at least $75 billion and $130 billion with Rd/Vd and the novel treatments, respectively.
Conclusions:
SEER registry data were only available through 2013. Therefore, survival gains for recently approved treatments were estimated based on clinical trials, rather than observed survival. Our valuation analysis does not capture sources of value aside from survival gains, for example, better quality of life, increased productivity, or the value of surviving until subsequent novel therapies become available. Substantial extensions in life expectancy in RRMM since 2003 translate into real economic value gained by society.
Keywords
Introduction
Multiple myeloma (MM) is a rare and incurable cancer of plasma cells that affects over 140,000 people in the United States (US). 1 Although estimated to account for only 1.8% of new cancer cases (>30,000 cases), MM comprises 2.1% of all cancer deaths each year (approximately 13,000 deaths). 1 Most patients diagnosed with MM will experience relapse or become refractory to treatment at some point following front-line treatment initiation.
Prior to 2003, less than 35% of MM patients survived to 5 years; 2 treatment options were limited to steroids, alkylators and other cytotoxic chemotherapy, which had limited efficacy and was associated with significant toxicity. Since the approval of bortezomib and lenalidomide in 2003 and 2005, respectively, therapeutic advances have continued to add to the treatment options available to patients with relapsed/refractory multiple myeloma (RRMM). Inclusive of bortezomib and lenalidomide, there are now nine unique drugs approved for the treatment of RRMM: carfilzomib (Kd) – first approved in 2012 – and elotuzumab approved in combination with lenalidomide and dexamethasone (KRd and EloRd, respectively);3–5 and ixazomib, panobinostat, daratumumab (DaraRd), and pomalidomide, approved for RRMM based on demonstrated improvement in progression-free survival (PFS) relative to Rd (daratumumab or ixazomib-Rd), high-dose dexamethasone (pomalidomide low-dose dexamethasone), or placebo-Vd (panobinostat-Vd).6–9 Most recently, selinexor was approved in combination with dexamethasone for refractory MM in July 2019 and belantamab mafadotin was approved as monotherapy for relapsed refractory MM in August 2020.10,11 The search for a cure for MM continues; there are currently over 500 active clinical trials in MM in the US alone. 1
Despite significant improvements in prognosis for RRMM over the past 15 years, there has been a lack of rigorous evaluation of the economic value of these novel treatment strategies to society. RRMM treatment has garnered attention due to the perception that the cost of treating MM is higher compared to many other cancers.12–14 Given the dynamic changes in the treatment landscape and improved outcomes in RRMM, an economic analysis of the cost and value of survival gains to society attributable to therapeutic advances is warranted and fills a gap in the existing economic literature. This study uses both previously published methods and novel approaches15–18 to evaluate survival gains among patients with RRMM, and to quantify the economic benefit of these survival gains to society.
Methods
Data sources
Data from the Surveillance, Epidemiology, and End Results Program (SEER) registries from 1983 through 2013 were used to evaluate survival among patients. The SEER data sample included patients with MM (International Classification of Diseases for Oncology, third edition, ICD-O3, diagnosis code 9732) 19 and no other type of cancer, and complete information on MM (i.e. no missing data on tumor type, date of diagnosis, survival duration/time since diagnosis), race, and gender. Informed consent and ethics/institutional review board (IRB) approval were not sought for the present study because SEER registry participants are not individually identifiable, therefore the analysis did not involve human subjects.
The Truven MarketScan commercial claims and encounters, and Medicare supplemental files for 2003Q1–2015Q1, were used to calculate the share of adult MM patients utilizing lenalidomide and bortezomib in the 2003–2011 time period. In addition, average market shares for lenalidomide, bortezomib, and the novel therapies (i.e. carfilzomib, elotuzumab, and daratumumab) from January to June 2018 were sourced from a Wells Fargo Securities, equity research report. 20 Additional details on the novel therapy selection process are provided in the Supplemental materials.
Per capita cancer patient income was estimated for adult cancer patients from the Medical Expenditure Panel Survey (MEPS) 2010–2014 household consolidated files. 21 Wholesale acquisition (WAC) costs for all therapies in 2018 were collected from AnalySource to estimate monthly regimen costs.
Study sample
Our study evaluated a sample of patients projected to have RRMM. Since the SEER database does not identify patients with RRMM, and not every patient in the SEER database received treatment, it is possible that observed survival in SEER may be higher than for the more advanced population of MM patients of interest for this study. Therefore, to derive data for the population of interest, an adjustment was applied to the SEER data to estimate survival for the RRMM patient population. This involved aging SEER patients by assigning simulated random disease duration times. The simulated individual disease duration times were drawn from a log normal probability distribution that was determined by the mean and standard deviation of time since diagnosis in the ASPIRE (NCT 01080391) RRMM trial population (mean 45.1 months, standard deviation 35.2 months). 3 Patients’ age and year of diagnosis were then calculated, and a variable that indicated the simulated calendar year the patient began treatment for RRMM was created. Patient survival and censoring times were reduced by their simulated disease duration. Patients with negative reduced survival or follow-up times were removed from the analytic dataset.
Observation periods
Unique periods of interest were evaluated using the SEER data. The first period comprised years from 2004 to 2011. This period was defined because 2003, 2005, and 2012 were the years when bortezomib, lenalidomide, and carfilzomib, respectively, received marketing authorization for the treatment of RRMM.5,22,23 A comparison of survival in this period relative to survival in the period from 1983 to 2004 was estimated to demonstrate the survival gains in the post-bortezomib/lenalidomide era. Survival in the period of 2012–2013 was used as a proxy for survival in 2015 and beyond following the introduction of novel therapies. A comparison of survival in this period relative to the 2004–2011 period allowed for the evaluation of change in survival for RRMM with the launch of novel treatments relative to the bortezomib/lenalidomide era.
Variables
Exposure
A binary variable was used to indicate patients diagnosed with RRMM from 2004 to 2011 in the age-adjusted SEER data. Similarly, a binary variable was used to indicate patients diagnosed with MM in 2012 or later, representing the period when novel therapies for RRMM were introduced.
Outcomes
The outcomes of interest were the hazard ratio (HR) of death among patients diagnosed with MM from 2004 to 2011 relative to those diagnosed before, which captures the effect of the introduction of bortezomib and lenalidomide on survival of patients in the SEER dataset relative to therapies available before 2004, and the HR of death among patients diagnosed with MM from 2012 or 2013. The latter HR was used to calibrate survival benefits of regimens introduced in 2015 and beyond.
Covariates
Sex, age at RRMM diagnosis, race, Hispanic origin, insurance type [private/commercial insurance (reference), Medicaid, uninsured, unknown insurance status], and MM incidence weighted average income were all included as covariates in the survival analysis (see details in the Survival analysis section below). Flags for diagnosis in a particular year (i.e. year fixed effects) were included in the models of survival to account for the trends in survival gains unrelated to the launch of new therapies, such as change in patient mix and earlier diagnosis, isolating the changes in survival to the introduction of new therapies rather than these secular trends. The survival model also included an indicator for years 1999–2009 to control for any survival benefit of the introduction of thalidomide and primary period of its use (estimated using the Truven claims data).
Market share
Market shares for the novel therapies were collected from the Wells Fargo Securities equity research report. 20 These were rescaled to generate relative market shares for the four novel second-line regimens considered for the analysis, that is, Kd, KRd, EloRd, and DaraRd. The share of the individual regimens was calculated as the sum of the market shares in each individual line and regimen. The market share for carfilzomib was split one-third to two-thirds between Kd and KRd, respectively, as it was not provided in the report.
Analyses
Survival analysis
Cox proportional hazards models were used to estimate the gains in survival in the RRMM population attributable to the introduction of lenalidomide and bortezomib compared to the period prior to their availability, and to estimate the gains in survival following the introduction of novel treatments after 2012. All models were estimated using Stata 14 (StataCorp, College Station, TX, USA). The Cox models included patient characteristics (age at MM diagnosis, sex, race/Hispanic origin, and insurance status), as well as year fixed effects, which allowed for the prediction of survival in a particular year.
Based on the survival analysis we generated predicted survival curves for: (a) patients diagnosed in 2015 who did not have access to any therapies introduced after 2004 (this was simulating outcomes for patients pre-Vd/Rd); (b) patients diagnosed in 2015 who were treated with lenalidomide or bortezomib; and (c) patients diagnosed in 2015 who were treated with KRd, Kd, EloRd, or DaraRd. The incremental survival gain associated with the introduction of lenalidomide or bortezomib was calculated as the difference between (b) and (a) and the incremental survival gain associated with the introduction of KRd, Kd, EloRd, and DaraRd was calculated as the difference between (c) and (b). A period of 30 years was used to capture the complete survival of each cohort. The survival curve for the cohort of patients who received novel treatments was calculated as the weighted average of the predicted individual survival curves for the four novel treatments. Details on the methods used to adjust for relapse and receipt of treatment with lenalidomide or bortezomib novel, as well as the methods used in the survival curve calibration are provided in the Supplemental material.
Valuation model
For each of the therapies included in the analysis, we used the estimated average income of cancer patients to calibrate an economic model developed by Becker et al. 15 and estimate the value of survival gains between observation periods per patient and for future cohorts of patients over a 30-year time horizon.
Full income/value of time was calculated as double the incidence-weighted income of an individual based on an assumption that: (a) a 16 h wakeful day includes 8 h of work and 8 h of leisure/discretionary time; and (b) that leisure time is just as valuable as time spent in paid work. 24 The estimated cancer patient income was inflated to 2018 USD using the US Bureau of Labor Statistics consumer price index (CPI) for medical care. 25
The valuation model takes the predicted survival curves for the three cohorts and the mean estimated income as inputs, and calculates the lifetime value based on patient willingness to pay for the incremental survival gain associated with the introduction of a particular therapy, W. This utility-based model determines patients’ willingness-to-pay – that is, how much they value – an incremental gain in survival. The difference in survival probability between the predicted survival curves for novel treatments and the baseline curve represents the discrete increase in survival attributed to new therapies, after netting out secular trends in survival and changes in the patient case mix over time. The economic model estimates the lifetime value of the survival gains attributable to a particular therapy on a per-patient basis. The net value retained by patients was calculated as the difference between the weighted average value and weighted average cost.
The lifetime value of survival gains attributable to lenalidomide and bortezomib for a cohort of patients was calculated as the product of the per-patient lifetime value and the size of the RRMM cohort in 2015 (incident RRMM cohort). Further details on the cohort size calculation are provided in the Supplemental material. Similarly, the lifetime incremental value of survival gains attributable to carfilzomib, elotuzumab, and daratumumab for a cohort of RRMM patients was calculated as the product of the lifetime value per patient and the size of the RRMM cohort. The average value of the survival benefit was calculated as the market share weighted value for the four novel treatment regimens. The final annual incident RRMM cohort size for the novel therapies totalled 11,918.
Cost estimation
The predicted cost per cycle for both arms of the POLLUX, ASPIRE, ELOQUENT-2, and ENDEAVOR trials was used to estimate incremental costs of the novel regimens. These predicted cost per cycle data incorporate information on PFS and duration of treatment (DOT) with the approximate monthly regimen costs to calculate expected treatment costs by arm and cycle per patient. Because patients often discontinue treatment before disease progression, trial-arm incremental cost estimates were scaled by the ratio of median DOT to median PFS.3,26–29 Analyses incorporated anticipated rebates using a net drug price of 70%. 30
We estimated the expected total treatment cost, cj, for regimen j based on a particular clinical trial as a function of the duration of treatment adjusted cost of regimen j in month t,

The incremental costs for the novel regimens were calculated as the differences between the total costs of the two arms of their respective clinical trials. For example, the incremental cost of elotuzumab in the EloRd regimen was calculated as the difference between the total cost of the EloRd and Rd regimens based on the ELOQUENT-2 trial data.
The present value (PV) of the lifetime cost of treatment with a particular therapy for all current and future cohorts (C) depends on the lifetime cost for each incident cohort of patients prior to patent expiration, Cpre, and after patent expiry, Cpost, and the number of years that elapse until the patent dies (k):

Valuation
Weighted averages were calculated to generate estimates of benefits and costs for the average RRMM patient utilizing one of the four novel treatments using the market shares reported in Table 1.
Novel treatment regimen market shares, 2L+.

Source: Biegelsen et al. 20
The PV of lifetime survival gains for current and future cohorts (V) over the next t years was calculated as the lifetime value (W) calculated in the valuation analysis for the incident population (size I) at a discount rate of r, that is,

A discount rate of 3% per annum was used. In order to project treatment costs for purposes of the analyses in this paper only, the authors have assumed that the patent expiration years for bortezomib, lenalidomide, carfilzomib, elotuzumab, and daratumumab were 2022, 2027, and 2027, 2026, and 2030 (the earliest listed date), respectively.31–34 After patent expiration, the annual treatment cost of oral drugs (lenalidomide) was assumed to decrease by 21%, whereas the annual treatment cost of intravenous or subcutaneous drugs (bortezomib, carfilzomib, elotuzumab, and daratumumab) by 34%. 35 These cost decreases are based on estimated changes in costs of specialty drugs (as opposed to non-specialty or all drugs in general, which would not be representative of MM therapies), as reported previously. 35
Results
Overall, 88,523 patients with MM were identified in the SEER dataset. Patient demographic characteristics were largely similar across the three exposure cohorts: pre-2004 (prior to the introduction of lenalidomide and bortezomib), 2004–2011 (after the introduction of lenalidomide and bortezomib), and post-2012 (i.e. 2012–2013). Age at diagnosis decreased by less than a year across these time intervals, from 69.0 pre-2004 to 68.2 in post-2012, and the percentage of men in each cohort increased slightly over the study period, from 52.5% pre-2004 to 56.6% in post-2012 (Table 2).
Characteristics of patients with multiple myeloma in the surveillance, epidemiology, and end results database (1983–2013).

Source: SEER 1983–2013 and authors’ calculations.
1983 was the first-year autologous stem cell transplantation became a part of the treatment pathway for multiple myeloma. Insurance status information was not available for all patients diagnosed before 2006. The post-2012 time period represents patients diagnosed in 2012 and 2013.
Max, maximum; min, minimum; MM, multiple myeloma; SD, standard deviation.
Survival analysis
The introduction of bortezomib and lenalidomide were associated with a significant improvement in overall survival (OS) (HR 0.77, p < 0.001; see Supplemental material for full results). This HR reflects the overall impact of the introduction of bortezomib and lenalidomide in the treatment of RRMM patients diagnosed in 2004–2011. The survival model estimated an increase in life expectancy of 1.7 years (Table 3) for patients treated with bortezomib/lenalidomide relative to those who did not have access to these treatments earlier. We estimate that novel regimens on average generate an additional 2.5-year increase in life expectancy (Table 3), above that generated by bortezomib/lenalidomide.
Estimated impact of introduction of new therapies on RRMM survival.

Source: SEER 1983–2013 and authors’ calculations.
RRMM, relapsed/refractory multiple myeloma.
Figure 1 illustrates the estimated survival curves for the population used in the model, as well as the estimated survival curve for the general population matched to the ENDEAVOR population. As Figure 1 illustrates, while there have been significant improvements in survival and life expectancy among MM patients, there is still ample room for improvement and a need for additional innovation.
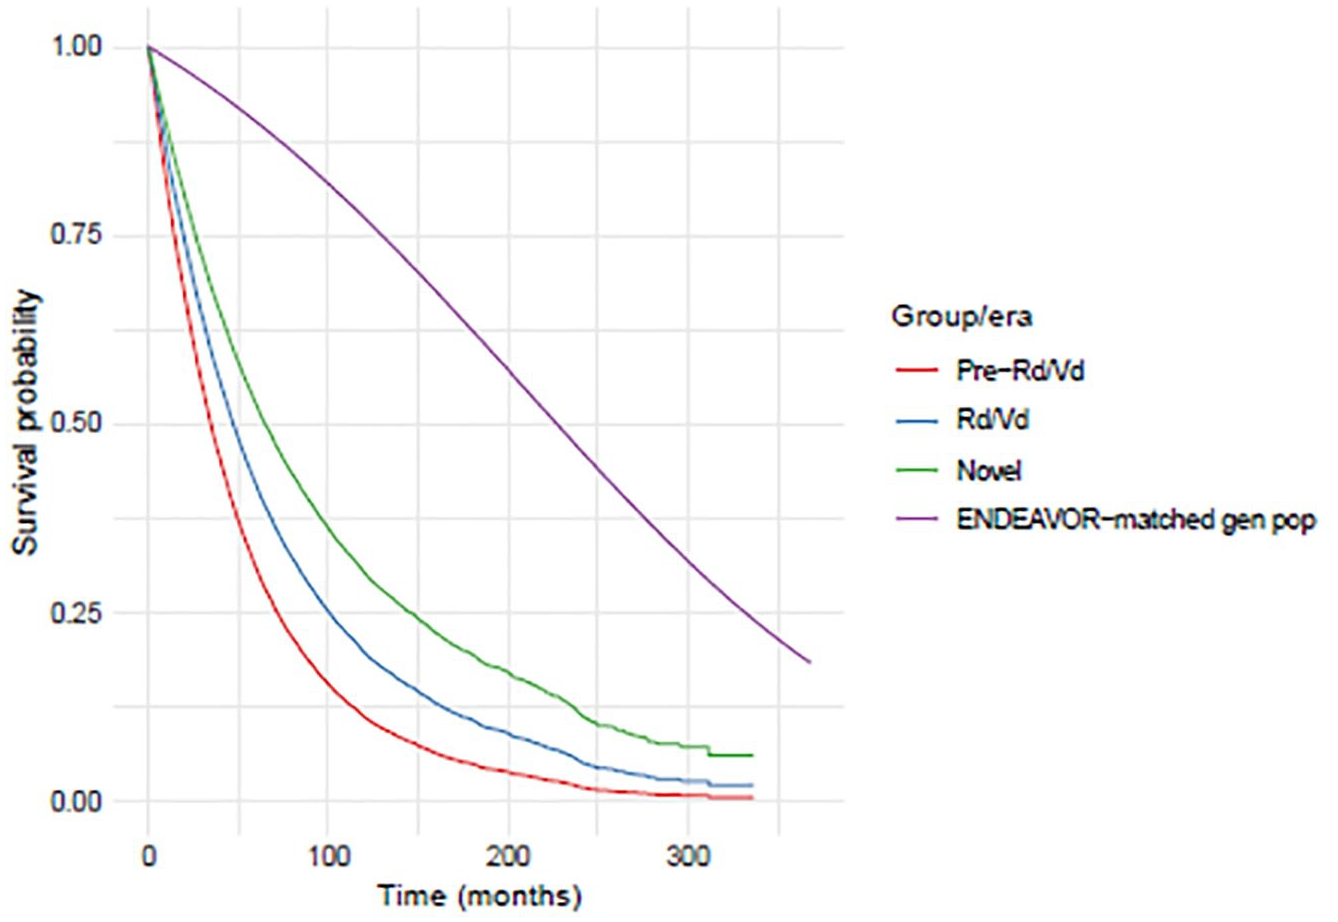
Survival curves.
Valuation and appropriations analysis
We estimated a total lifetime value of $335,479 per patient for survival gains attributable to bortezomib and lenalidomide. Table 4 presents the incremental value of survival gained through treatment, as well as the incremental costs of treatment by therapy. The estimated PV of the survival gains generated by bortezomib and lenalidomide for the treatment of MM equals $76.2 billion using a 30-year time horizon and net drug prices. The PV of the incremental costs of treatment equals $39.4 billion. Thus, we estimate that society retains $36.8 billion of the total value of survival benefits generated by bortezomib and lenalidomide.
Estimated value of survival gains in RRMM from Rd/Vd and novel therapy regimens.
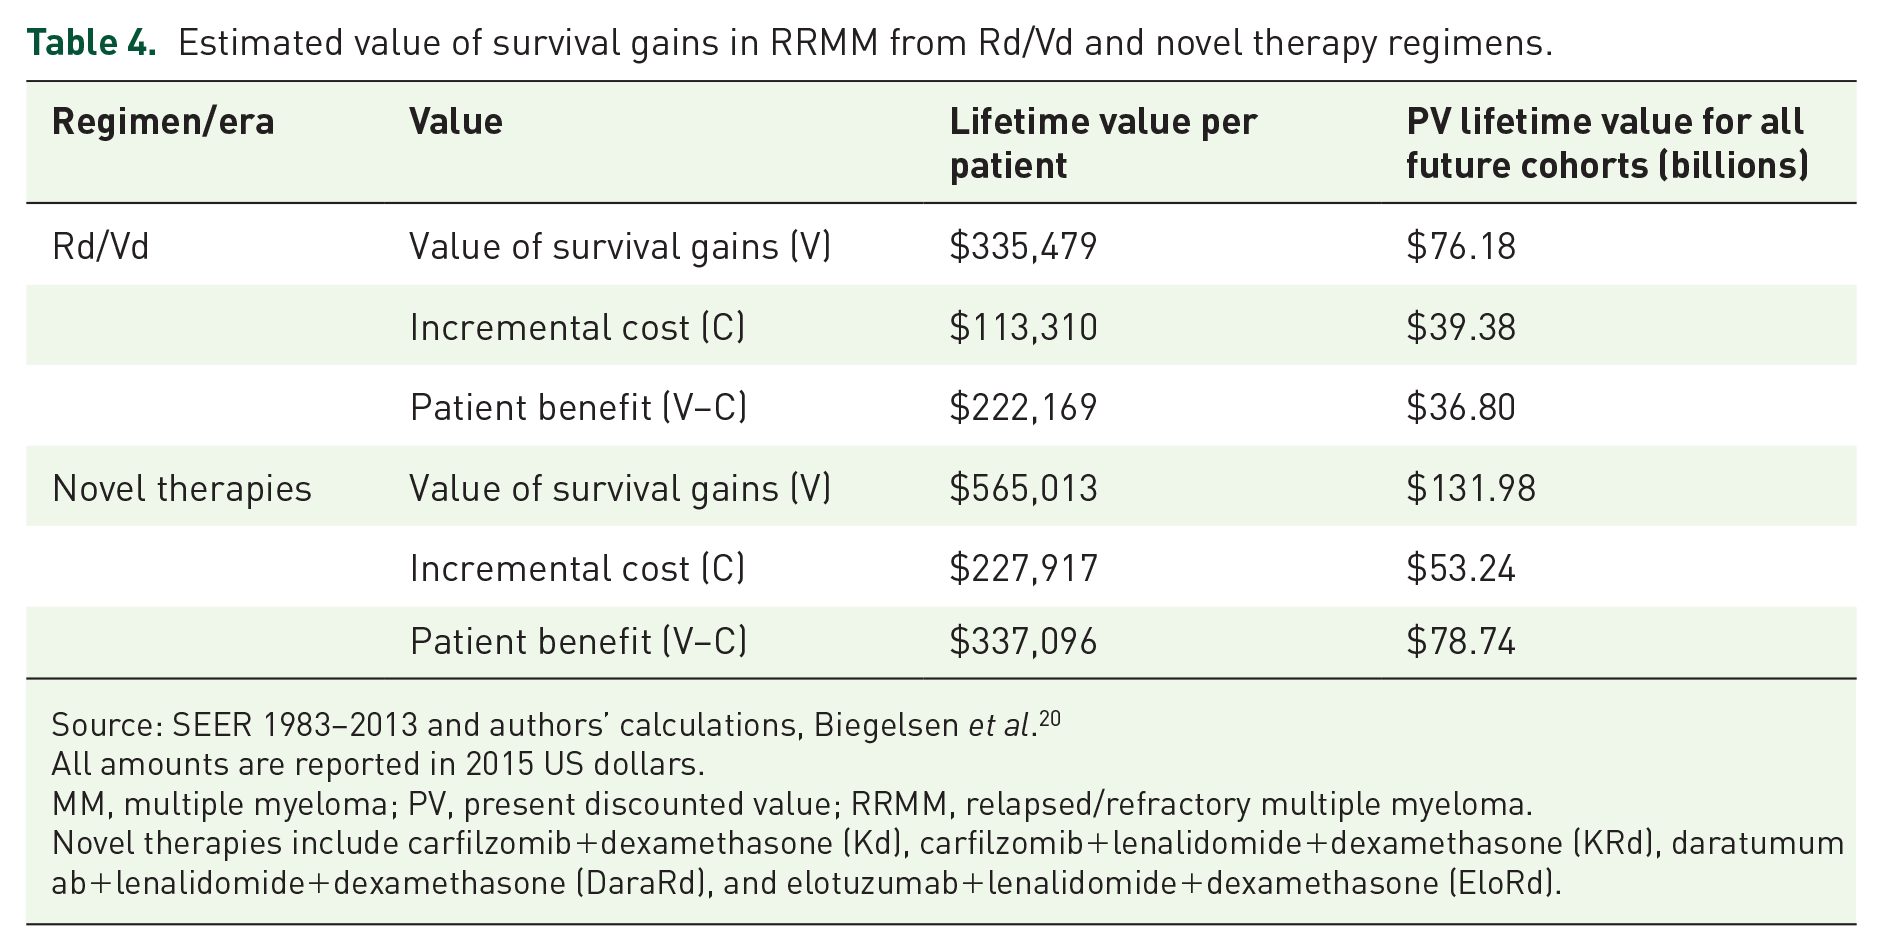
Source: SEER 1983–2013 and authors’ calculations, Biegelsen et al. 20
All amounts are reported in 2015 US dollars.
MM, multiple myeloma; PV, present discounted value; RRMM, relapsed/refractory multiple myeloma.
Novel therapies include carfilzomib+dexamethasone (Kd), carfilzomib+lenalidomide+dexamethasone (KRd), daratumumab+lenalidomide+dexamethasone (DaraRd), and elotuzumab+lenalidomide+dexamethasone (EloRd).
We estimate that the introduction of the novel regimens generates a lifetime value of $565,013 per patient (Table 4). Up to $132.0 billion in value (in addition to that generated from the introduction of lenalidomide and bortezomib) is generated from their survival benefit to RRMM patients over the next 30 years, relative to the PV of the costs of treatment of $53.2 billion, and in addition to the value generated by bortezomib and lenalidomide.
Discussion
Before the introduction of bortezomib and lenalidomide in 2003 and 2005, respectively, MM was associated with a poor prognosis, with less than 35% of patients surviving to 5 years. 1 In this study, we found that treatment innovation has led to marked increases in survival over the past one and a half decades, and that the value of those survival gains has exceeded their cost. Based on the results of this analysis, the introduction of the novel treatments, lenalidomide and bortezomib, is associated with an estimated increase in life expectancy of 1.7 years. This improvement in life expectancy generated an estimated $76.2 billion in value for all current and future cohorts of RRMM patients over the next 30 years. We estimated that the novel regimens approved after 2015 generated an additional 2.5 years of life expectancy over those generated by Rd/Vd. The annual value of these survival gains exceeds the costs of treatment, providing a positive net benefit to society.
Since the 2012 introduction of carfilzomib (monotherapy), several additional treatments have come to market including elotuzumab, daratumumab, ixazomib, panobinostat, and pomalidomide. Patient-level disease heterogeneity, and potential variability in response to treatment, underscores the importance of continued innovations that expand treatment options and allow for patients and physicians to optimize treatment. 36 Greater treatment options allow physicians to tailor treatment to maximize benefit for particular patient subpopulations (e.g. refractory patients), for which the incremental benefit of treatment exceeds that for a broader population studied in a trial (e.g. all second line patients).
This study builds on work from previous studies that modeled the survival benefits and assessed the value generated by innovative treatments for patients with MM.15,16,37 The conclusions of the current study were similar to earlier works. Lakdawalla et al. 37 estimated that improvements in survival attributable to innovation in treatments for all cancers between 1988 and 2000 created 23 million additional life-years, and approximately $1.9 trillion in value over that time period. Providers and manufacturers retained 5–19% of that value, while the majority of value accrued to patients. 37 An analysis by Yin et al. 16 evaluated survival gains attributable to novel treatments for chronic myeloid leukemia. Based on their analysis, novel therapy generates more than $143 billion in value, with 90% of the value being retained by patients, and 10% recouped by manufacturers, given costs at the time of publication. 16 Using a conservative estimate of the value of a statistical life year ($100,000) (VSLY), Lakdawalla, et al. 38 compared the change in the cost of care associated with the introduction of bortezomib and lenalidomide to the value of improvements in quality-adjusted life-years (QALYs) for patients with MM between 2004 and 2009, following the introduction of lenalidomide and bortezomib. 38 The authors estimated that the value of QALY improvements for patients with MM treated with innovative therapies in the second-line setting equalled $140,800 and came at a cost of $72,937 – implying a net benefit to patients (or equivalently a decrease in the quality-adjusted cost of care) of nearly $68,000.
A brief assessment of cost-effectiveness analyses of therapies for RRMM indicate mixed findings as to the cost-effectiveness of these at willingness to pay thresholds applied by organizations such as the Institute for Clinical and Economic Review ($50,000–150,000/QALY). Analyses from the latter estimated that the cost per QALY gained for KRd and EloRd are $199,982 and $427,607, respectively. 39 Jakubowiak et al. 40 estimated that the Kd doublet generated an additional 1.66 life-years (over a 30-year time horizon) relative to Vd and that the incremental cost-effectiveness ratio (ICER) was $121,828 per QALY gained. Zhang et al. 41 estimated an ICER for DVd compared with Vd of $284,180 per QALY and an ICER for DRd compared with Rd of $1,369,062 per QALY.
Using an estimated value of a statistical life-year of $200,000, 42 the value of QALY gains estimated in Lakdawalla et al. 38 would be approximately $282,000 (=2 × $140,080). The valuation model employed in this study is more rigorous than simply scaling up VSLYs by life expectancy increases. The valuation model factors in diminishing returns to health improvements, in light of survival curves associated with the use of previous therapies and other standards of care. It also accounts for the discrete increases in survival along the entire survival curve, rather than extrapolating the value of marginal increases in survival, as is implicitly and inconsistently done when using VSLY estimates to value jumps in survival. 15 We estimate that the introduction of lenalidomide and bortezomib generated an increase in life expectancy of 1.7 years at a value of $335,479 or $197,341 per life-year gained. Our estimates are smaller in part because the estimated number of QALYs gained used in Lakdawalla et al. 38 – 2.2 years, which is based on estimates reported in Brown et al. 43 – is more than the life expectancy gain of 1.7 years estimated in this study. For the novel regimens in RRMM, the value of survival gains per life-year gained equal $223,732 (=$565,013/2.5).
Limitations
Several limitations deserve mention. First, the SEER data are not nationally representative and do not include information on the specific treatments utilized by MM patients over the full study period. To address this limitation, we estimated therapy utilization among MM patients identified in the Truven MarketScan claims data. In addition, at the time of this analysis, SEER data were not available beyond 2013, one year after the launch of carfilzomib and the year of pomalidomide’s launch. As a result, the survival gains for carfilzomib, elotuzumab, and daratumumab were based on extrapolations of data from ASPIRE, ENDEAVOR, ELOQUENT-2, and POLLUX clinical trials, rather than increases in survival estimated from SEER community-based data. Clinical trial participants and efficacy may not be representative of real-world patients and effectiveness. Similarly, survival gains for the Kd regimen were extrapolated using the HRs from the ENDEAVOR clinical trial and the relationship between SEER-observed outcomes for the Vd regimen (the comparator arm in ENDEAVOR). Patients treated in real-world settings may differ from those treated in clinical trials in terms of baseline patient characteristics and treatment effectiveness in the real world may differ from the efficacy observed in clinical trials. 44 In ASPIRE, the intention to treat (ITT) population was younger and disproportionately more Caucasian compared with the cohort in the SEER dataset.3,8,28 Moreover, only 20% of patients in ASPIRE were recruited from North America, while SEER data are entirely from the US (and not entirely representative of the US population). The differences between the SEER patient cohort and the clinical trial population are to be expected given inherent biases in patient composition that result from clinical trial recruitment. Also, our cost estimates only reflect anticancer/oncology drug costs. Our results do not reflect changes in costs for other healthcare components, for example, inpatient care, over time or between regimens.
Finally, our estimates of treatment value to society may be conservative as they do not explicitly capture additional sources of value. These additional areas of value include reduced caregiver burden, productivity loss avoided, and the insurance value of available novel cancer treatments for future patients, that is, the value of innovative therapies to healthy individuals who may someday develop MM. Furthermore, these estimates represent only the benefits of improved survival to patients in the US, whereas MM patients around the globe surely benefit from these innovative therapies as well.
Conclusion
We estimated the survival gains attributable to novel treatments for RRMM and quantified the lifetime incremental value over the patent and post-patent expiry periods, which aimed to reflect a comprehensive societal perspective, in contrast to a standard cost-effectiveness analysis. This study demonstrates that not only do these therapies offer a significant advancement in the treatment of RRMM, but generate substantial value to society. Concerns about the prices of RRMM therapies fail to account for the value generated over the past several decades.
Supplemental Material
sj-pdf-1-tah-10.1177_20406207211027463 – Supplemental material for The value of survival gains from therapeutic innovations for US patients with relapsed/refractory multiple myeloma
Supplemental material, sj-pdf-1-tah-10.1177_20406207211027463 for The value of survival gains from therapeutic innovations for US patients with relapsed/refractory multiple myeloma by Joanna P MacEwan, Istvan Majer, Jacquelyn W Chou and Sumeet Panjabi in Therapeutic Advances in Hematology
Footnotes
Acknowledgements
The authors would like to thank Seanna Vine and Katie Everson of PRECISIONheor for their programming assistance and Dr Shaji Kumar for his feedback on the manuscript. They would also like to thank Professor Wesley Yin for his input on the study design and feedback on the manuscript.
Author contributions
Joanna P MacEwan: Design of work, acquisition, analysis, and interpretation of data; drafting the work and critical revision; statistical analysis, administrative, technical, or material support; final approval.
Jacquelyn W Chou: Interpretation of data; drafting the work and critical revision; administrative, technical, or material support; final approval.
Other contributors
Seanna Vine: Acquisition of data
Katie Everson: Acquisition of data
Conflict of interest statement
Wesley Yin is a consultant to PRECISIONheor. Joanna MacEwan is a past employee, and Jacquelyn Chou is an employee of PRECISIONheor.
Funding
The authors disclosed receipt of the following financial support for the research, authorship, and/or publication of this article: This work was supported by Amgen.
Supplemental material
Supplemental material for this article is available online.
References
Supplementary Material
Please find the following supplemental material available below.
For Open Access articles published under a Creative Commons License, all supplemental material carries the same license as the article it is associated with.
For non-Open Access articles published, all supplemental material carries a non-exclusive license, and permission requests for re-use of supplemental material or any part of supplemental material shall be sent directly to the copyright owner as specified in the copyright notice associated with the article.