
Abstract
Background and objective
200 kHz tumor treating fields (TTFields) is clinically approved for newly-diagnosed glioblastoma (nGBM). Because its effects on conventional surveillance MRI brain scans are equivocal, we investigated its effects on perfusion MRI (pMRI) brain scans.
Methods
Each patient underwent institutional standard pMRI: dynamic contrast-enhanced (DCE) and dynamic susceptibility contrast (DSC) pMRI at three time points: baseline, 2-, and 6-months on-adjuvant therapy. At each timepoint, the difference between T1 pre- versus post-contrast tumor volume (ΔT1) and these pMRI metrics were evaluated: normalized and standardized relative cerebral blood volume (nRCBV, sRCBV); fractional plasma volume (Vp), volume of extravascular extracellular space (EES) per volume of tissue (Ve), blood–brain barrier (BBB) permeability (Ktrans), and time constant for gadolinium reflux from EES back into the vascular system (Kep). Between-group comparisons were performed using rank-sum analysis, and bootstrapping evaluated likely reproducibility of the results.
Results
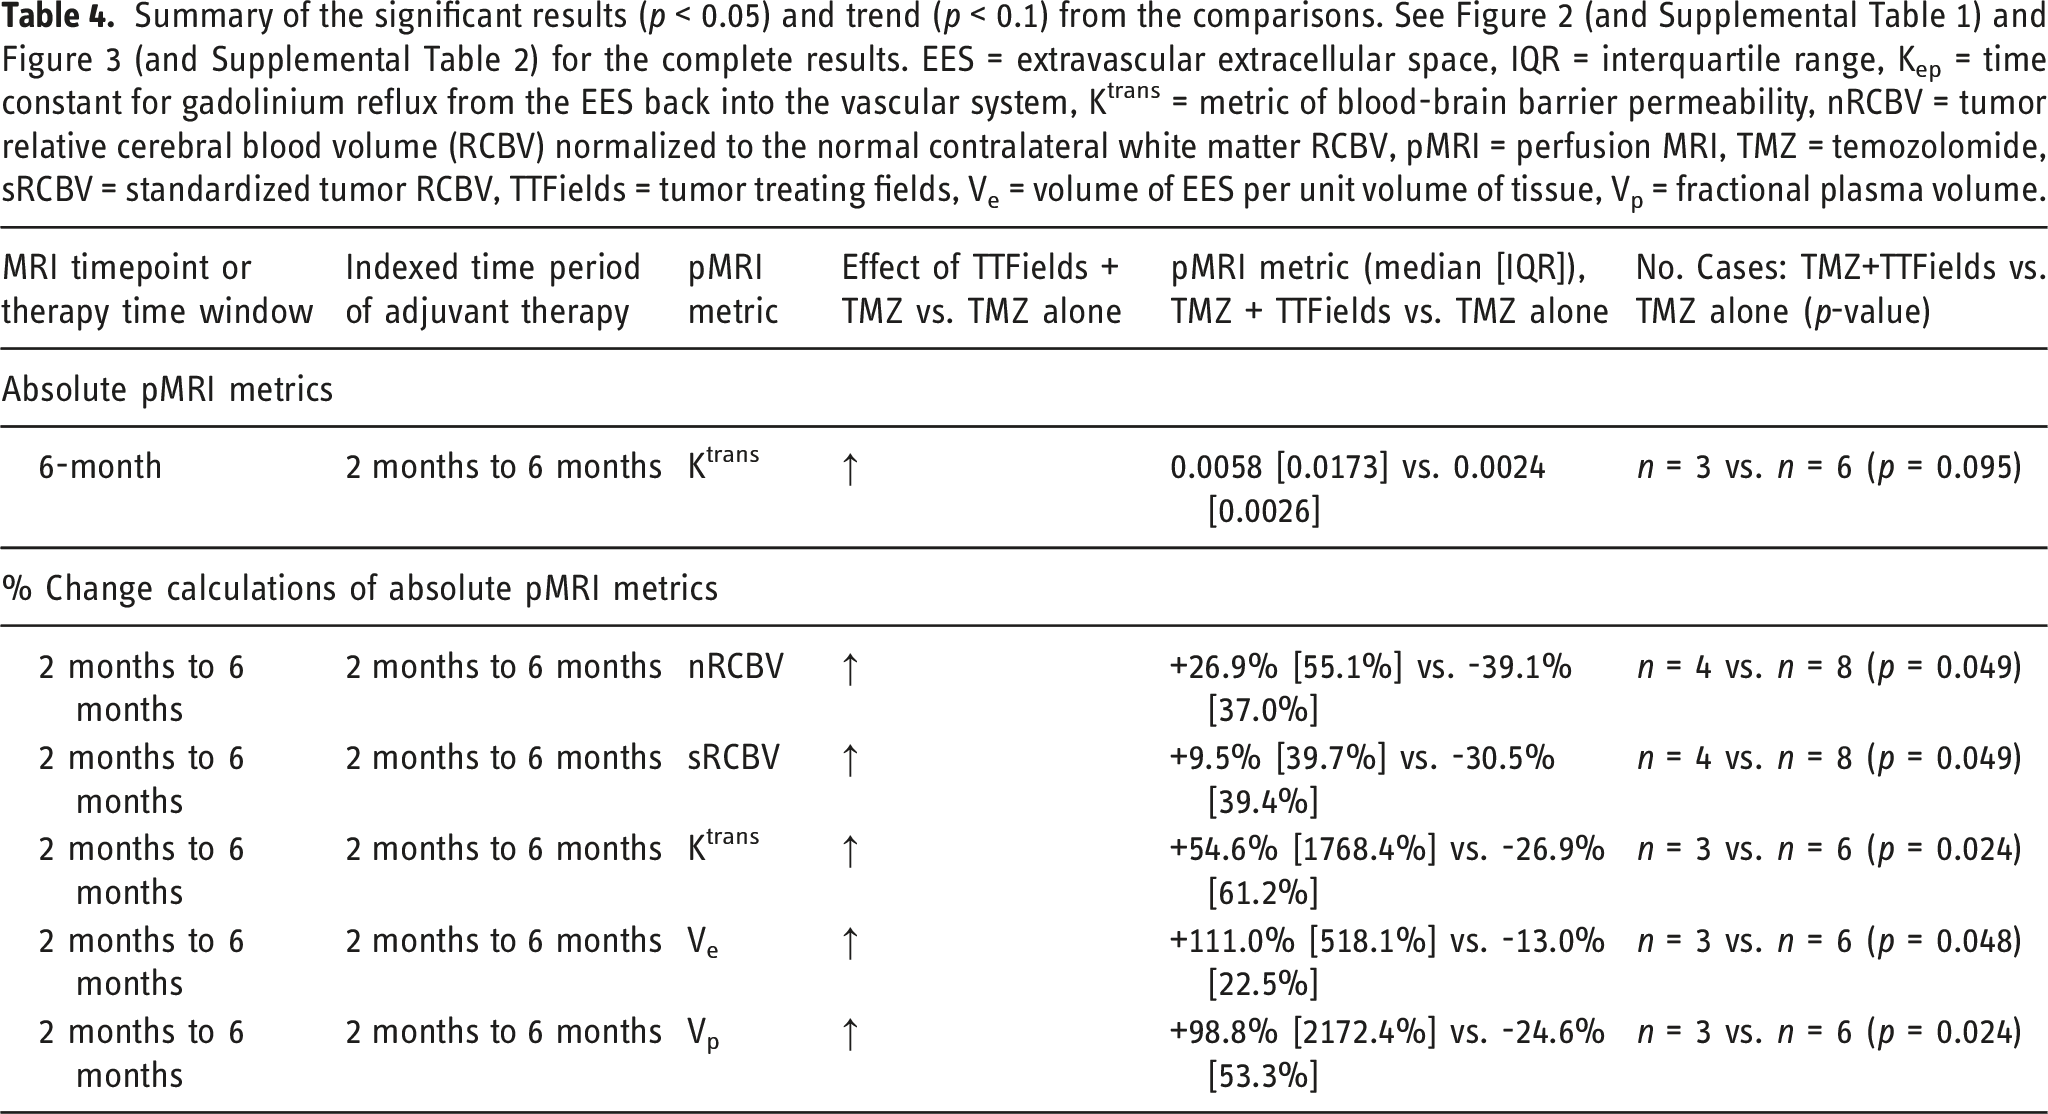
Among 13 pMRI datasets (11 nGBM, 2 recurrent GBM), therapies included temozolomide-only (n = 9) and temozolomide + TTFields (n = 4). No significant differences were found in patient or tumor characteristics. Compared to temozolomide-only, temozolomide + TTFields did not significantly affect the percent-change in pMRI metrics from baseline to 2 months. But during the 2- to 6-month period, temozolomide + TTFields significantly increased the percent-change in nRCBV (+26.9% [interquartile range 55.1%] vs -39.1% [37.0%], p = 0.049), sRCBV (+9.5% [39.7%] vs -30.5% [39.4%], p = 0.049), Ktrans (+54.6% [1768.4%] vs -26.9% [61.2%], p = 0.024), Ve (+111.0% [518.1%] vs -13.0% [22.5%], p = 0.048), and Vp (+98.8% [2172.4%] vs -24.6% [53.3%], p = 0.024) compared to temozolomide-only.
Conclusion
Using pMRI, we provide initial in-human validation of pre-clinical studies regarding the effects of TTFields on tumor blood volume and BBB permeability in GBM.
Keywords
Introduction
Glioblastoma (GBM), the most common and lethal form of primary brain cancer in adults, remains an incurable and invariably fatal disease. 1 However, a novel, FDA-approved therapy based on alternating electric fields, 200 kHz tumor treating fields (TTFields), has recently been shown to increase 5-year survival from 5% to 13% in newly-diagnosed GBM (nGBM) when combined with standard adjuvant temozolomide (TMZ) chemotherapy.2,3 Based on its impactful survival benefit, TTFields is increasingly becoming the standard of care in nGBM, with an 84% adoption rate in Germany 4 and approximately 50% adoption rate in the United States.5,6 TTFields is the chronic administration of alternating electric fields delivered to the tumor site by insulated electrode arrays adhesively placed on the overlying skin. 7 In 2015, the FDA approved 200 kHz TTFields for nGBM based on the EF-14 phase 3 randomized controlled trial.2,3 TTFields did not increase the incidence of headaches, seizures, or cognitive decline in patients with nGBM when combined with adjuvant TMZ,2,3 and it prolonged deterioration-free survival in multiple patient-reported health-related quality of life outcomes. 8 The most frequent adverse event was low-grade skin toxicity, and subsequent guidance has been published for prevention and management of this most common side effect of TTFields therapy.9,10 Only when combined with chemotherapy has TTFields been shown to improve survival in GBM2,3; 200 kHz TTFields alone versus chemotherapy alone led to non-inferior progression-free survival (PFS) in recurrent GBM (rGBM). 11 Global post-marketing safety surveillance of TTFields in approximately 6,000 nGBM patients found no new safety concerns, 5 and the survival benefit in both rGBM 12 and nGBM 13 has been confirmed in post-marketing, real-world patient series.
Although TTFields has been shown to impair mitosis in pre-clinical and clinical cancer studies,14,15 in response to being asked what would most likely increase utilization of TTFields in GBM, 50% of the survey respondents at a clinical cancer conference stated either a predictor of individual benefit or improved understanding of the mechanism. 16 This highlights the clinical decision-making impact and significance of validating neuroimaging biomarkers of response to TTFields, based on established mechanisms of action, in nGBM patients.17,18 The standard-of-care contrast-enhanced brain MRI biomarker response patterns in GBM patients treated with TTFields have not been well characterized.19–21 Moreover, GBM has been shown to appear to grow in the early weeks of clinical TTFields therapy (“pseudoprogression”) before the tumor eventually shrinks,17,22 and emerging data suggest that the durability of response to TTFields depends on the duration of continuous therapy.2,23,24 Of note, this suggests that 200 kHz TTFields alone acts in a tumor-stabilizing, rather than curative, manner. Pre-clinical studies suggest that TTFields permeabilizes the rodent blood–brain barrier (BBB) 25 and human GBM cell membranes, 26 but this has not yet been validated in humans.
A retrospective analysis of the standard-of-care brain MRI scans from the EF-14 trial 3 demonstrated that distant lesions occurred at greater distances from the primary GBM site with 200 kHz TTFields exposure and that distant progression correlated with improved survival in nGBM patients exposed to 200 kHz TTFields. 27 A prospective study of standard-of-care MRI in nGBM patients on 200 kHz TTFields therapy is underway (NCT03642080). Another post-hoc analysis of the EF-14 trial 3 studied the dose of TTFields, a function of the product of the field strength2 and the duration of use, and found that an intratumoral dose of ≥0.77 mW/cm3 prolonged overall survival by 4.8 months. 23
Despite clinical evidence of TTFields’ benefit in GBM, its mechanisms are not fully validated in humans. The effects of TTFields on tumor physiology (e.g., metabolism, vascular permeability, perfusion, etc.) are not well understood in human GBM. In this retrospective study, we used perfusion MRI to evaluate the effects of the addition of 200 kHz TTFields to adjuvant TMZ in patients with GBM, at baseline (pre-adjuvant therapy), 2 months on-therapy, and 6 months on-therapy.
Methods
Patient identification and selection
A retrospective chart review (IRB 42357) was performed at Stanford University School of Medicine to identify patients with newly-diagnosed or recurrent World Health Organization grade 4 GBM (nGBM or rGBM, respectively) based on operation (biopsy or resection), who started either of two adjuvant therapies between June 2016 and March 2022: monthly TMZ alone or monthly TMZ combined with 200 kHz TTFields.2,3,11,28 Within this cohort, patients who underwent perfusion MRI brain scans at our institution at three pre-specified time points were considered for further inclusion in this study: baseline (prior to initiation of adjuvant therapy), 2 ± 0.5 months on-adjuvant therapy, and 6 ± 1 months on-adjuvant therapy. None of the included patients experienced true tumor progression or treatment-related pseudoprogression between their baseline and 6-month pMRI scans. 29 To mitigate the confounding of results in this pMRI-focused study, patients were excluded if they received anti-angiogenic bevacizumab prior to the baseline MRI or at any time during the evaluation period. If available, the monthly TTFields compliance rates were determined for the patients in the TMZ + TTFields group.
Brain perfusion magnetic resonance imaging acquisition
Patients with GBM underwent brain perfusion MRI, which is standard neuroimaging at our institution for patients with high-grade glioma, on either a 1.5 T (Signa Explorer; GE Healthcare, Milwaukee, Wisconsin) or 3 T (Discovery MR750; GE Healthcare, Milwaukee, Wisconsin) scanner. The imaging sequences included (in order of acquisition): axial 3D T1-weighted pre-gadolinium, 2D diffusion weighted imaging, 2D gradient echo, 3D T2 fluid attenuation inversion recovery, dynamic contrast-enhanced (DCE), 2D T2-weighted, dynamic susceptibility contrast (DSC), and 3D T1-weighted post-gadolinium.
The DCE-MRI consisted of five variable flip angles (2o, 5o, 10o, 15o, and 20o) used for T1 mapping, followed by the DCE dynamic images (repetition time [TR] 4.8 msec, echo time [TE] 1.2 msec, flip angle 25o, contiguous slice thickness 5 mm, field of view 240 × 240 mm, matrix 128 × 128 mm, 60 phases, 20 slices/phase, 5.5 s/phase) before, during, and after 0.05 mmol/kg gadolinium injection. This DCE gadolinium dose served as a preload to correct for leakage effects in DSC-MRI. Following DCE and subsequent T2-weighted image acquisition, a second 0.05 mmol/kg gadolinium dose was administered for DSC imaging (parameters: TR/TE 1800/35-40 msec, contiguous slice thickness 5 mm, 20 slices [10 cm] covering the brain, flip angle 60° for exams performed before January 2019 and 30° for exams performed after January 2019, matrix 96 × 128 mm, field of view 220-240 × 220-240 mm). In a few cases, DCE-MRI was either not performed or there was an inadequate dataset that could not be processed.
Perfusion magnetic resonance imaging metrics and analysis
Perfusion MRI data were analyzed as follows to generate the following seven metrics: one was based on T1-weighted MRI: difference between post-contrast scan and pre-contrast scan tumor volumes (ΔT1, units mm3); two were based on DSC MRI: tumor rCBV normalized to normal contralateral white matter rCBV (mean nRCBV) and standardized rCBV (mean sRCBV); and the remaining four were based on DCE-MRI: volume transfer constant for gadolinium between blood plasma and the brain tissue extravascular extracellular space ([EES], mean Ktrans, units min-1), volume of EES per unit volume of tissue (mean Ve, unitless, range 0-1), time constant for gadolinium reflux from the EES back into the vascular system (mean Kep = mean Ktrans/mean Ve), and fractional plasma volume (mean Vp, unitless, range 0-1).
We used the FDA-approved commercially available plug-in for DSC analysis (IB Neuro, version 2.0; Imaging Biometrics) that uses a well-established leakage correction algorithm, in conjunction with OsiriX MD, to process DSC data. Using the software workflow engine, the ΔT1 contrast-enhancing volume was determined and co-registered with raw DSC images. Contrast-enhancing volume of interest was transferred to the rCBV map and normalized taking the average of two 5 × 5 mm regions of interest in the contralateral normal-appearing white matter. Standardized rCBV was built into the commercial software platform that we used, and did not require normalization to the contralateral white matter, thereby removing operator-dependent input during processing.30–32 Output nRCBV and sRCBV color maps were generated.
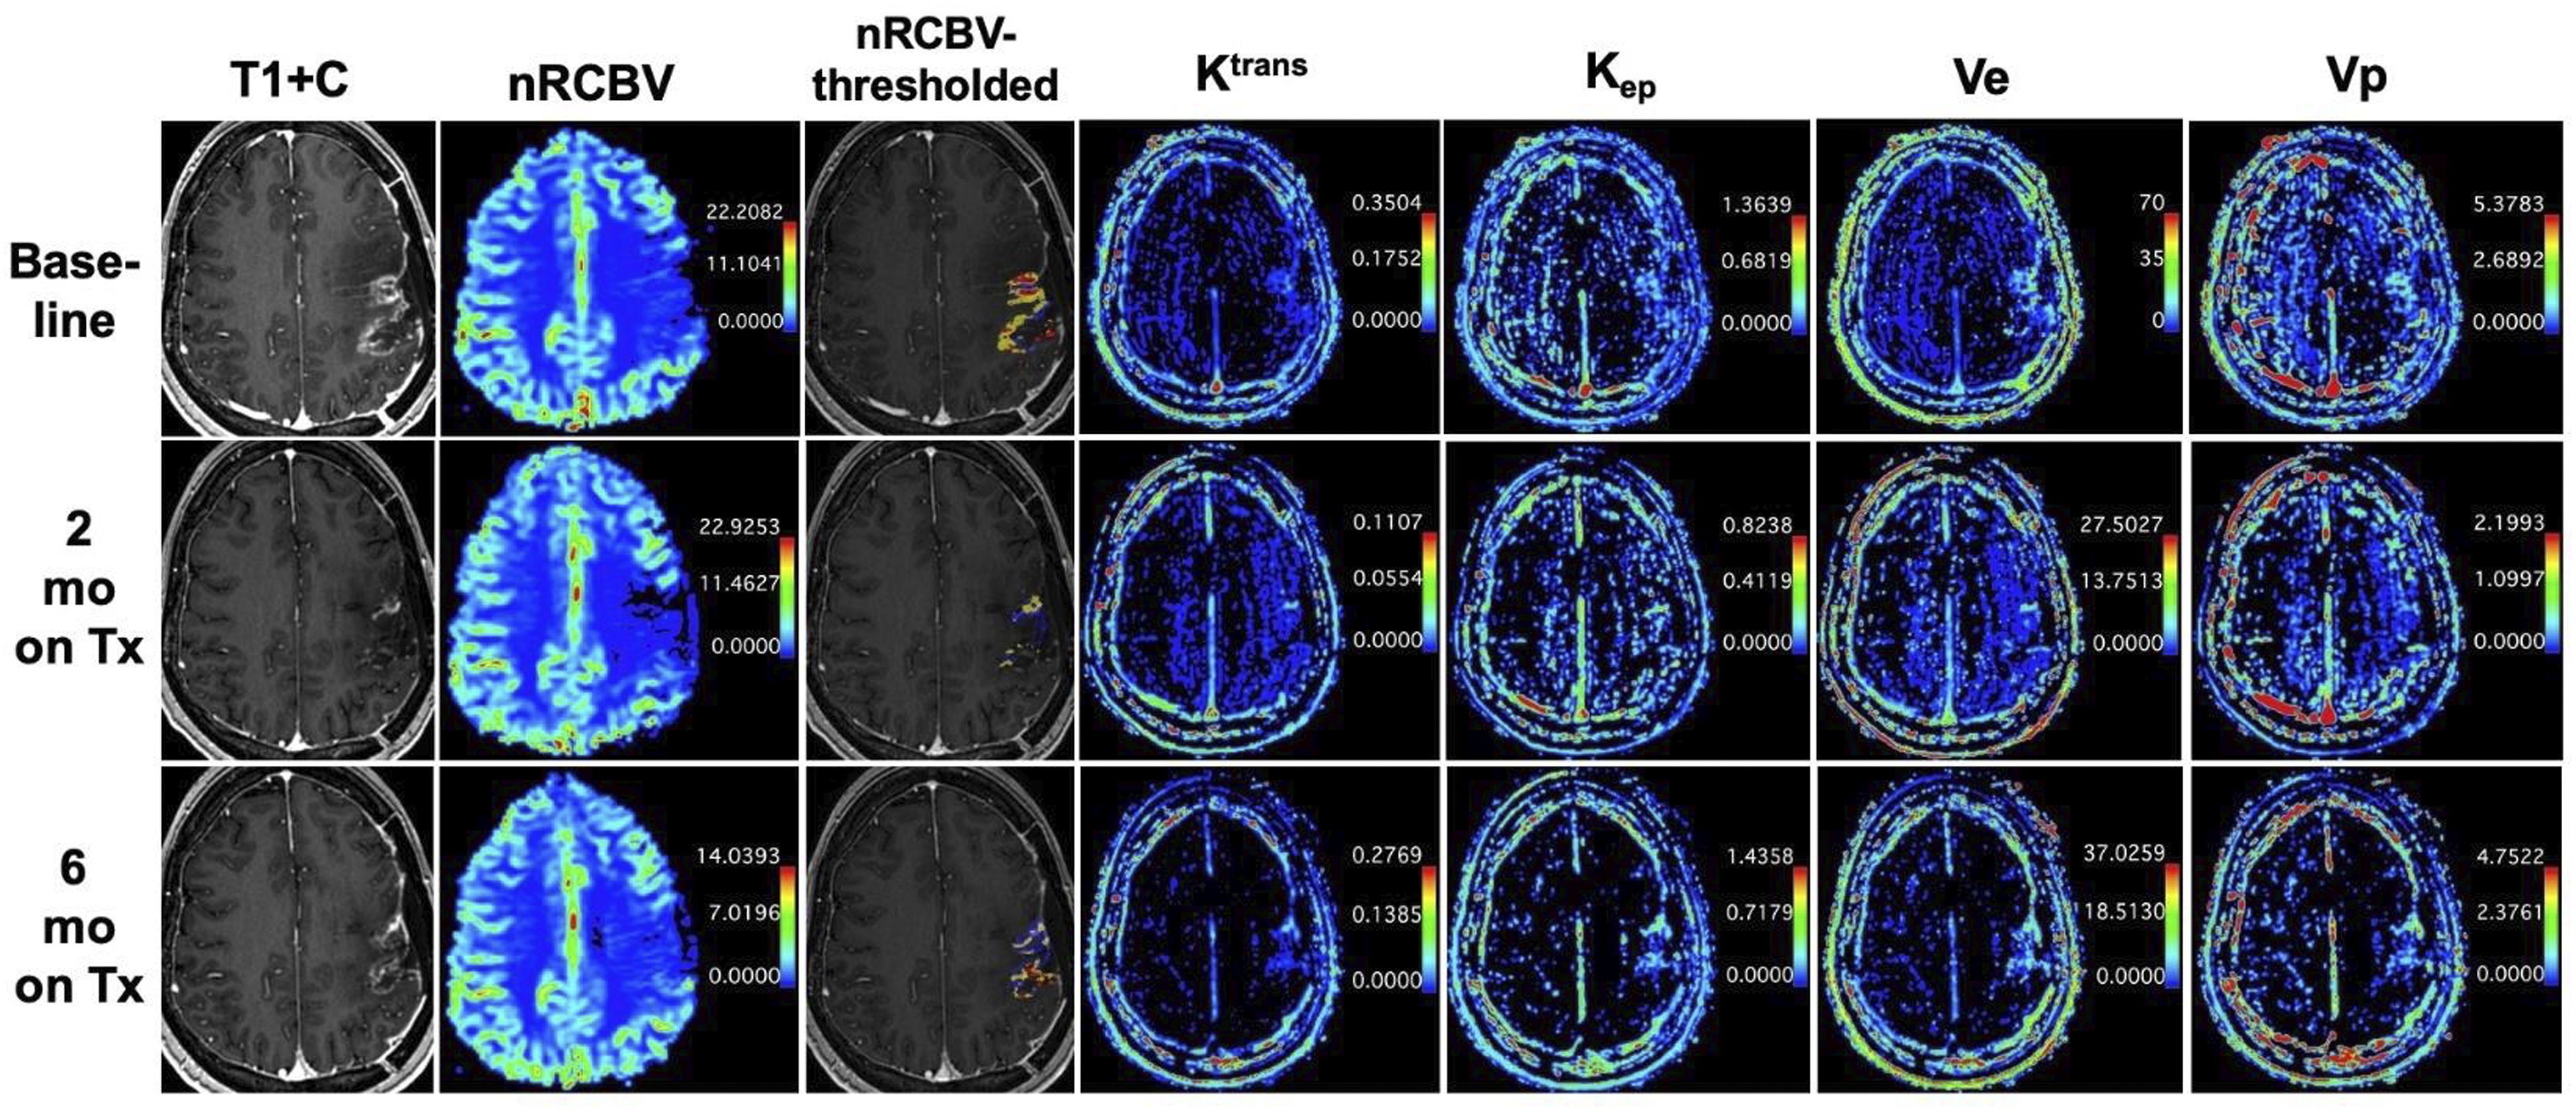
We used a workstation equipped with OsiriX MD (version 7.0) and a commercially available plugin for DCE analysis (IB DCE, version 2.0; Imaging Biometrics). Using the software’s semi-automated pipeline, which includes automatic generation of the vascular input function, operator-defined segmentation of the contrast-enhancing volume, and pharmacokinetic modeling using the extended Tofts model, we acquired mean Ktrans, Kep, Ve, and Vp values of the contrast-enhancing volume. Figure 1 illustrates representative sequences and metric maps from the pMRI scans of a patient from the study. 28-year-old woman with WHO grade 4 MGMT promoter-methylated GBM (case 8 in Table 2) with perfusion MRI during three time points: baseline and 2- and 6-months (mo) on-adjuvant therapy (Tx) with temozolomide and tumor treating fields (TMZ + TTFields). Representative gadolinium-enhanced T1-weighted (T1 + C), normalized relative cerebral blood volume (nRCBV), metric of blood-brain barrier permeability (Ktrans), time constant for gadolinium reflux from the extravascular extracellular space (EES) back into the vascular system (Kep), volume of EES per unit volume of tissue (Ve × 100 scaling factor), and fractional plasma volume (Vp × 100 scaling factor) color images at each time point are shown. A thresholded nRCBV map superimposed on the T1 + C images (nRCBV-thresholded) is also shown for illustrative purposes (blue voxels = low nRCBV with values ≤1.0, yellow voxels = intermediate nRCBV with values between 1 and 1.75, red voxels = high nRCBV with values ≥1.75).
33
Statistical analysis
For all analyses, statistical significance was defined as p < 0.05. First, for each of the three time points, the actual (“absolute”) values of each pMRI metric were compared between the two groups. Second, the actual (“absolute”) values of each pMRI metric within each group were compared across the three pairs of MRI scan times (baseline vs 2 months, 2 vs 6 months, and baseline vs 6 months). Third, for each pMRI metric, the percent change over the three time periods was calculated: (1) from baseline to 2 months on-adjuvant therapy, (2) from 2 to 6 months on-adjuvant therapy, and (3) from baseline to 6 months on-adjuvant therapy. For each of the three percent-change time periods, the pMRI metrics were compared between the groups.
For a given patient, the therapy may have differed between their baseline to 2-month period and their 2-month to 6-month period (e.g., late addition of TTFields to TMZ, or cessation of therapy, etc.). In such cases where the baseline to 6-month period did not have a consistent therapy throughout, the therapy for this time period was considered as N/A—change in therapy. Therefore, the “indexing” of which therapy period to use for the percent change analyses of the pMRI metrics between the two groups was straightforward. However, the “indexing” of which therapy period to use for comparisons of the absolute pMRI metrics between the two groups was approached differently. For the baseline and 2-month absolute pMRI metric comparisons, the two groups were indexed to the therapy during the baseline to 2-month period. However, for the 6-month absolute pMRI metric comparisons, the two groups were indexed in two separate ways: to the therapy (1) during the 2-month to 6-month period or (2) during the baseline to 6-month period.
For the comparison of patient and pathology characteristics between the treatment groups, Student’s t test was used for age and chi-square test was used for sex, tumor location, and pathology (IDH mutation status and pMGMT methylation status). Due to the small sample size and the pMRI metrics not all being normally distributed as determined by the Shapiro–Wilk test, statistical analyses between the two treatment groups were performed using rank-sum analysis in Stata/MP version 16.1 (College Station, TX). In light of the small sample size, bootstrapped rank-sum analysis (1,000 replicates) of each of the pMRI measurements during each of the three time periods was also performed in Stata/MP version 16.1. The purpose of this was to determine whether there was confidence in the non-bootstrapped rank-sum results, such that we would expect to observe comparable results of statistical significance testing if this study were replicated and/or future prospective studies were performed to corroborate the findings in this study. pMRI metric data are presented in tables as median [interquartile range (IQR)] and in figures as box-and whisker plots (minimum, median, maximum, and IQR) using GraphPad Prism version 9.5.1 (San Diego, CA). Pearson’s correlation analysis was performed in Stata/MP version 16.1 to determine if DSC-MRI-based (rCBV) and DCE-MRI-based (Ktrans) pMRI metrics were correlated with each other.
Results
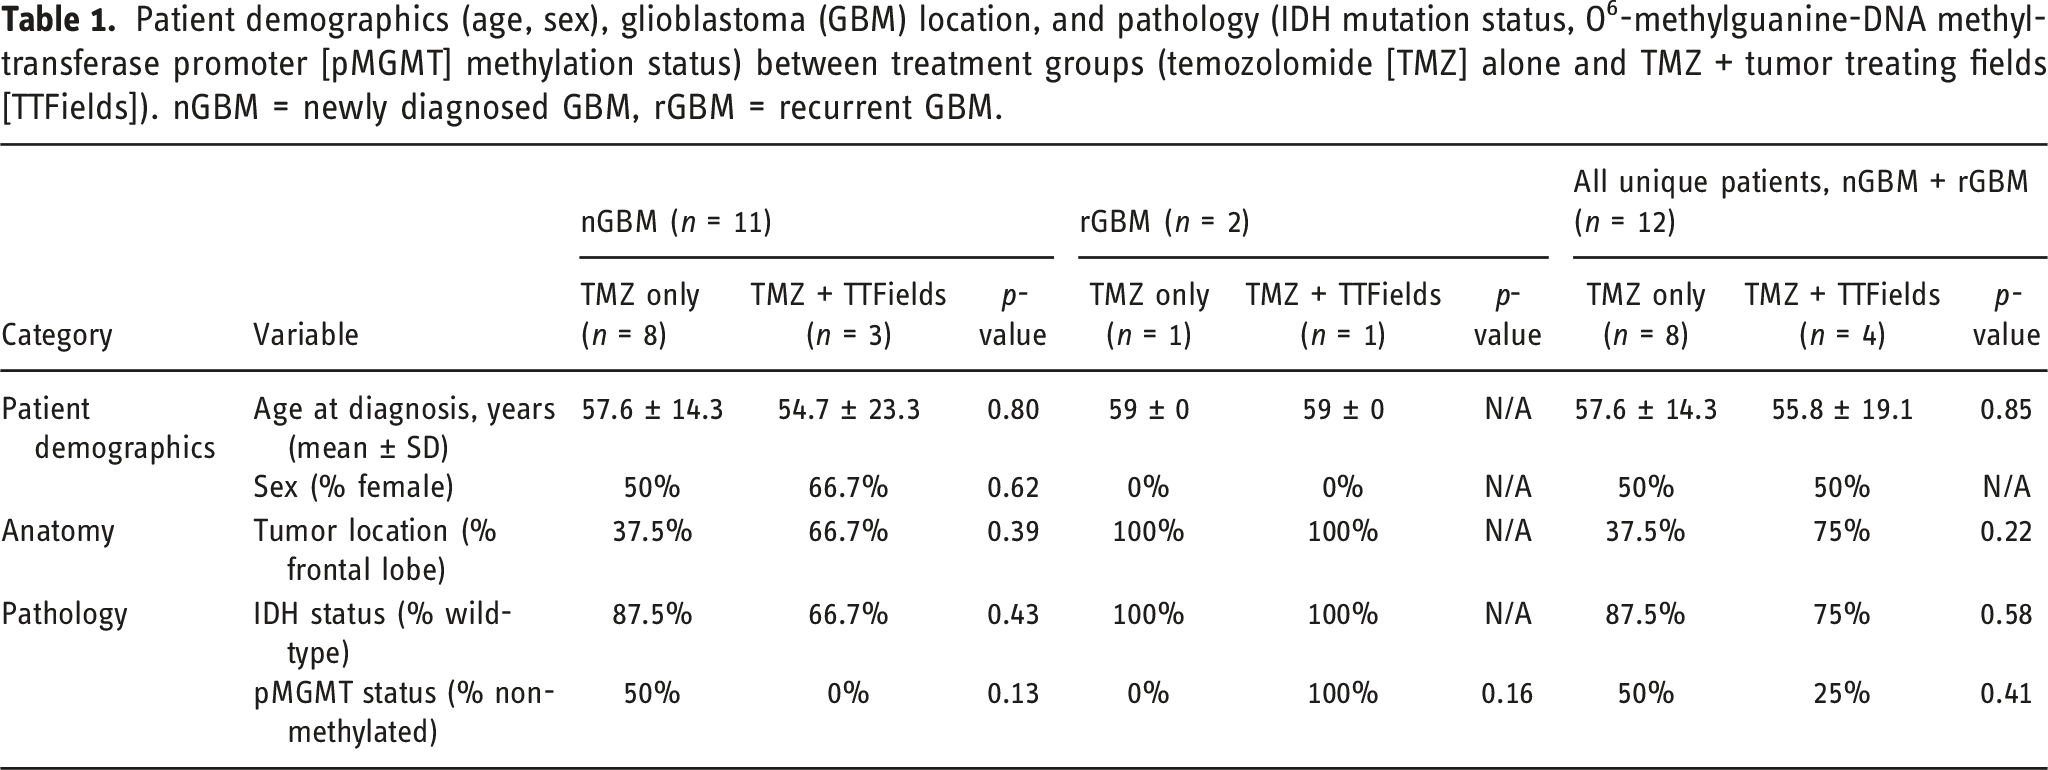
Patient demographics (age, sex), glioblastoma (GBM) location, and pathology (IDH mutation status, O6-methylguanine-DNA methyl-transferase promoter [pMGMT] methylation status) between treatment groups (temozolomide [TMZ] alone and TMZ + tumor treating fields [TTFields]). nGBM = newly diagnosed GBM, rGBM = recurrent GBM.
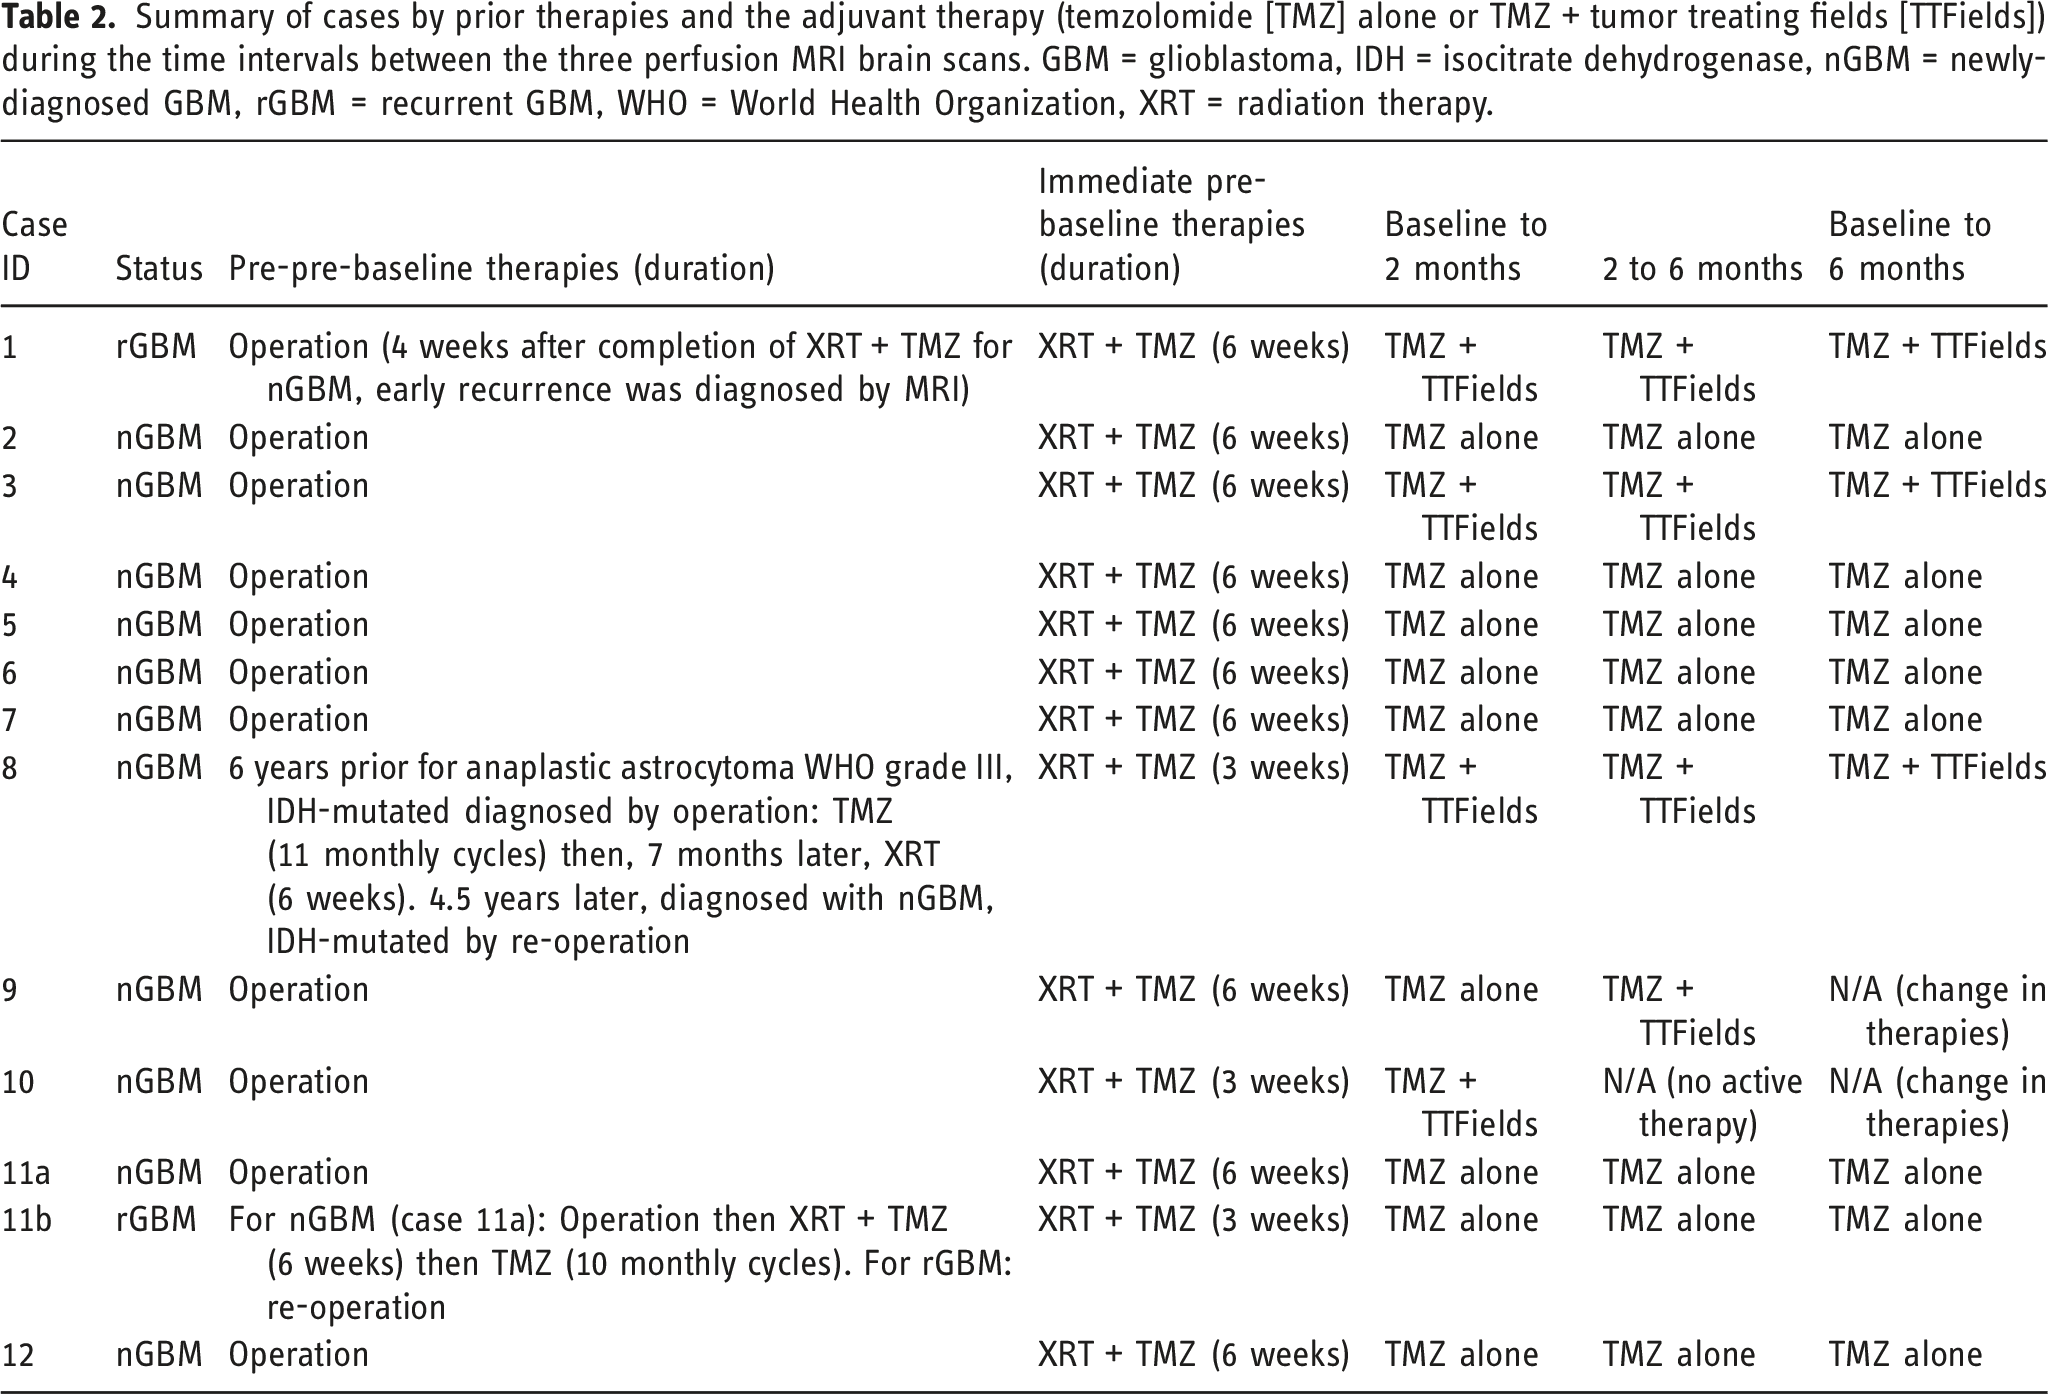
Summary of cases by prior therapies and the adjuvant therapy (temzolomide [TMZ] alone or TMZ + tumor treating fields [TTFields]) during the time intervals between the three perfusion MRI brain scans. GBM = glioblastoma, IDH = isocitrate dehydrogenase, nGBM = newly-diagnosed GBM, rGBM = recurrent GBM, WHO = World Health Organization, XRT = radiation therapy.
Summary of cases by type of therapy during the time intervals between pMRI brain scans while on adjuvant therapy.
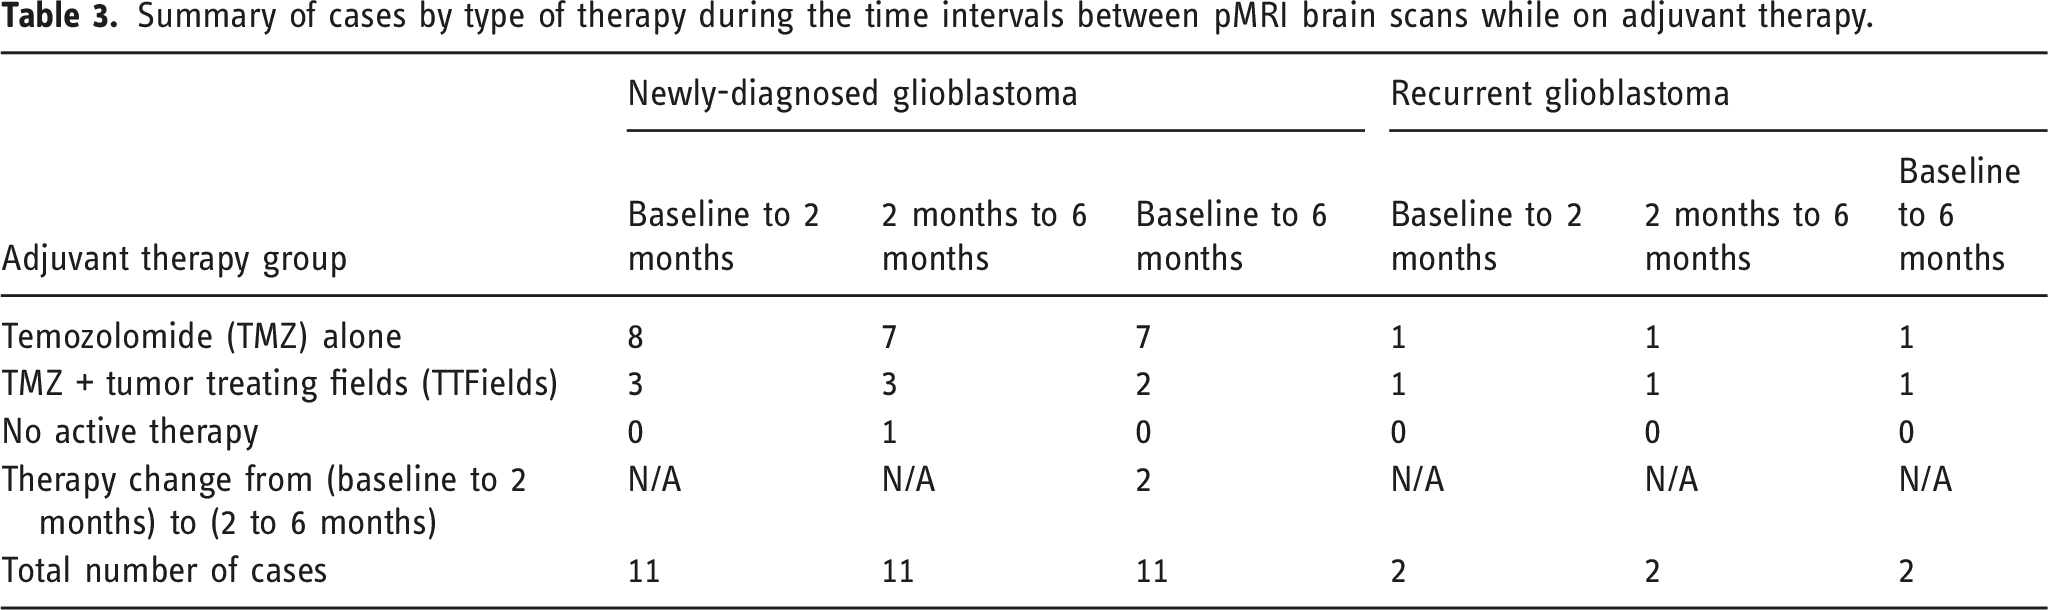
Figure 2 displays the absolute pMRI metrics, indexed to the therapy during the baseline to 2-month period. No significant differences in the absolute pMRI metric values were found between the two treatment groups at any of the three pMRI time points. In addition, there were no significant differences in any of the pMRI metrics within each treatment group, when comparing between the three pairs of time points (baseline vs 2 months, 2 months vs 6 months, and baseline vs 6 months). At the 6-month MRI timepoint, there was a trend in increased Ktrans in patients receiving TMZ + TTFields (0.0058 [0.0173] min-1) compared to TMZ alone (0.0024 [0.0026] min-1), p = 0.0952, when indexed to the therapy the patients received during the 2-month to 6-month period. Supplemental Table 1 summarizes the results of the bootstrapped rank-sum analysis of the absolute pMRI metrics, which corroborated the absence of any significantly different comparisons. When performing in-cohort comparisons of the absolute pMRI metrics between the three pairs of time points (baseline vs 2 months, 2 months vs 6 months, and baseline vs 6 months), indexed to the therapy during the respective time period, there were no significant differences. However, within the TMZ + TTFields cohort, there was a trend in increased Ktrans from the 2-month (0.0036 [0.0014] min-1) to the 6-month (0.0058 [0.0173] min-1) pMRI scan, p = 0.057. Absolute pMRI metrics, indexed to the therapy during the baseline to 2-month period. (a) ΔT1 = difference in tumor volume between post-contrast and pre-contrast T1-weighted MRI sequences, (b) nRCBV = tumor relative cerebral blood volume (RCBV) normalized to the normal contralateral white matter RCBV, (c) sRCBV = standardized tumor RCBV, (d) Ktrans = metric of blood-brain barrier permeability, (e) Kep = time constant for gadolinium reflux from the extravascular extracellular space (EES) back into the vascular system, (f) Ve = volume of EES per unit volume of tissue, (g) Vp = fractional plasma volume. Minimum, interquartile range, median, and maximum data are shown. TMZ = temozolomide, TTFields = tumor treating fields.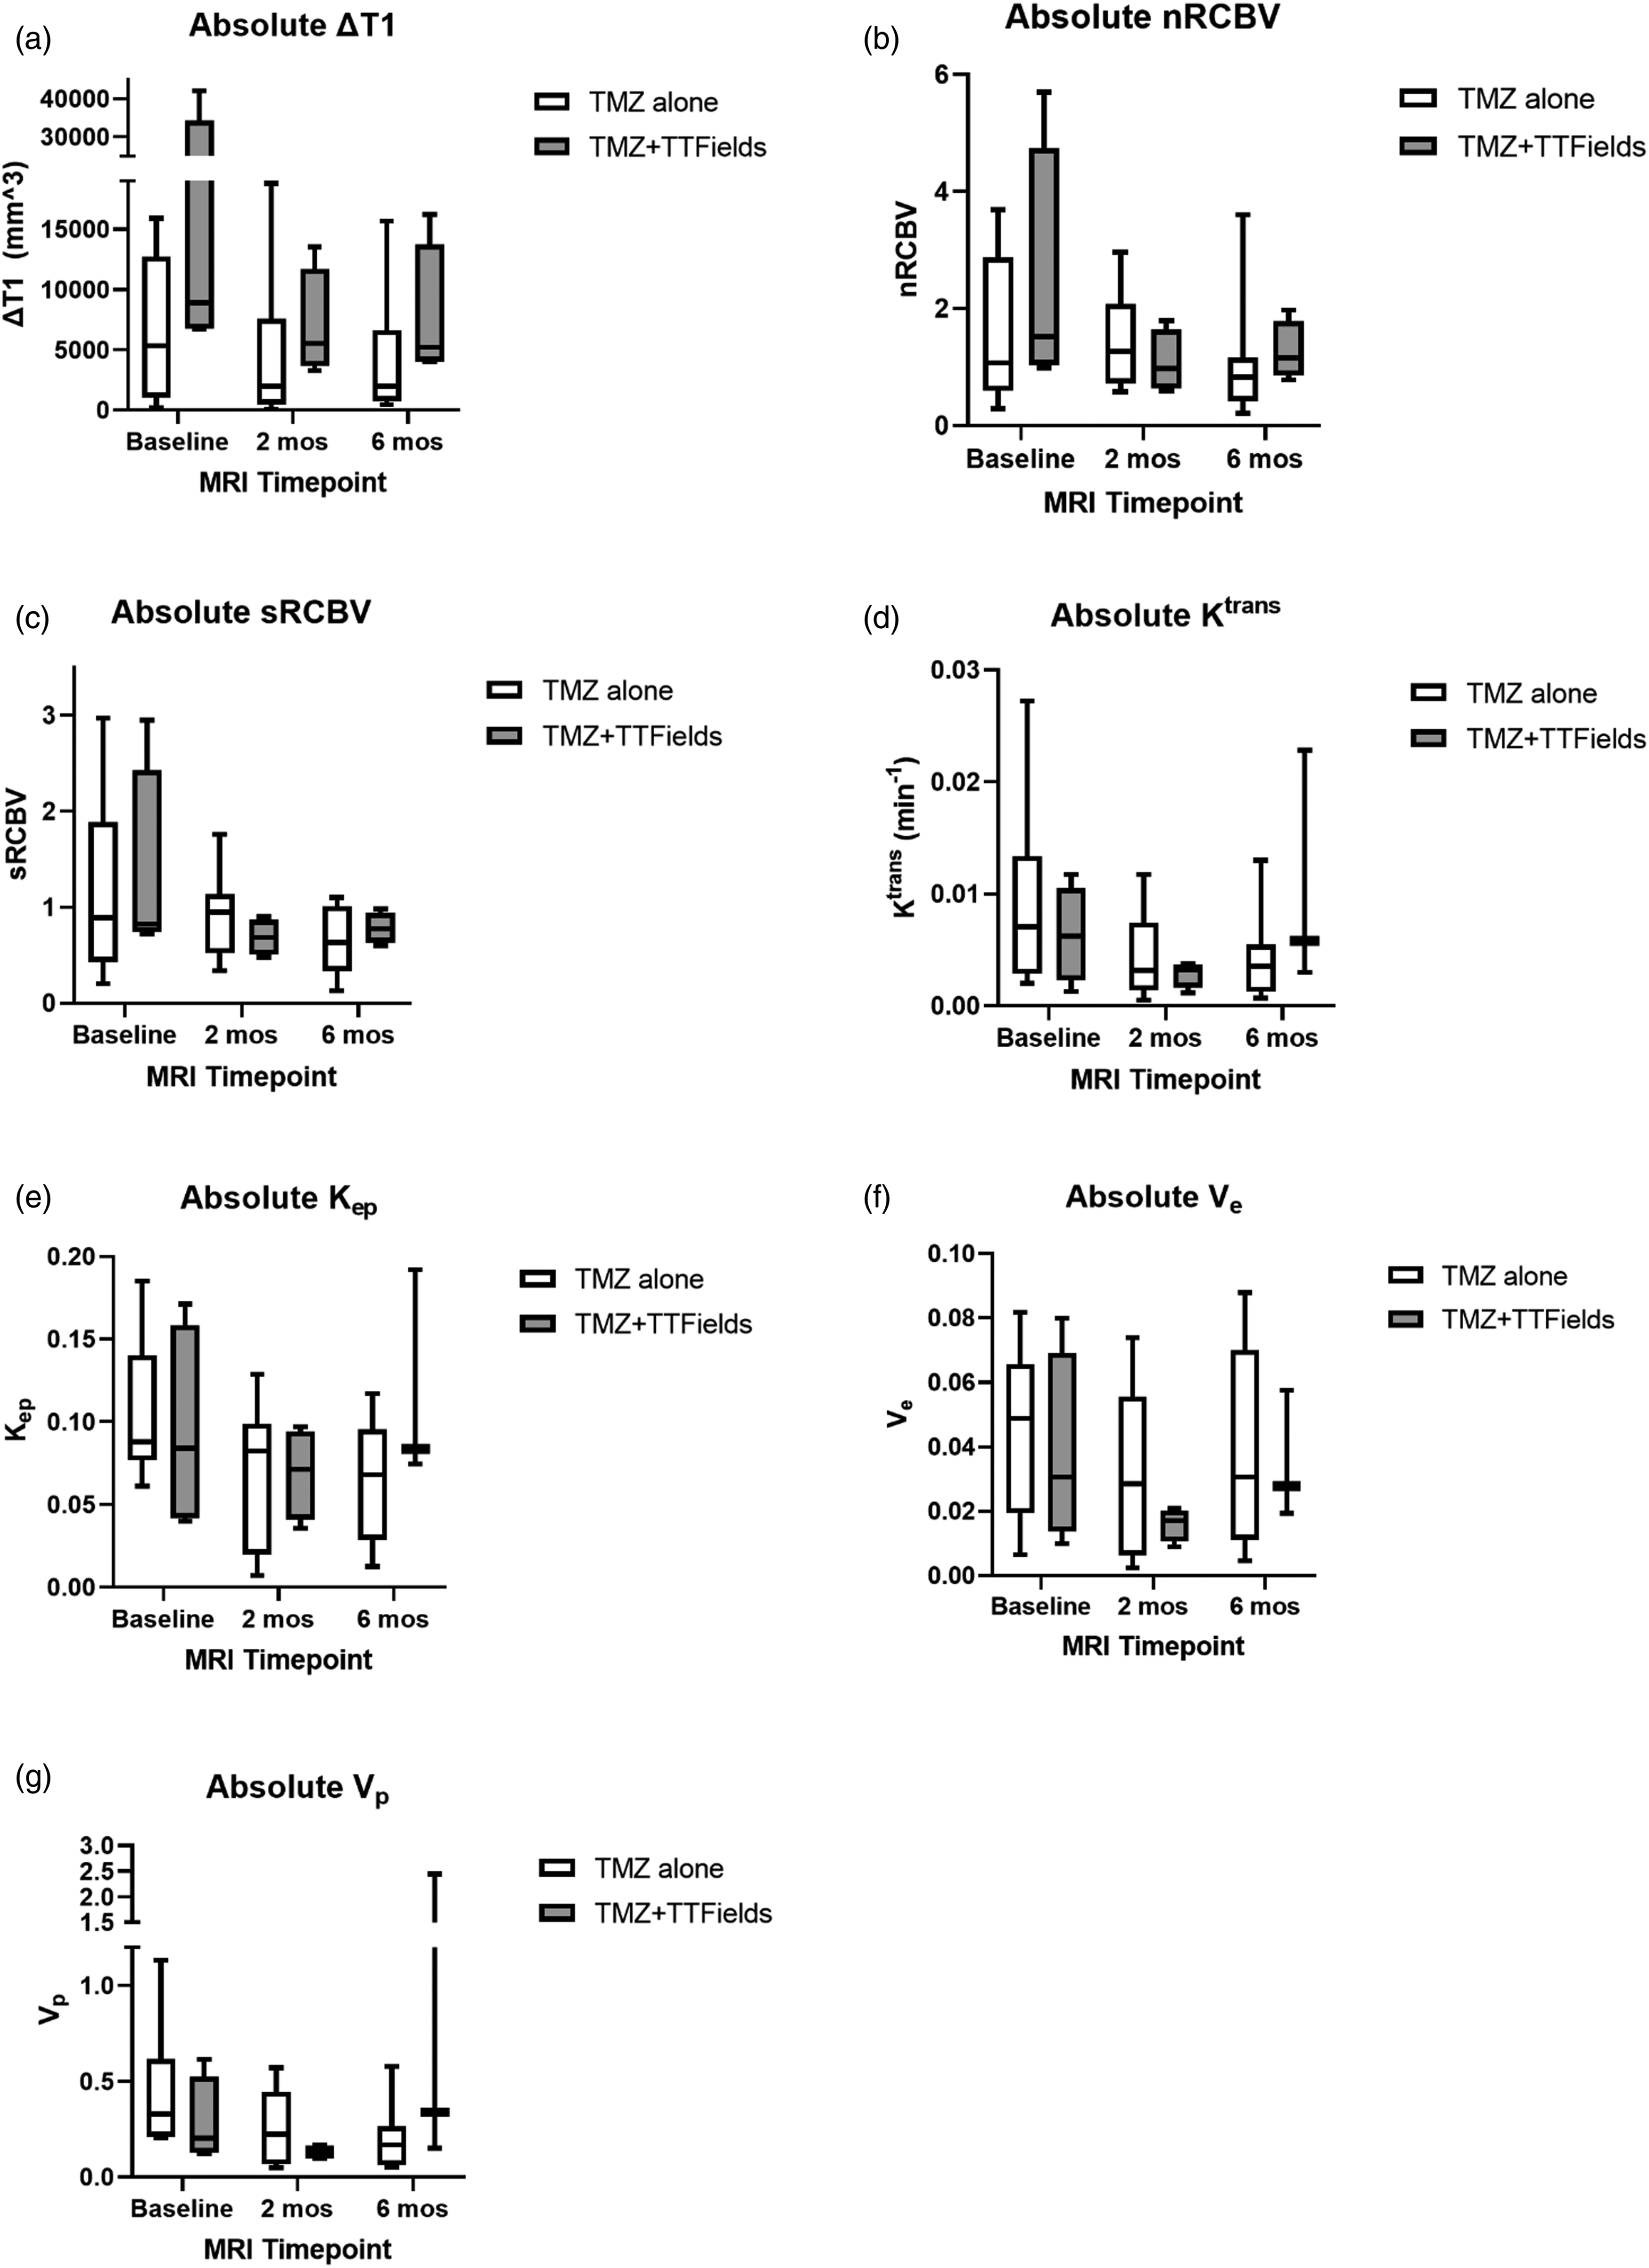
Figure 3 displays the percent change in the absolute pMRI metrics for both treatment groups during the three adjuvant therapy time periods (baseline to 2 months, 2 months to 6 months, and baseline to 6 months). Significant effects of TTFields were identified during the 2-month to 6-month period. Compared to TMZ alone, TTFields + TMZ significantly increased nRCBV (+26.9% [55.1%] vs -39.1% [37.0%], p = 0.049), sRCBV (+9.5% [39.7%] vs -30.5% [39.4%], p = 0.049), Ktrans (+54.6% [1768.4%] vs -26.9% [61.2%], p = 0.024), Ve (+111.0% [518.1%] vs -13.0% [22.5%], p = 0.048), and Vp (+98.8% [2172.4%] vs -24.6% [53.3%], p = 0.024) during this time period. Supplemental Table 2 summarizes the results of the bootstrapped rank-sum analysis of the percent change in the absolute pMRI metrics, which corroborated the presence of the same five significantly different results during the 2-month to 6-month period. Percent change in the absolute pMRI metrics for both treatment groups during the three adjuvant therapy time periods. (a) ΔT1 = difference in tumor volume between post-contrast and pre-contrast T1-weighted MRI sequences, (b) nRCBV = tumor relative cerebral blood volume (RCBV) normalized to the normal contralateral white matter RCBV, (c) sRCBV = standardized tumor RCBV, (d) Ktrans = metric of blood–brain barrier permeability, (e) Kep = time constant for gadolinium reflux from the extravascular extracellular space (EES) back into the vascular system, (f) Ve = volume of EES per unit volume of tissue, (g) Vp = fractional plasma volume. Minimum, interquartile range, median, and maximum data are shown. TMZ = temozolomide, TTFields = tumor treating fields. * indicates p < .05.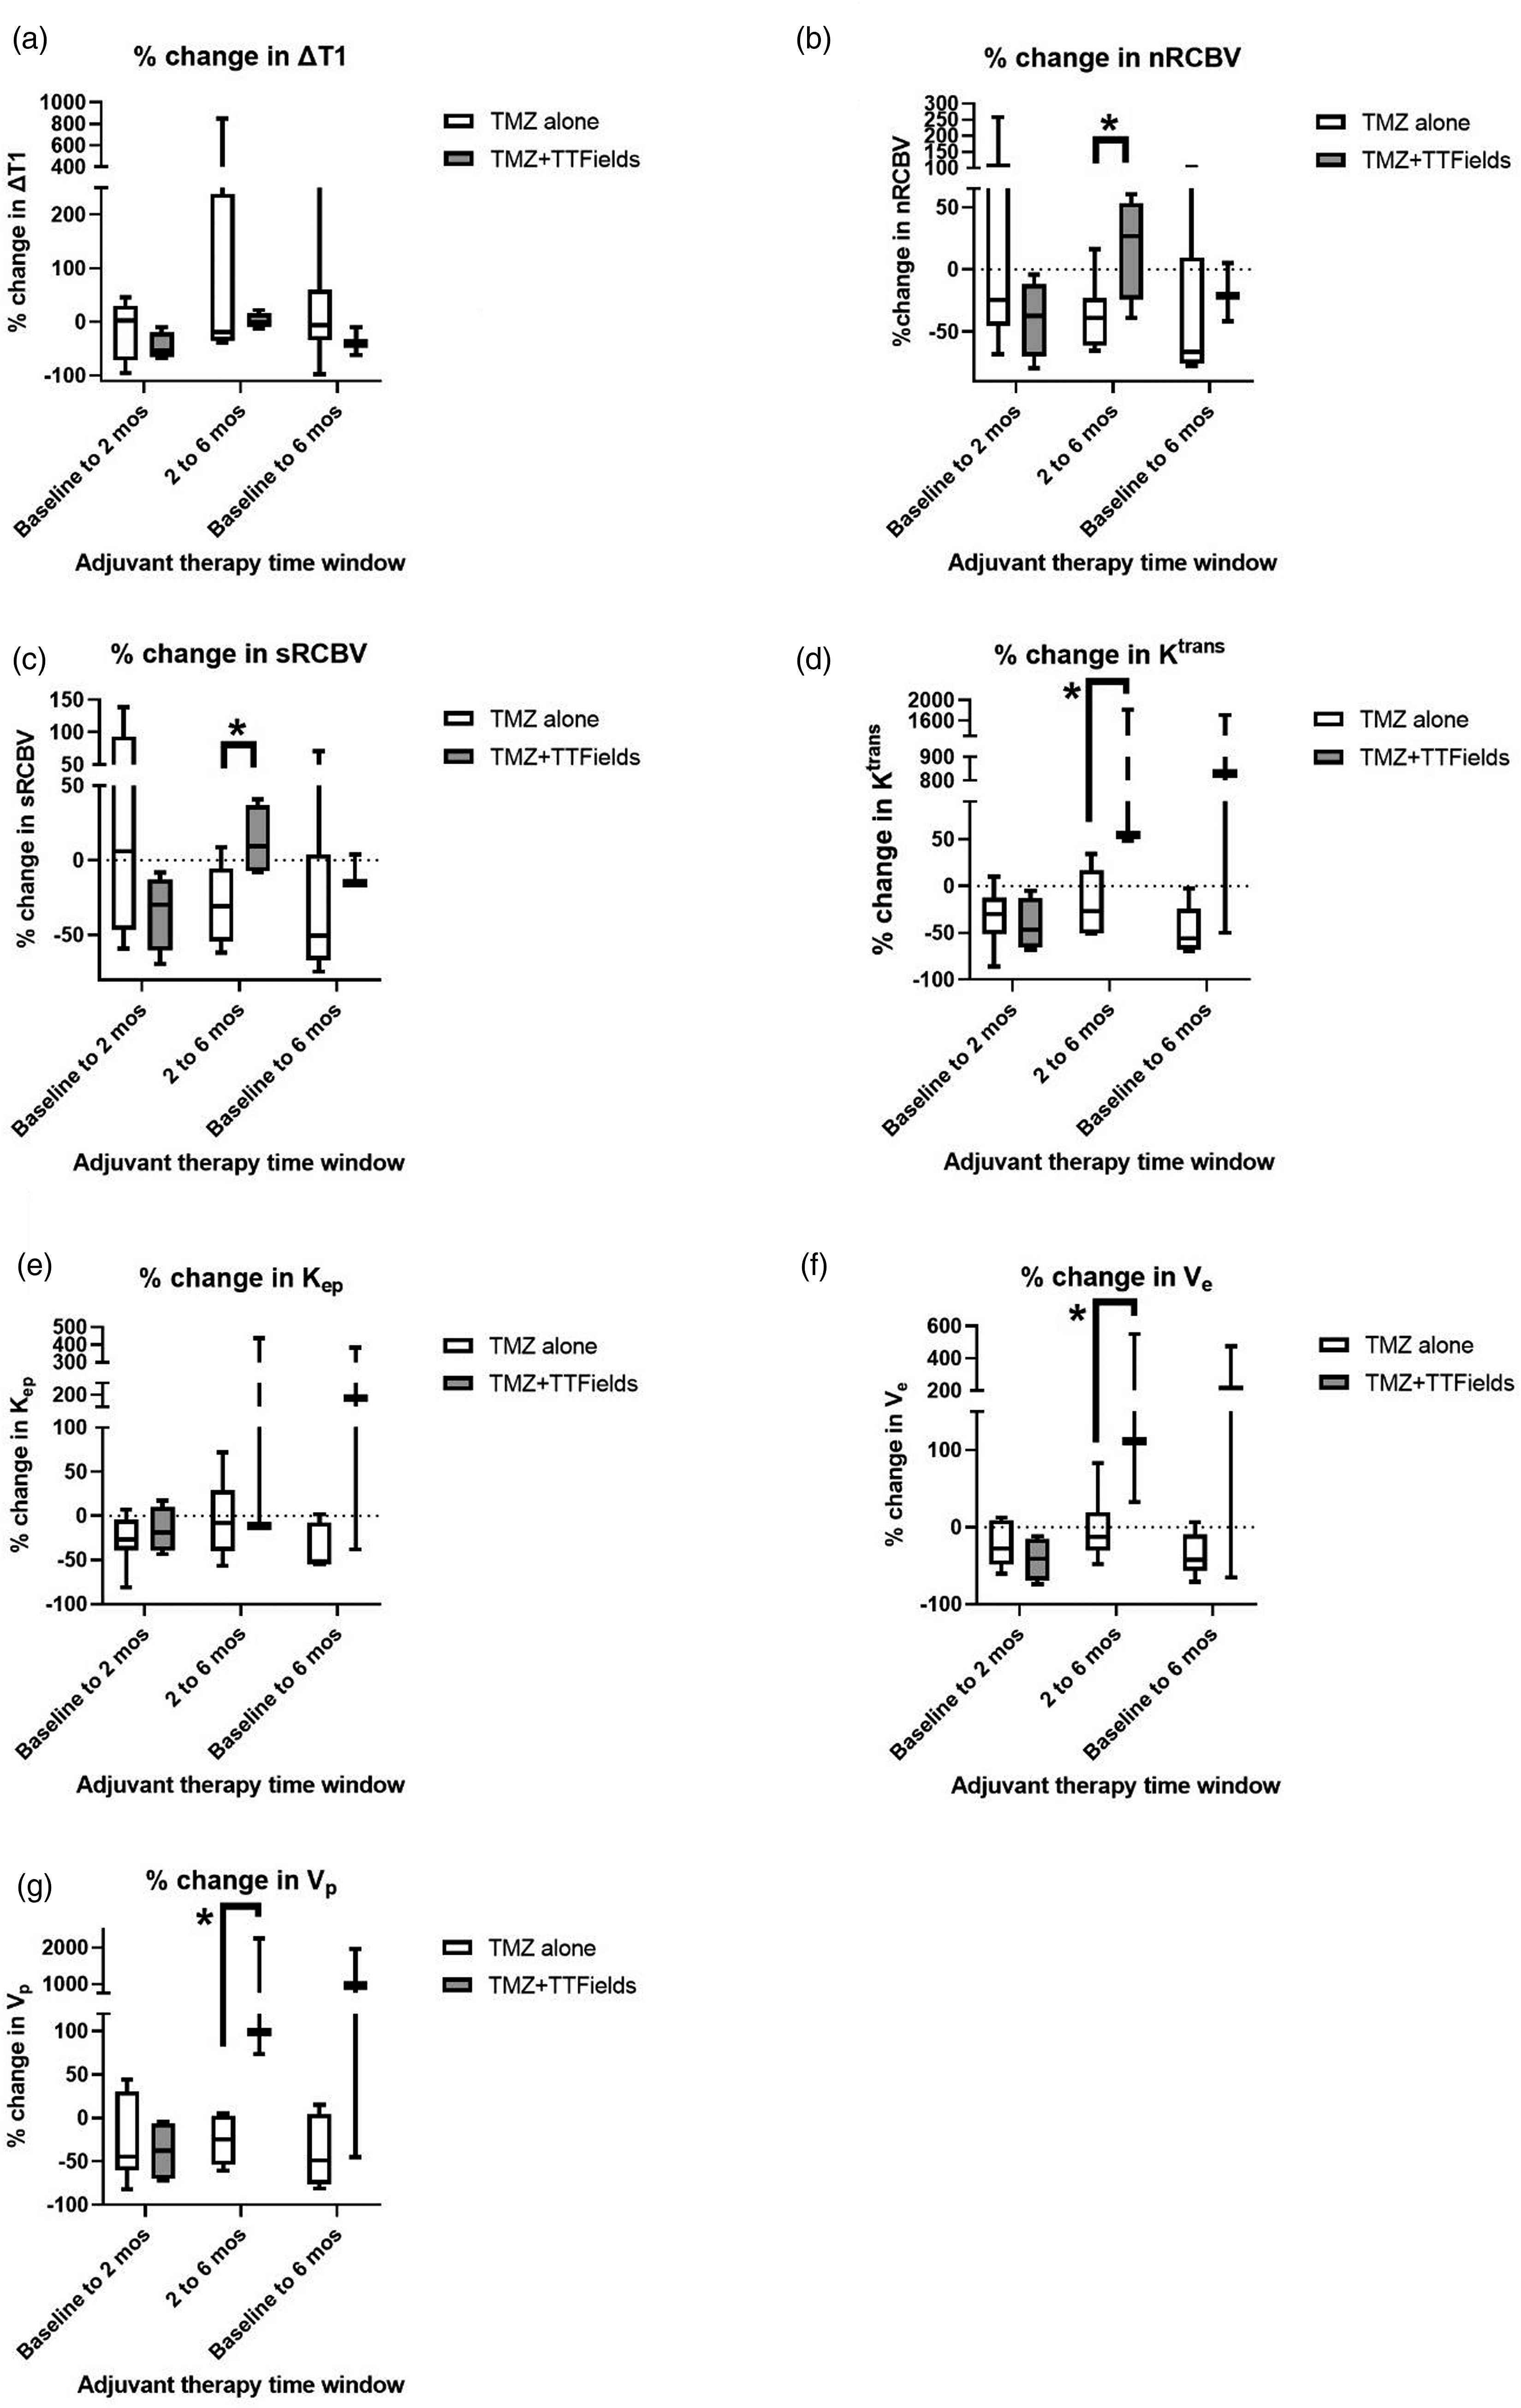
Summary of the significant results (p < 0.05) and trend (p < 0.1) from the comparisons. See Figure 2 (and Supplemental Table 1) and Figure 3 (and Supplemental Table 2) for the complete results. EES = extravascular extracellular space, IQR = interquartile range, Kep = time constant for gadolinium reflux from the EES back into the vascular system, Ktrans = metric of blood-brain barrier permeability, nRCBV = tumor relative cerebral blood volume (RCBV) normalized to the normal contralateral white matter RCBV, pMRI = perfusion MRI, TMZ = temozolomide, sRCBV = standardized tumor RCBV, TTFields = tumor treating fields, Ve = volume of EES per unit volume of tissue, Vp = fractional plasma volume.
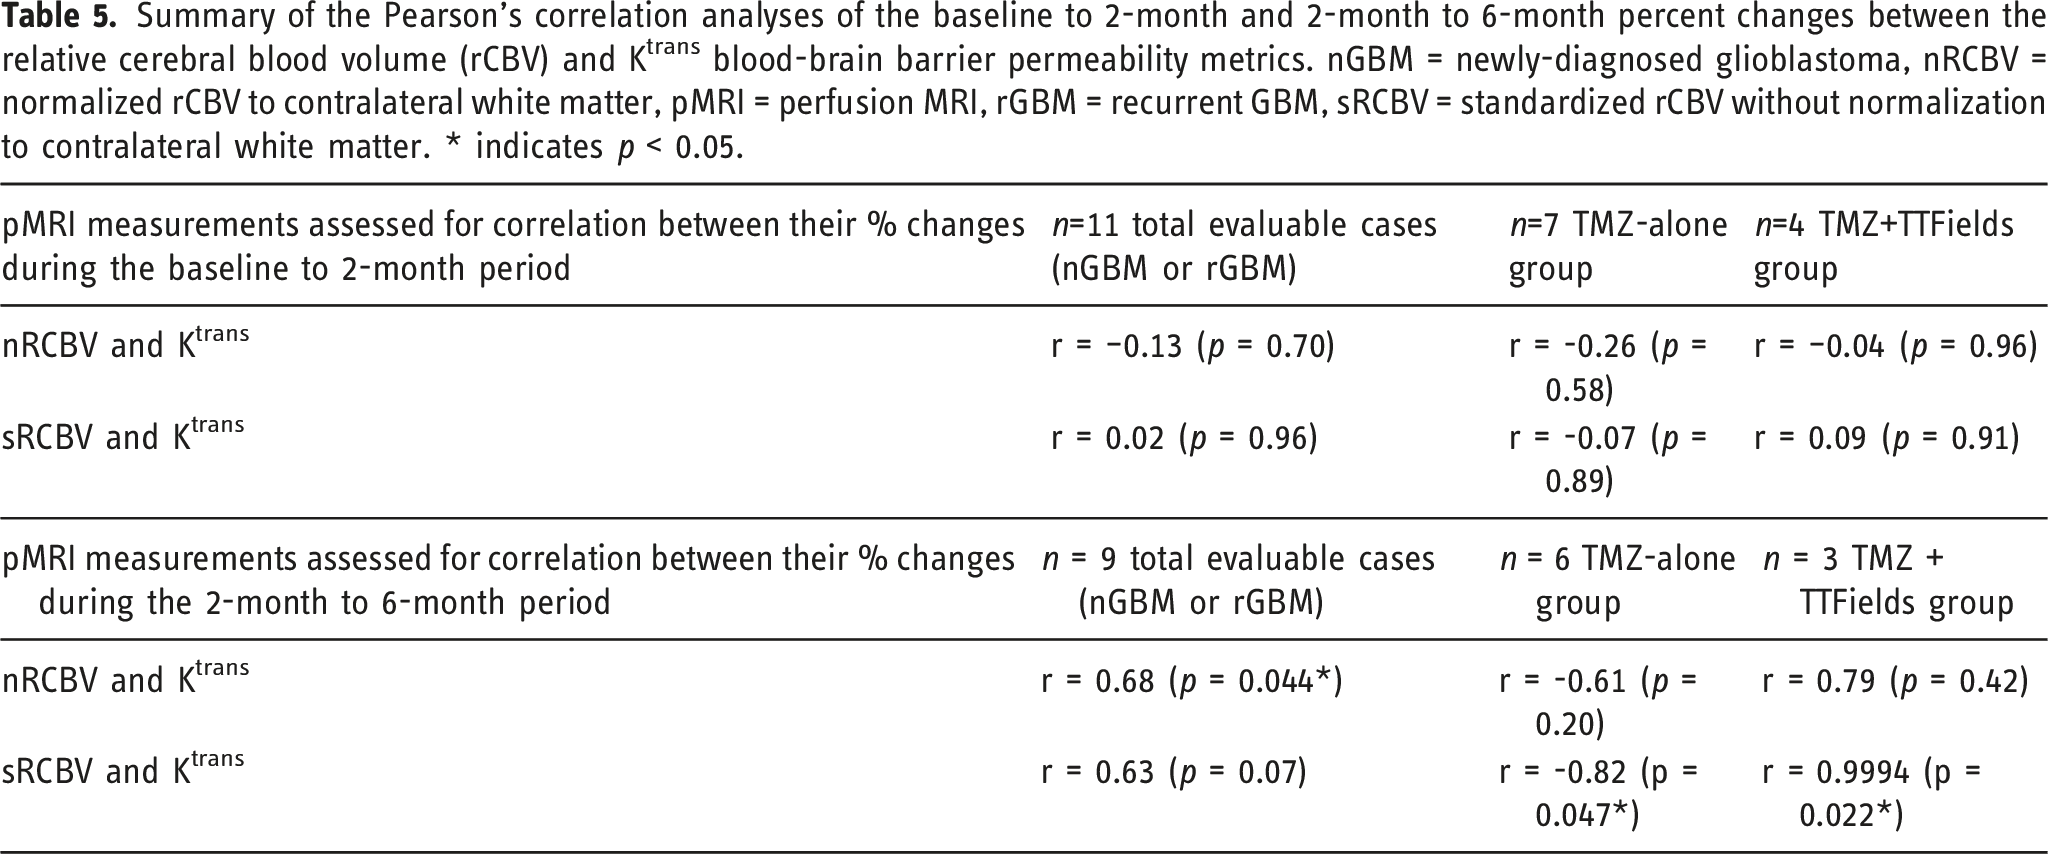
Summary of the Pearson’s correlation analyses of the baseline to 2-month and 2-month to 6-month percent changes between the relative cerebral blood volume (rCBV) and Ktrans blood-brain barrier permeability metrics. nGBM = newly-diagnosed glioblastoma, nRCBV = normalized rCBV to contralateral white matter, pMRI = perfusion MRI, rGBM = recurrent GBM, sRCBV = standardized rCBV without normalization to contralateral white matter. * indicates p < 0.05.
Discussion
This retrospective study is one of the first to quantify the BBB-permeabilizing effect of TTFields in patients with GBM. We aimed to quantify the effects of TTFields on perfusion MRI due to the lack of an imaging biomarker of this therapy’s effects on conventional contrast-enhanced MRI sequences in patients with GBM. A case report of a nGBM patient on 200 kHz TTFields therapy with adjuvant TMZ showed that fractional anisotropy, maximum rCBV, choline/creatine ratio, and tumor volume decreased within the first 2 months on therapy, while mean diffusivity increased. 19 The results of our study demonstrate no significant effect of TTFields on the pMRI metrics within the first 2 months of adjuvant therapy, but rather in the 2-month to 6-month period on-adjuvant therapy. We did not evaluate the effects of TTFields beyond 6 months of adjuvant therapy because the time-to-recurrence was 6-12 months for the majority of patients, at which time their therapies changed.
GBM data from humans (after months of exposure) and animals (after days of exposure) show that TTFields increases blood brain barrier (BBB) permeability as measured by the Ktrans parameter from DCE-MRI 25 and decreases tumor vascularity as measured by the rCBV parameter from DSC-MRI. 19 A brain DCE-MRI study in healthy rats demonstrated that compared to no TTFields exposure, a 3-day exposure to 100 kHz TTFields significantly increased extravasation of intravenous gadolinium into the posterior and middle brain (with TTFields intensities of 2.1 ± 1.2 and 2.7±1.7 V/cm root mean square, respectively) but not into the anterior brain (with TTFields intensities of 1.5 ± 0.6 V/cm root mean square). 25 The permeabilizing effects of TTFields on the BBB were reversed within 4 days of cessation of TTFields exposure. 25 Although 100 kHz was identified as maximally disrupting BBB integrity in cell culture studies via a rho kinase-mediated tight junction claudin-5 phosphorylation pathway, 200 kHz TTFields, the FDA-approved therapy for patients with GBM, was also found to maintain the BBB disruption. 25
We found that the percent change in the DSC-MRI-based and DCE-MRI-based metrics was significantly different between the with versus without TTFields groups during the 2-month to 6-month period, but not during the baseline to 6-month period. This may be due in part to excluding from the baseline to 6-month period analysis the patients whose adjuvant therapy changed between their baseline to 2-month and 2-month to 6-month periods (see Tables 2 and 3). While the exact reason is unknown, this subacute change seen in humans may differ from the more acute changes seen in pre-clinical studies because of differences in BBB properties and composition between human and rodents; for example, human brains have an increased proportion and complexity of neocortical astrocytes compared to rodent brains. 34 Moreover, we found an increase in rCBV during the 2-month to 6-month period in contrast to an earlier case report that showed decreased rCBV in a patient with GBM at 2 months on TMZ + TTFields therapy relative to baseline. 19 An obvious explanation for this discrepancy is the comparison of results from the present case series to that single case report. More importantly, increased rCBV may reflect improved tumor perfusion, potentially related to a synergy with the TTFields-mediated BBB-permeabilizing effects. Increased blood delivery to the tumor may be therapeutically advantageous because it can lead to increased oxygenation and a higher delivery of chemotherapy to the tumor microenvironment. Our findings are in keeping with a recent clinical study, which showed patients with pMGMT-methylated nGBM that exhibited increased rCBV following standard-of-care chemoradiation experienced an increased survival benefit with longer PFS. 35
The effects of TTFields in significantly increasing the percent change (of increase) in rCBV and Ktrans during the 2-month to 6-month period, whereas TMZ-alone resulted in an opposing percent change (of decrease) in the same measurements, is corroborated in Table 5. Notably, there were very weak/weak and non-significant correlations between the percent changes in rCBV and Ktrans in the baseline to 2-month period, whereas there were strong/very strong and significant correlations between the same percent changes in the subsequent time period between 2 months and 6 months. This indicates that continued TMZ-alone after the first 2 months of adjuvant therapy causes a stronger negative correlation between changes in intratumoral blood volume and vessel permeability, but continued TMZ + TTFields after the first 2 months of adjuvant therapy causes an even stronger positive correlation (opposite direction) between changes in these DSC-MRI-based and DCE-MRI-based measurements, respectively. Although this analysis cannot prove a causal relationship between TTFields-induced BBB permeabilization leading to increased intratumoral blood volume, the ongoing temporal effects of continued TTFields exposure are evident. We acknowledge the need for further study, over a longer period of time assessment, to confirm and fully understand the temporal dynamics of these TTFields-induced effects on intratumoral blood volume and blood vessel permeability. One way to differentially probe the effects of TTFields on rCBV and Ktrans could be the safe 36 co-administration of bevacizumab, an anti-angiogenic monoclonal antibody against vascular endothelial growth factor. In n = 11 patients with rGBM, bevacizumab was shown to not significantly change the gradient echo-based CBV from baseline (1.03) to post-bevacizumab day 1 and weeks 2, 4, and 6; the spin echo-based CBV was significantly but transiently decreased from baseline (0.68) to post-bevacizumab day 1 (0.59, p = 0.01), and there were no significant differences at weeks 2, 4, or 6 37 . In the same study, median Ktrans was significantly reduced in a sustained manner from baseline (0.14 min-1) to post-bevacizumab day 1 (0.05 min-1, p < 0.001) and weeks 2 (0.08 min-1, p < 0.001), 4 (0.05 min-1, p < 0.001), and 6 (0.06 min-1, p < .001). 37 In the present study, median Ktrans in the TMZ-alone and TMZ + TTFields groups non-significantly decreased from 0.007 min-1 and 0.0062 min-1 (at baseline), to 0.0032 min-1 and 0.0032 min-1 (at 2 months on-therapy), to 0.0035 min-1 and 0.0058 min-1 (at 6 months on-therapy), respectively. By strongly decreasing Ktrans with bevacizumab in the first 2 months of adjuvant therapy in nGBM, the co-administration of TTFields could then be used to better understand its effects on rCBV (primarily) and Ktrans (secondarily). Because it is not common practice to administer bevacizumab in the first few months of adjuvant therapy in nGBM, such confirmatory studies may be more suitably addressed in patients with rGBM, for whom both bevacizumab 38 and TTFields 11 are clinically-approved.
A survey of 30 primarily US-based GBM physicians (medical neuro-oncologists, radiation oncologists, and neurosurgeons) at the 2019 American Society of Clinical Oncology annual meeting found that 70% believed TTFields is part of the standard-of-care for nGBM; none recommended against TTFields. 16 In the present study, patients with grade 4 glioma, regardless of IDH mutation status, were included in the study as per the 2016 WHO classification for patients with central nervous system tumors. 39 83% of patients in this study had tumors that were IDH wild-type, therefore they would be classified as GBM per the 2021 WHO classification. 40 In this small retrospective study, there was no significant difference between the TMZ-alone and TMZ + TTFields groups with respect to patient age, sex, tumor location, tumor IDH mutation status, or tumor pMGMT methylation status. Patients with nGBM or rGBM were included in this study, given that each patient’s pMRI metrics while on-adjuvant therapy were being compared to their respective baseline values prior to the start of adjuvant therapy. The exclusion of patients with any bevacizumab exposure prior to their baseline pMRI scan or during the entire baseline to 6-month therapy study period, regardless of nGBM or rGBM status, reduced the chances of confounding effects of bevacizumab on (1) access of chemotherapy to the tumor 41 and (2) its aforementioned effects on CBV and Ktrans. Future investigations may evaluate the magnitude of the differential effects of bevacizumab and TTFields on the BBB.
It remains unclear whether the effects of TTFields on pMRI metrics observed in this study persist beyond the 6-month on-adjuvant therapy period. In the phase 3 EF-14 trial, patients in the TMZ + TTFields group were exposed to TTFields for a median duration of 8.2 months (range 0-82 months), with 75% using it with the minimum recommended compliance rate (>18 h/day, i.e., >75% of the time) over the first 3 months on-treatment. 2 Often patients with nGBM on TTFields are counseled to use this therapy in conjunction with their 6-month course of adjuvant TMZ chemotherapy, and the rate of use of TTFields as a monotherapy after completion of adjuvant TMZ chemotherapy is unknown in the post-marketing, real-world setting.
In rats bearing orthotopic syngeneic GBM (day 0), 100 kHz TTFields was applied for 5 days (days 7-11), and paclitaxel (15 mg/kg i.p.) was injected on day 9. 25 This resulted in significantly decreased tumor growth at day 15 in these rats compared to rats treated with TTFields alone, sham (heat) alone, or sham + paclitaxel. 25 In a separate experiment in which a greater dose of paclitaxel was administered on day 9 (25 mg/kg i.p.), there was a significant reduction in cell proliferation (quantified as the Ki67/DAPI ratio on immunofluorescence) in the TTFields + paclitaxel group compared to the TTFields-alone group. 25 This series of experiments suggests that 100 kHz TTFields enhances delivery of paclitaxel across the BBB to reduce tumor growth, but additional studies are needed to ascertain if a survival benefit exists. A phase 2 study of paclitaxel 200 mg/m2 every 3 weeks in 17 chemotherapy-naïve patients with recurrent high-grade glioma demonstrated stable disease in 29% of patients for 4-6 months, without any partial or complete responses. 42
This study had a few important limitations. First, this was a small retrospective study at a single institution, but we provide early results of perfusion MRI response to treatment in this unique patient population. Due to non-normally distributed pMRI metrics and the small sample size, the non-parametric rank-sum statistical test was used. Second, we did not have monthly compliance rates for all the patients in the TTFields group. This prevented a subgroup analysis to determine whether there was a dose-response relationship in regard to correlations between TTFields compliance rate and the absolute pMRI metrics or percent changes of the metrics over time. Third, we acknowledge that pMRI metrics are susceptible to variability in their values, depending on the MRI scanner manufacturer and field strength. However, this is unavoidable in real-time clinical practice with standard-of-care imaging. Future studies should standardize the imaging protocol in a given patient over time. The bootstrapped rank-sum analysis provided support for expecting to observe comparable results of statistical significance testing if this study were replicated. This exploratory study functions as a hypothesis-generating study in human patients with GBM, and future prospective studies designed to confirm these results would certainly need to have more stringent statistical analysis plans to limit the likelihood of Type I error (false positives).
The increased BBB permeability induced by TTFields represents both diagnostic and therapeutic possibilities. From the diagnostic perspective, liquid-based biomarkers (e.g., in the blood) may be able to exit the tumor microenvironment at greater levels into the circulating blood (NCT05383872), which may aid in improved detection in conjunction with advanced techniques such as droplet digital polymerase chain reaction. 43 From the therapeutic perspective, permeabilization of the BBB may enable use of chemotherapeutic agents with greater efficacy against GBM but which do not cross the BBB as well as TMZ (e.g., platinum-based chemotherapies). 44 The approach of disrupting the BBB on a transient basis is being studied with focused ultrasound in patients with rGBM (NCT04528680).45,46
Although TTFields significantly increased the percent change in DSC-MRI-based (nRCBV and sRCBV) and DCE-MRI-based (Ktrans, Vp, and Ve) metrics when added to adjuvant TMZ therapy, it is unclear whether these effects start occurring as soon as baseline to 2 months versus in the 2-month to 6-month period. The appropriate exclusion of patients into this study limited the overall statistical power. Yet, despite the small sample size, the results warrant prospective investigation and validation of a set of imaging biomarkers to monitor response to TTFields therapy in patients with GBM. A larger cohort of patients with versus without TTFields exposure would enable sufficient statistical power to perform adequate sensitivity and specificity analyses to determine whether pMRI-based surveillance of GBM patients on TTFields therapy is indicated.
Supplemental Material
Supplemental Material - Tumor treating fields increases blood-brain barrier permeability and relative cerebral blood volume in patients with glioblastoma
Supplemental Material for Tumor treating fields increases blood–brain barrier permeability and relative cerebral blood volume in patients with glioblastoma by Michael Iv, Lewis Naya, Sajal Sanan, Samuel L. Van Buskirk, Seema Nagpal, Reena P. Thomas, Lawrence D. Recht, Chirag B. Patel. The Neuroradiology Journal.
Footnotes
Acknowledgements
CBP acknowledges support from the American Association for Cancer Research (AACR)-Novocure Career Development Award for Tumor Treating Fields (TTFields) Research (22-20-62-PATE). CBP is a McNair Scholar (05-Patel,Chirag) supported by the McNair Medical Institute at The Robert and Janice McNair Foundation. The content is solely the responsibility of the authors and does not necessarily represent the official views of the AACR or The Robert and Janice McNair Foundation.
Declaration of conflicting interests
he author(s) declared the following potential conflicts of interest with respect to the research, authorship, and/or publication of this article: CBP is a co-inventor on patents with Novocure, Ltd. related to TTFields and has served as a consultant and on advisory boards with Novocure, Ltd. CBP declares research support from the AACR-Novocure Career Development Award for TTFields Research (22-20-62-PATE).
Funding
The author(s) disclosed receipt of the following financial support for the research, authorship, and/or publication of this article: This work was supported by the McNair Scholars program of the McNair Medical Institute at The Robert and Janice McNair Foundation (05-Patel,Chirag) and the American Association for Cancer Research (AACR)-Novocure Career Development Award for Tumor Treating Fields (TTFields) Research (22-20-62-PATE).
Correction (November 2023):
Article has been updated with grammatical errors since its original publication.
Supplemental Material
Supplemental material for this article is available online.
Appendix
References
Supplementary Material
Please find the following supplemental material available below.
For Open Access articles published under a Creative Commons License, all supplemental material carries the same license as the article it is associated with.
For non-Open Access articles published, all supplemental material carries a non-exclusive license, and permission requests for re-use of supplemental material or any part of supplemental material shall be sent directly to the copyright owner as specified in the copyright notice associated with the article.