
Abstract
Background
The aim of this study was to evaluate the reproducibility and clinical value of the novel single-shot T1 mapping method for rapid and accurate multi-slice coverage of the whole brain, described by Wang et al. 2015.
Methods
At a field strength of 3 Tesla, T1 mappings of 139 patients (51 of them without pathologic findings) and two repeats of five volunteers were performed at 0.5 mm in-plane resolution. Mean T1 values were determined in 18 manually segmented regions-of-interest without pathologic findings. Reproducibility of the repeated scans was calculated using mean coefficient of variations. Pathologies were grouped and separately evaluated.
Results
The mean age of the cohort was 49 (range 1–95 years). T1 relaxation times for ordinary brain and pathologies were in accordance with the literature values. Intra- and inter-subject reproducibility was excellent, and mean coefficient of variations were 2.4% and 3.8%, respectively.
Discussion
The novel rapid T1 mapping method is a reliable magnetic resonance imaging technique for identifying and quantifying normal brain structures and may thus serve as a basis for assessing pathologies. The fast and parallel online calculation enables a comfortable use in everyday clinical practice. We see a possible clinical value in a large spectrum of diseases, which should be investigated in further studies.
Background
As early as 1994, Steen et al. 1 indicated that quantitative magnetic resonance imaging (MRI) techniques may offer objective clinical information which is unavailable by conventional “weighted” images. The importance of quantitative imaging will increase step by step over the next years, as it not only facilitates the automated processing of images by neural networks and other programs but can also create new diagnostic criteria through easier comparability of patients. Quantitative mappings objectively describe the tissue characteristics and enables—similar to the Hounsfield units in computed tomography—a definition of standard values.
T1 mapping is one of the MRI techniques for detecting and quantifying biologic tissue, 2 and a variety of T1 methods have been reported for studying the human brain. 3 Most of them are computationally intensive, slow, and therefore not practicable for clinical applications.
In the 1940s, Hahn and Drain4,5 laid the basis for research and set the gold standard for accurate measurements of T1 values using inversion recovery. Steen1,6 first applied these measurements in the human brain in the 90s. Over the years, in parallel with the advancement of hardware, several methods for a faster determination have been developed. In 2001, Clare 7 developed a T1 mapping based on multiple slice echo-planar imaging. Zhu presented in 2005 an approach using Inversion Recovery Fast Spin Echo Imaging. 8 Gai 9 demonstrated an algorithm for computing T1 mapping using Modulated Repetition Time Look-Locker in 2009. In the same year, Preibisch 10 presented a technique for creating T1 mappings using Spoiled FLASH With Varying Flip Angles. Barral 11 introduced another technique in 2010.
However, most of these methods have only been validated on the phantom and on a few volunteers. Stikov 12 showed in 2014, different results on the accuracy in vivo for a bundle of T1 techniques.
More recently, a novel single-shot method for rapid and accurate T1 mapping of the human brain at high spatial resolution has been described by Wang et al. 2015. 13 This method was not yet evaluated in clinical practice of adult brains and pathologic findings. A recent publication demonstrated the potential for pediatric brains. 14
The purpose of this work was to evaluate (1) the reproducibility and (2) feasibility of this fast method for whole-brain T1 quantification of normal brain structures at a field strength of 3 T and (3) the potential for providing additional diagnostic value in clinical practice.
Materials and methods
Participants
T1 mappings of three separate groups of individuals were retrospectively evaluated, patients with and without pathologies and a control group of five volunteers. All MR scans were performed between 01/01/2020 and 12/31/2020.
We searched in our local Picture Archiving and Communication System (PACS) for cranial MRIs with T1 mapping performed in the mentioned interval, so the only inclusion criterion was a valid T1 mapping. The search revealed 144 patients (inpatients and outpatients). The only exclusion criterion was strong (movement) artifacts, which occurred in five patients. Finally, we included 139 patients.
Medical reports and discharge letters were evaluated, and the patients were grouped by tentative diagnosis confirmed/pathology found and no pathology found. For the sake of simplification, we did not classify minor pathologies without a certain disease value (Fazekas 1 in patients over 40 years of age) and age-related changes (global brain involution in older patients) as pathologies. We found pathologic changes in 88 patients, 51 were “normal findings”.
Additionally, five healthy volunteers gave written consent before participating in the study. We performed two repetitive scans in a time interval of 4 weeks to assess the reproducibility.
Contrast agent
We administered contrast agent to patients with a clinical indication, for example, staging MRI in case of known cancer, brain tumor, and clinical active multiple sclerosis. We performed T1 mappings with contrast agent in 42 of 88 patients with pathologies, respectively, in 17 of 51 patients with “normal findings”.
T1 mapping
The novel T1 mapping 13 represents a single-shot inversion-recovery (IR) experiment with a highly undersampled radial fast low-angle shot (FLASH). Reconstruction of the set of serial images describing the IR process is accomplished by regularized nonlinear inversion, while final T1 maps are obtained by pixelwise fitting.
All our measurements were performed on a commercial 3 T MRI system (Magnetom Prisma fit, Siemens Healthineers, Erlangen, Germany) with a 20-channel head/neck coil and a GPU-based bypass computer for “almost” online computation. T1 mapping was performed at 0.5 mm in-plane resolution within 4 s per slice. Whole-brain scan times were 1:55 min and 2:36 min for a slice thickness of 4 mm and 3 mm, respectively. At this stage, the online reconstruction of T1 maps required about 8 min. Figure 1 shows a sample T1 map. T1 maps of a female subject (transversal 4-mm slices). The bar on the right shows the grey scale representing the T1 relaxation times (in ms) from 0 to 4096.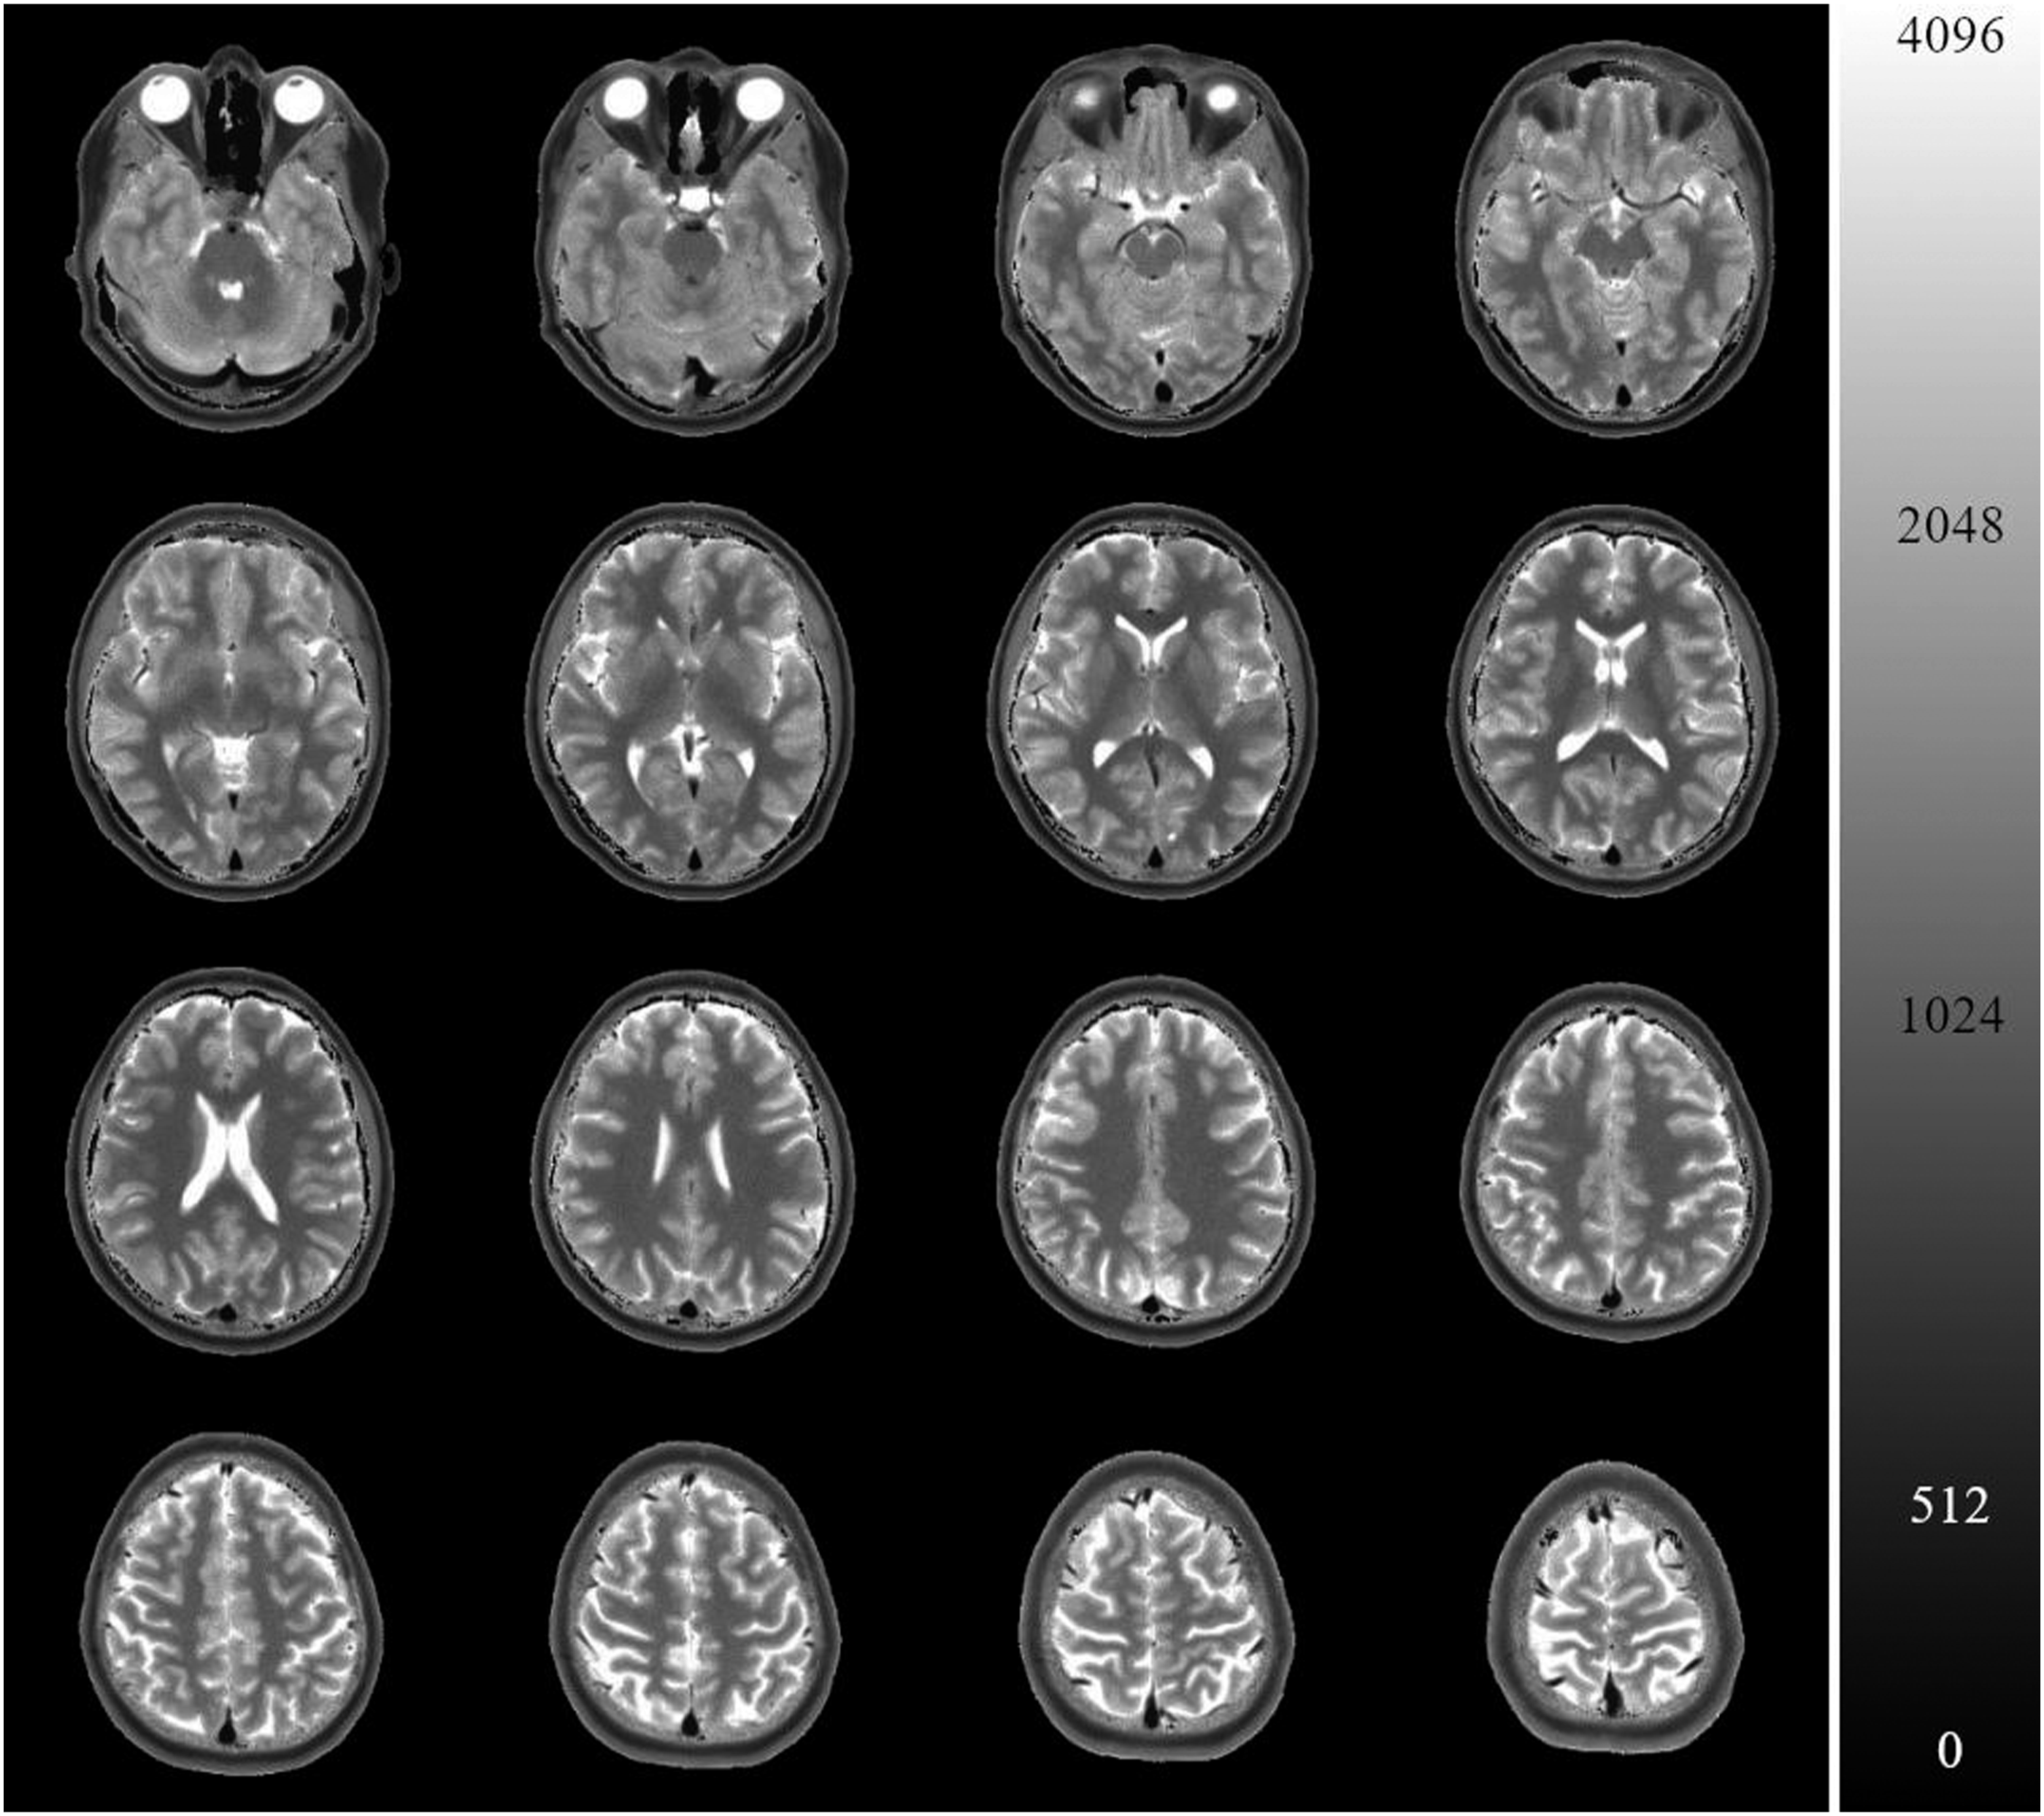
T1 mappings of the literature
We did a PubMed (“https://pubmed.ncbi.nlm.nih.gov/”) search for “T1 mapping brain”. Only 50 of 2000 initial results presented a T1 mapping technique. We scanned the publications for in vivo results. Only presented techniques for 3T with mean values and standard deviations of at least four different brain regions were included.
Segmentation and measurements
Experienced neuroradiologists segmented 18 regions-of-interest (ROIs) within the skull and brain manually, as demonstrated in Figure 2. Centricity™ PACS RA1000 Workstation (GE Healthcare, Chicago, Illinois, USA) was used for measurements. We calculated mean and standard deviation (SD). In case of bilateral measurements, the arithmetic average value of both (mean and SD) is denoted in the following. Sample definition of regions-of-interest. Green: frontal white matter, red: genu of the corpus callosum, yellow: caudate nucleus, blue: thalamus, lilac: putamen, brown: splenium.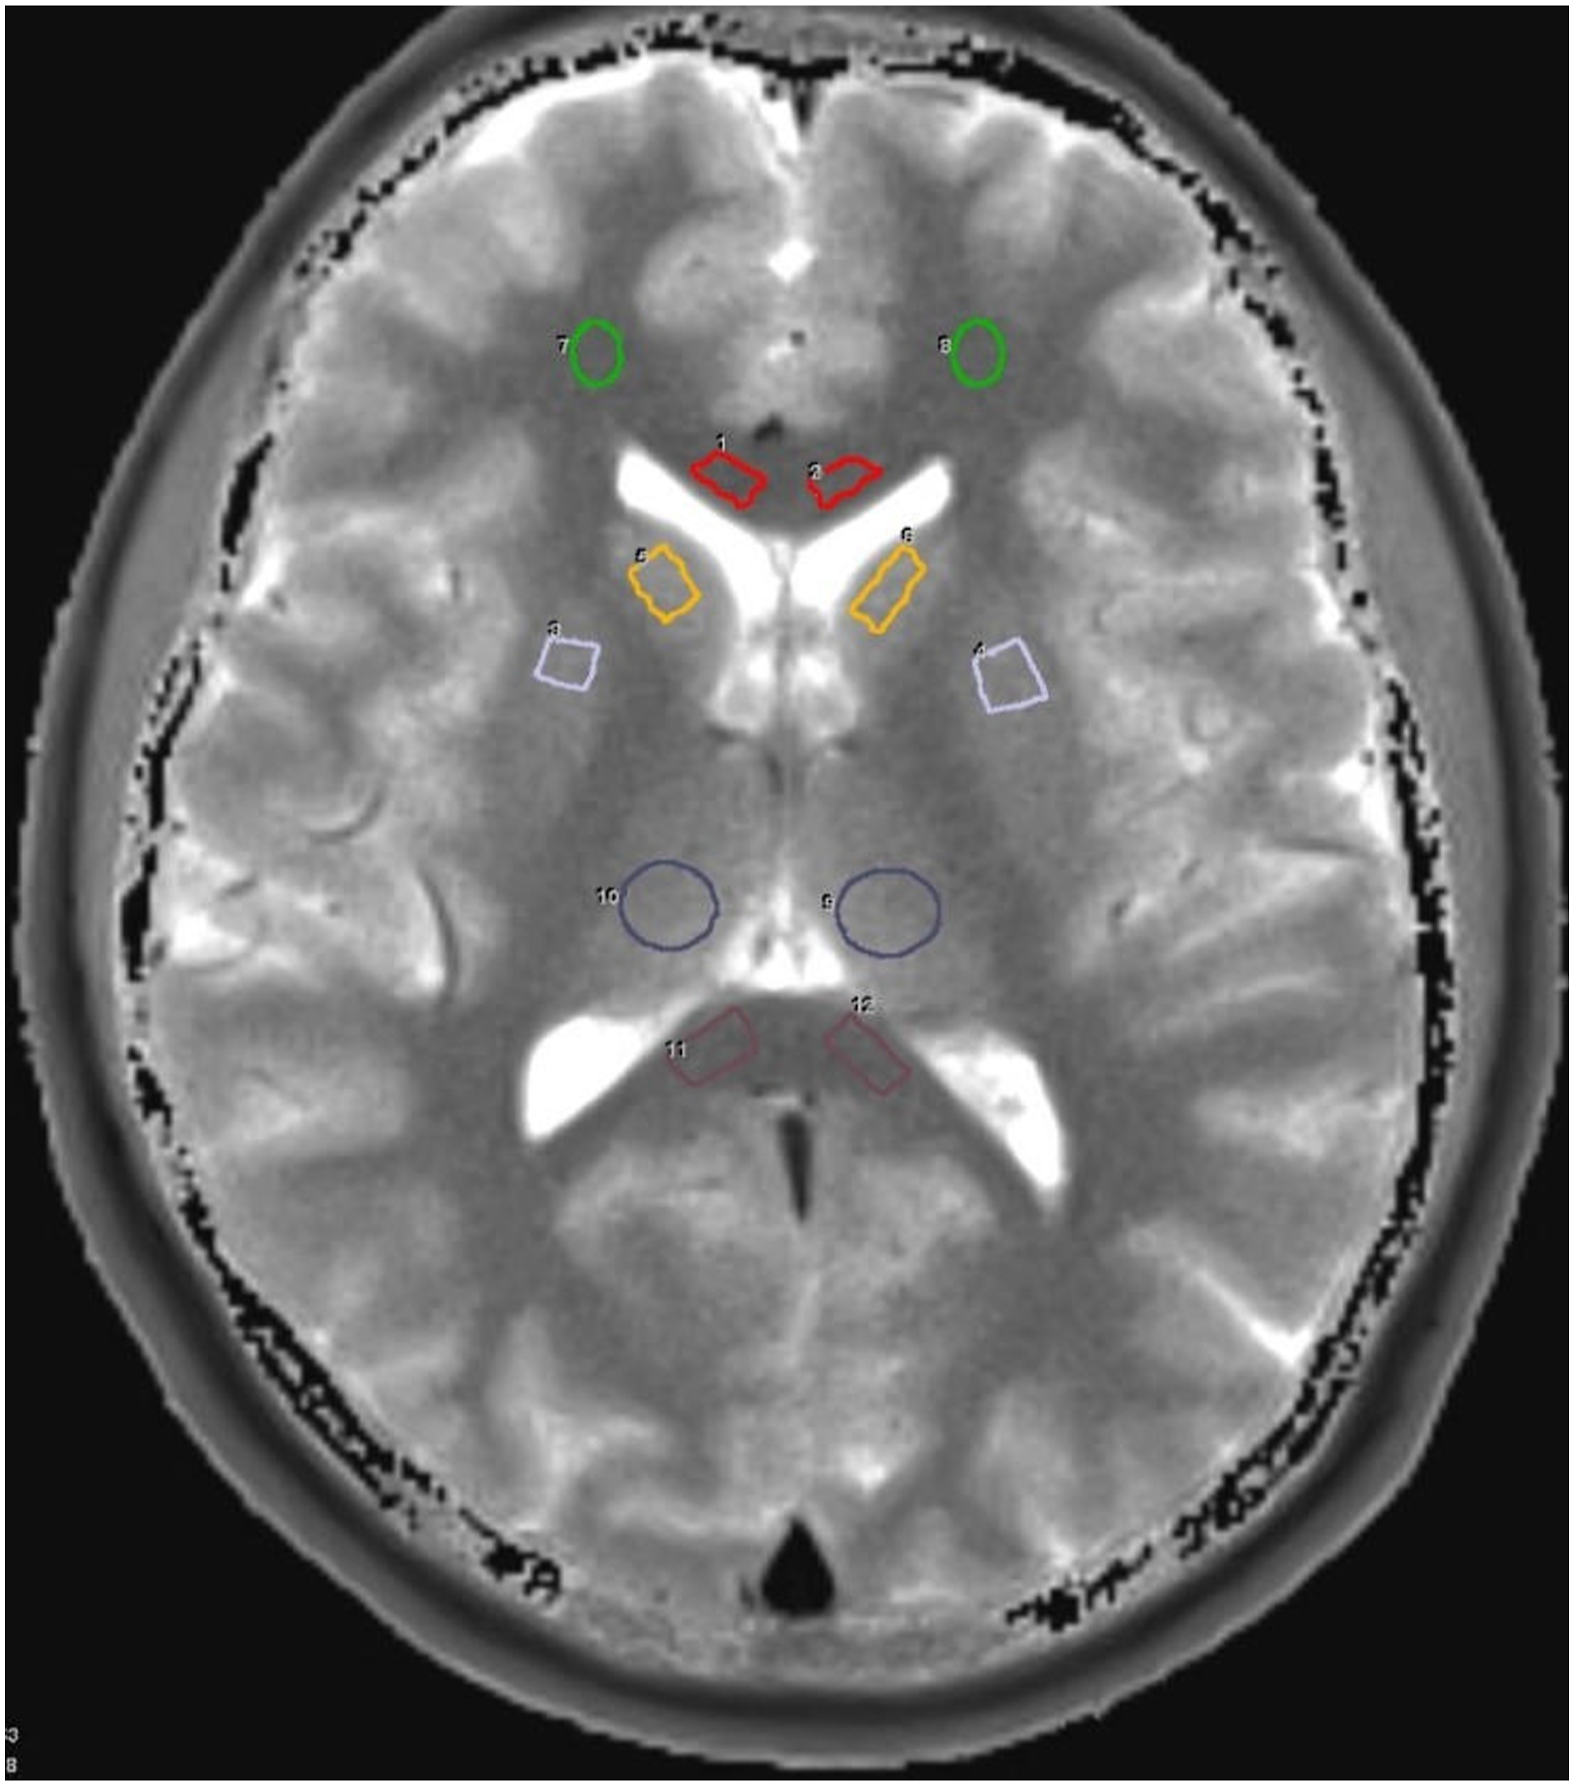
ROIs were defined in frontal grey matter (GM), frontal and parietal white matter (WM), putamen, thalamus, caudate nucleus, pons, cerebellar cortex, dentate nucleus, substantia nigra, red nucleus, genu of the corpus callosum, splenium, internal capsule, globus pallidus, superior sagittal sinus, transverse sinus, internal carotid artery (ICA), skullcap, and temporal muscle. We segmented corresponding ROIs in the left and right hemisphere separately. This strategy should avoid measurements errors, and we checked the T1 mapping for an asymmetric distribution of values, which did not occur.
Reproducibility
To assess reproducibility, two scans of each volunteer were performed in two different sessions with at least one-day interval in-between.
We evaluated test–retest reproducibility by T1 subtraction maps, which were noise corrected using 3 × 3 median filtering. This was necessary to eliminate artificial (pixel) outlier that occurs sporadically and is not observable by the human eye. We performed no other smoothing. Additionally, within-subject variability was assessed with comparing test versus re-test scans. The coefficients of variation were calculated. Since no other T1 mapping techniques were applied, no comparison against another model was performed.
Statistical analysis
Statistica, version 13 (TIBCO Software Inc., Palo Alto, California, USA) was used for statistical analyses. To check if the results of the novel T1 mapping are comparable to the literature values, a paired t-Test was performed. An additional t-Test for 10 patients (12 brain regions) without pathological findings was performed to check the hypothesis that left and right sides in normal brain differ. The significance level was set to 5%.
Results
Participants
In 88 patients (43 female) with a T1 mapping, pathologic findings were observed. 44 of them received contrast agent by manual intravenous injection. The mean age of this cohort was 56 ± 18 years (range 1–93 years).
Individual T1 mappings of 51 patients (46.9 ± 24.2 years, range 3–95 years, 23 females) without pathologic findings were evaluated, 17 of them with contrast agent.
Two repetitive, non-contrast-enhanced T1 mappings were performed for five volunteers with a mean age of 33.5 ± 3.8 years (mean ± standard deviation, range 29–38, two females).
T1 relaxation times of normal brain tissue
T1 relaxation times (ms, mean ± SD) of (healthy) brain regions. (1) Our results 3-Tesla (Wang 2015), (2) Spoiled FLASH with Varying Flip Angles 3-Tesla (Preibisch 2009), (3) 4-ETL TESO-IRFSE 3-Tesla (Zhu 2005), and (4) 1.5-Tesla PAIR—young adults only (Steen 1997).
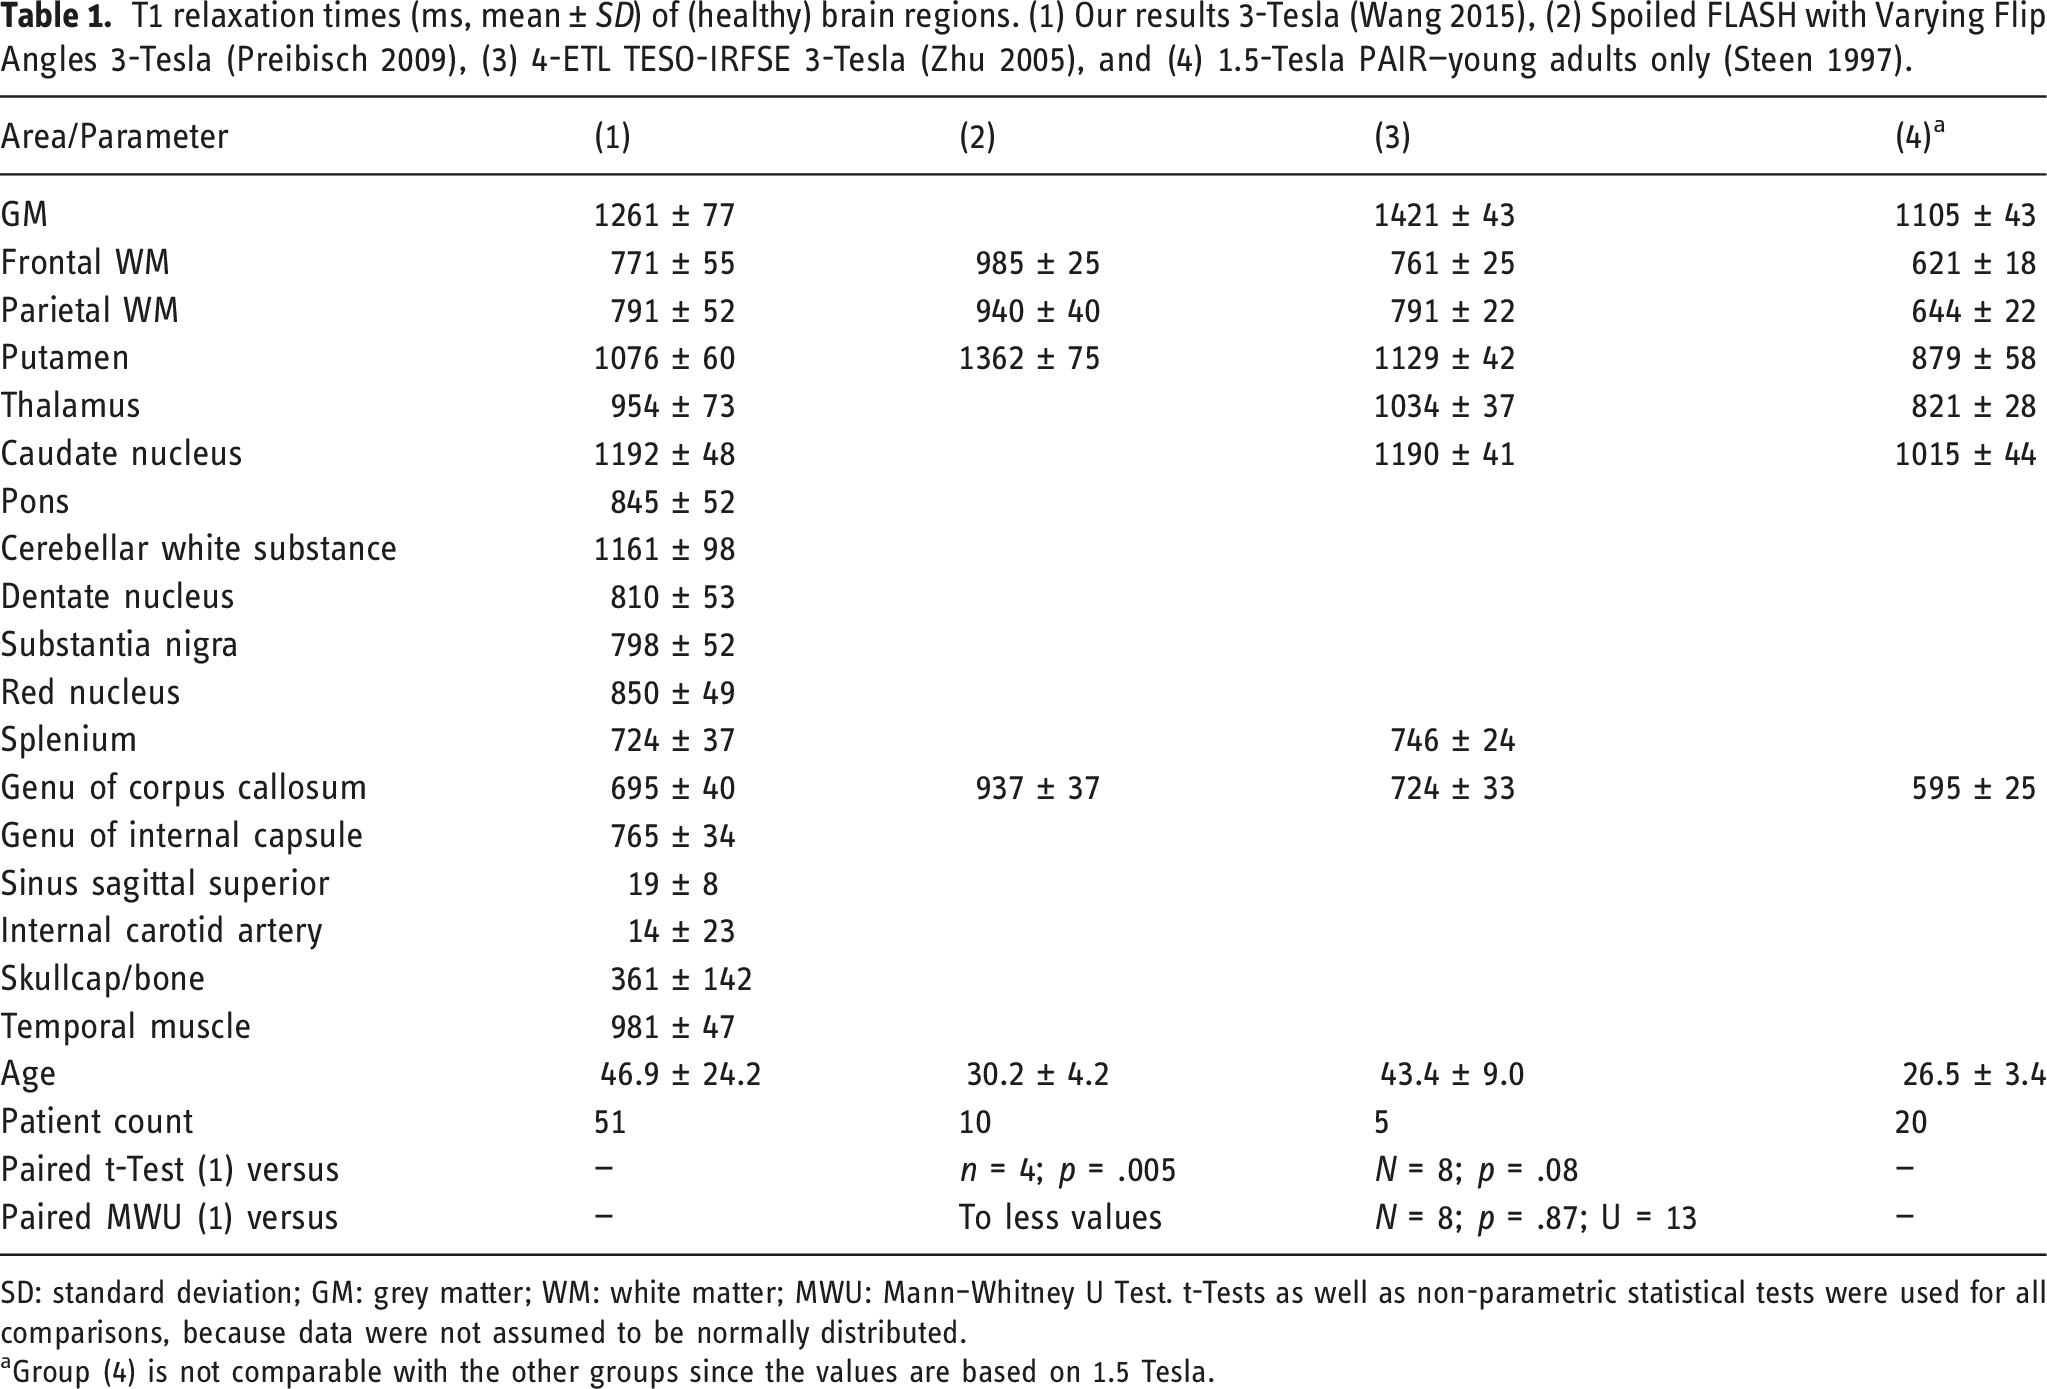
SD: standard deviation; GM: grey matter; WM: white matter; MWU: Mann–Whitney U Test. t-Tests as well as non-parametric statistical tests were used for all comparisons, because data were not assumed to be normally distributed.
aGroup (4) is not comparable with the other groups since the values are based on 1.5 Tesla.
t-Test
A paired t-Test of literature (3) vs (1) of the eight similar regions demonstrated a mean (±SD) of 933 ± 221 ms for (1) and 974 ± 258 ms for (3). The null hypothesis that the T1 values of the novel T1 mapping differ from literature values (3) was rejected (n = 8, p = .08, with low power due to less values). Even if only four numerical values were given in (2), the T1 values (1) already differed significantly from the (2) in a paired t-Test (1) vs (2) (n = 4, p = .005).
The t-Test for controlling left versus right (paired) T1-values showed a mean (±SD) of 647± 355 ms of the right and of 648 ± 357 ms of the left-sided brain structures. The null hypothesis that the left and right side measurements differ was rejected (n = 120, p = .78).
Reproducibility
The two repetitive measurements in five volunteers resulted in comparable T1 values. The mean within-subject coefficient of variation of 18 segmented regions (white matter, basal ganglia, and brainstem) in the same measurement (left/right) and in the same subject (test re-test) were 1.4% and 2.4%. The coefficient of variation for inter-object measurements was 3.8%. For a better visualization of deviations, Figure 3 depicts the results of a graphic subtraction analysis. Heat map / subtraction maps of two T1 maps from a volunteer acquired within an interval of 4 weeks show only minor differences. For better visualization of the small differences of T1-relaxation times (1/ms), a logarithmic scale was used.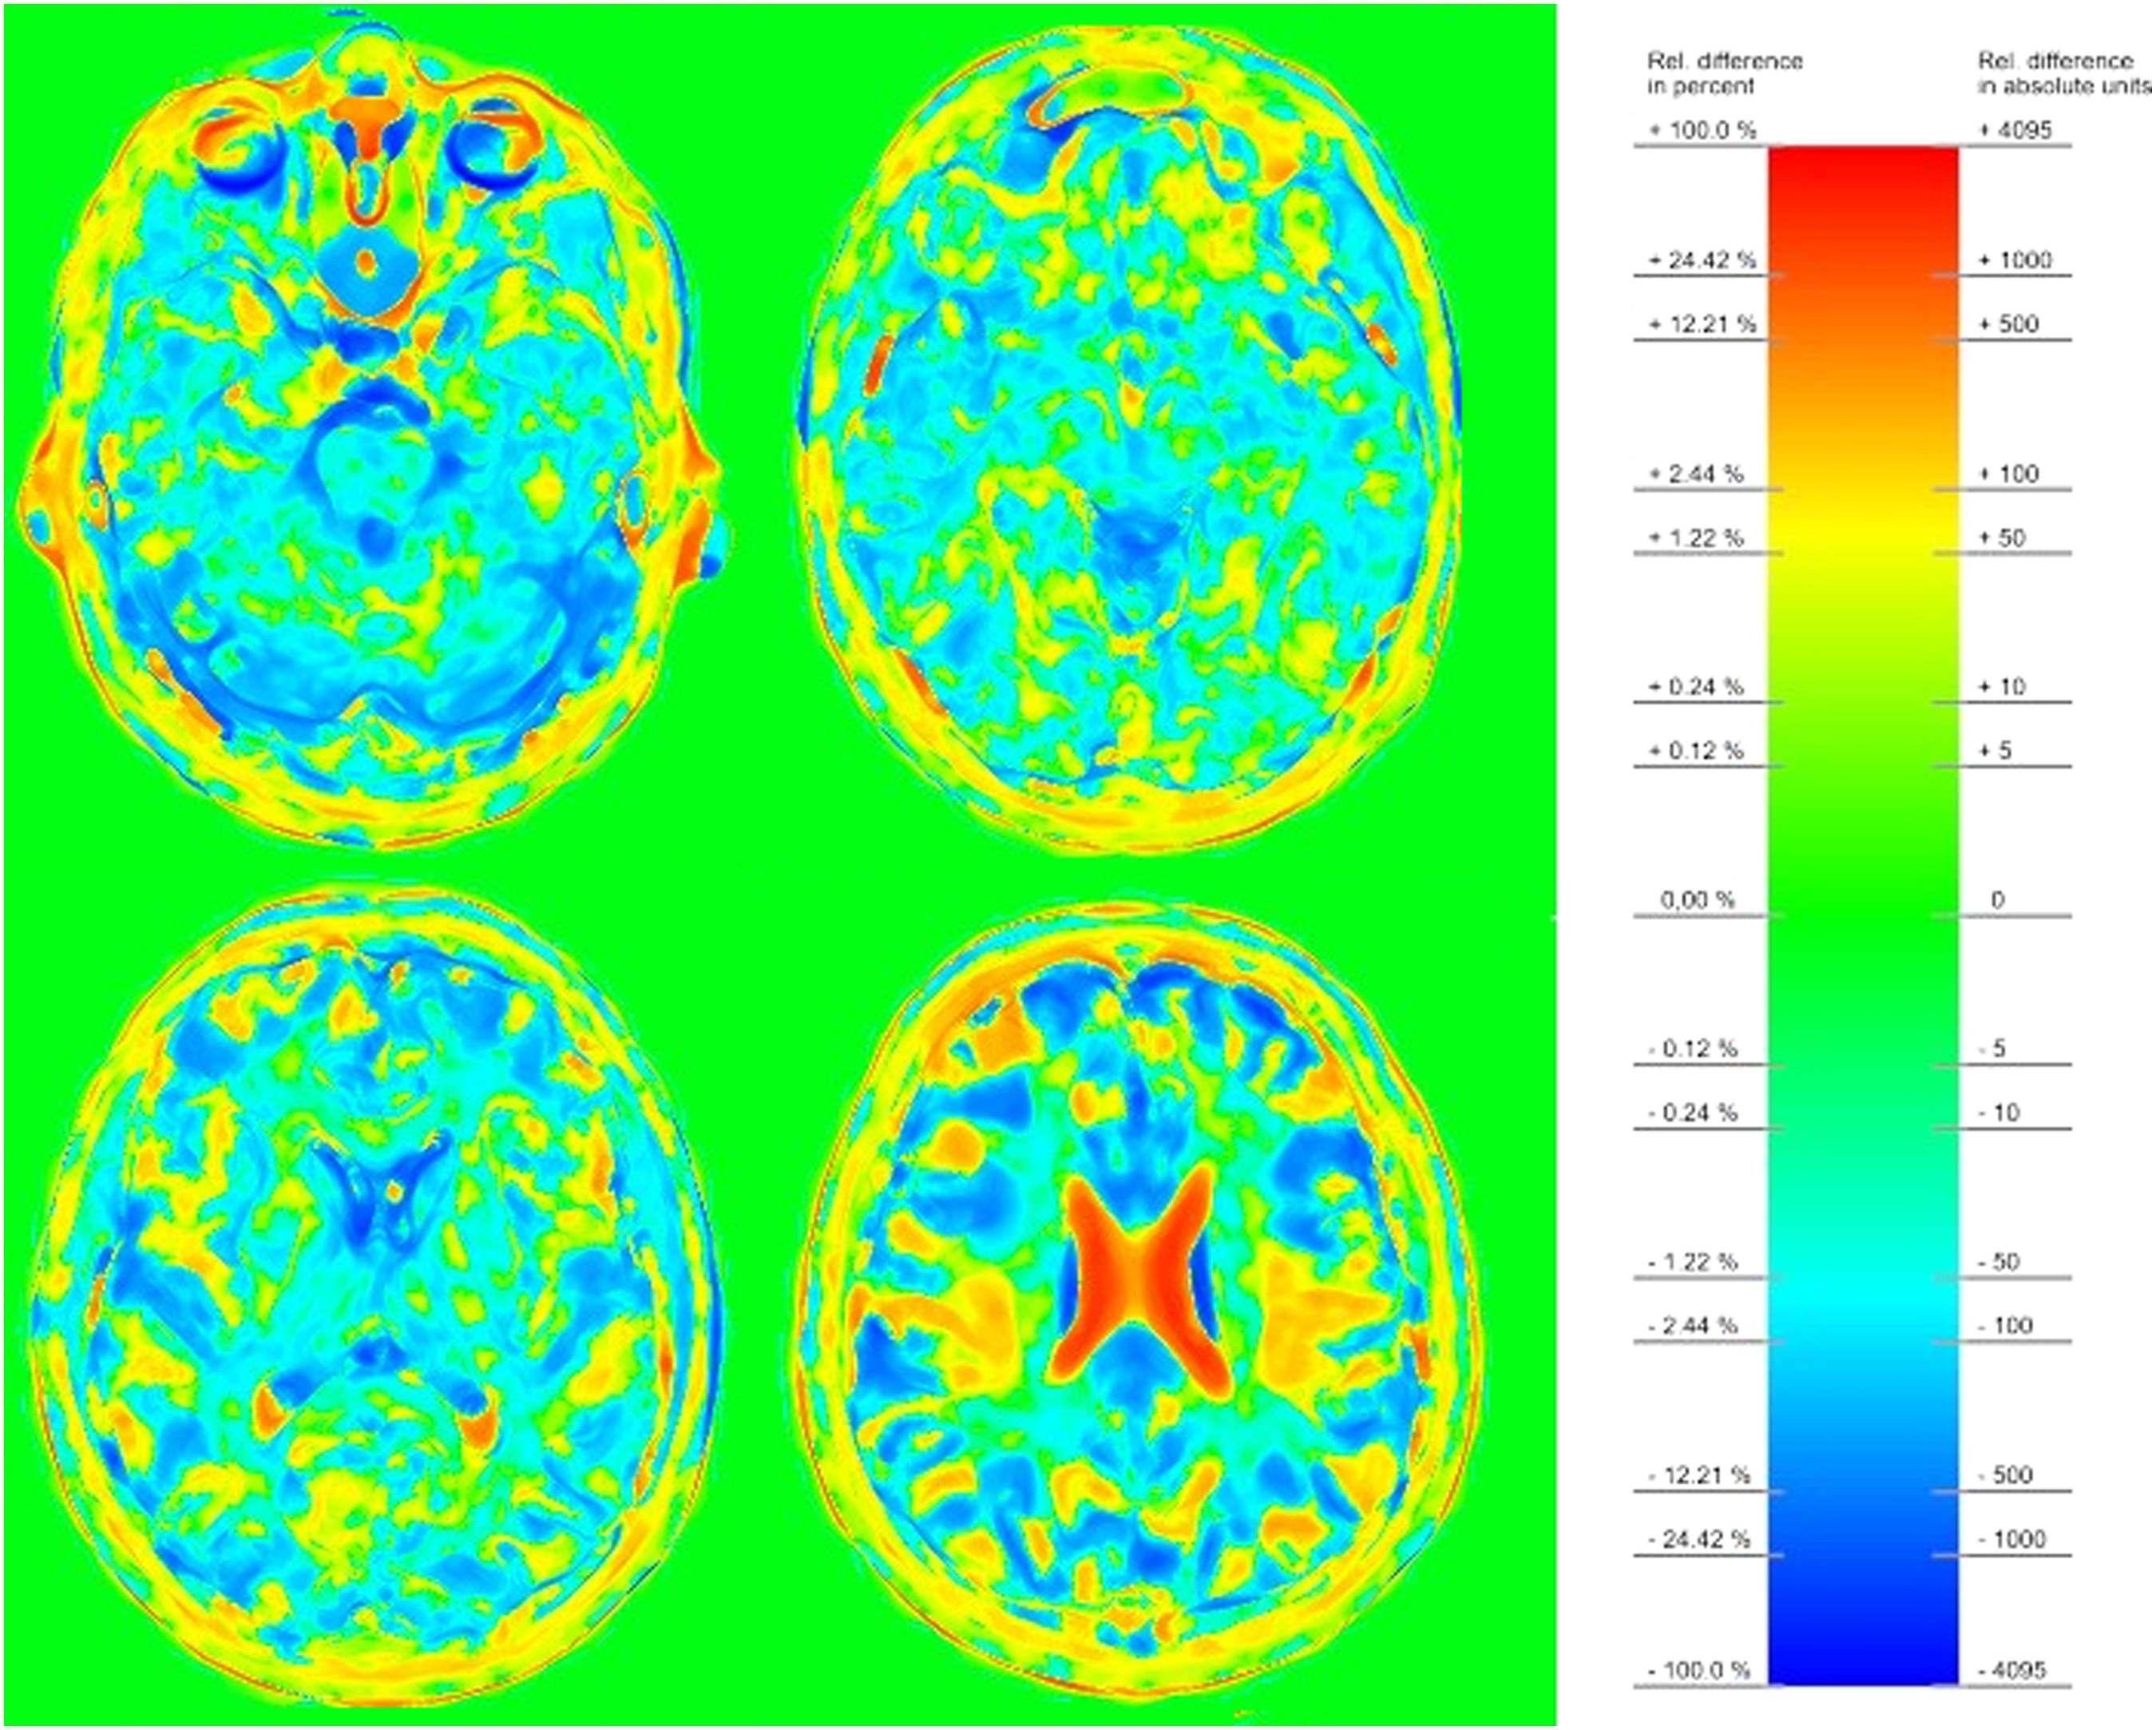
T1 relaxation times of pathologies
Most of the pathologies could be attributed to neurodegeneration, tumor, or stroke, as presented in Supplementary Table 1. Since the patient count of every pathology was low, the measured values can be only graded as sample data.
Sample T1 values of observed pathologies.
SD: standard deviation; CNS: central nervous system.
First impressions of the novel T1 mapping
T1 maps exhibit excellent contrast in white and grey matter, for example, the basal ganglia. Vessels were outlined sharply with a very low apparent T1 value influenced by flow voids. The quantity of contrast agent uptake and the T1 value of edema seems to differ depending on the kind of brain tumor in our few cases. Another advantage is the good differentiation between vessels (apparent T1 values of 0–200 ms) and tissues with contrast agent (T1 values of 300–700 ms).
The T1 mapping recognized larger microvascular and multiple sclerosis lesions as well as microvascular lesions. Subacute infarctions showed pathologic T1 values in every case.
T1 mapping did not detect any signal alterations relating to iron deposits that were shown by susceptibility-weighted imaging. Neither could we recognize any pathologic T1 changes in the substantia nigra or nucleus ruber of patients with Parkinson’s disease.
An atlas-based segmentation was not possible, as no 3D data set is currently supported.
Selected cases are presented to demonstrate the T1 mapping technique and new possibilities for diagnostic applications.
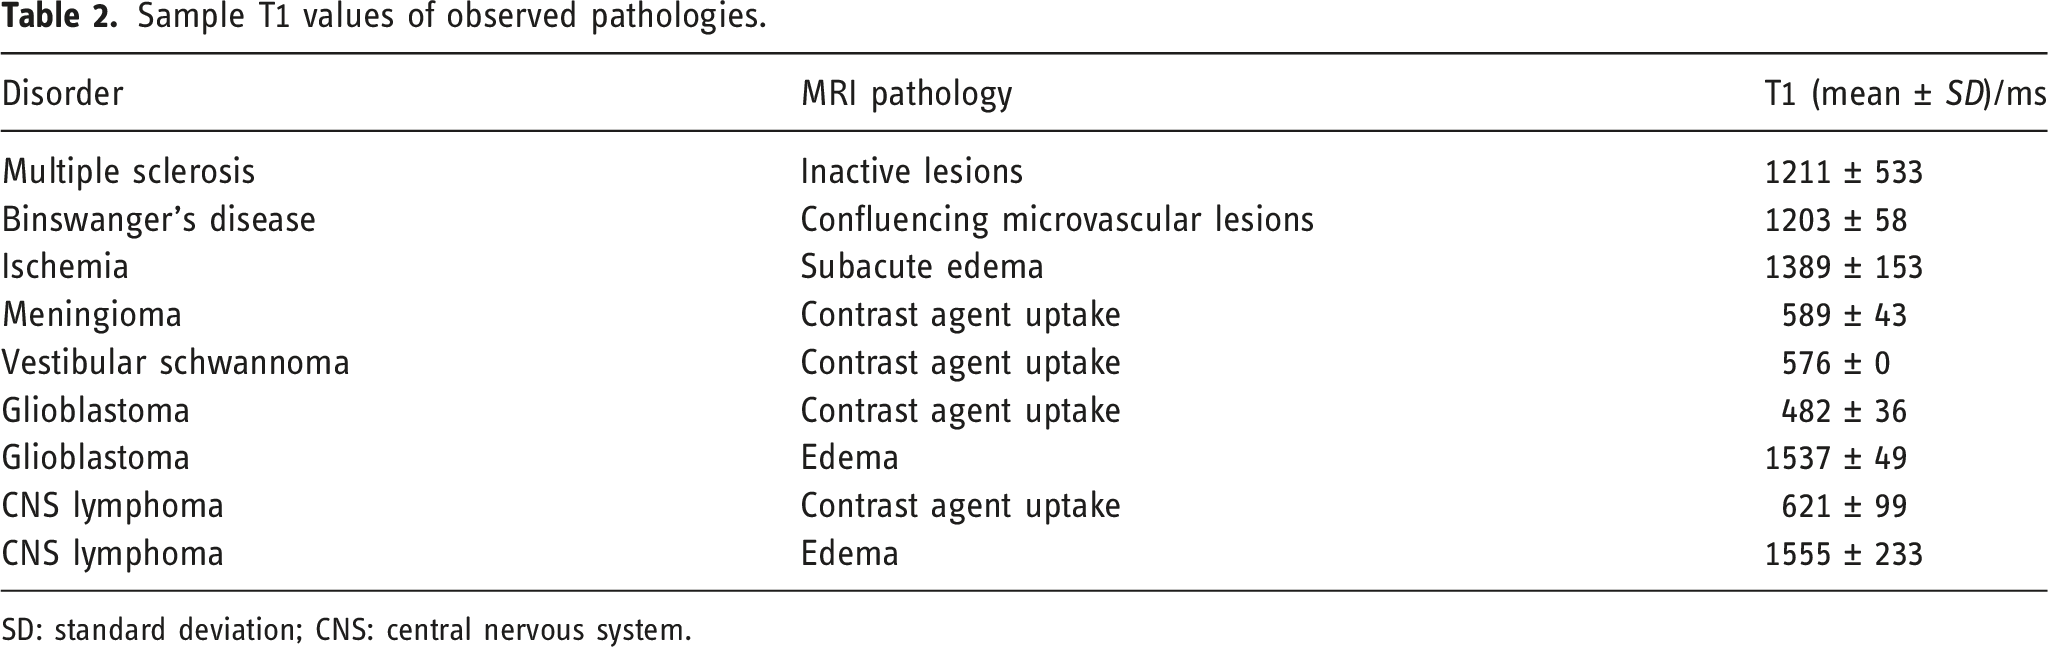
A subacute hemorrhagic infarction of the right lateral frontal lobe is demonstrated in Figure 4. The cortical and subcortical defect shows marginal T2 hyperintensities with correlating restricted diffusion and central T2 hypointensity. The stroke is shown in the T1 map as well (i.e., higher T1 values) though with a lower contrasted central signal alteration. For easier comparability with the standard T1 weighted images, R1 maps (inverted T1 maps) with blackened (“outside of the head”) environment are shown in the following. Subacute hemorrhagic infarction (left: non-enhanced inverted T1 map (R1 map), middle: B1000 sequence of echo-planar diffusion weighted imaging, right: T2 turbo spin echo).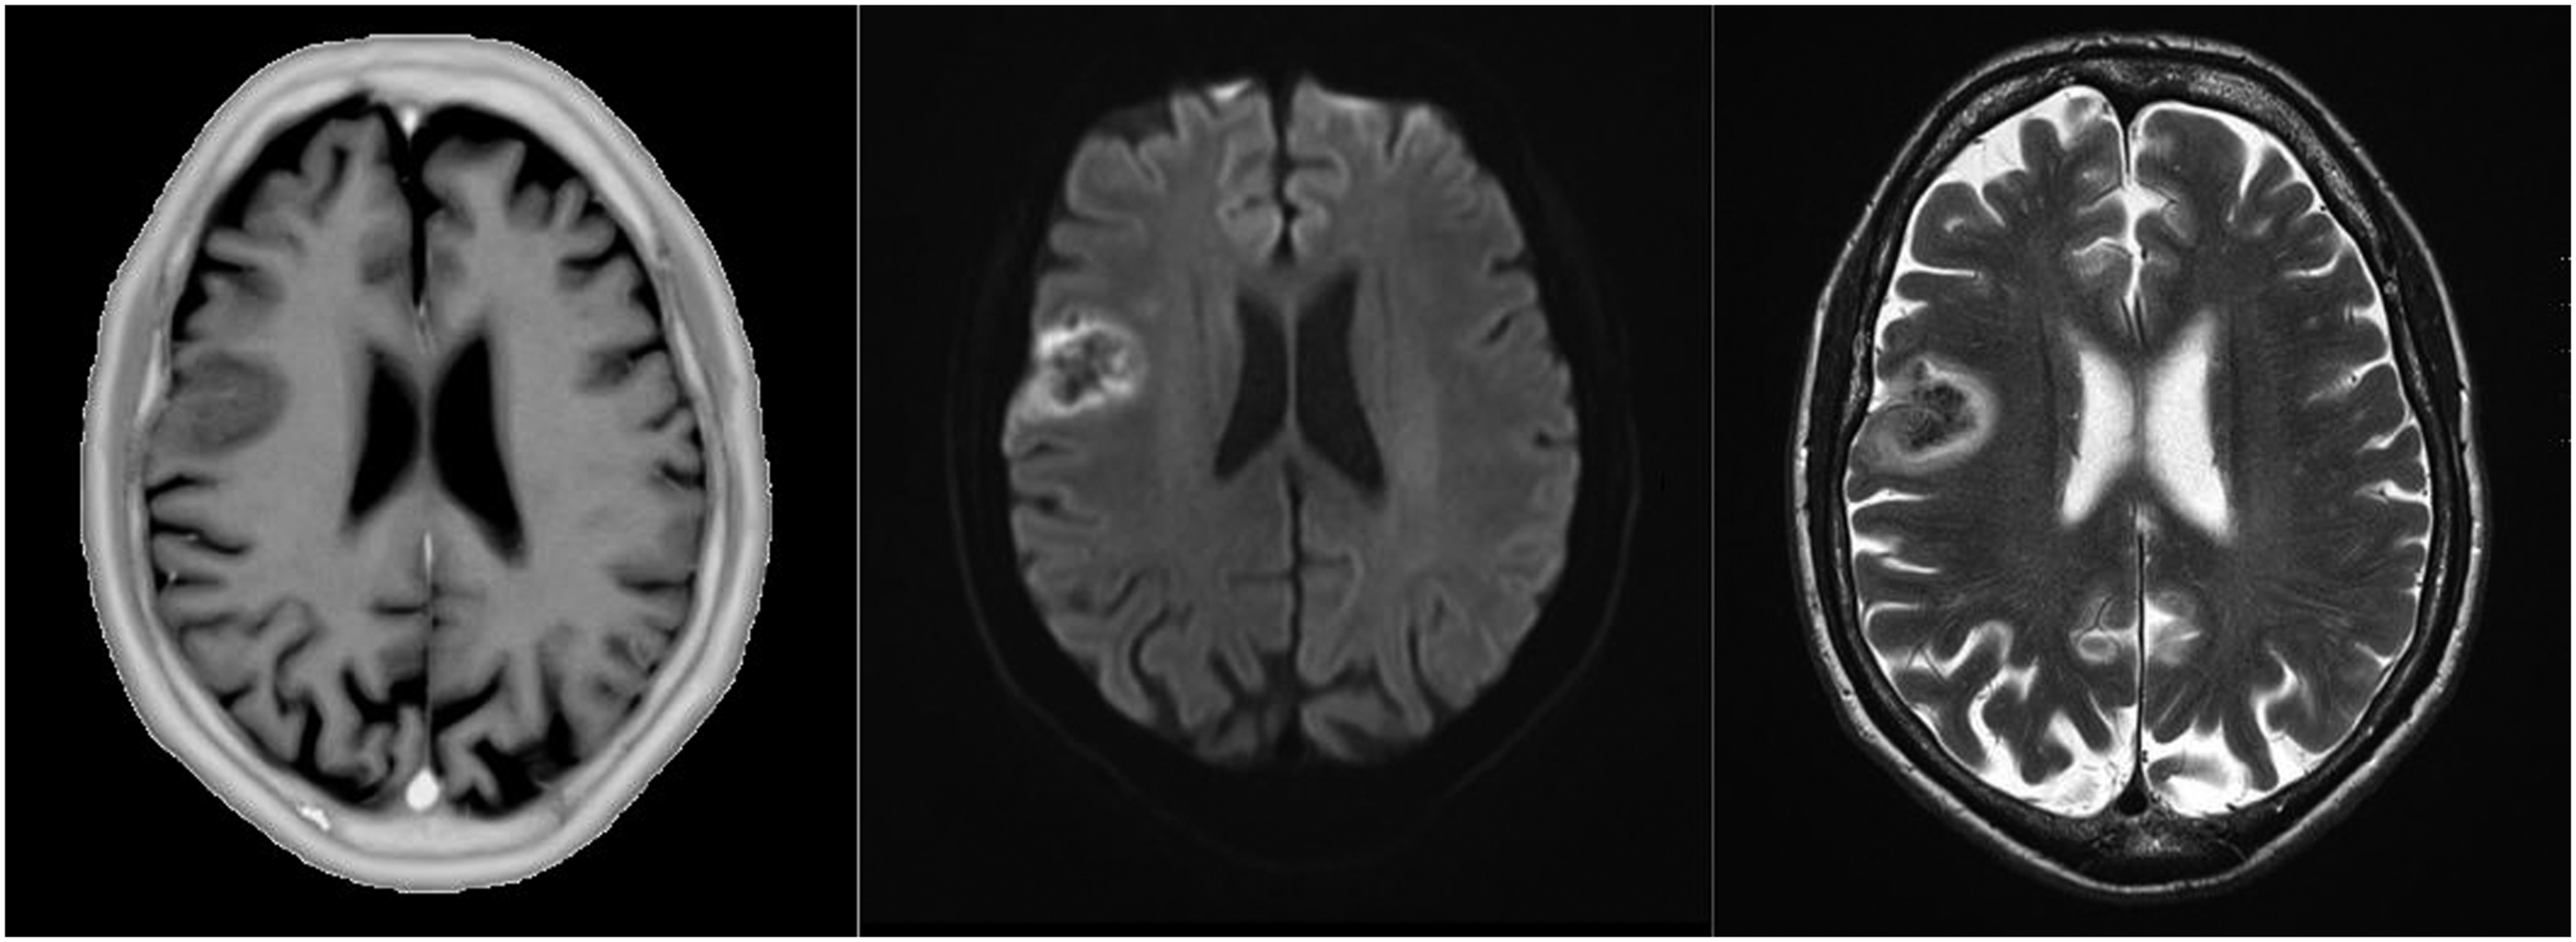
Figure 5 shows a homogenously enhancing meningioma of the right sphenoid wing infiltrating the right orbit and displacing the brain stem. Figure 6 shows an MRI of a patient with left temporal glioblastoma with central necrosis and garland-like enhancement surrounded by perifocal edema. Sphenoid wing meningioma (left: inverted T1 map, right: T1 volumetric interpolated brain examination, both with contrast agent). Glioblastoma (left: T1 volumetric interpolated brain examination, right: inverted T1 maps, both with contrast agent).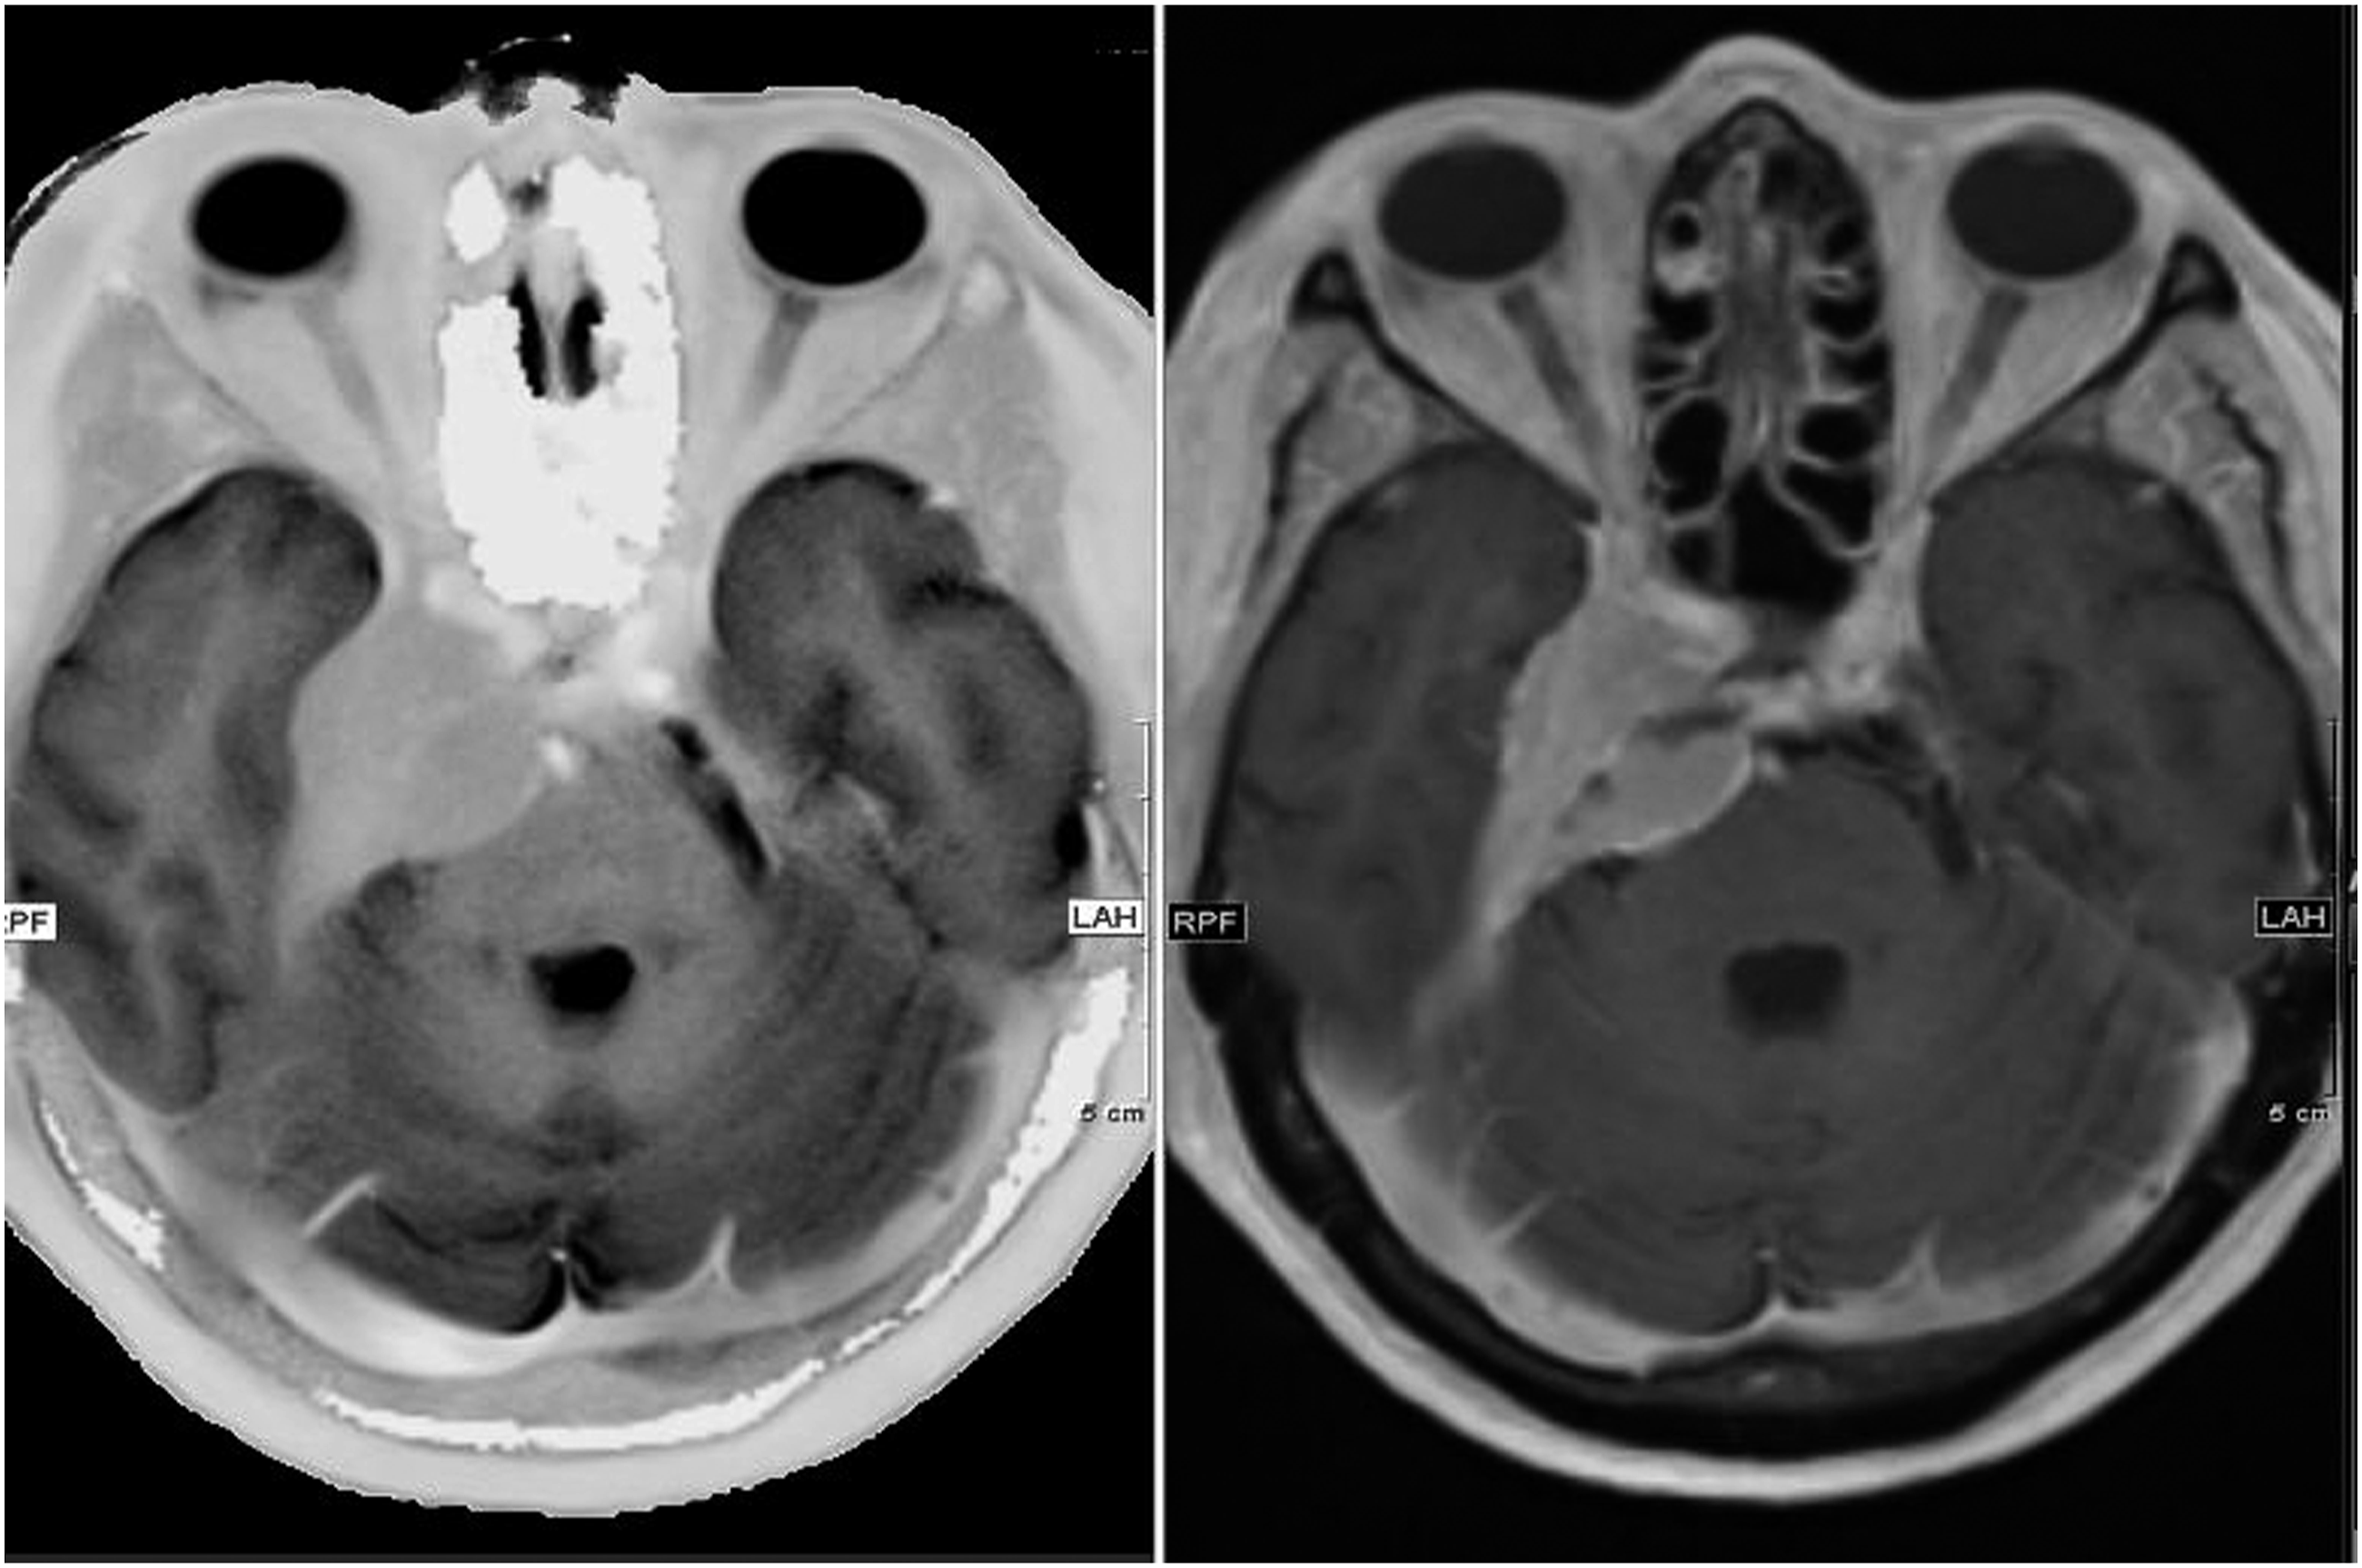
Discussion
Here, we describe the first practical experience with a novel single-shot T1 mapping technique for whole-brain studies at 0.5 mm in-plane resolution and an acquisition time of only 4 s per slice. For the first time, such a high-resolute, (almost) real-time T1 mapping was used regularly in everyday clinical practice, both for outpatients and for inpatients, proving the feasibility and showing the benefit of such a real-time mapping.
Our findings show a general agreement with literature data with regard to the results of Zhu’s inversion recovery technique, 8 but also with regard to the differences between the individual underlying methods. 12 They correspond with the results of a recently published pediatric study, 14 and show that T1 mapping could open up new perspectives for brain tumor research. 15 T1 values in both left and right hemispheres were without significant differences. Moreover, the method offers high intra-subject reproducibility. Together, these observations set the ground for a comprehensive determination of absolute T1 values of brain structures in healthy subjects. Therefore, the novel T1 mapping should also be used for the assessment of pathologies.
So far, clinical applications of T1 mapping focused on investigations of the developing brain,16,17 of cerebral myelin and iron concentrations, 18 and attempted to identify multiple sclerosis 19 and epilepsy. 20 Furthermore, quantitative relaxation time mapping was described as an auspicious method for tumor monitoring. 21
A promising approach for future studies would be the standard application of rapid T1 mapping in patients with pathologic MRI findings. Moreover, larger databases would allow for a better assessment of maturation and development, as demonstrated for pediatric patients by a recent study, 14 and for aging and degeneration. Finally, further studies are recommended to investigate the reproducibility and T1 accuracy at other field strengths.
In our preliminary findings, the detection of brain tumors and ischemia was excellent, similar to previous findings by other T1 mapping methods. 15
Very small lesions of cerebral microvascular disease and multiple sclerosis could not be detected with T1 mapping, similar to previous studies. 19
In patients with Parkinson’s disease, no signal alterations of the T1 value were noticed in the substantia nigra compared to patients without pathologies. Moreover, the mean values were not significantly decreased in contrast to recent studies. 22 Partial volume effects might be an explanation, as we did not use any specialized brain stem sequences with increased spatial resolution.
Limitations
We retrospectively analyzed the current data on a limited number of patients. The standard deviation of our measurements, which predominantly reflects the inter-subject variability, was partially higher than in comparative studies 16 because our patients were on average older and had a wider age range. Although normal-appearing brain structures were evaluated, most patients were symptomatic. Hence, a prospective study of only healthy volunteers is clearly warranted.
Despite the high spatial sampling in the axial plane (0.5 mm), a slice thickness of 3 or 4 mm decreases the spatial resolution and results in anisotropic voxels, which may not be occur using 3D techniques. 23 Further automated segmentation and data processing would be facilitated by such a 3D data set.
Reproducibility was checked ignoring many sources of variance, like scanner instabilities and physiological variability (e.g., water balance and body temperature). Although the positioning change of the head in the multi-channel coil was factored in, uncertainty variables due to the layer thickness and different signal to noise ratios come into play.
We reviewed our T1 mappings on a limited group of patients with broad spectrum of disease. Prospective studies with distinct research questions are needed. Ongoing studies should evaluate the precision of the novel T1 mapping method and determine disease-specific T1 reference values. This also contains the quantity of contrast agent uptake and the T1 value of edema for the safer diagnosis of brain tumors. It is not yet clear, if the differences in our measurements are random or may lead to a new diagnosis criterion.
For a more valid comparison with other methods, more statistical data from segmented brain areas is needed. Due to the high level of complexity and the need for time, a comparison with the Steen “gold standard” is not practicable, the former published values are based on 1.5 Tesla.
Conclusion
The proposed T1 mapping method for whole-brain studies calculates quantitative T1 values of brain structures without loss of accuracy and reproducibility compared to literature data. The fast parallel calculation enables almost real-time usage. The clinical value for a large spectrum of disorder needs to be evaluated in further studies.
Supplemental Material
sj-pdf-1-neu-10.1177_19714009221084244 – Supplemental Material for First clinical application of a novel T1 mapping of the whole brain
Supplemental material, sj-pdf-1-neu-10.1177_19714009221084244 for First clinical application of a novel T1 mapping of the whole brain by Sebastian Johannes Müller, Eya Khadhraoui, Dirk Voit, Christian Heiner Riedel, Jens Frahm and Marielle Ernst in The Neuroradiology Journal
Footnotes
Author contributions
The study was conceived and designed by SM, ME, and JF. Material preparation, data collection, and analysis were performed by SM, EK, and DV. The first draft of the manuscript was written by SM and JF, and all authors commented on previous versions of the manuscript. Corrections were made by ME and CR. All authors read and approved the final manuscript.
Declaration of conflicting interests
The author(s) declared the following potential conflicts of interest with respect to the research, authorship, and/or publication of this article: Jens Frahm and Dirk Voit are co-inventors of a patent and software regarding to the T1 mapping used here. The remaining authors declare that they have no competing interests.
Funding
No funding was received for the conduct of this study and/or the authorship. The authors acknowledge support for the publication fees by the German Research Foundation and the Open Access Publication Funds of the Göttingen University.
Authors’ note
Preliminary results (abstract only) were presented at the Proceedings of the 55th Annual Conference of the German Society for Neuroradiology. 24
Ethical approval
The study was ethically approved by the institutional review board (Göttingen, Germany, No. 38/08/20).
Supplemental material
Supplemental material for this article is available online.
References
Supplementary Material
Please find the following supplemental material available below.
For Open Access articles published under a Creative Commons License, all supplemental material carries the same license as the article it is associated with.
For non-Open Access articles published, all supplemental material carries a non-exclusive license, and permission requests for re-use of supplemental material or any part of supplemental material shall be sent directly to the copyright owner as specified in the copyright notice associated with the article.