
Abstract
Background
Extra-axial hematoma can cause significant brain compression. Guidelines for surgical evacuation include imaging findings (midline shift and hematoma thickness/volume) in conjunction with Glasgow Coma Scale (GCS) scores and/or intracranial pressure (ICP) monitoring. Physiologically, overall brain density should also change with compression. In our observational study, we explored whether overall brain density, defined using computed tomography Hounsfield Units (CT HU), changes after surgical evacuation of extra-axial hematoma.
Methods and materials
Only patients with a surgical acute epidural hematoma or subacute/chronic subdural hematoma were considered. Other exclusion criteria were concurrent intraparenchymal pathology, bilateral pathology, or incomplete follow-up imaging. Between fall 2012 and spring 2015, 22 patients were included in the study. CT head imaging (preoperative, postoperative, and at ∼1- to 2-month clinic visit) were loaded into OsiriX (Pixmeo, Switzerland). All the intracranial regions were selected and all extra-axial features were removed; subsequently, software was used to calculate a global CT HU value.
Results
A repeated-measures ANOVA found significant time effect, p < 0.01, with significance between preoperative versus postoperative CT (p = 0.03) and preoperative versus clinic visit CT (p < 0.01).
Conclusion
The results from this study suggest that extra-axial hematomas, which deform the brain, can cause an elevation in global CT HU value; moreover, surgical decompression is associated with lower global CT HU values. The use of global CT HU values in selected populations may serve as an adjunct for the evaluation of surgical lesions.
Keywords
Introduction
Extra-axial hematoma can cause significant brain compression. Guidelines for surgical evacuation include imaging findings (midline shift and hematoma thickness/volume) in conjunction with Glasgow Coma Scale (GCS) scores and/or intracranial pressure (ICP) monitoring.1–3 Physiologically, overall brain density should also change with compression. For example, regions with cerebrospinal fluid (CSF) (cisterns and ventricles), which have low density, become deformed and constitute less volume within the intracranial vault. On the other hand, mass lesions can cause relative venous congestion due to preferential compression of veins over arteries; 4 since blood has a high density, congestion may increase brain density. In our observational study, we explored whether overall brain density changes after surgical evacuation of extra-axial hematoma. We postulate that the overall brain density, as measured with computed tomography Hounsfield units (CT HU) values, would be elevated because of the mass effect of the extra-axial hematoma.
Method and materials
The approval of the institutional board review at our hospital was obtained prior to the study.
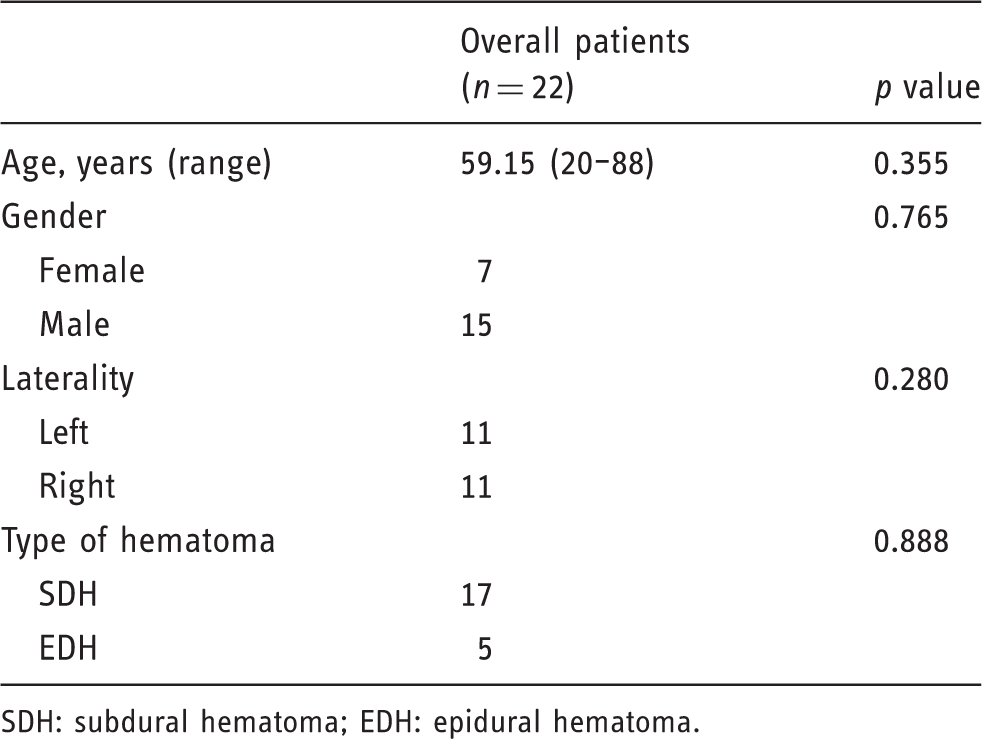
As a simplified approach, only patients with a surgical acute epidural hematoma (EDH) or subacute/chronic subdural hematoma (SDH) were involved in the study. Other exclusion criteria were concurrent intraparenchymal pathology, bilateral pathology, or incomplete follow-up imaging (Figure 1). Between fall 2012 to spring 2015, 22 patients were included in the study. Clinical data (age, gender, type of hematoma, and laterality) were extracted from medical records. There were 15 males and seven females in the patient population, with an average age of 59 years (Table 1). Seventeen patients exhibited SDH and underwent burr hole drainage with placement of a subdural drain; five patients exhibited EDH and underwent a craniotomy with no drain placement. Collectively, there were 11 left-sided lesions and 11 right-sided lesions.
Examples of excluded patients: contusions, bilateral pathology, and traumatic subarachnoid hemorrhage. Patient demographics. SDH: subdural hematoma; EDH: epidural hematoma.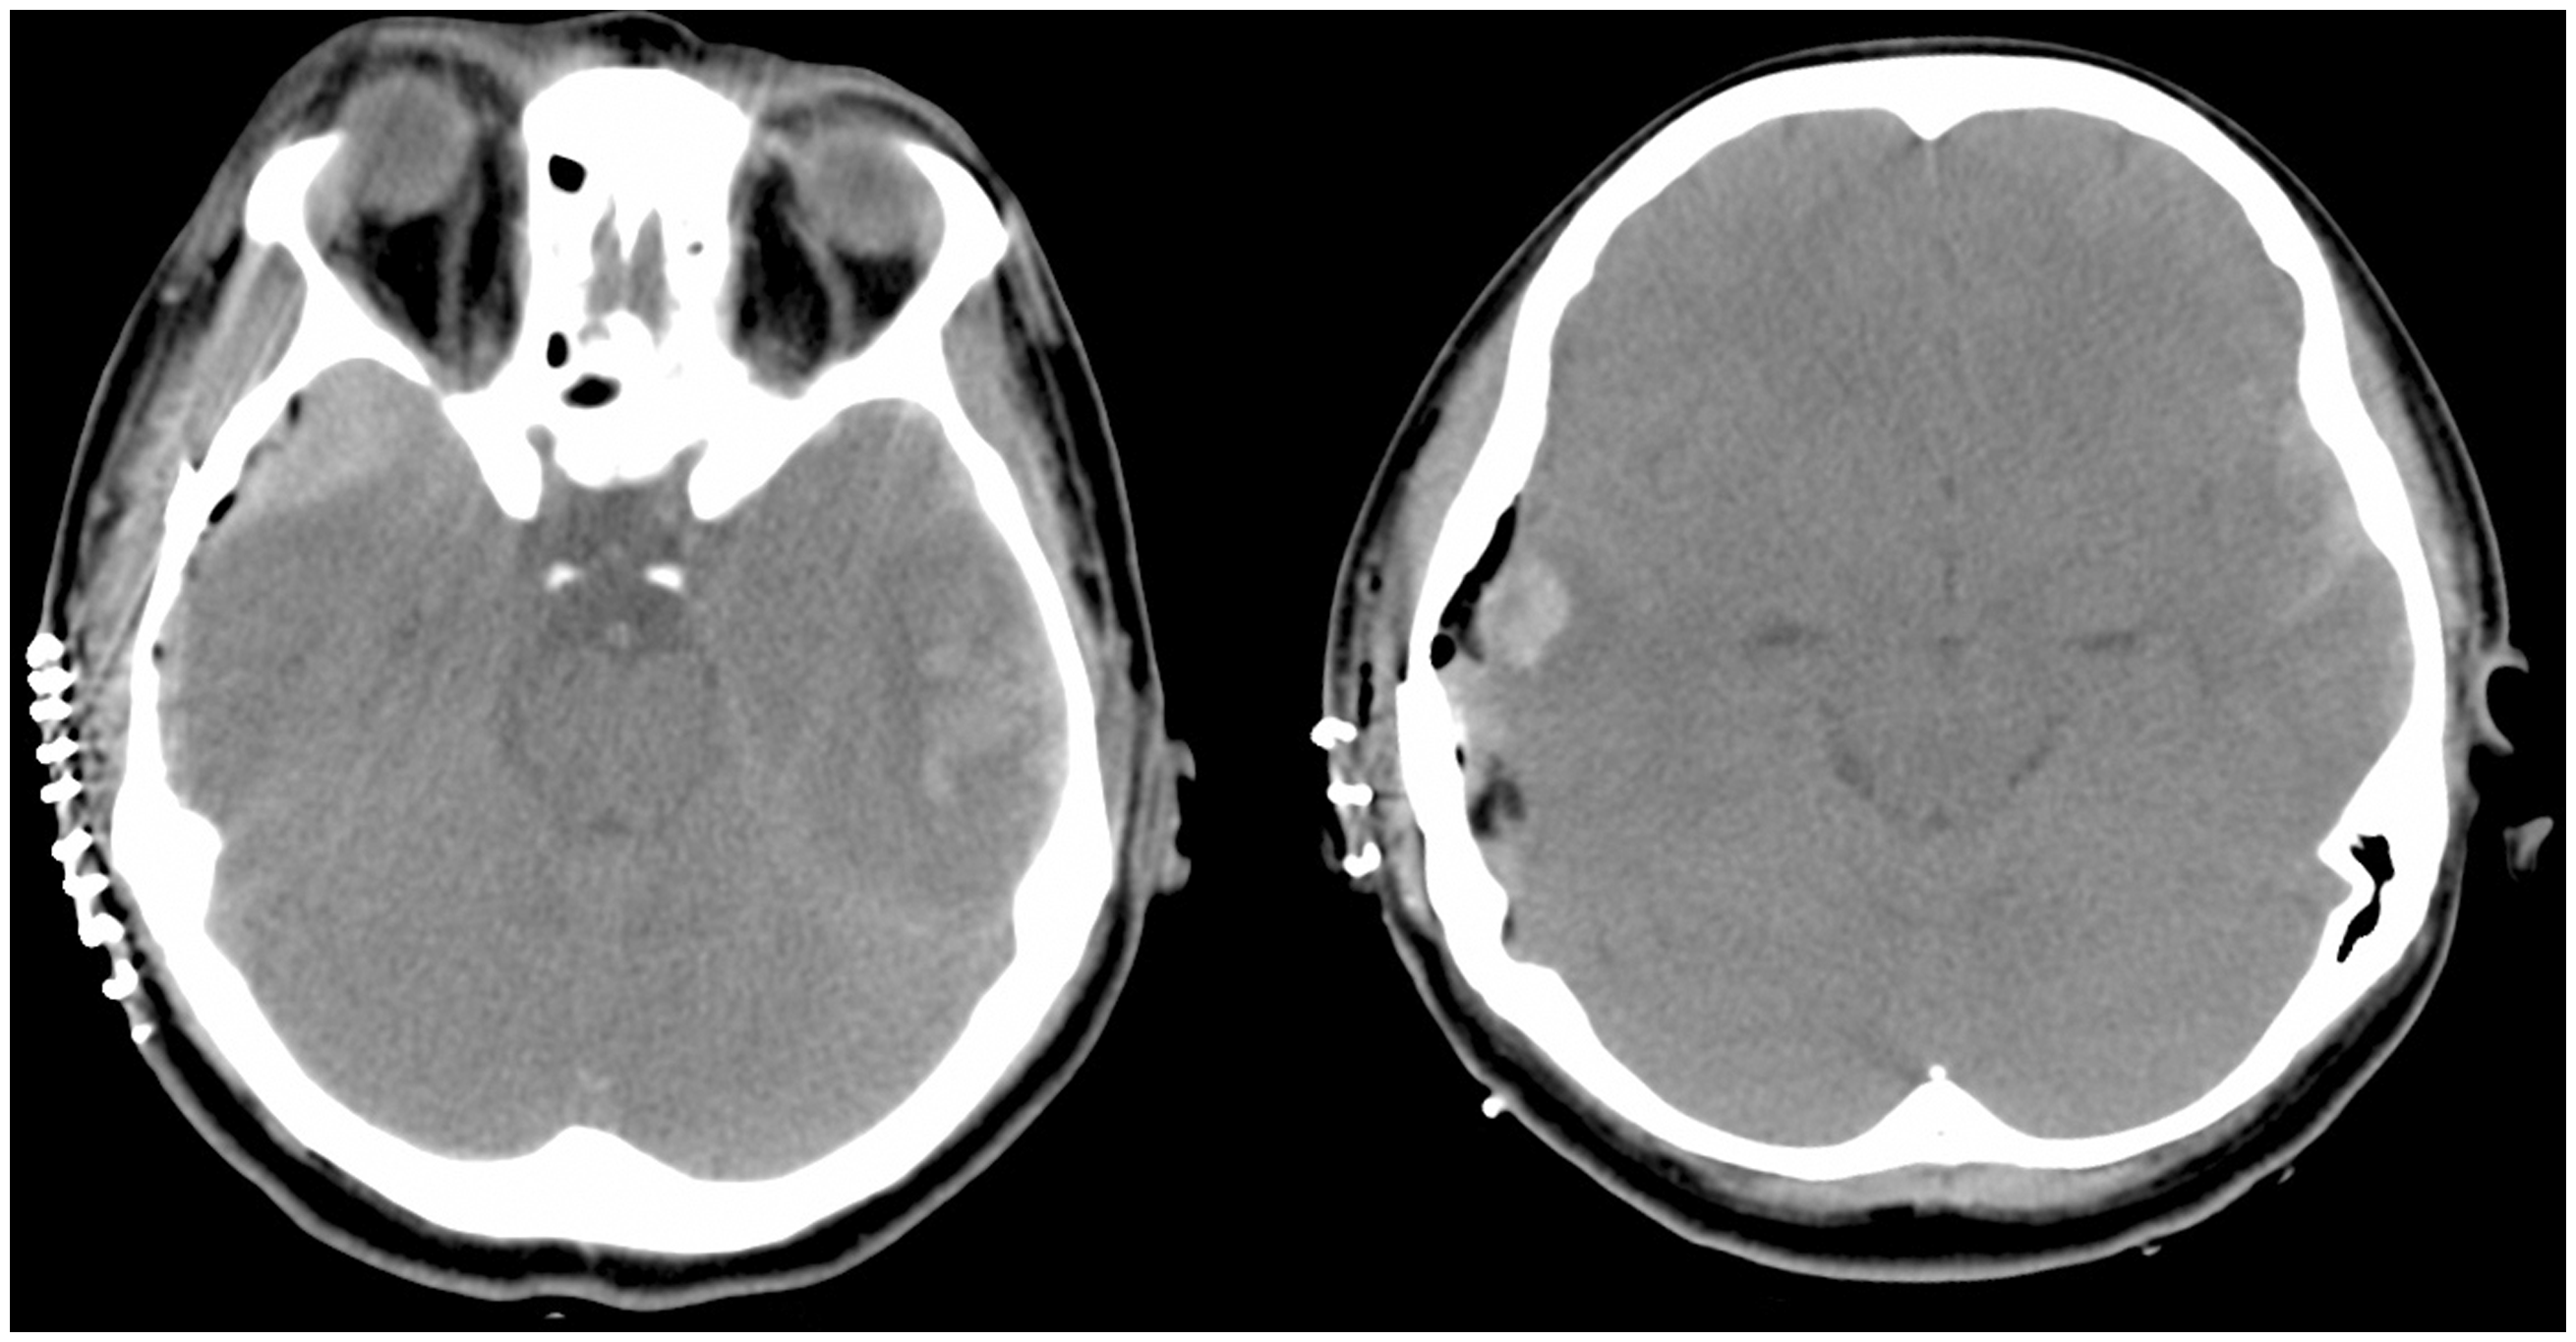
CT head imaging (preoperative, postoperative, and at ∼1- to 2-month clinic visit) were loaded into OsiriX (Pixmeo, Switzerland) (Figure 2(a)). Subsequently, three authors (HN, LL, and MP) individually performed the following imaging analysis on the CT imaging. HN has five years of experience; LL and MP have two years of experience in the neurosurgical field.
Segmentation protocol applied to an example patient with an epidural hematoma (EDH): (a) right EDH, (b) segmentation of all intracranial structures, (c) manual removal of EDH from imaging.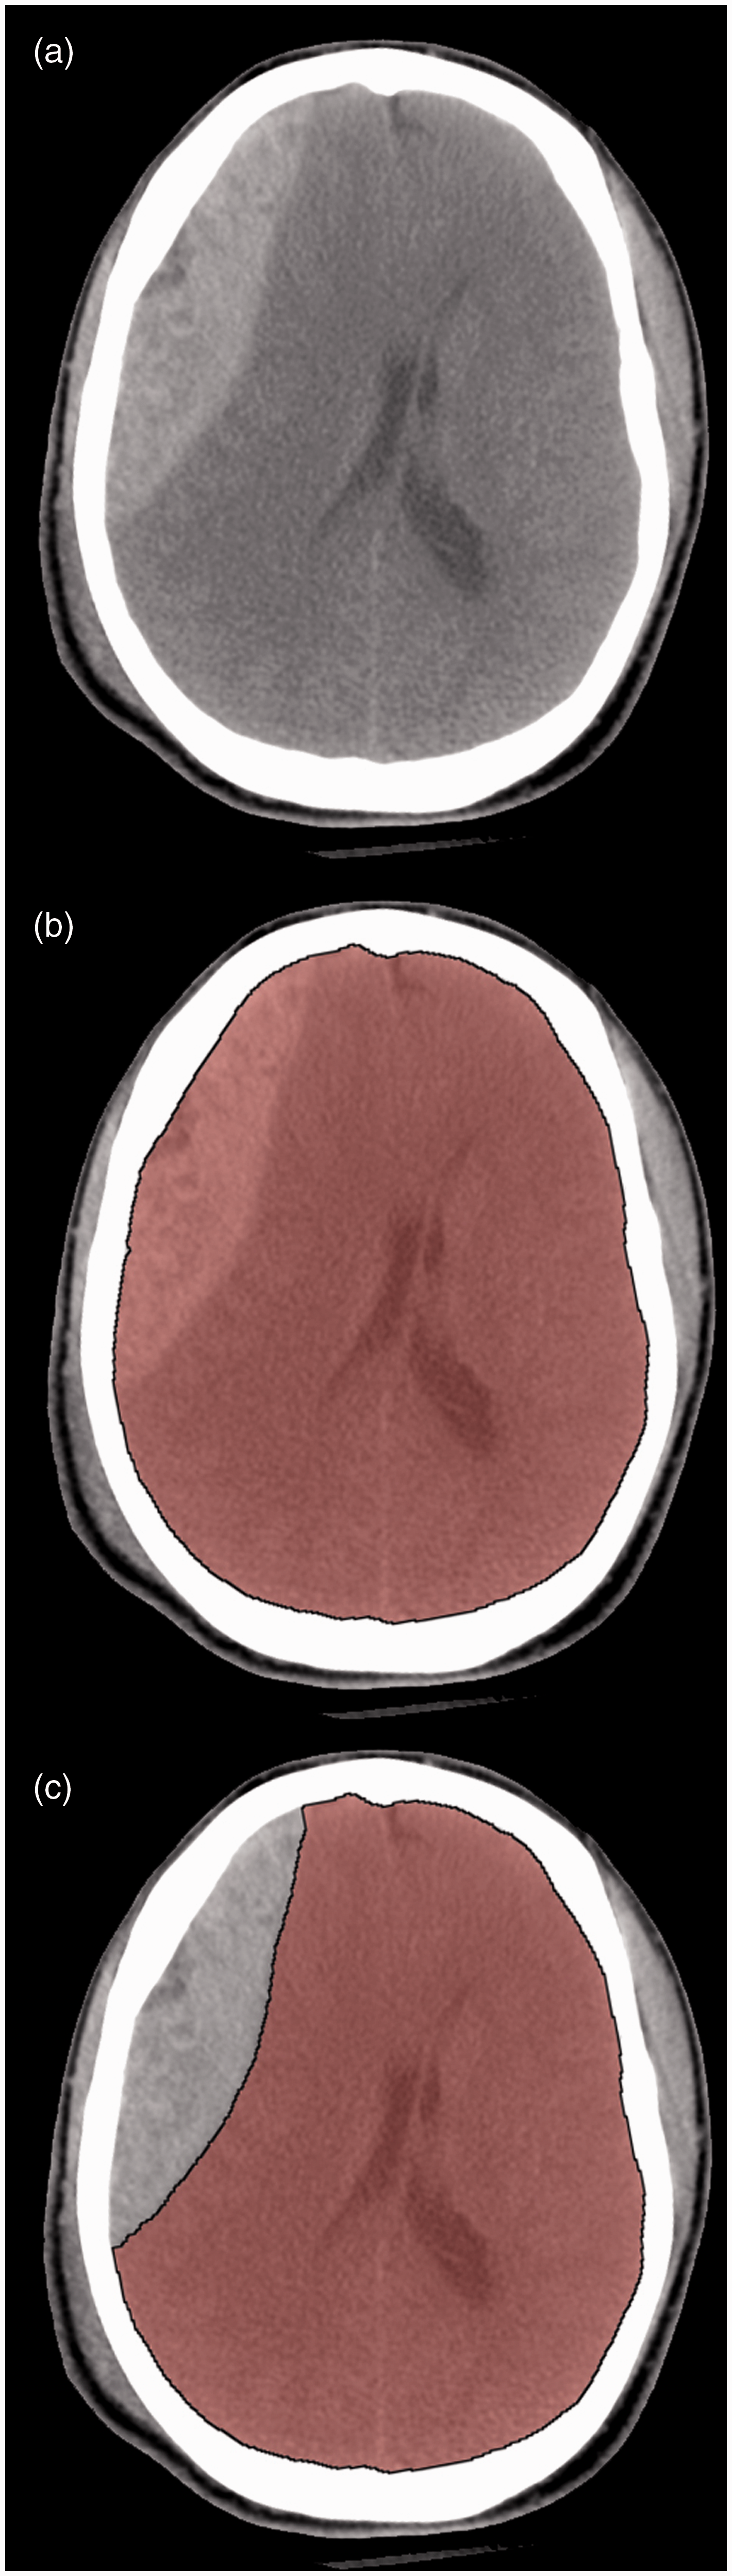
Global CT HU value
Applying a segmentation imaging protocol (which selects contiguous regions where CT HU values ranged from −30 to 100), all the intracranial regions across 5 mm thick axial slices (brain parenchyma, CSF spaces, vascular structures, hematoma, and/or postsurgical fluid) were highlighted and segregated from bony structures (Figure 2(b)). Subsequently, extra-axial features (EDH/SDH and/or postsurgical fluid) were manually selected and removed across all pertinent slices (Figure 2(c)). The remaining model contained CSF spaces, vascular structures, and brain parenchyma from the top cranial aspect down to the cervicomedullary junction. The software was employed to calculate a global CT HU value across all the pertinent slices (i.e. an average CT HU value is calculated for each region of interest in each slice and then all such values are weighted based on area to compile a global CT HU value for the entire volume).
Statistical analysis was performed with IBM SPSS 22 (Chicago, IL, USA). Since the protocol required manual removal of extra-axial features to calculate global CT HU value, interobserver and intraobserver reliability calculations were performed with the use of the interclass correlation coefficient (where 0 represents no agreement and 1 represents perfect agreement). A value >0.8 was considered an indication of excellent agreement.
Repeated-measured analysis of variance (ANOVA) (with time-constant covariates—age, gender, laterality, type of hematoma) were employed to evaluate relationships regarding global CT HU and timing of head CT (preoperative, postoperative, and at ∼1- to 2-month follow-up). Post-hoc analysis with Bonferroni correction was performed. Shapiro-Wilk test was used as a test of normality. A p < 0.05 was considered statistically significant.
Results
For the calculation of global CT HU values, interobserver correlation coefficient was 0.935 (confidence interval (CI) 95% 0.826, 0.978) among observers HN, LL, and MP. Moreover, intraobserver correlation coefficient was 0.935 (CI 95% 0.826, 0.978) with observer HN.
A one-way repeated-measured ANOVA was conducted to evaluate the null hypothesis that there is no change in global CT HU when measured on preoperative CT, postoperative CT, and at ∼1- to 2-month clinic visit CT. The results of the ANOVA indicated a significant time effect, Wilk’s lambda = 0.394, F(2, 20) = 15.398, p < 0.01, η2 = 0.606. Thus, there is significant evidence to reject the null hypothesis. Follow-up comparisons indicated significance between preoperative versus postoperative CT (p = 0.03) and preoperative versus clinic visit CT (p < 0.01). Shapiro-Wilk test toward global CT HU at preoperative, postoperative, and clinic visit revealed p > 0.05, revealing that the values are not significantly different from a normal distribution. There were no significant relationships associated with age, gender, laterality, or type of hematoma (Table 1).
Discussion
No studies have evaluated the variation of CT HU value with compressive lesions in traumatic brain injury (TBI) patients. Our study found a relationship between mass effect from an extra-axial hematoma and the overall brain density. The Monro-Kellie doctrine has governed the physiological relationship between ICP and volume distribution of CSF/brain parenchyma/blood. Classically, the brain parenchyma represent ∼1400 ml, while CSF and blood constitute ∼75 ml and ∼150 ml respectively in an adult. As reported by Kim et al., 5 the HU of CSF is between 0 and 15; brain tissue has HU < 40, and the hemorrhagic cells have HU < 80.5,6 With a compressive lesion, CSF volume tends to decrease (i.e. because of effacement of sulci, ventricles, or basal cisterns). Since CSF has CT HU values between 0 and 15, its displacement increases the overall brain density. In addition, the balance between cerebral blood in and outflow is critical to brain physiology. 4 Veins (including sinuses) are more compressible than arteries; consequently, a compressive lesion can lead to intracranial venous congestion given autoregulation of cerebral blood flow, which may effectively increase blood volume and intracranial pressure, leading to an increase in overall brain density.
Prior studies have largely explored the role of CT HU for cerebral edema. Rózsa et al. 7 evaluated CT HU values within TBI patients with diffuse brain swelling, defining a relationship between cerebral edema and hyperemia, where the former exhibited 11–20 HU and the latter exhibited 31–40 HU. Similarly, Kim et al., 5 while evaluating a pediatric patient population with TBI, found that the proportion of pixels with 17–24 HU correlated with severity of cerebral edema based on Marshall classification. Other pathologies have also been investigated. As an assessment for radiation-induced cerebral edema, Mangel et al. 8 found 10–28 HU was a suitable definition. 8 Moreover, Metter et al. 9 evaluated cerebral edema in patients with cardiac arrest; the group defined the ratio between gray matter (caudate nucleus, putamen, thalamus, and cortex) attenuation to white matter (internal capsule, corpus callosum, and centrum semiovale) attenuation based on the HU values as a measure of cerebral edema; for patients with severe cerebral edema, the ratio was less than 1.20.
The present study sought to develop a relationship between an averaged HU value within the entire brain parenchyma in the presence of an extra-axial hematoma. The selected patient population exhibited a simplified injury, where a pure acute EDH or subacute/chronic SDH was present. Patients with subarachnoid hemorrhage, cerebral contusion, or focal cerebral edema were excluded, as these features would complicate the calculation of an averaged HU value. The model did not account for hyperemia (pathologic enlargement of blood volume in cerebral vessels), which exhibits higher HU values. 7 Overall, a reasonable assumption is that the global value represents compressed brain parenchyma, CSF spaces, and vasculature due to the mass effect from the hematoma. Interestingly, the value decreased significantly between preoperative and postoperative imaging. This may be partly explained by brain re-expansion after decompression, with re-accumulation of CSF.
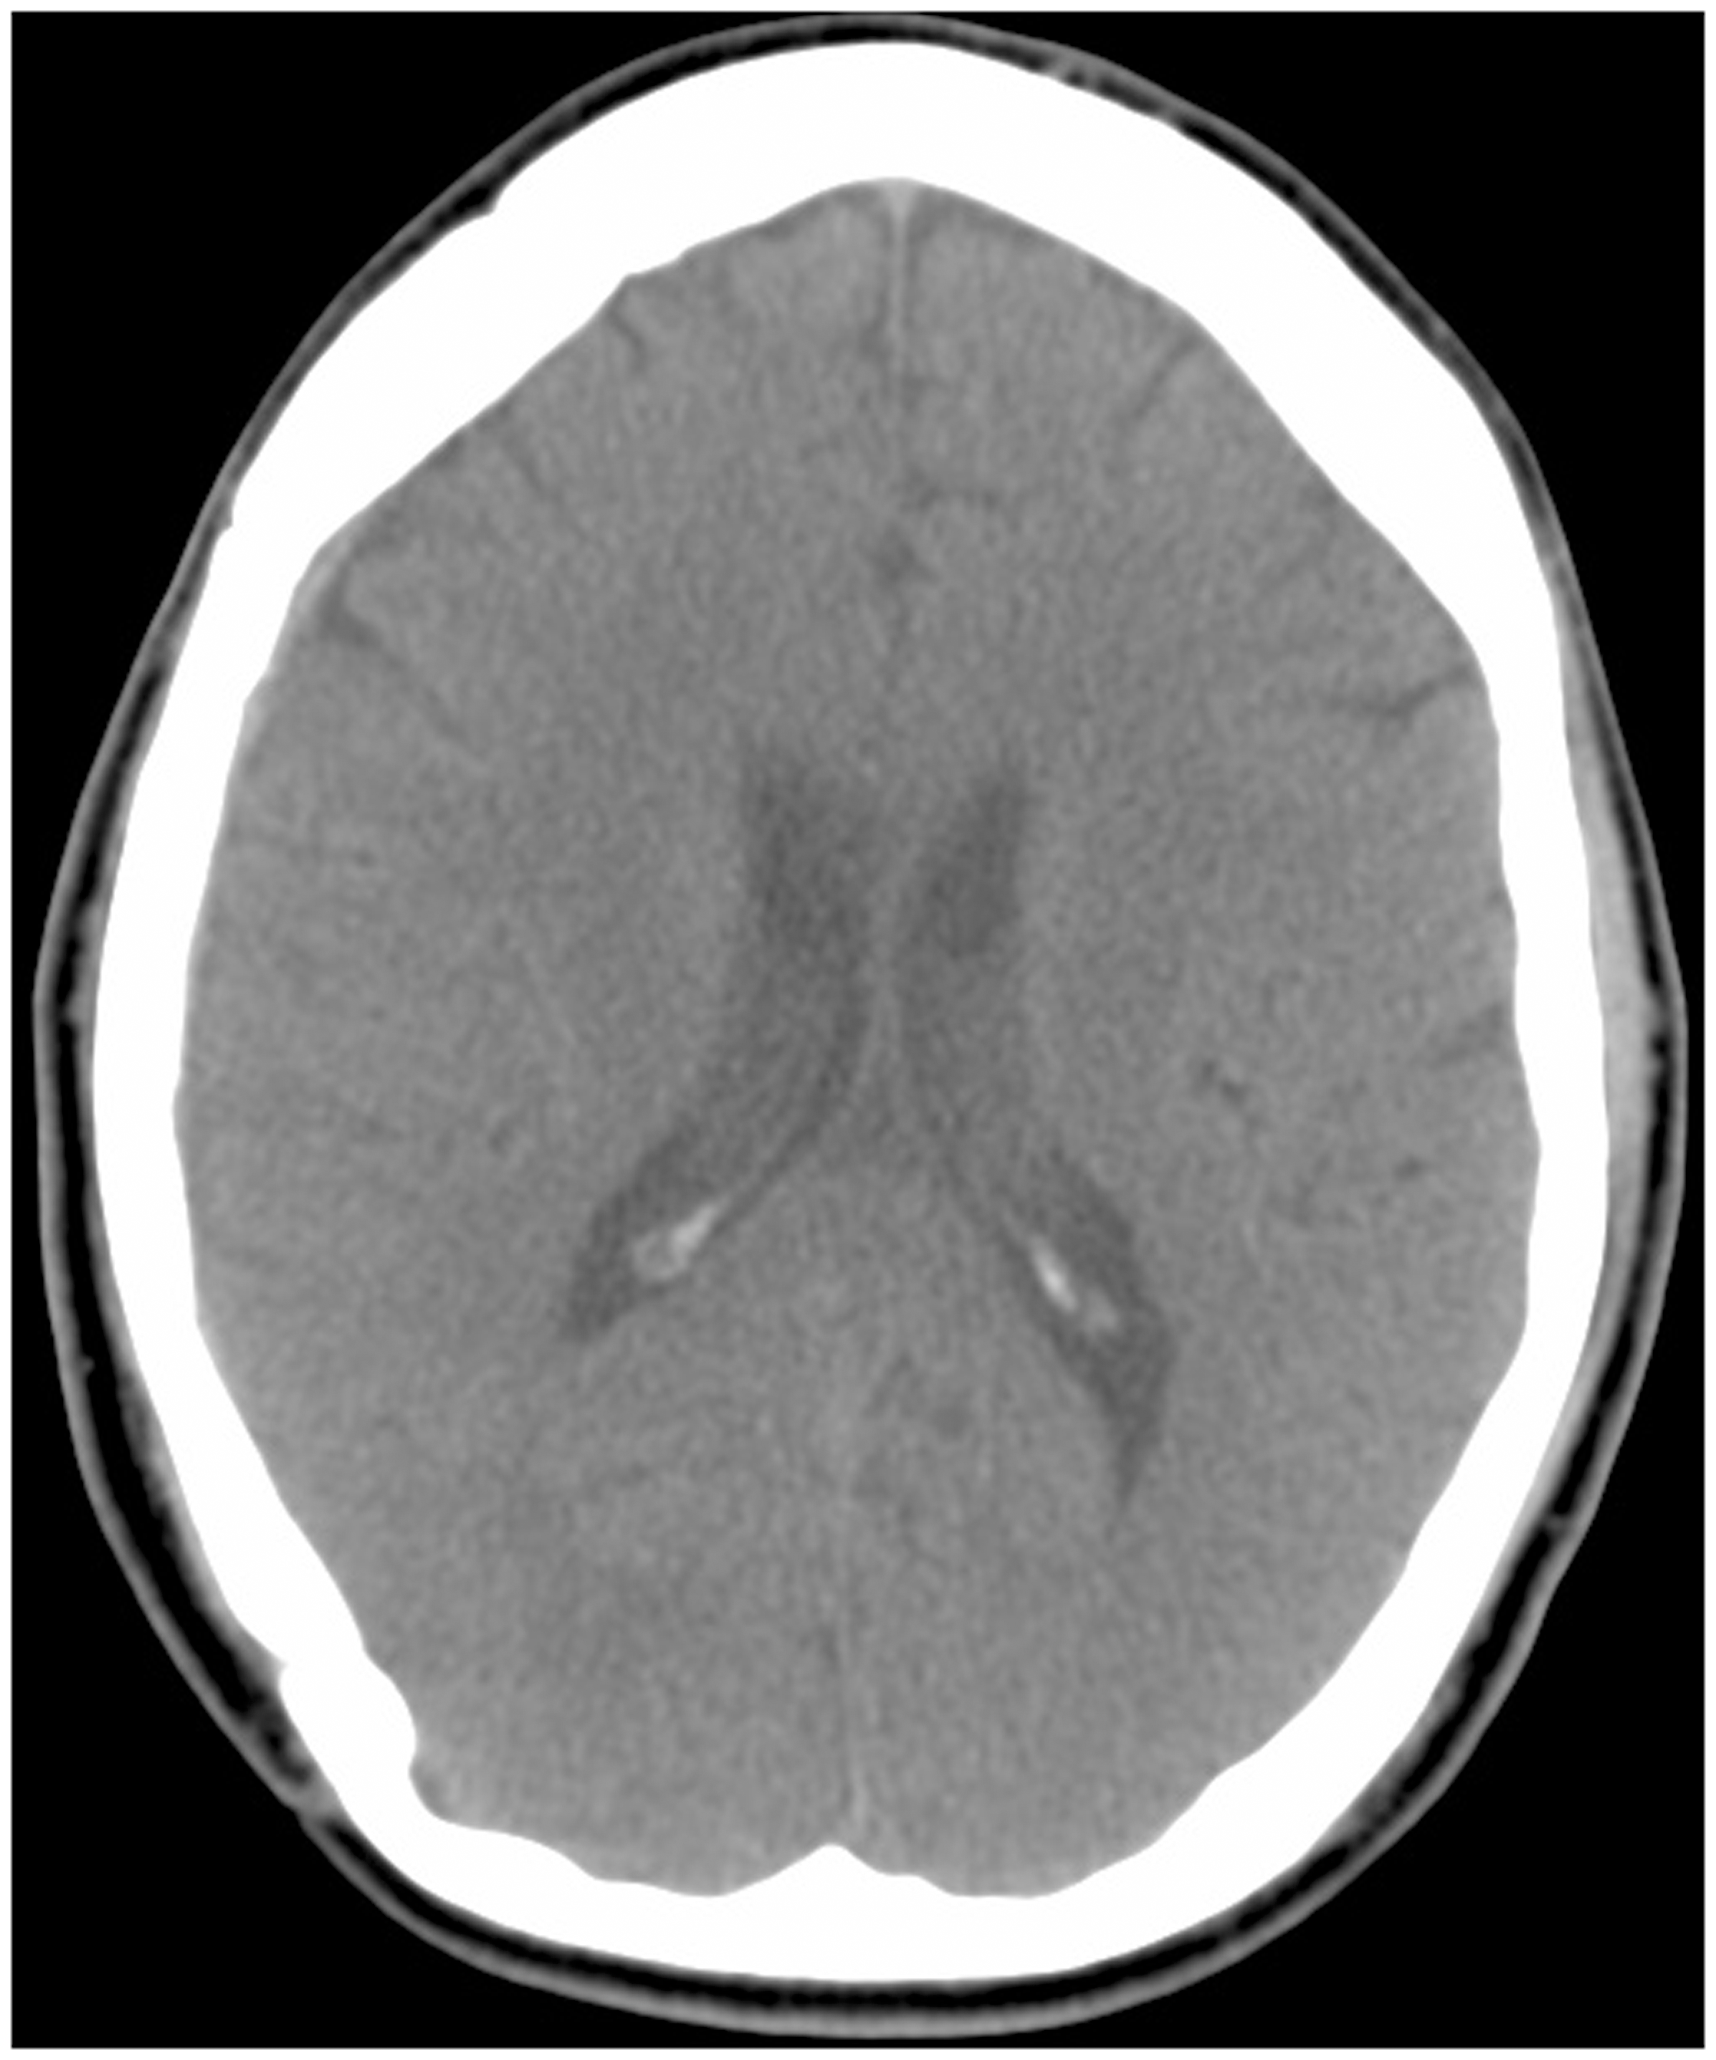
The values at clinic follow-up were lower than either perioperative values. A possible explanation is the development of encephalomalacia secondary to TBI, which has lower CT HU values; this may be followed by compensatory dilation of the ventricles, which also contributes to a lower CT value. However, the clinic CT imaging exhibited no focal areas of hypo-attenuation ipsilateral to the injury or asymmetric dilatation of the lateral ventricles to suggest encephalomalacia (Figure 3). On the other hand, the clinic visit value may be a close representation of the baseline status prior to TBI. Patients typically do not have a baseline head CT when they arrive with a symptomatic extra-axial hematoma. Further evaluation of values prior to presentation may clarify this observation. The overall trend regarding the global CT HU value in the study population correlates with the status of the hematoma. This implies that the value may also correlate with the extent of brain compression.
This study had several limitations, including the small size of the cohort and its retrospective nature. Moreover, the model is a narrow representation of all pathologies that lead to brain compression; nevertheless, the model is a reasonable representation of brain compression without other significant parenchymal injury (subarachnoid hemorrhage, cerebral contusion, focal edema, etc.). Hopefully, the model can provide a starting point for further studies with more complicated pathologies.
Conclusion
Interpretation of brain compression is crucial for clinical management of cranial pathologies. Overall brain density correlates with the degree of brain compression. The results from this study suggest that extra-axial hematoma, which deform intracranial contents, can cause an elevation in global CT HU values; moreover, surgical decompression is associated with lower global CT HU values. The use of global CT HU values in selected populations may serve as an adjunct for the evaluation of surgical lesions.
Footnotes
Funding
This research received no specific grant from any funding agency in the public, commercial, or not-for-profit sectors.
Conflict of interest
The authors declared no potential conflicts of interest with respect to the research, authorship, and/or publication of this article.