
Abstract
How does moral diversity shape a community’s response to norm violations? Here, we argue that increased moral diversity may lead to greater tolerance for deviant behaviors and a lower propensity to enforce norms. In Studies 1 to 2, we examine two large-scale datasets, and in Studies 3 to 7, we conduct pre-registered controlled experiments (N = 1,058), showing that people in more (versus less) morally diverse communities believe that the community’s norms are looser. In turn, norm violations are more accepted, and there is a reduced willingness to police transgressions. Our findings complement prior work on moral echo chambers and offer a new lens for understanding why communities and individuals differ in their tolerance of rule-breaking behavior.
People’s moral values differ, and those differences matter. Determining how people’s moral priorities are distributed throughout a community is consequential, given the centrality of morality in our social life. Indeed, morality is an essential part of our identity (Strohminger & Nichols, 2014), as it plays a focal role in our most cherished preferences and identity-based behaviors, ranging from political behavior (e.g., Clifford, 2014) to attitudes toward unconventional technologies (Kovacheff et al., 2018), and even getting vaccinated (Amin et al., 2017). Therefore, the composition of moral priorities within a community—moral diversity—may shape the community’s social fabric. Haidt et al. (2003) described moral diversity as “[…] the state of a group when a substantial percentage of its members (20%, perhaps) does not value the most valued moral goods of a community” (p. 5). Moral priorities are the spiritual, personal, or social duties that one feels obligated to uphold (Shweder & Haidt, 1993). Humans possess a plurality of moral values in their cooperative repertoire (Henrich & Muthukrishna, 2021); therefore, even within the same group, individuals may follow different rules for cooperation, with some not operating from the same moral playbook.
Moral diversity may be defined as the extent to which members of a group differ in conceptions of right and wrong for guiding cooperation and regulating selfish behavior. It varies along a continuum from low moral diversity, where there is broad consensus about core moral goods, to high moral diversity, where multiple competing conceptions of right and wrong coexist without a shared normative center. Unlike ethnic or geographical diversity, moral diversity cuts to the core of people’s devotions and what they believe is right and worth fighting for (Atran et al., 2014). Morally diverse spaces, therefore, may translate into having little “common ground” between members of a community to inform members which goods ought to be pursued. Given the centrality of moral values in social life, people may feel a sense of belonging to their community when they are in morally homogeneous communities (Frimer et al., 2017; Motyl et al., 2014). Prior research suggests that people who are embedded in morally homogeneous networks feel a kin-like connection to other community members (i.e., identity fusion; Swann et al., 2012), which in turn pushes them to draw a harsher line between their ingroup and outgroup, leading to outgroup derogation and heightened motives to fight and die for their ingroup (Atari et al., 2022).
If moral homogeneity can lead to deleterious consequences such as outgroup hate, then is moral heterogeneity a beneficial force for group dynamics? We argue that high levels of moral diversity may blur the line between right and wrong, thereby making it harder for group members to agree on shared rules, enforce them consistently, and respond to violations decisively. Haidt et al. (2003) noted that when there is no moral consensus, “anomie” (a term borrowed from Durkheim, often understood to mean normlessness) is likely to arise. Since norms create a shared understanding of appropriate behaviors across human societies (Gelfand et al., 2024), the state of “normlessness” could be conceptualized as a community having “loose” norms (Pelto, 1968). The “tightness” (vs. “looseness”) of a community refers to how strong the community’s norms are, and how tolerant the community is to deviant behaviors by members (Gelfand et al., 2006; Harrington & Gelfand, 2014).
We hypothesize that when community members perceive their community as morally diverse (vs. homogeneous), they will believe that it has looser (vs. tighter) norms. In looser societies, people may experience a diminished willingness to police rule breakers (i.e., to signal to violators that they broke the group’s norms, and should adhere to the group’s norms in the future), because people no longer agree on what counts as a violation. People in looser contexts might also feel that there is more leeway from the community when norms are defied, or that there is less of a need to police violators. Consequently, there may be a lack of consensus in morally diverse environments about which rules to monitor and enforce. In turn, group members will find themselves at a crossroads to compromise on how stringently to police deviations from norms. Hence, we predict that increased perceptions of loose norms in morally diverse communities will reduce monitoring of norm violations.
The Present Research
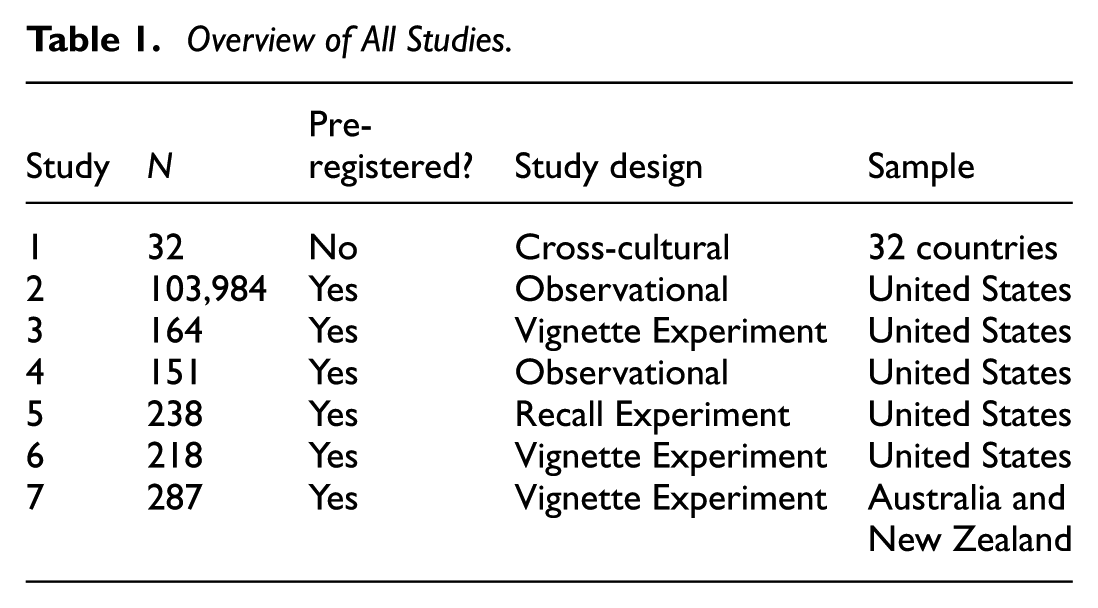
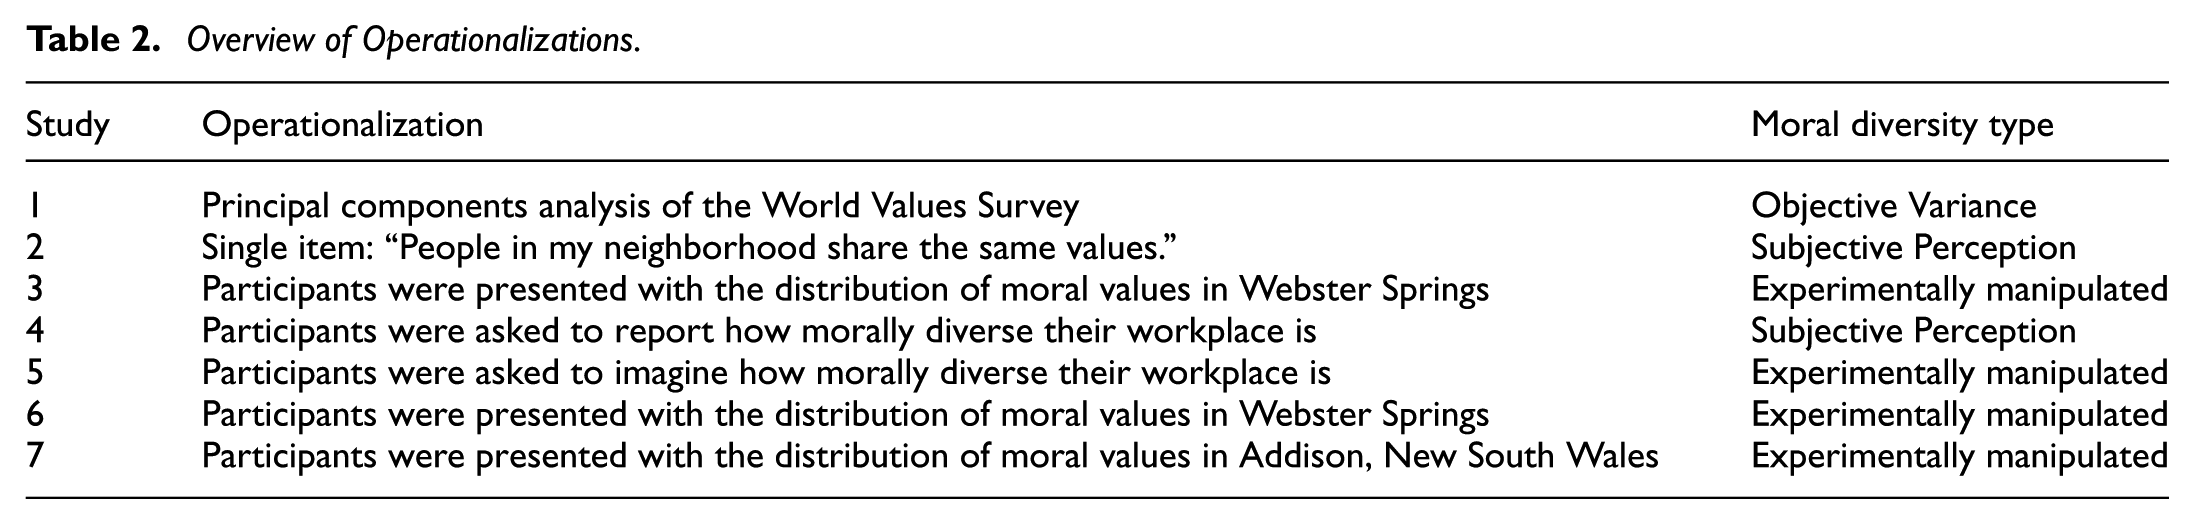
To test our predictions, we conduct seven studies using different methods and designs. We begin by performing a secondary analysis on two large-scale datasets (Studies 1 and 2) and deploying five laboratory studies (Studies 3–7). See Table 1 for an overview of our studies. Across all studies, informed consent was obtained from participants. Procedures were approved under IRB (2024-02-17201) at the first author’s university at the time of data collection. We note that Study 1 operationalizes objective moral diversity based on variance in moral outcomes, while other studies measure subjective moral diversity or manipulate it experimentally. As can be seen in Table 1, all studies were pre-registered except for Study 1 (exploratory). In Table 2, we provide an overview of our manipulations. Pre-registrations, codebook, study materials, code, and data are available on the following OSF page: https://osf.io/5tqfc/.
Overview of All Studies.
Overview of Operationalizations.
Study 1
To provide cross-cultural evidence for our theory, we combined two large-scale, cross-national data sets that independently measured moral values and norms around the same time. The first data set is the World Values Survey (WVS; Haerpfer et al., 2022). The WVS aims to encompass a representative sample of all individuals aged 18 and above in each country, with typically over 1,000 participants per nation. The second dataset focused on cultural tightness and responses to norm violations, which are closely aligned with our dependent variable (Eriksson et al., 2021). While our primary dependent variable is tightness (Gelfand et al., 2011), we also look at two other outcomes: physical confrontation (as a proxy for norm enforcement) and non-action (as a proxy for acceptance of norm violations).
Methods
Participants
We merged the two data sources: WVS’s 64-nation data set (total N = 94,278) on values and Eriksson et al. (2021)’s 57-nation dataset on cultural tightness and reactions to norm violations (the total N used by Eriksson et al. (2021) to create the 57-nation dataset is 22,863 responses). After cross-referencing, 32 nations were retained for our secondary, country-level analysis. Our post hoc power analysis suggested that, for a country-level analysis, we would only have adequate power (>80%) to detect moderate to large correlations (r > .47) at a significance level of .05.
Moral Diversity
A large number of items in the WVS ask people about their attitudes, values, and well-being. A total of 80 items and sub-items that focused on core values, religious values, and ethical decision-making were selected (see Supplementary Materials). Then, as a measure of group-level variation, we calculated the country-level standard deviation for each variable for each country. Finally, these 80 standard deviations were entered into a principal components analysis. We took the first principal component as it explained the most variance in cross-country variations. We took this variable as our country-level index of moral diversity. Figure 1A shows the distribution of this index across 32 countries. Using our moral diversity index, Nigeria, Indonesia, and Iran had the lowest diversity in morally relevant items, while Germany, the United Kingdom, and Australia had the highest.
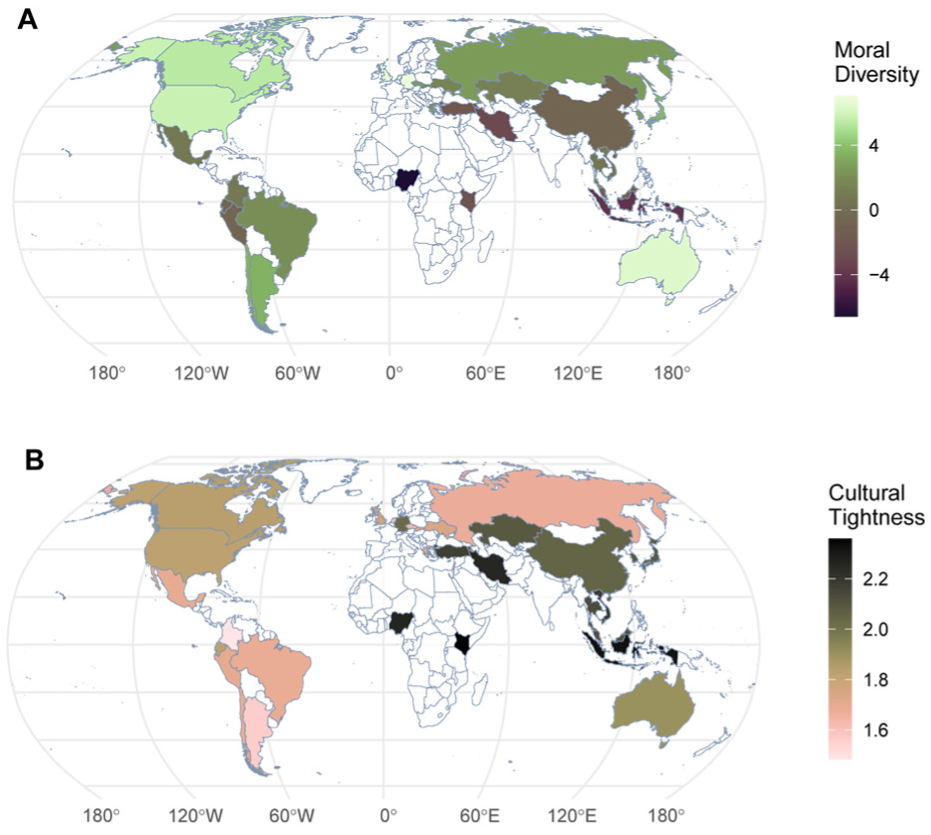
The Distributions of Country-Level Moral Diversity (Panel A) and Norm Tightness (Panel B)
Cultural Tightness
To get an estimate of country-level cultural tightness, we used Eriksson et al.’s data. All participants in this study were given the same six-item measure of tightness-looseness (example item: “There are many social norms that people are supposed to abide by in this country”). Country-level estimates of tightness have been found to be reliable in this dataset. Figure 1B shows the distribution of cultural tightness across 32 countries. Kenya, Indonesia, and Nigeria had the highest scores on tightness, while Colombia, Argentina, and the Netherlands had the loosest norms.
Response to Norm Violations
In addition to cultural tightness, we used two variables related to our core hypothesis about the acceptance of norm violators and direct enforcement of norms: physical confrontation (as a proxy for direct enforcement) and non-action (as a proxy for acceptance). Eriksson et al. used scenarios to measure metanorms, or the appropriateness of different norm-violation scenarios, which were selected to cover a variety of norm-violating behaviors in three domains: cooperation, out-of-place behaviors, and meta-violations. For further details, see Eriksson et al. (2021). We used country-level estimates of the appropriateness of physical confrontation (harsh enforcement of norm violations) and non-action (doing nothing in response to norm violations).
Results and Discussion
Correlation tables with all variables are reported in the Supplementary Materials. Supporting our main hypothesis, countries with higher levels of moral diversity showed substantially lower levels of norm tightness (r = −.51, 95% CI [−0.73, −0.20], p = .003). Morally diverse countries showed substantially lower ratings of physical confrontation in response to norm violations (r = −.78, 95% CI [−0.89, −0.59], p < .001). Furthermore, and consistent with our hypothesis, countries with higher levels of moral diversity were more likely to choose non-action (doing nothing) when encountering norm violations (r = .46, 95% CI [0.13, 0.70], p = .008). Replicating Eriksson et al. (2021), we found that, among these 32 countries, tighter countries showed higher levels of physical norm policing via physical confrontation (r = .50, 95% CI [0.28, 0.68], p < .001) and lower levels of non-action (r = −.30, 95% CI [−0.52, −0.04], p = .024).
Next, we ran a model with physical confrontation as the dependent variable, and moral diversity and cultural tightness as independent variables. In this model, both moral diversity (B = −0.06, SE = 0.01, p < .001) and cultural tightness (B = 0.33, SE = 0.16, p = .046) were associated with physical confrontation as a country-level metanorm. In this model, moral diversity (B = 0.02, SE = 0.01, p = .016) was associated with non-action as a country-level metanorm and cultural tightness’s effect was no longer associated with non-action as a country-level metanorm (B = 0.04, SE = 0.11, p = .740).
Study 2
In this pre-registered observational study, we operationalize moral diversity differently from Study 1. We used data from the “All of Us” Research hub (https://www.researchallofus.org/). This data set is created by the National Institutes of Health and comprises electronic health records, genomics, data, and surveys. We used the “Registered Tier” sample of this data set, which includes anonymized individual-level data from surveys. More information about the All of Us program can be found at https://allofus.nih.gov. The protocol for the program is available here: https://allofus.nih.gov/about/all-us-research-program-protocol.
Participants and Procedures
At the time of pre-registration, the data set contained 117,023 participants from the United States (62.47% female, 33.78% male, Mage = 59.55, SDage = 16.36). After applying our pre-registered exclusions, we retained 103,984 participants (62.38% female, 33.77% male, Mage = 59.22, SDage = 16.43). Due to privacy concerns, we are unable to post the All of Us dataset publicly. Our pre-registration is available at this link: https://osf.io/5tqfc.
Measures
Moral Diversity
Participants indicated the extent to which they agreed with the statement “People in my neighborhood share the same values” on a scale from 1 (Strongly disagree) to 5 (Strongly agree). As per our pre-registration, we reverse-scored this single-item measure such that higher values indicated higher moral diversity.
Norm Violations
Participants indicated the extent to which they agreed with the following statements about the prevalence of norm violations on a scale from 1 (Strongly disagree) to 4 (Strongly agree): “Vandalism is common in my neighborhood,”“There is a lot of crime in my neighborhood,”“There is too much drug use in my neighborhood,” and “There is too much alcohol use in my neighborhood” (α = .68).
Demographics
Participants reported their gender, age, and religiosity. We assessed religiosity using the following five items on a scale from 1 (Once in a while) to 6 (Many times a day): “How often do you feel God’s (or a higher power’s) love for you, directly or through others?”“How often do you desire to be closer to or in union with God (or a higher power)?”“How often do you find strength and comfort in your religion?”“How often do you feel God’s (or a higher power’s) presence?” and “How often do you feel that you are spiritually touched by the beauty of creation?” (α = .78).
Results and Discussion
Before data analysis, we pre-registered that we would treat the norm-violation scale as a single composite score if the internal consistency coefficient exceeded 0.70, and otherwise, we would run separate regressions for each item. As such, we first examined the reliability of our norm-violation measures. We found that, together, they had a standardized α of .68. So, we proceeded to analyze each item separately. Consistent with our pre-registered prediction, we found that, after controlling for age, gender, and religiosity, participants in more (vs. less) morally diverse communities perceived higher levels of vandalism (B = 0.16, SE = 0.003, p < .001), graffiti (B = 0.10, SE = 0.002, p < .001), excessive drug use (B = 0.28, SE = 0.003, p < .001), excessive alcohol use (B = 0.28, SE = 0.004, p < .001), crime during the day (B = 0.21, SE = 0.01, p < .001) and crime at night (B = 0.22, SE = 0.003, p < .001). These results provide further evidence that higher perceptions of moral diversity co-vary with perceptions of more norm violations.
Study 3
A limitation of Studies 1 and 2 is that we cannot establish that moral diversity generates perceptions of cultural looseness (rather than the other way around). Therefore, in this pre-registered experiment, we establish initial causal evidence for our hypotheses by manipulating moral diversity.
Participants and Procedures
In this study, we recruited 283 participants on Prolific (54.06% female, 1.8% nonbinary, Mage = 39.68, SDage = 14.58). We retained 164 participants who passed our manipulation and attention checks (50.61% female, < 1% nonbinary, Mage = 38.56, SDage = 13.41). We had hoped to retain 252 participants (our pre-registered sample size). However, this sample size still provided > 99% power to detect a medium-sized effect (η2 = .07).
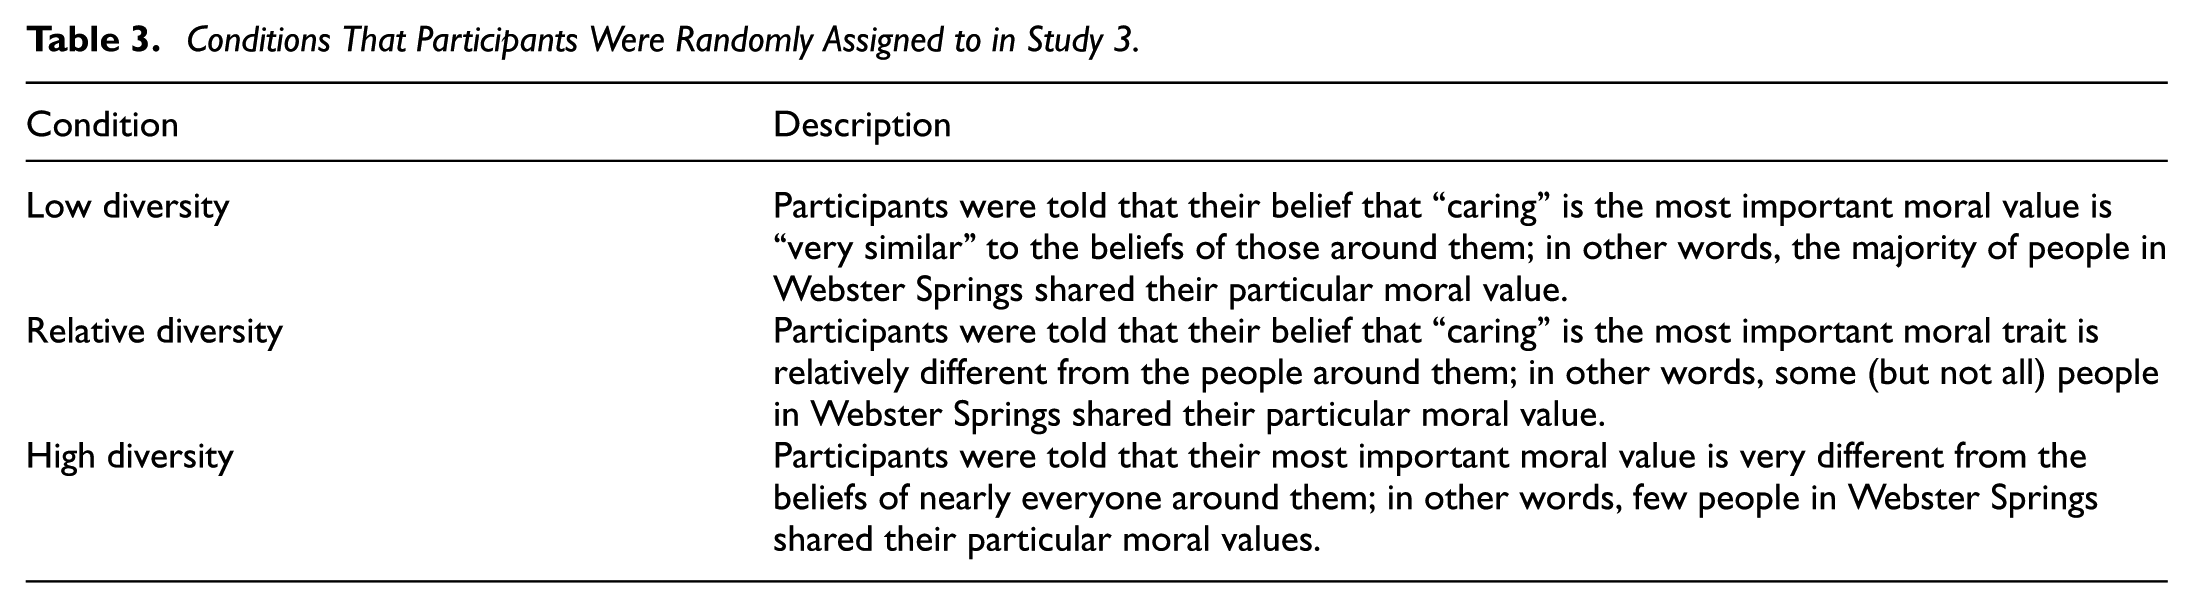
Upon consenting to participate in the study, we asked participants to report their age, gender, ethnicity, and their most important moral value. We used the typology of moral traits generated by Reed II & Aquino’s (2003): caring, compassionate, fair, friendly, generous, helpful, hardworking, honest, and kind. Using “caring” as an example, after ranking their moral values, we asked participants to briefly write about why the value of “caring” was the most important to them. Then, we presented our manipulations. We asked all participants to imagine that they lived in the fictional town of Webster Springs, Illinois, adapted from Hoover et al. (2021). Participants were randomly assigned to one of three conditions (see Table 3). Then, we presented the following measures.
Conditions That Participants Were Randomly Assigned to in Study 3.
Measures
Tightness
Participants completed a five-item measure of community norm tightness adapted from Gelfand et al. (2011) on a Likert-type scale ranging from 1 (Not at all) to 7 (Very much so). 1 Participants were prompted with “In Webster Springs . . .” before responding to the items. Example items included: “There are many social norms that people should abide by,”“There are very clear expectations for how people should act in most situations,” and “People agree upon what behaviors are appropriate versus inappropriate in most situations” (α = .81).
Acceptance of Norm Violations
We adapted a five-item measure of norm violation (Lian et al., 2023) and presented it on a Likert-type scale, ranging from 1 (Not at all) to 7 (Very much so). We asked participants to indicate the frequency with which they believed the other residents would find this post acceptable, appropriate, or expected (α = .93).
Norm Policing
We adapted a four-item measure of willingness to punish (Chen et al., 2022), which describes participants’ beliefs about whether others would ensure that the violator does not deviate from the group’s rules. Each item was rated on a scale from 1 (Never) to 5 (Always). Participants responded to the prompt “Other residents in Webster Springs would try to make sure that the person who posted this . . .” and then were presented with the following items: “acts morally,”“is held accountable when they do something wrong,”“gets punished if they do something wrong,” and “adheres to Webster Spring’s rules” (α = .86).
Results and Discussion
Descriptive statistics and correlations are summarized in Table 4 and visualized in Figure 2. We conducted a series of pre-registered one-way between-subjects Analyses of Variance (ANOVAs). We found significant results for tightness, F(2, 161) = 6.00, p = .003, η2 = .07. Tukey post hoc analyses revealed that there was not a significant difference between the high diversity and relative diversity conditions (p = .289, d = −0.29, 95% CI [−0.71, 0.15]), nor did the difference between the relative diversity and low diversity conditions reach significance (p = .094, d = .43, 95% CI [0.09, 0.82]). However, there was a substantial difference between the high and low diversity conditions (p = .002, d = −0.59, 95% CI [−1.01, −0.19]). These results suggest that, as perceptions of moral diversity increase, so do perceptions of how loose the community’s norms are.
Descriptive Statistics and Correlations (Study 3).
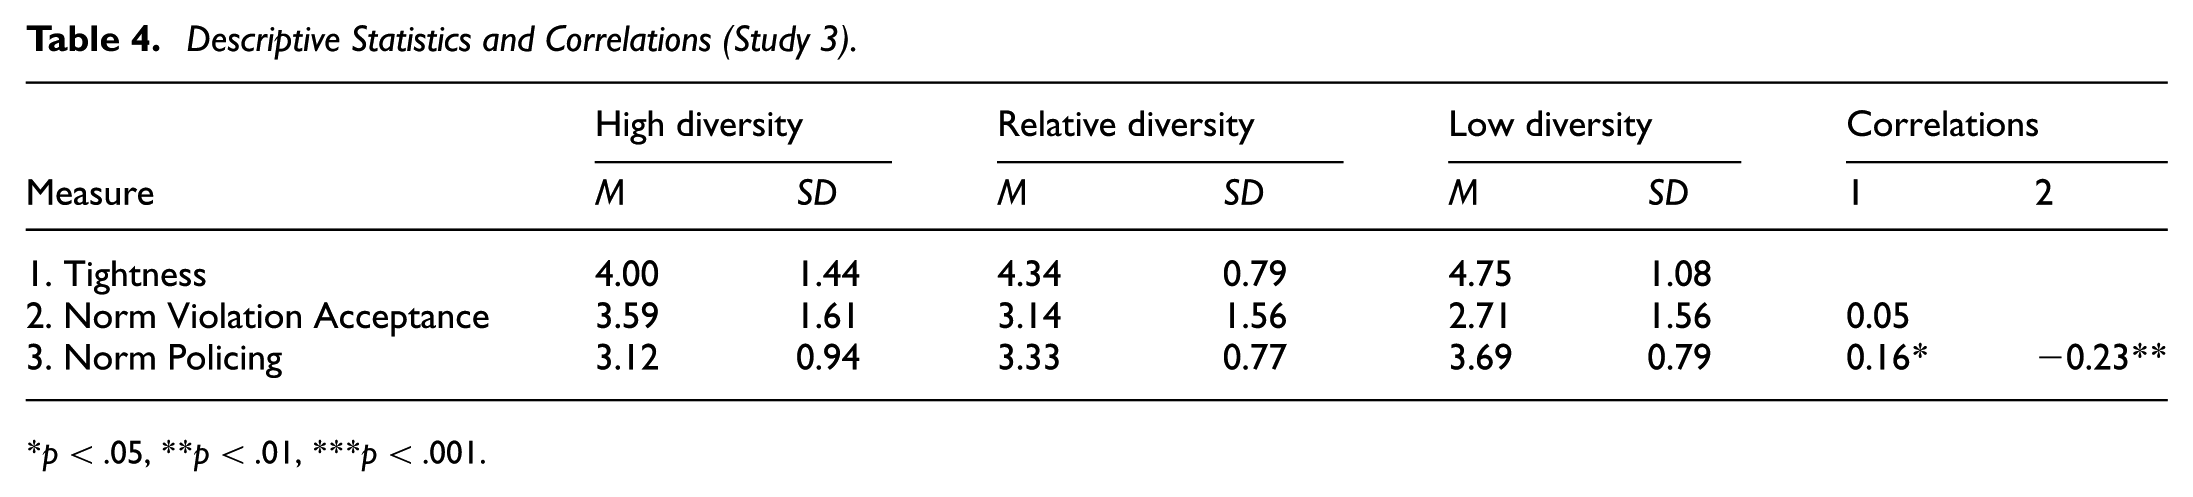
p < .05, **p < .01, ***p < .001.
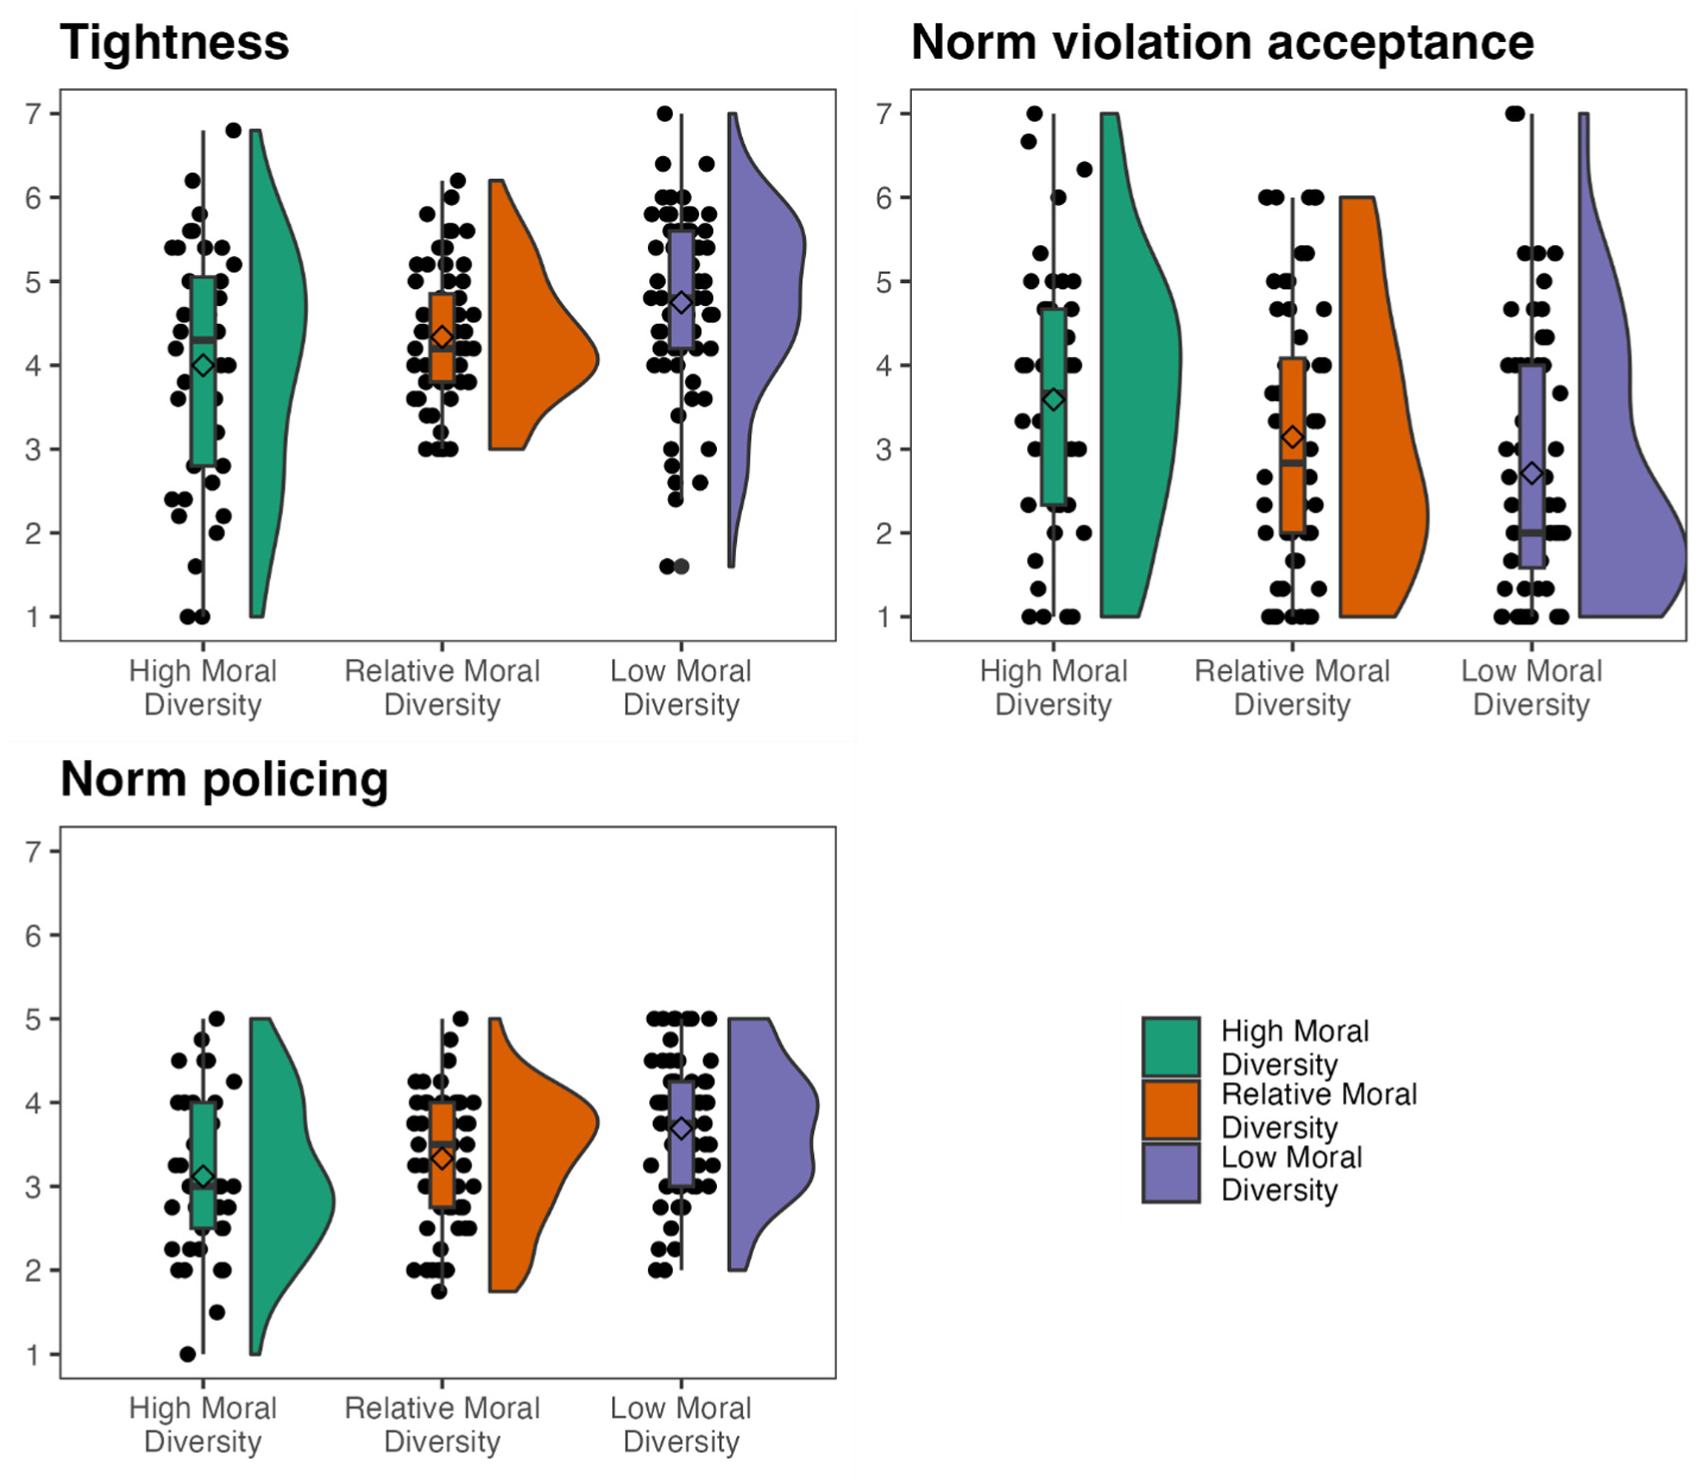
Results for Tightness, Norm Violation Acceptance, and Norm Policing (Study 3)
We also found significant results for acceptance of norm violations, F(2, 161) = 3.91, p = .022, η2 = .05. Tukey post hoc analyses revealed that there was not a significant difference between the high diversity and relative diversity conditions (p = .346; d = .28, 95% CI [−0.13, 0.72]), nor was there a significant difference between the relative diversity and low diversity (p = .282; d = −0.28, 95% CI [−0.66, 0.08]) conditions. However, again, there was a significant difference between the high and low diversity conditions (p = .017; d = .55, 95% CI [0.14, 0.99]). These results suggest that, as perceptions of moral diversity increase, so does acceptance of norm violations.
We found significant results for the norm policing measure, F(2, 161) = 6.54, p = .002, η2 = .08. Tukey post hoc analyses revealed that there was not a significant difference between the high diversity and relative diversity conditions (p = .408; d = −0.25, 95% CI [−0.72, 0.17]), but there was a significant difference between the relative diversity and low diversity (p = .043; d = .46, 95% CI [0.11, 0.79]) conditions, and between the high and low diversity conditions (p = .002; d = −0.66, 95% CI [−1.11, −0.25]). This pattern of effects suggests that, as perceptions of moral diversity increase, willingness to enforce norms decreases. However, one limitation of Study 3 is that the high moral diversity manipulation may have captured participants’ perceived discrepancy from the normative majority rather than dispersion of moral values per se, such that being a lone moral outlier may be psychologically distinct from being embedded within a morally heterogeneous group. We address this limitation in subsequent studies to further disentangle moral diversity, as group-level dispersion, from individual-level moral discrepancy.
Study 4
In Studies 4 and 5, we aimed to understand the extent to which perceptions of a community’s moral diversity influenced the acceptance of norm violations in a stereotypically conservative environment in terms of a shared understanding of what is appropriate: the workplace. Employees in workplaces often share common sets of goals, priorities, and rules about right and wrong that they did not establish, suggesting that not only will there be heightened moral homogeneity (i.e., everyone has highly similar moral values) but also fewer norm violations.
Participants and Procedures
In Study 4, we recruited 160 participants (48.75% female, 3.13% nonbinary, Mage = 37.31, SDage = 10.39) to reach our pre-registered sample size of 138 participants. We retained 151 participants who passed our pre-registered attention checks (48.34% female, 3.31% nonbinary, Mage = 37.39, SDage = 10.46), which was sufficient to detect a small effect size (r = .30) above 95% power.
Measures
After consenting to participate in the study, we informed participants that we were interested in their workplace experiences. We presented our measures. Unless otherwise specified, all items were presented on a scale from 1 (Not at all) to 7 (Very much so).
Moral Diversity
We asked participants, “How morally diverse is your workplace? In other words, in terms of the moral composition of your work environment, how many people have similar (or different) moral priorities?” Participants could select: “Everybody shares the same moral priorities” (coded as 1), “Almost everybody shares the same moral priorities. Those with other moral priorities differ from each other.” (coded as 2), “Many people share the same moral priorities. Those with other moral priorities differ from each other” (coded as 3), “Only a few people share the same moral priorities, everybody else’s moral priorities differ from each other” (coded as 4), and “Very few people share the same priorities” (coded as 5). We added that “everybody else’s moral priorities differ from each other” to specify that participants did not perceive a workplace where one group of people share the same moral priority, and everyone else shares a different moral priority (i.e., there is a moral “outgroup” vs. a moral “ingroup”; M = 2.71, SD = .88, Median = 3).
Tightness and Norm Policing
Participants completed the same measure of community norm tightness (α = .75) and norm policing (α = .87) as the previous study. To capture norm violation acceptance, we presented participants with behaviors describing workplace incivility, adapted from a scale used by Cortina et al. (2001) and employed the same five-item measure of norm violation acceptance from Lian et al. (2023), used in Study 2 (α = .92). We controlled for organizational (time in organization, power in organization, organization size) and demographic (gender, age, race) variables.
Results and Discussion
We used linear regressions to test our hypotheses. Table 5 provides correlations between variables for each study. There was a negative association between moral diversity and perceptions of tightness (B = −0.31, SE = 0.07, p < .001), and willingness to police norms (B = −0.24, SE = 0.09, p = .005). Furthermore, we found a positive relationship between moral diversity and acceptance of norm violations (B = 0.24, SE = 0.11, p = .041). We found support for these effects when including our covariates (see Table 6). These results are consistent with our predictions that increased moral diversity loosens community norms, decreases people’s willingness to enforce norms, and increases their acceptance of norm violations, even in settings like the workplace, where violations are typically less acceptable.
Descriptive Statistics and Correlations (Study 4).
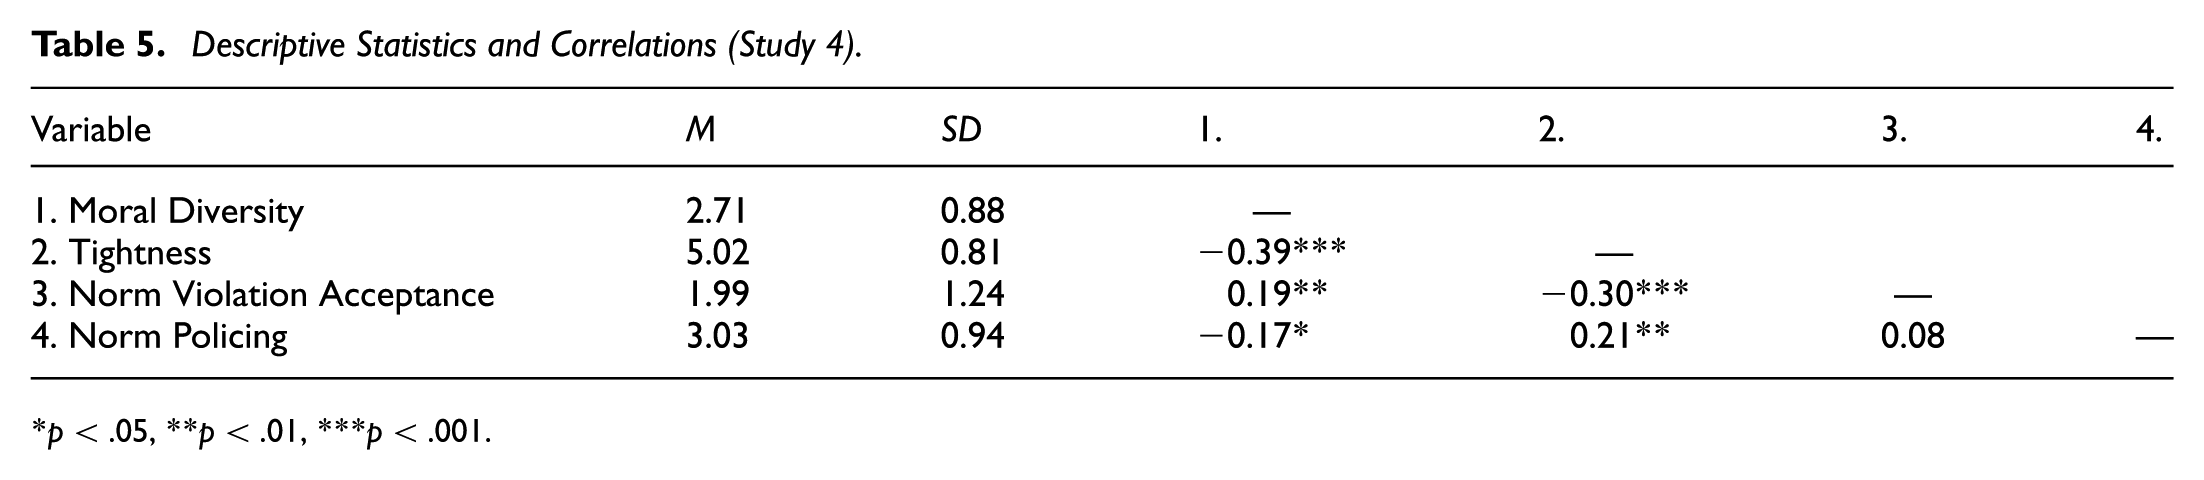
p < .05, **p < .01, ***p < .001.
Regression Results in Study 4 After Controlling for Organizational and Demographic Variables.
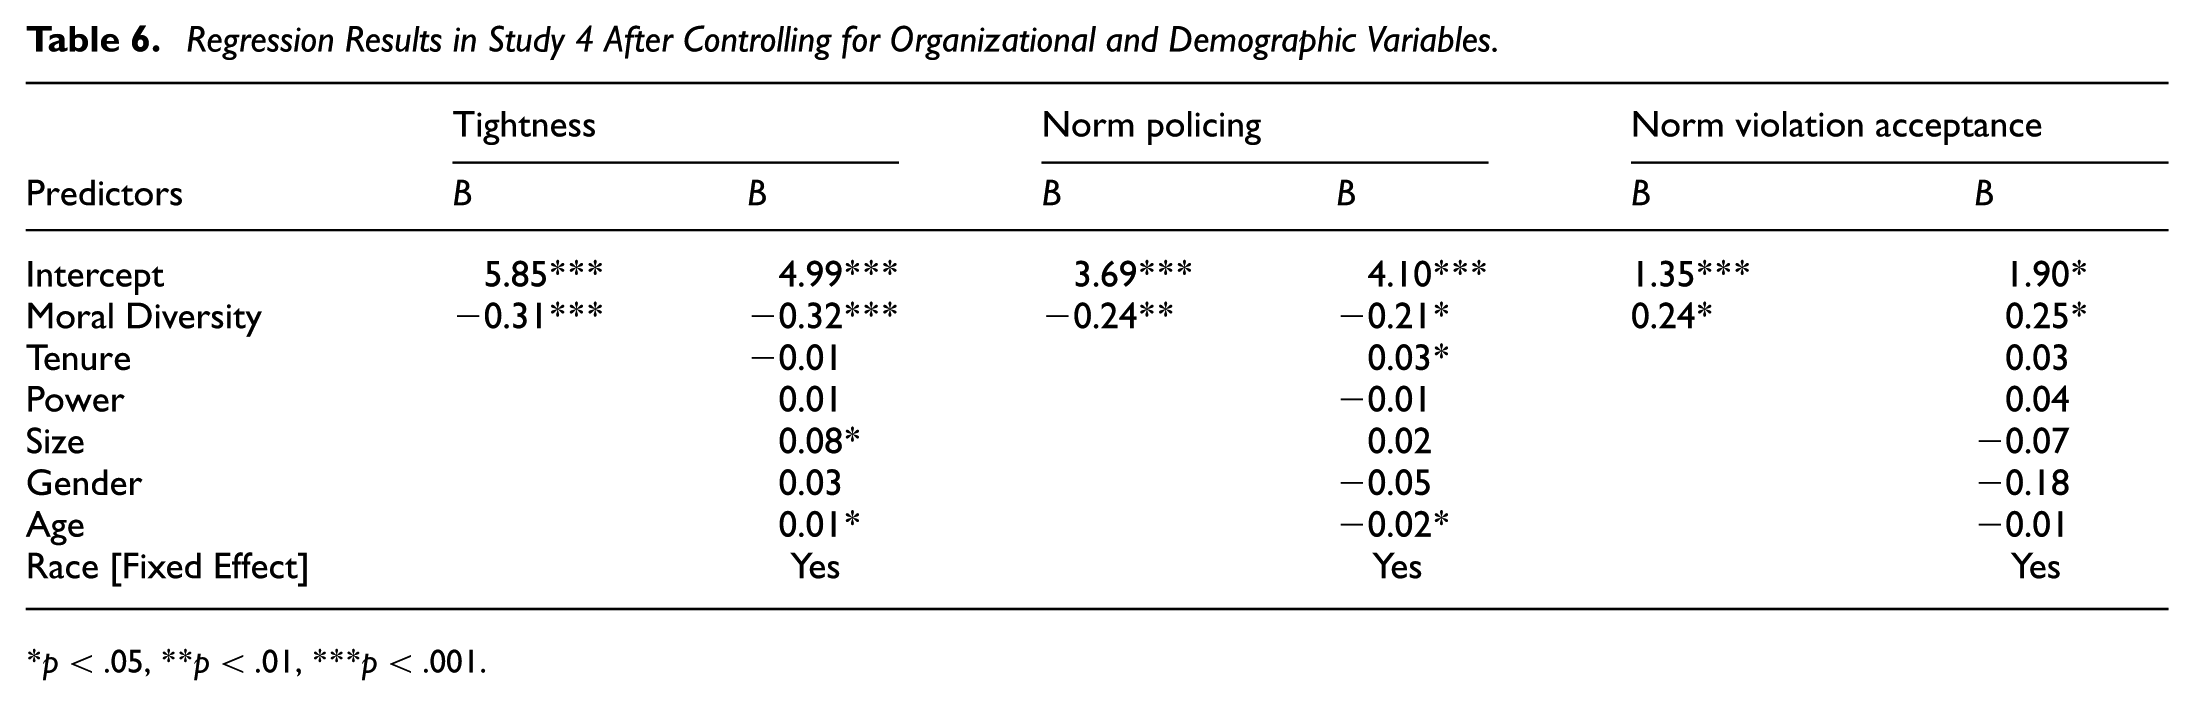
p < .05, **p < .01, ***p < .001.
Study 5
We replicated our results from Study 4 using an experimental design. In addition, we tested whether cultural tightness mediates the effect of our moral-diversity manipulation on our norm-violation variables.
Participants and Procedures
We recruited 310 participants (46.95% female, 1.29% nonbinary, Mage = 39.32, SDage = 11.82) to reach our pre-registered sample size of 280 participants. We retained 238 participants who passed our attention and manipulation checks (47.90% female, 1.68% nonbinary, Mage = 39.37, SDage = 11.83). With this sample size, we had >99% power to detect a medium-sized effect (η2 = .06).
After participants consented to participate in the study, we presented them with one of four conditions. In the first condition (the “high-diversity” condition), participants were asked to imagine that, in their workplace, very few people share the same moral priorities. In other words, nearly everybody has different moral priorities. In the “half-different” condition, about half of the people in their workplace had different moral priorities from each other, while the other half of the people had the same moral priorities. In the “half-same” condition, about half of the people had the same moral priorities, while the other half had different moral priorities from each other. In the “low-diversity” condition, nearly everybody had the same moral priorities.
Measures
Participants completed the same measures of norm tightness (α = .85), acceptance of norm violations (α = .93), and norm policing (α = .90) as Study 3. We also measured the same control variables as in Study 4.
Results and Discussion
Descriptive statistics and correlations are presented in Table 7. We conducted a series of one-way between-subjects ANOVAs comparing participants’ responses among the four conditions. We found significant results for tightness, F(3, 234) = 72.47, p < .001, η2 = .48, norm violation acceptance, F(3, 234) = 4.33, p = .005, η2 = .05, and norm policing, F(3, 234) = 34.81, p < .001, η2 = .31, supporting our predictions. Table 8 provides the post hoc comparisons for each outcome.
Descriptive Statistics and Correlations (Study 5).
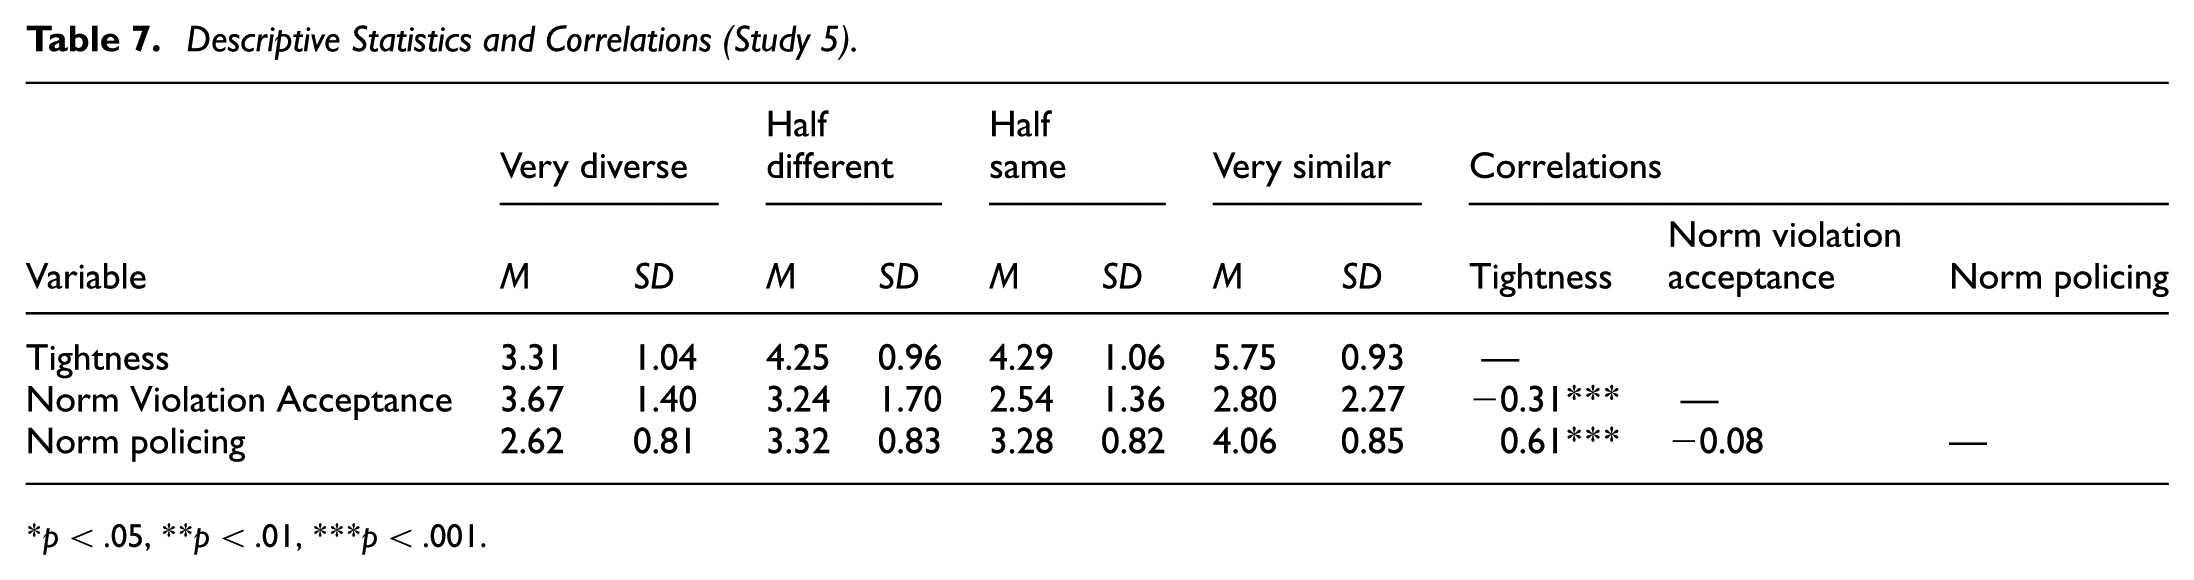
p < .05, **p < .01, ***p < .001.
Post Hoc Between-Group Comparisons (Study 5).
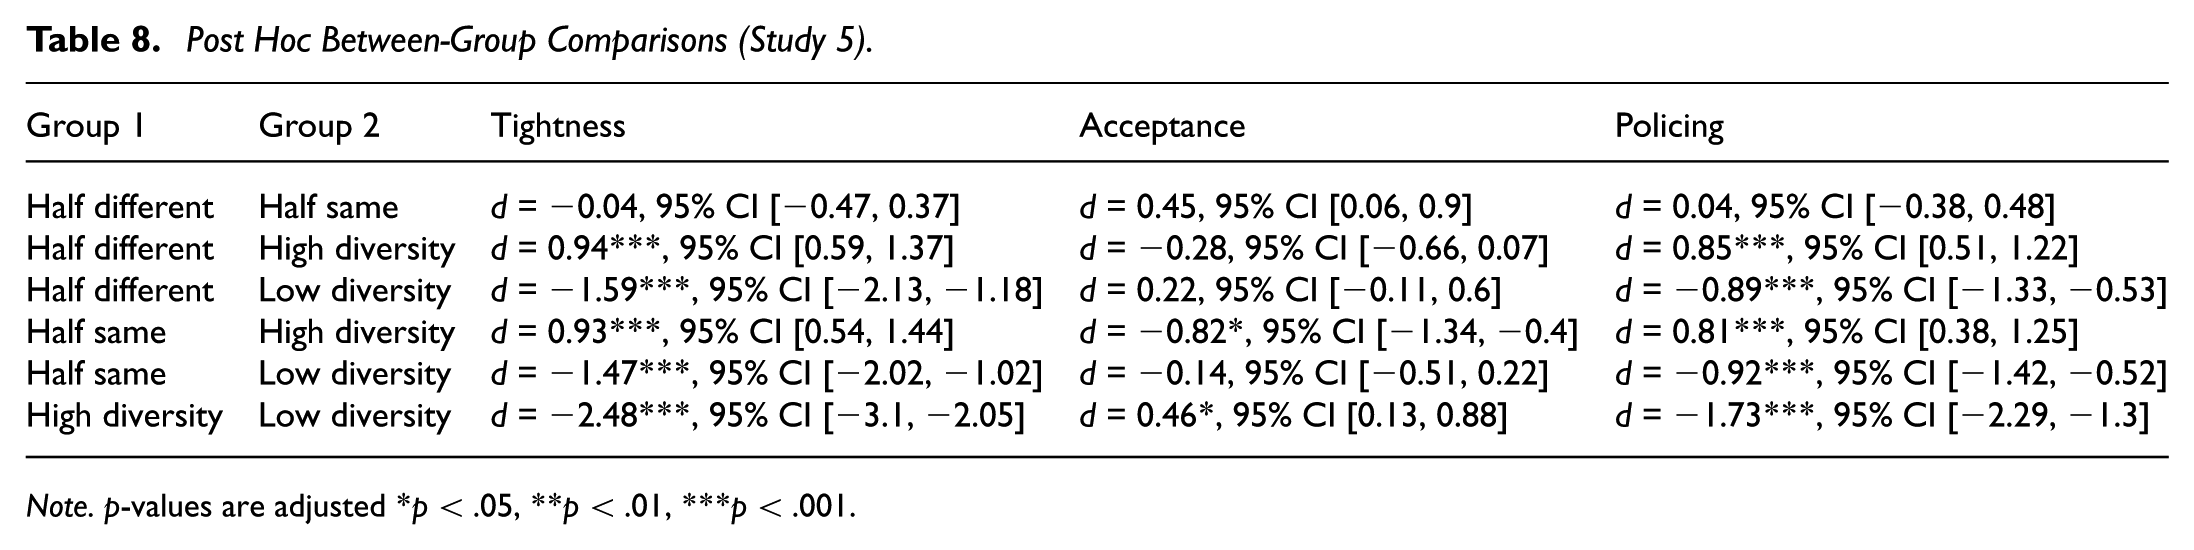
Note. p-values are adjusted *p < .05, **p < .01, ***p < .001.
Finally, we conducted pre-registered tests to determine whether perceptions of cultural tightness mediated the effect of our moral-diversity manipulation on outcomes. We did not find evidence for the mediating role of tightness in the relationship between moral diversity and norm violation acceptance (indirect effect = 0.00, SE = .09, 95% CI [−0.18, 0.18]). However, we did find a substantial mediation effect for norm policing (indirect effect = 0.35, SE = .04, 95% CI [0.26, 0.43]).
Study 6
Our prior studies had not accounted for the possibility that participants may consider themselves to be a part of their community’s moral ingroup or outgroup. In this study, we expand our operationalization of moral diversity to include a situation in which the participant is in an environment with high moral diversity, where there is no unbalanced representation of minority or majority moral values.
Participants and Procedures
We recruited 343 participants to Prolific (53.20% female, 2.03% nonbinary; Mage = 42.48, SDage = 14.79), pre-registering that we aimed to retain 310 participants. However, after applying our pre-registered exclusion criteria, we retained 218 participants (53.21% female, 3.21% nonbinary; Mage = 42.47, SDage = 15.17). With this sample size, we still had >99% power to detect a medium-sized effect (η2 = .06).
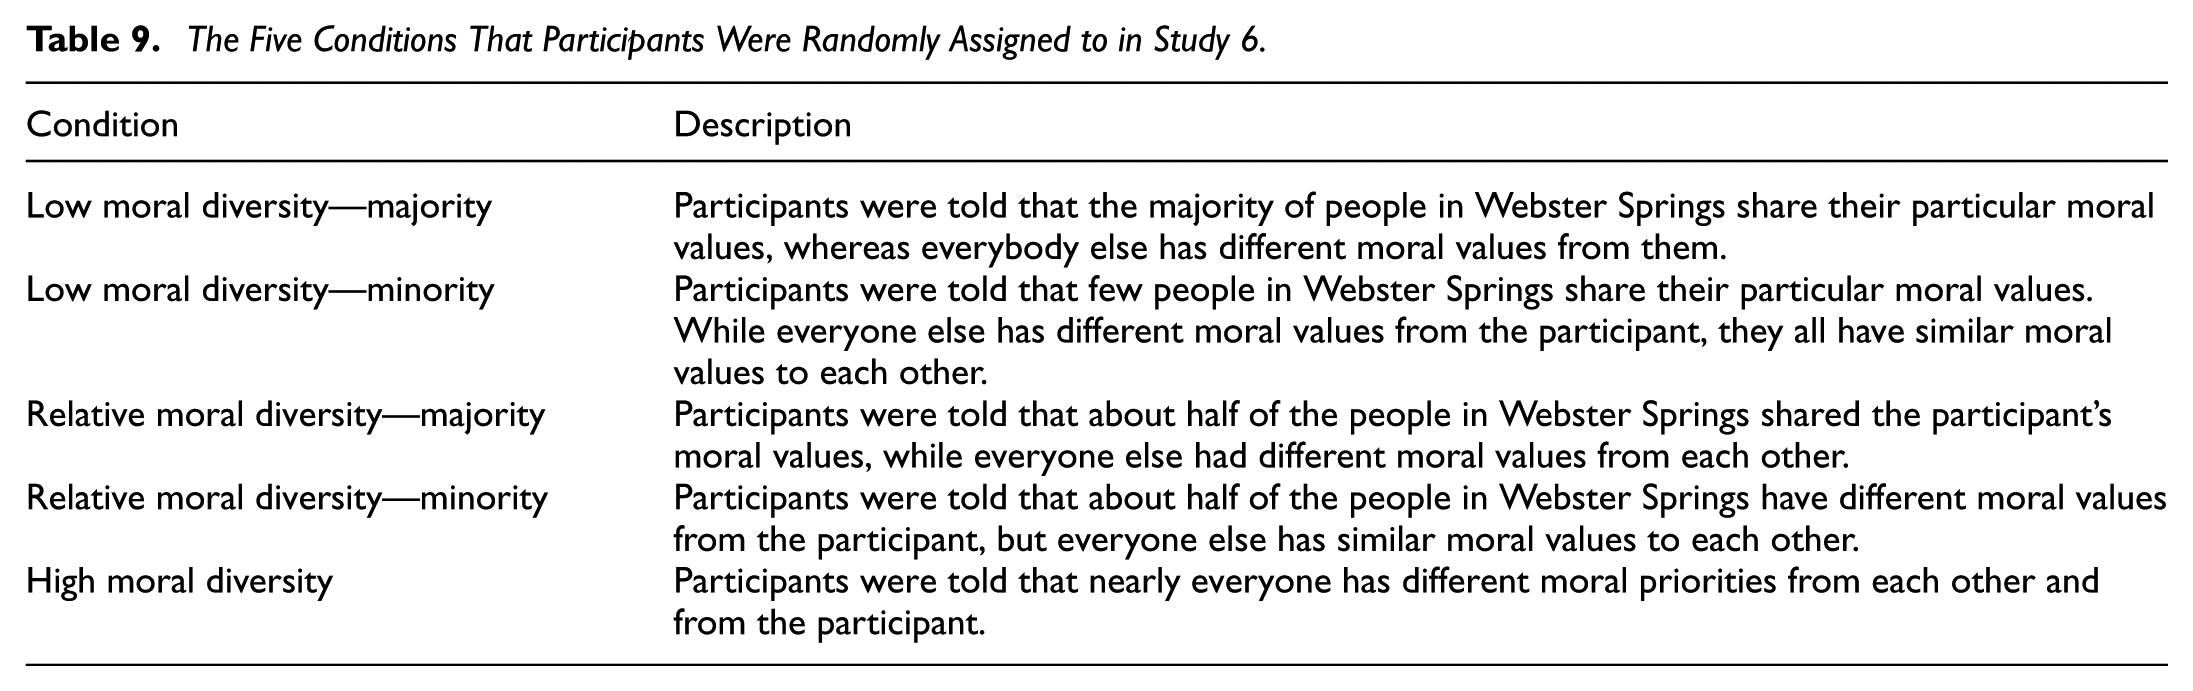
We followed a procedure similar to that of prior studies, asking participants to indicate which values they considered most important. This time, though, we used Schwartz’s (1992) 10 personal values (e.g., “power,”“universalism,” and “benevolence”). After ranking their values and explaining why their first-ranked moral value is their highest priority, participants were asked to imagine living in the town of Webster Springs, Illinois (see conditions in Table 9).
The Five Conditions That Participants Were Randomly Assigned to in Study 6.
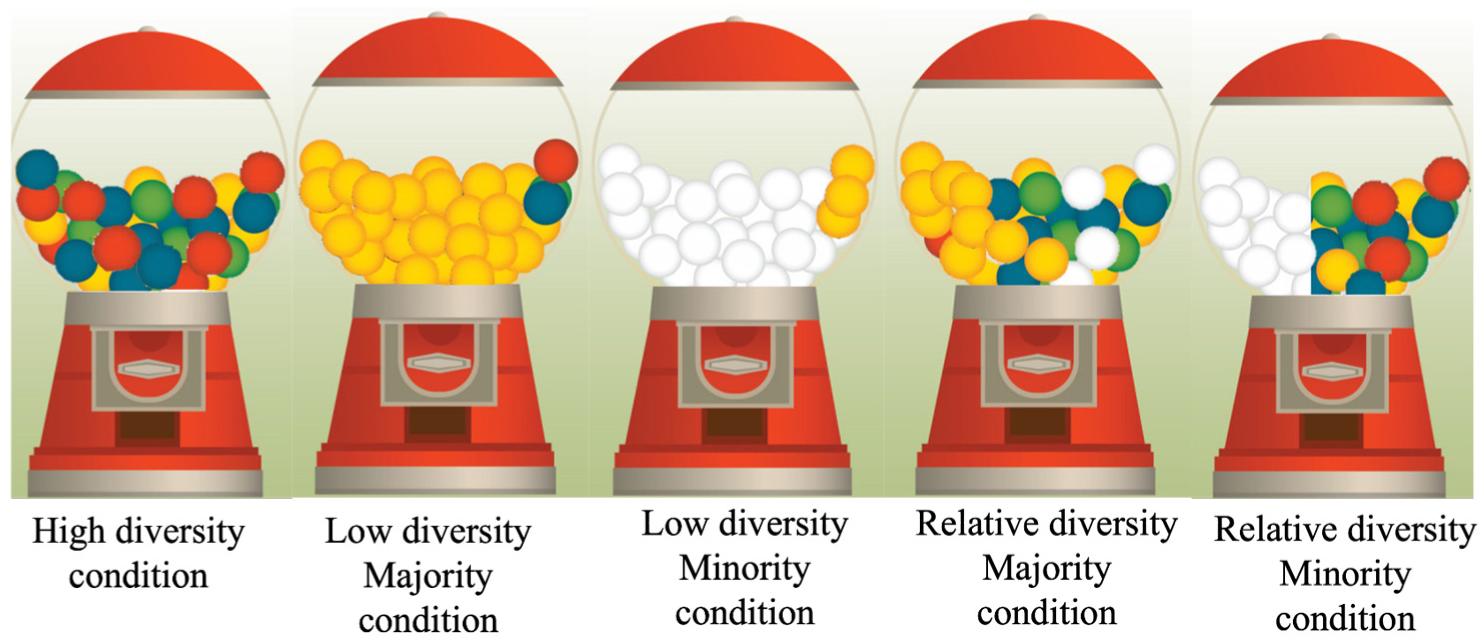
We then instructed participants to imagine that a golden gumball represented their moral value and presented a gumball machine with varying prevalences of the golden gumball among other gumballs (see Figure 3). We used these images to help visually illustrate how we intended for participants to think about moral diversity and being in the minority (vs. majority). Finally, in exploratory analyses to account for non-moral forms of diversity, we asked participants to indicate the extent to which they believed Webster Springs to be (a) racially diverse and (b) diverse in terms of geographic background. We present results of these analyses in the Supplementary Materials.
Visual Stimuli Showing Different Forms of Moral Diversity in a Group (Study 6)
Measures
Participants completed the same measures of norm tightness (α = .76) and norm policing (α = .88) as those used in previous studies. To measure norm violation acceptance, we asked participants to imagine that a Webster Springs resident had stolen from another and then presented them with the same five-item measure of norm violation acceptance, adapted from Lian et al. (2023), which we had used in our previous studies (α = .90).
Results
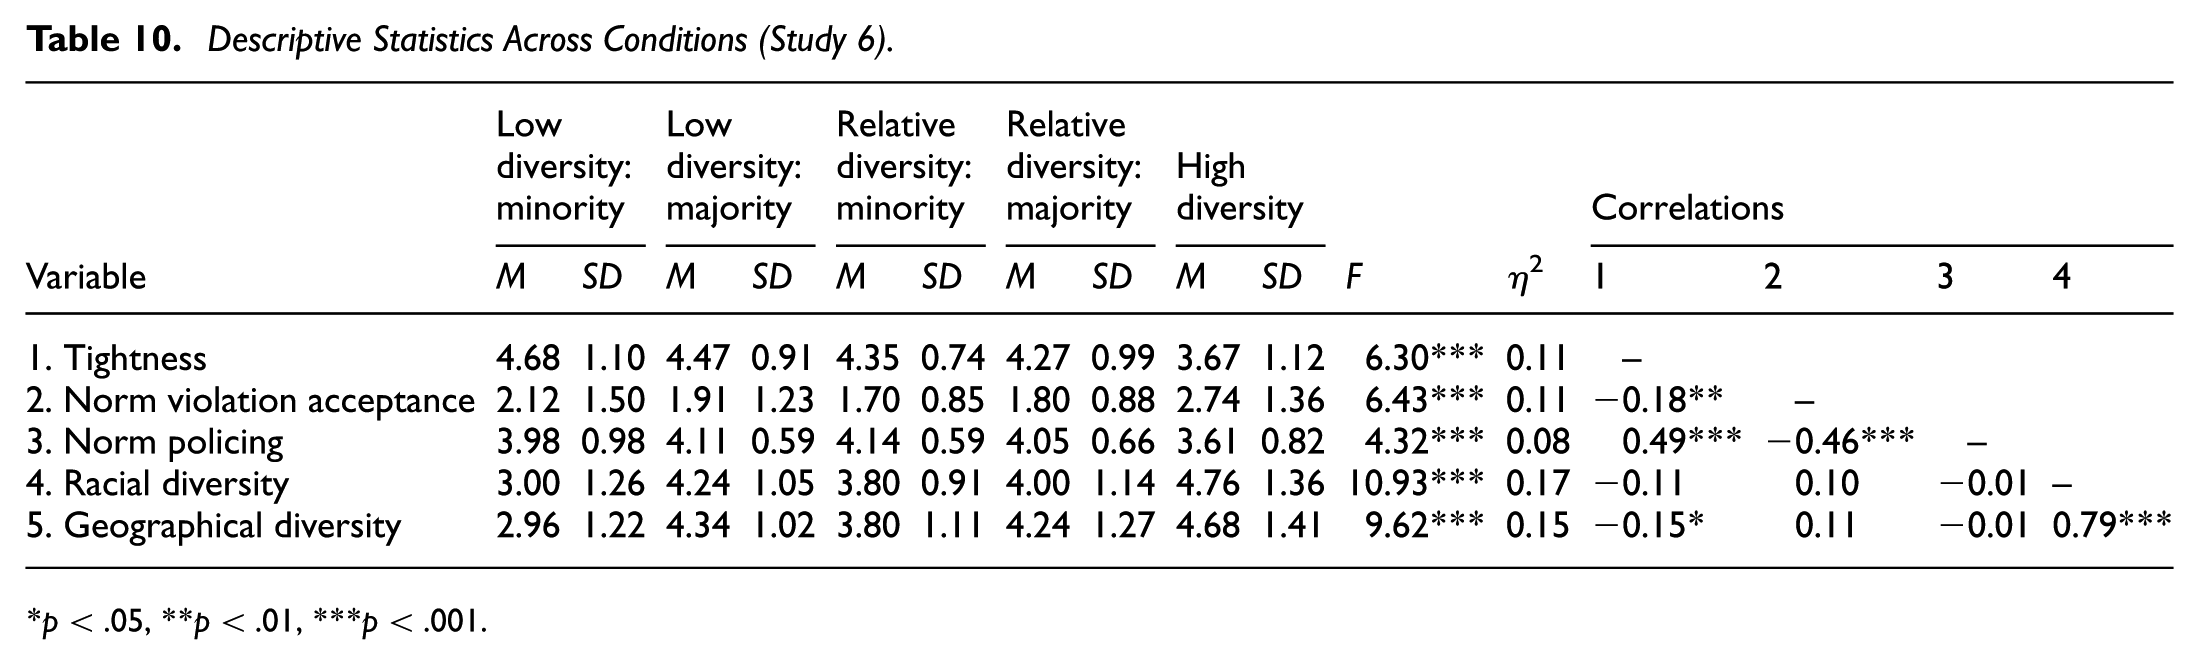
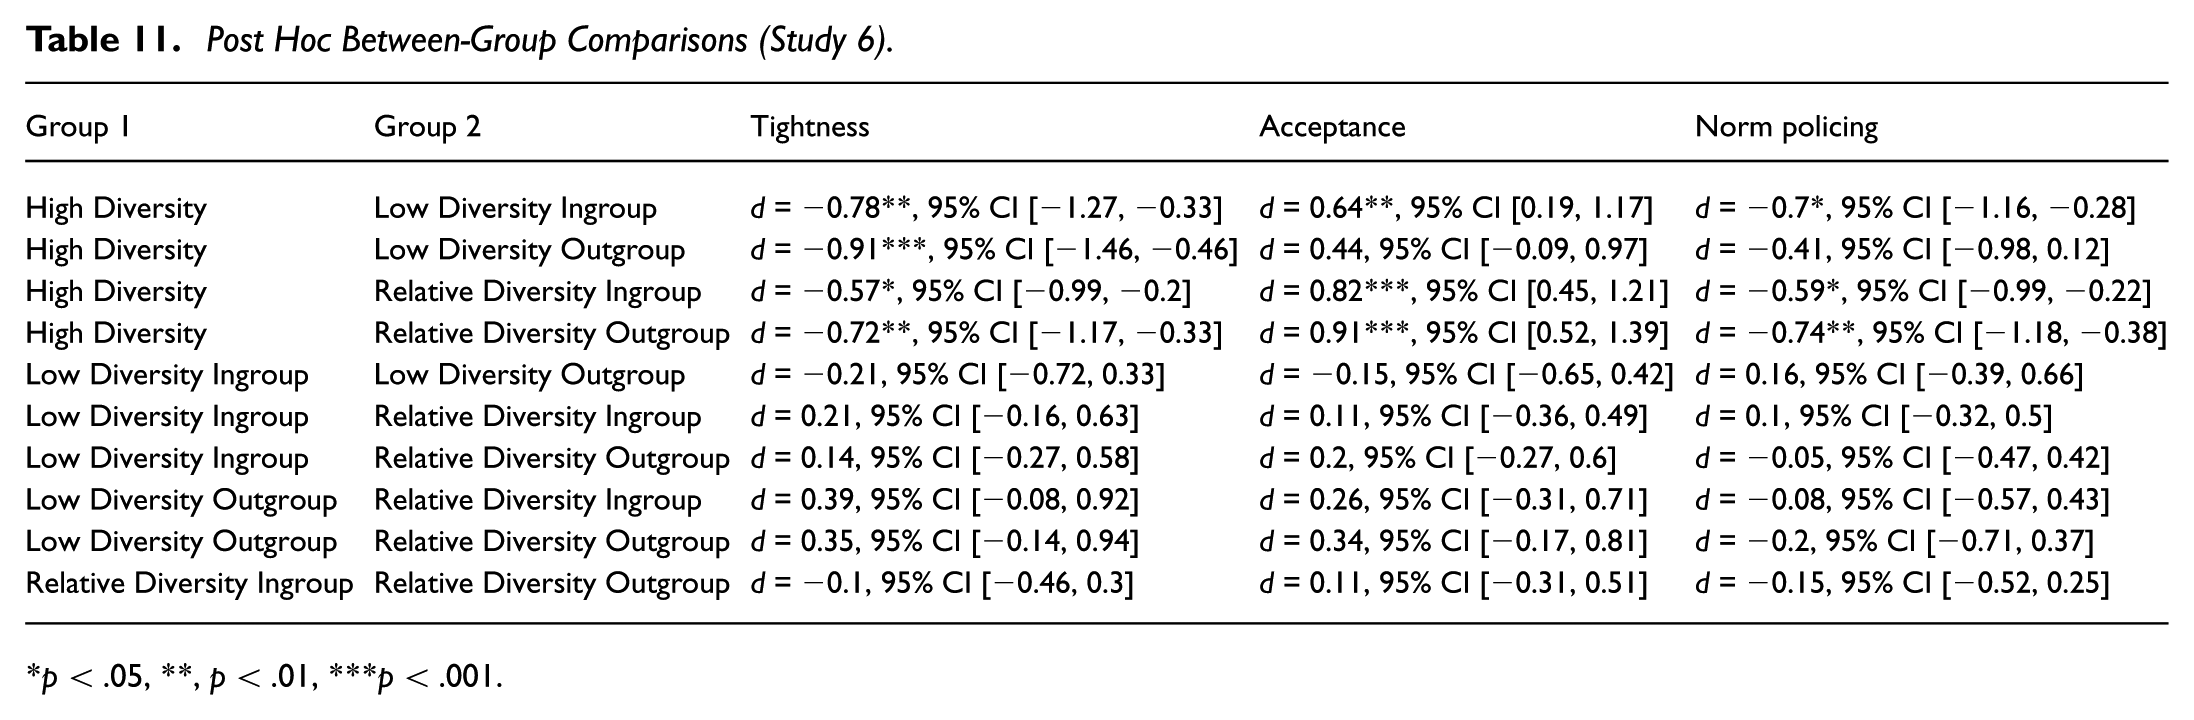
We conducted a series of one-way between-subjects ANOVAs to compare participants’ responses across the five conditions (see Figures 4 and 5). Supporting our hypotheses, we found significant results for cultural tightness, F(4, 213) = 6.30, p < .001, η2 = .11, norm violation acceptance, F(4, 213) = 6.43, p < .001, η2 = .11, and norm policing, F(4, 213) = 4.32, p = .002, η2 = .08. Table 10 summarizes descriptive statistics across conditions, and Table 11 provides post hoc comparisons, adjusting for multiple comparisons. Finally, consistent with our predictions, cultural tightness mediated the effects of our manipulation on norm violation acceptance (indirect effect = .04, SE = .02, 95% CI [0.00, 0.08]) and willingness to enforce norms (indirect effect = −0.08, SE = .02, 95% CI [−0.12, −0.04]).
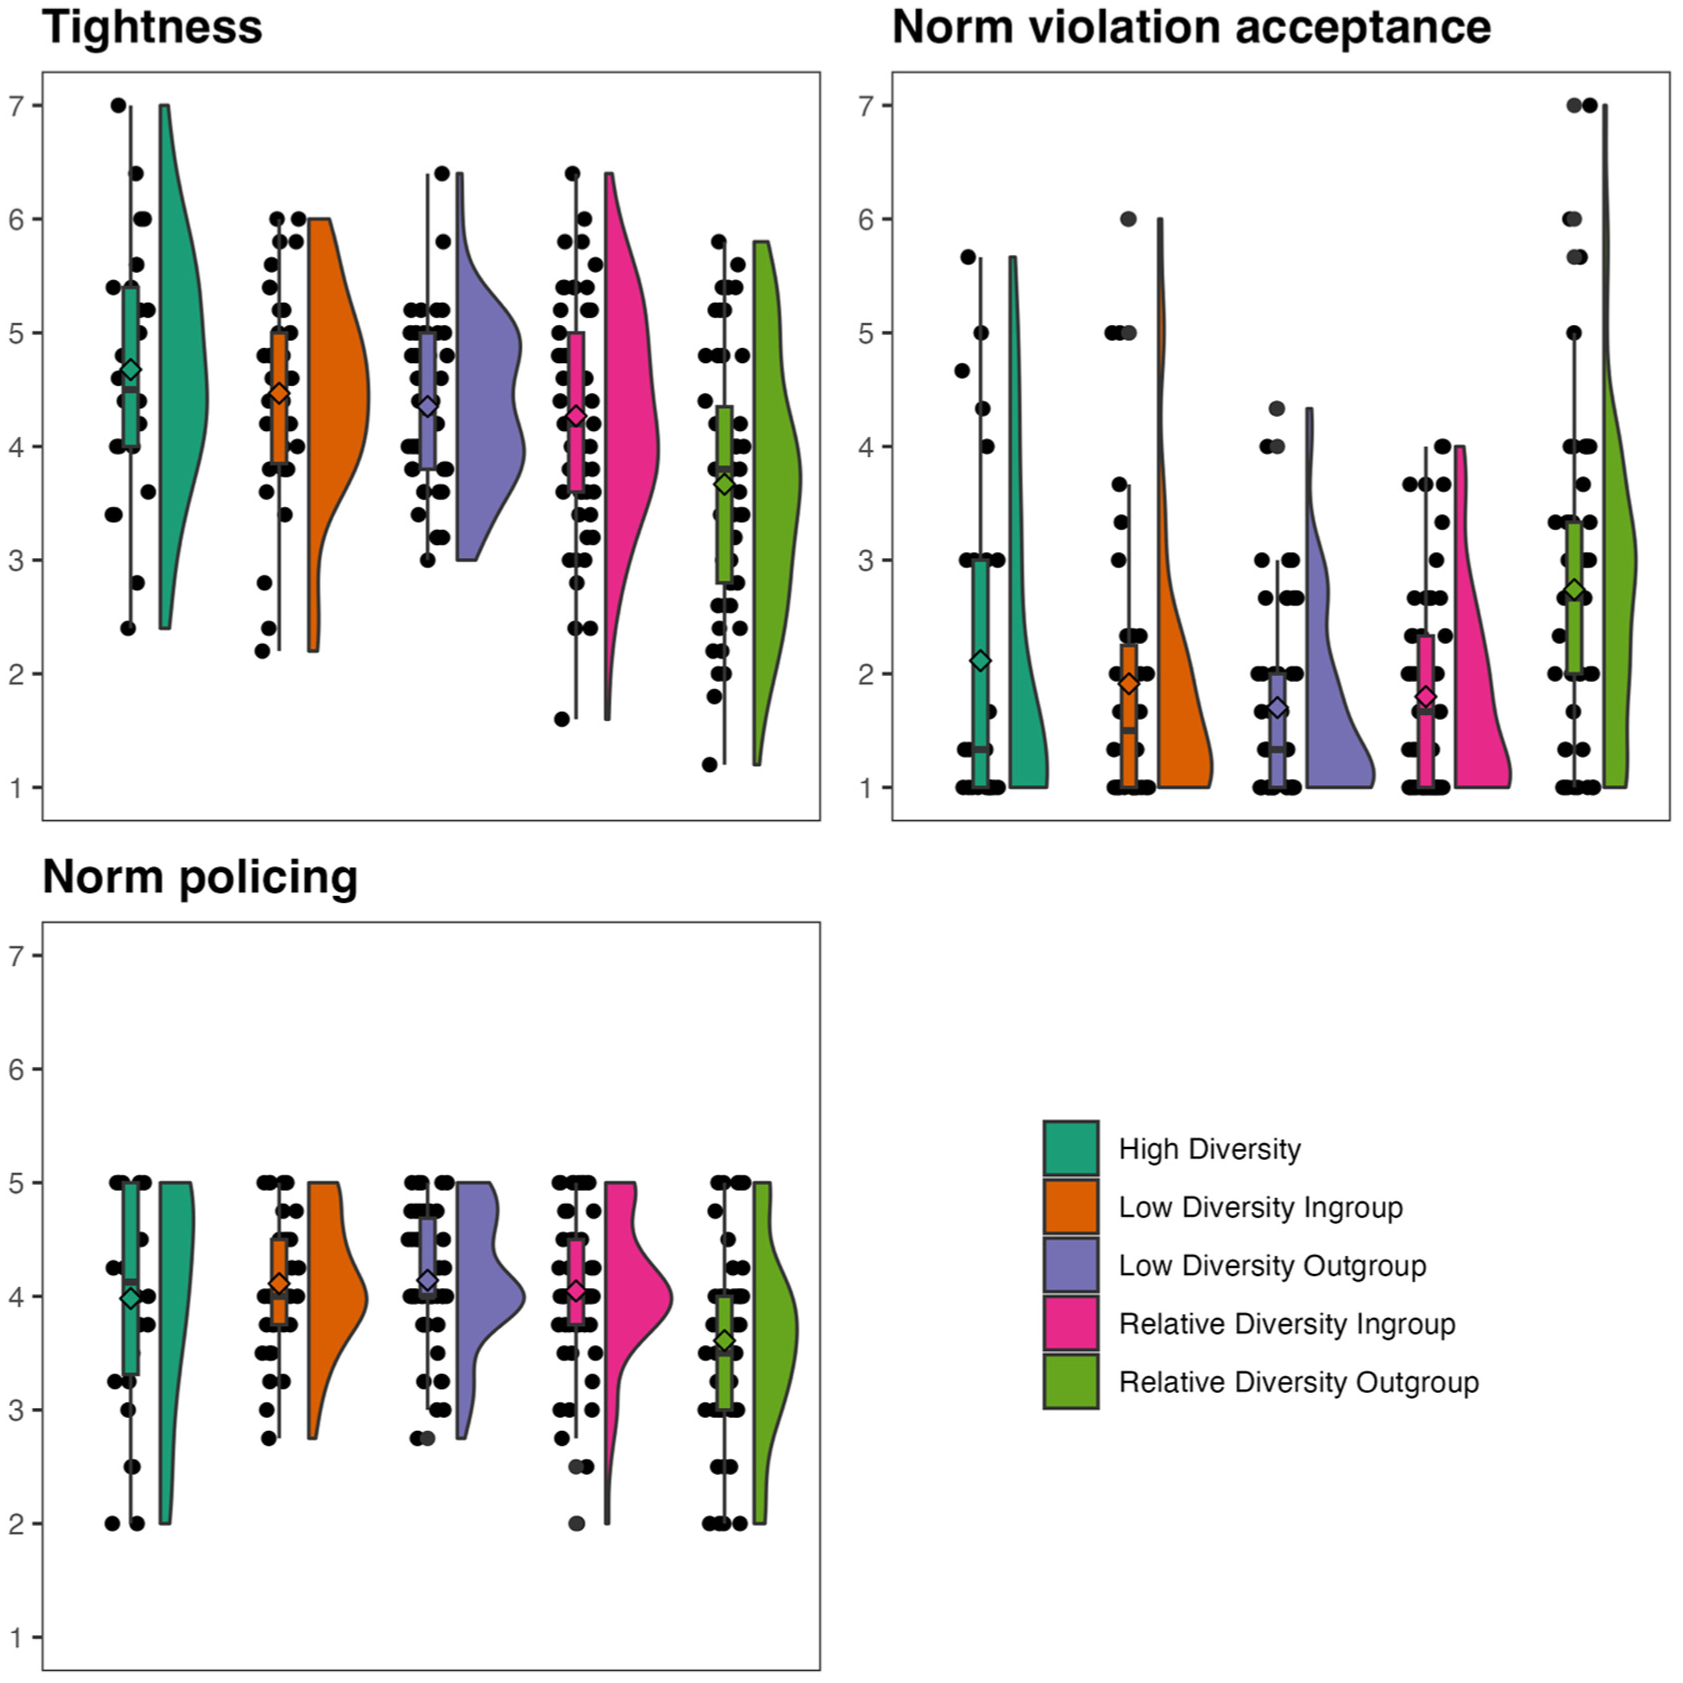
Results for Tightness, Norm Violation Acceptance, and Norm Policing (Study 6)
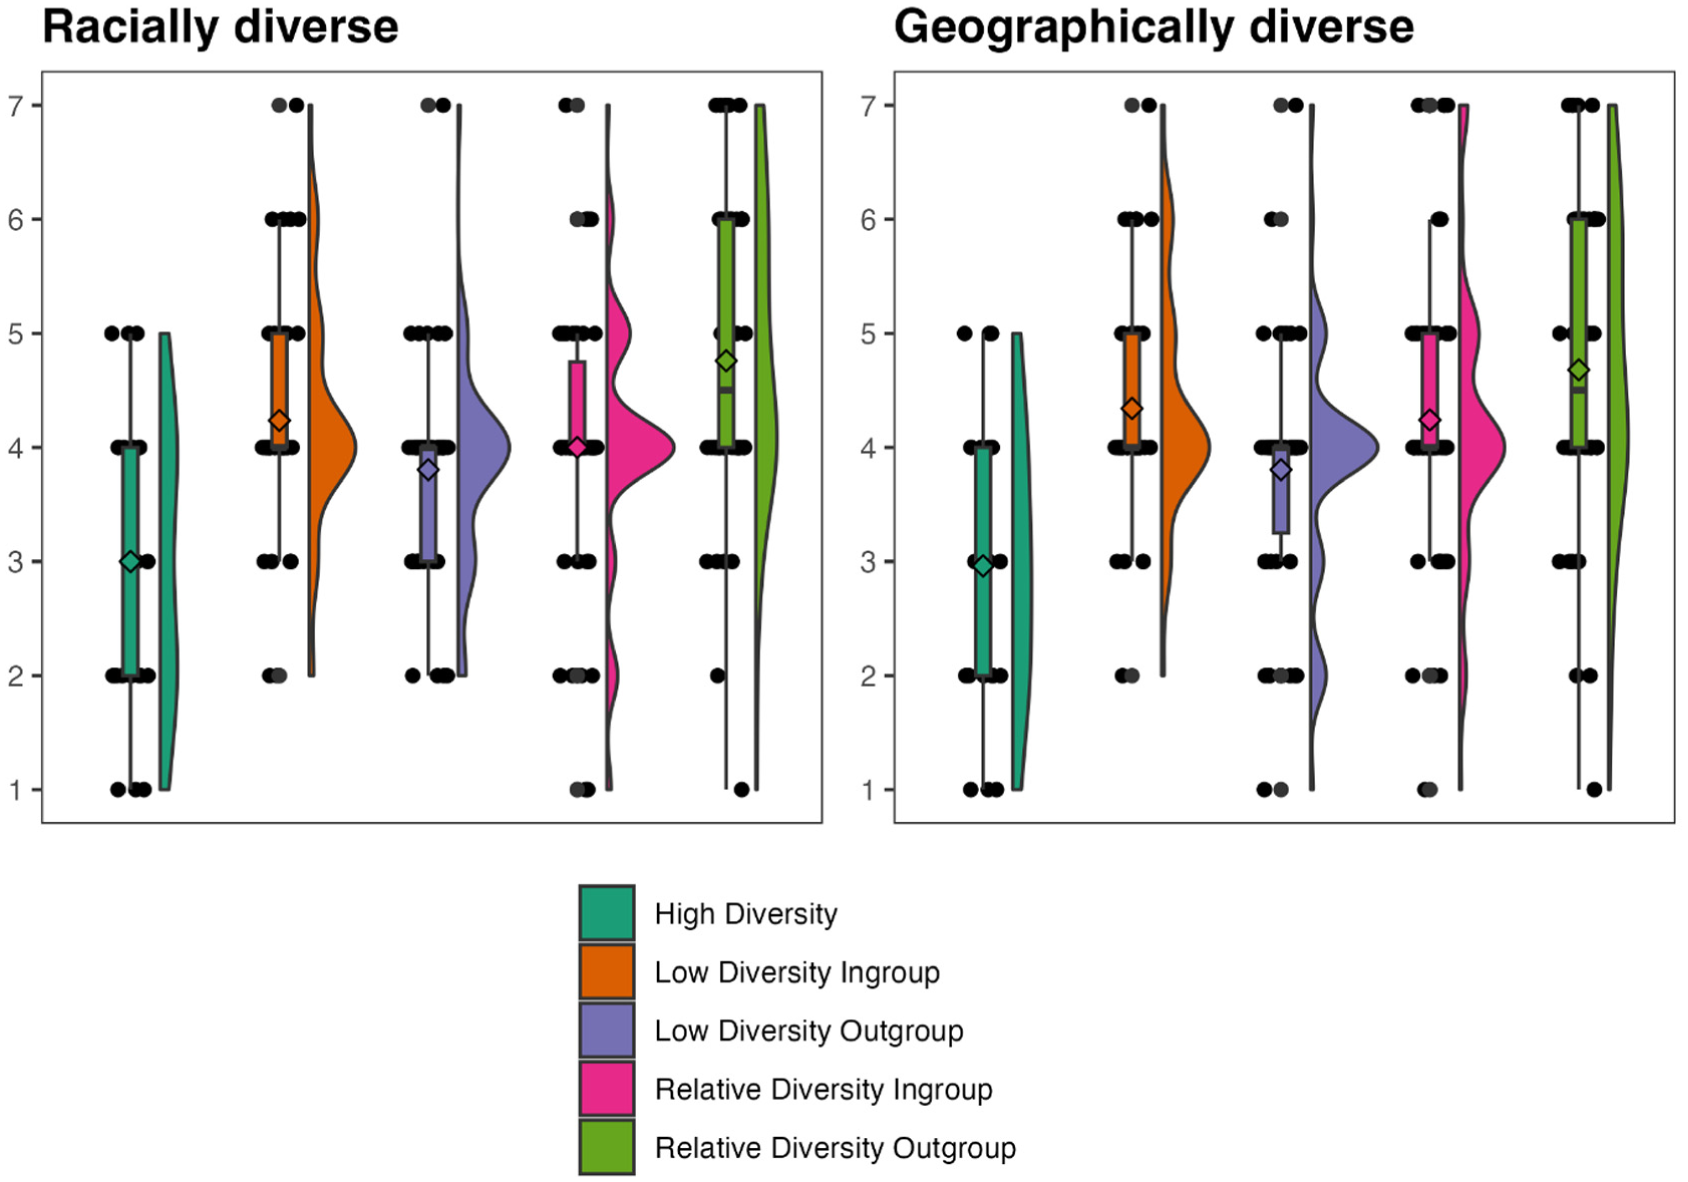
Results for Racial Diversity and Geographic Diversity (Study 6)
Descriptive Statistics Across Conditions (Study 6).
p < .05, **p < .01, ***p < .001.
Post Hoc Between-Group Comparisons (Study 6).
p < .05, **, p < .01, ***p < .001.
Study 7
Study 7 is fully presented in the Supplementary Materials. Here, we aimed to examine how perceptions of increasing racial diversity differed from perceptions of increasing moral diversity. Our design was identical to Study 6, with a few key changes: first, we collected data from participants in New Zealand and Australia. These countries were selected because they represent comparably high-immigration, Western democracies with meaningful variation in moral, cultural, and normative ecologies. Although the United States has greater heterogeneity in ethno-racial makeup, Australia and New Zealand have high rates of recent immigration, producing salient exposure to value pluralism within otherwise institutionally similar societies. Furthermore, conducting this study in these two countries allowed us to ensure that these patterns of results are not specific to the U.S. context. Second, we manipulated the moral (or racial) diversity of a fictional town: Addison, New South Wales, Australia (Thibodeau & Boroditsky, 2011). Third, we informed participants that an Addison resident had committed an act of vandalism, a norm violation that we had not previously used in our experiments. In short, our results in Study 7 provided additional evidence that, even in diverse cultural contexts such as Australia and New Zealand, moral diversity plays a unique role in predicting norm dynamics; it is a distinct form of diversity (Haidt et al., 2003).
General Discussion
Across seven studies, using cross-cultural, observational, and experimental approaches, we demonstrated that both objective indices of moral diversity (Study 1) as well as subjective perception of moral diversity (Studies 2–7) drive the acceptance and punishment of rule-breaking (e.g., incivility, call for violence, criminal activity). We consistently find that these perceptions are driven by the belief that there is higher flexibility in adhering to social norms. Moreover, we demonstrate that the effect of moral diversity has unique implications for the acceptance of norm violations, beyond those of racial diversity (Study 7).
Our findings indicate that variation in the distribution of moral priorities within a group is associated with how norm violations are perceived and policed. Across studies, norm violations, including violent crime, were punished less intensely in contexts characterized by higher moral diversity. One plausible explanation is that greater moral diversity may be linked to weaker normative consensus and, in turn, to comparatively looser normative environments in which rule-breaking elicits less severe social or institutional responses. This differs from past work, which has examined how norm violators can gain status (e.g., Van Kleef, 2023) or how norm violations may be perceived as serving the group’s goals (Keltner et al., 2011). Our research suggests that considering the relative prevalence of moral priorities can influence the acceptability of violence. This process may occur, in part, because higher moral diversity reduces the extent to which an environment has tight norms, thereby fostering more leniency toward people who break the rules.
Furthermore, we presented an important nuance in research that highlights the dangers of moral homogeneity (i.e., “echo chambers”). Research on morally similar environments suggests that moral homogeneity can promote ills such as intergroup hate (e.g., Atari et al., 2022) or the acceptability of violence (e.g., Mooijman, 2021). In these contexts, the alignment of moral values between a person and their group members makes them more willing to defend or promote their moral values if threatened by other rival groups. Our work on moral diversity, in the context of larger theorizing on moral diversity, suggests that there might be a “sweet spot” between extreme homogeneity and heterogeneity in morals, wherein common ground is established and destructive norm violations, intergroup hate, and violence are kept in check. Future research is encouraged to examine the boundaries of moral diversity in relation to both destructive group behaviors (e.g., outgroup derogation) and positive outcomes (e.g., intragroup cooperation). In addition, discrepancy from the norm may constitute a distinct psychological process from minority status per se. We encourage future researchers to unpack how discrepancy and diversity differ.
Our work has limitations worth noting. First, we did not examine how the tightness or looseness of norms interacts with high (or low) moral diversity. It is also crucial to understand the consequences of imposing strict norms on a morally diverse community. Second, while we have a cross-cultural study in 32 nations, our experimental results are predominantly derived from Western, English-speaking samples (the United States, New Zealand, and Australia). This limitation is particularly important because different populations have different baselines of cultural tightness-looseness, and relying on such participants results in a skewed representation of norm tightness from a global perspective (see Henrich et al., 2010). For example, in cultures with tighter norm enforcement or higher ecological threat, moral diversity may be less tolerated and more strongly regulated, hence attenuating any leniency toward rule breakers. Moreover, in many non-Western cultures, moral norms are more closely embedded in religion, which may constrain the variability of moral priorities and limit the emergence or implications of moral diversity observed here. Future cross-cultural work sampling a wider range of cultures will be essential for testing the boundary conditions of the present findings. Third, the present findings are agnostic about potentially positive aspects of moral diversity. For example, cultural looseness is associated with openness to more radical changes, while tighter cultures are less receptive to creative ideas (Chua et al., 2015). Given that moral diversity promotes cultural looseness, it might lead to creativity and innovation via cultural looseness.
Supplemental Material
sj-docx-1-spp-10.1177_19485506261429540 – Supplemental material for Moral Diversity Fosters Cultural Looseness and Reduces Norm Policing
Supplemental material, sj-docx-1-spp-10.1177_19485506261429540 for Moral Diversity Fosters Cultural Looseness and Reduces Norm Policing by Merrick R. Osborne and Mohammad Atari in Social Psychological and Personality Science
Footnotes
Handling Editor: Eranda Jayawickreme
Funding
The authors received no financial support for the research, authorship, and/or publication of this article.
Declaration of Conflicting Interests
The authors declared no potential conflicts of interest with respect to the research, authorship, and/or publication of this article.
Supplemental Material
The supplemental material is available in the online version of the article.
Notes
Author Biographies
References
Supplementary Material
Please find the following supplemental material available below.
For Open Access articles published under a Creative Commons License, all supplemental material carries the same license as the article it is associated with.
For non-Open Access articles published, all supplemental material carries a non-exclusive license, and permission requests for re-use of supplemental material or any part of supplemental material shall be sent directly to the copyright owner as specified in the copyright notice associated with the article.