
Abstract
Does ostracism disproportionally affect certain groups? Which groups are at greater risk, and in which social domains (e.g., family, workplace)? To address these questions, we adopted a descriptive approach, leveraging a probability-based sample of Dutch adults, with 5,290 participants and 22,075 ratings of ostracism experiences in various social domains. The distribution of ostracism ratings was zero-inflated and extremely skewed: the majority of values clustered at the left end of the spectrum, indicating ostracism as a rare experience; a smaller number of values formed a tail of statistical outliers indicating ostracism as a frequent experience. Low-income (vs. high) earners had over three times higher odds of facing ostracism frequently by family members and people at work. Immigrants had two to three times higher odds of experiencing ostracism frequently than non-immigrants across all domains. These results highlight group-based disparities in ostracism experiences and identify priority populations in need of support.
Ostracism—being ignored and excluded—has a wide range of adverse outcomes. Ostracism leads to emotional distress, elevates the risk of depression and suicidal thoughts, increases aggression and violence, and perpetuates societal divides (Bernstein et al., 2013, 2021; Chen et al., 2020; Marinucci & Riva, 2021; Ren et al., 2018; Riva et al., 2017; Wesselmann et al., 2015; Williams, 2009; Williams & Nida, 2022). Despite extensive research on ostracism, its prevalence and distribution patterns in the general population remain understudied. Does ostracism disproportionately affect certain groups? How is ostracism distributed across social domains such as family, friendships, and the workplace? To answer these questions, we adopted a descriptive epidemiology approach, commonly used in public health to map the distribution of diseases and identify disparities (Johnson et al., 2019; Lesko et al., 2022). Here, we adapt this approach to examine ostracism experiences among Dutch adults. Similar to describing the distribution of a health condition, we asked two questions pertaining to ostracism: Who experiences ostracism, and where does it occur?
“Who”: Ostracism Across Social Groups
To answer the question of “who,” we examined the prevalence of ostracism by several socio-demographic characteristics. We focused on three key social characteristics that are well-studied in the literature of group-based disparities (and available in the current dataset): gender (specifically, women vs. men), socioeconomic status (SES; including employment status, income levels, and education attainment), and immigration background. Rich literature in psychology and neighboring disciplines such as sociology, economics, and epidemiology shows that these characteristics are linked with increased exposure to social stressors such as discrimination, harassment, and violence (e.g., Adler & Stewart, 2010; Barreto & Doyle, 2023; Colella et al., 2017; Esses, 2021; Oram et al., 2017). For example, based on a U.S. sample collected in 2004–2005, 20% of low SES individuals reported discrimination, compared to just 7.4% in the high SES group (Jokela & Fuller-Rowell, 2022). According to a 2014 study in Canada, experiences of discrimination were more commonly reported by immigrants (17%) than non-immigrants (12%; Statistics Canada, 2018). Globally, women are twice as likely as men to experience sexual violence and harassment at work (International Labour Organization, 2022).
While the priority of ostracism research has been on answering causal questions rather than descriptive questions (e.g., what are the prevalence and distribution patterns of ostracism in a target population), recent studies provided evidence that ostracism distributes unequally across social groups. Specifically, one study examined the effect of employment status (and age) on ostracism and found that ostracism was more frequently reported by unemployed and young individuals (Albath et al., 2023). Another study tested a bi-directional causal link between financial scarcity and feelings of societal exclusion (Noordewier et al., 2025). Furthermore, “visible” immigration background (Middle East and Africa, Southeast Asia, Latin America) has been shown to be a predictor of ostracism experiences on campus among college students (Janke et al., 2023). Relatedly, in a series of studies, scholars focused on immigrants as study samples (Marinucci et al., 2022), motivated by compelling theoretical arguments that immigrants are at a greater risk of ostracism. Building on these studies, we sought to systematically map ostracism’s distribution across social groups based on gender, SES (employment status, income levels, educational attainment), and immigration background. This descriptive approach will allow us to quantify the prevalence of ostracism and identify group-based disparities.
“Where”: Ostracism Across Social Domains
To answer the question of “where,” rather than focusing on physical or geographical locations as epidemiological studies often do, we examined social spaces: the different social contexts in which ostracism happens (Büttner et al., 2024; Nezlek et al., 2012; Pancani et al., 2021). Although most studies have not compared ostracism across social domains (ostracism experiences are either measured as a global experience without specifying social domains or only in a specific domain such as the workplace), there are two exceptions. In a 2-week diary study (Nezlek et al., 2012), out of the ostracism events gathered from 40 participants, about two-thirds occurred among weaker relationships (e.g., strangers, acquaintances) and few occurred in close bonds (e.g., partner, relatives). A 2-week event-contingent study (Büttner et al., 2024) reported a different pattern: out of the ostracism events recorded from 323 participants, the most common sources were close relatives, people from work, and romantic partners; ostracism from strangers was relatively less common. One possible reason these two studies reported different results is that clustering was not accounted for in the descriptive statistics. As recent work has noted (Kip et al., 2025), recorded ostracism events (the base) were clustered within individuals, and some participants contributed more observations to this base than others. To illustrate, if person A reported 40 events with most occurring in the “work” context, while others reported few or none, “work” might appear to be the dominant context. But this pattern would primarily reflect person A’s experience rather than a general trend across participants. Here, in the current study, we addressed this limitation in the analyses of these earlier studies by having each participant provide one rating of their ostracism experience in each of five social domains, ranging from close relationships to interactions with strangers.
Considering Groups and Domains Jointly
We have so far argued that the prevalence of ostracism may vary across social groups and social domains. One possibility is that these two dimensions (groups and domains) need to be jointly considered. Put differently, the relevance of socio-demographic factors may vary across social domains. This possibility has not been explored in ostracism research but has received support by research on stigma. Drawing insights from the affordance-management theory of interpersonal invisibility, perceivers may evaluate target individuals as irrelevant, treating them with indifference and inattention—a form of ostracizing behavior (Neel & Lassetter, 2019). Critically, perceived irrelevance is context-dependent (Lassetter et al., 2021). For example, low SES individuals may be deemed as irrelevant and subsequently ostracized at work but not necessarily in domains involving established bonds (e.g., family relationships; Ko et al., 2019). To explore this possibility, we evaluated the contribution of the sources of variance (i.e., social groups, domains, and their interaction) in a variance component analysis, which we will explain further in the next section.
Current Research
We described the distribution patterns of ostracism in a probability-based sample of Dutch adults. Each participant reported their ostracism experiences across five social domains (family relationships, romantic relationships, friendships, workplace, and strangers). This dataset allowed us to map the distribution of ostracism among Dutch adults by social groups and domains.
Our analyses are descriptive and exploratory, conducted over three stages, with later stages informed by the findings of earlier stages. In Stage 1, we inspected the distribution of ostracism ratings and discovered a zero-inflated, skewed distribution: a large cluster of low values indicating ostracism as a rare experience and a tail of statistical outliers indicating ostracism as a frequent experience. This distribution indicates that the conventional statistics (means) are poor summaries of ostracism experiences. To distinguish ostracism as a rare versus frequent experience, we dichotomized the raw values into 0 (non-outliers) and 1 (outliers). In Stage 2, we conducted a variance component analysis (Martinez et al., 2020). This analytic approach, increasingly used in several research areas (Hehman et al., 2017; Kodapanakkal et al., 2021; Ren, Loh, et al., 2025), was applied to estimate the extent to which variation in ostracism outliers could be attributed to between-person differences (e.g., based on social characteristics), between-domain differences (e.g., family, friends, workplace), and their interaction. The results from this stage guided our decision on whether to focus subsequent analyses on groups, domains, or their intersection. In Stage 3, we conducted a detailed analysis to identify the specific social groups that are particularly vulnerable to ostracism as a frequent experience within each domain.
Method
Transparency and Openness
We did not pre-determine the sample size. We report all data exclusions (if any) and all measures in the study, and we follow JARS (Kazak, 2018). All data are available through the Longitudinal internet Studies for the Social Sciences (LISS; https://www.dataarchive.lissdata.nl; data sharing outside of the portal is not allowed). The analysis code, materials, and online supplementary files are on the project’s OSF page (https://osf.io/ezvru). Data were analyzed using R, version 4.2.2 (R Core Team, 2022). This study’s design and its analysis were not preregistered.
Sample
Data were collected through the LISS panel, a probability-based panel study of Dutch adults. The panel is administered and managed by the non-profit research institute Centerdata (Tilburg University, the Netherlands). The panel is derived from a true probability sample of households, selected from the population register by Statistics Netherlands. It includes 5,000 households, representing approximately 7,500 individuals aged 16 and older. Participation is strictly by invitation, with no option for self-registration. To ensure inclusivity, households that would otherwise face barriers to participation are provided with a basic computer and internet access. These measures ensure the panel’s quality and representativeness, setting it apart from other online panels where self-registration is common and non-internet users are typically excluded. For information on sampling strategy, please see https://www.lissdata.nl/methodology.
We fielded our survey in March 2022. To maximize the sample size, the survey was made available to all active 6,307 panel members, of whom 5,290 respondents completed the survey (response percentage 83.9%). The final sample consisted of all respondents (54% women; age M = 53.79, SD = 18.39, range = 16–98), resulting in 22,075 ratings of ostracism experience (see Table 1).
Number of Observations Per Social Domain
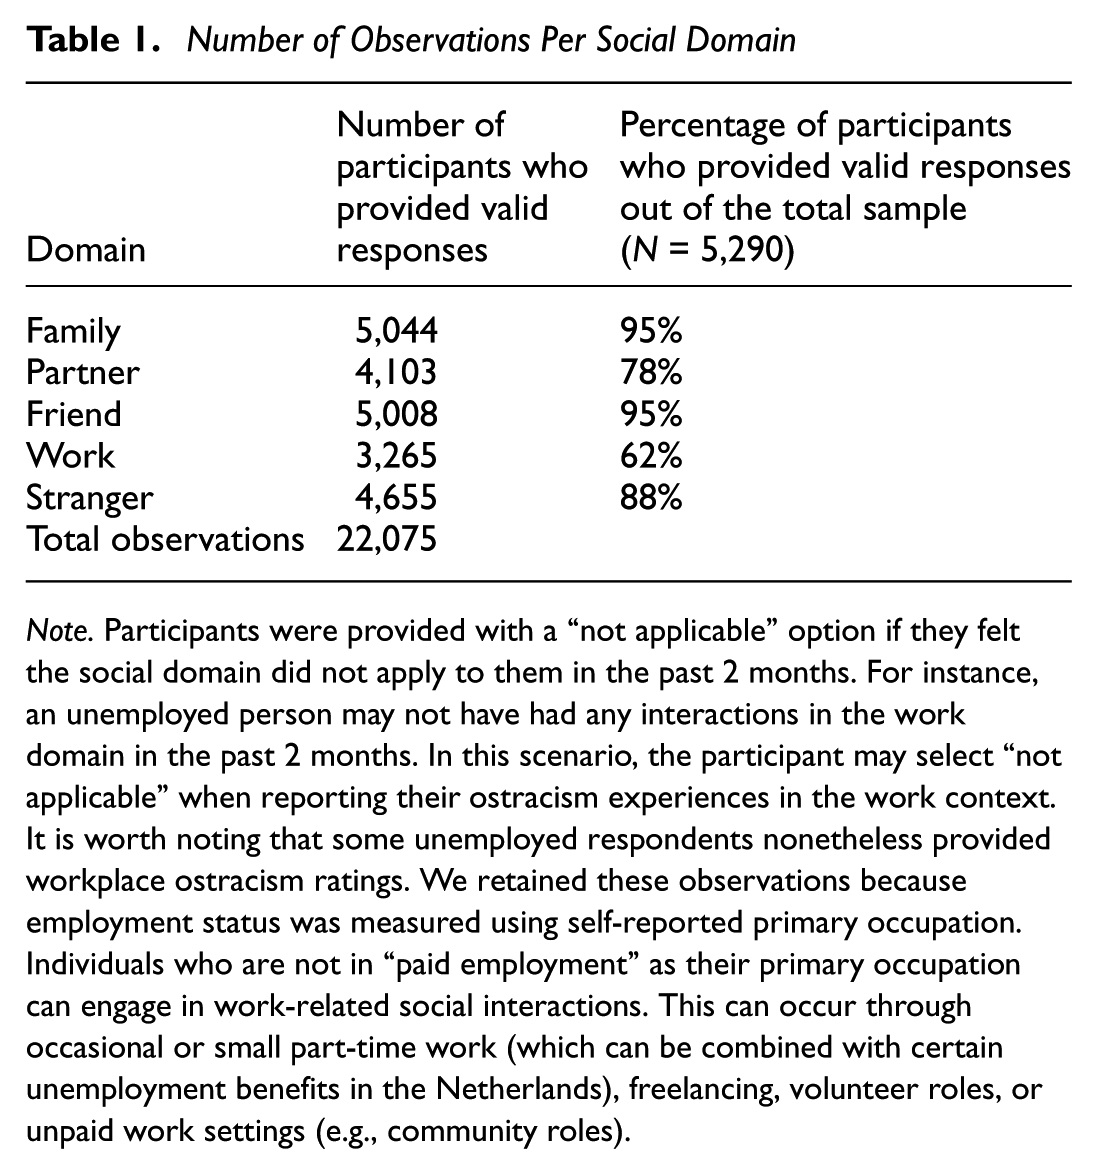
Note. Participants were provided with a “not applicable” option if they felt the social domain did not apply to them in the past 2 months. For instance, an unemployed person may not have had any interactions in the work domain in the past 2 months. In this scenario, the participant may select “not applicable” when reporting their ostracism experiences in the work context. It is worth noting that some unemployed respondents nonetheless provided workplace ostracism ratings. We retained these observations because employment status was measured using self-reported primary occupation. Individuals who are not in “paid employment” as their primary occupation can engage in work-related social interactions. This can occur through occasional or small part-time work (which can be combined with certain unemployment benefits in the Netherlands), freelancing, volunteer roles, or unpaid work settings (e.g., community roles).
Design and Measures
Each participant reported their ostracism experiences in a variety of social domains. Below we will describe the measure of domain-specific ostracism that we designed for this research, and then turn to the measures of social characteristics (gender, SES, immigration background) which are recorded and regularly updated in the panel as part of the Module “Background Variables.”
Domain-Specific Ostracism
Consistent with past research (e.g., Rudert et al., 2020), we measured participants’ experience of ostracism in the past 2 months (1 = never, 7 = always). Participants responded to two items: (1) How often did [a source] ignore you? (2) How often did [a source] exclude you?(Williams, 2009). 1 Social contexts were specified to reflect key social domains including family (“family, e.g., siblings, children, parents, etc.”), romantic or sexual relationships (“a romantic/sexual partner, e.g., spouse, someone you are seeing”), friendships (“friends”), workplace (“people at work, e.g., supervisors, colleagues, etc.”), and strangers (“strangers [people you have not met before, e.g., someone on the train or on the street, a cashier, a delivery person]). 2 We averaged the two items (ignored, excluded) to form a single index of ostracism in a domain (the two items are highly correlated: family 0.89; partner 0.83; friends 0.85; workplace 0.83; strangers 0.78).
Gender
Gender was measured using three options in the panel (male, female, other). Only three participants indicated their gender as “other.” These observations were retained in the final sample but were removed from analyses using gender as a predictor. Therefore, our gender variable consisted of two categories (see Table 2).
Social Characteristics and Number of Participants Per Group
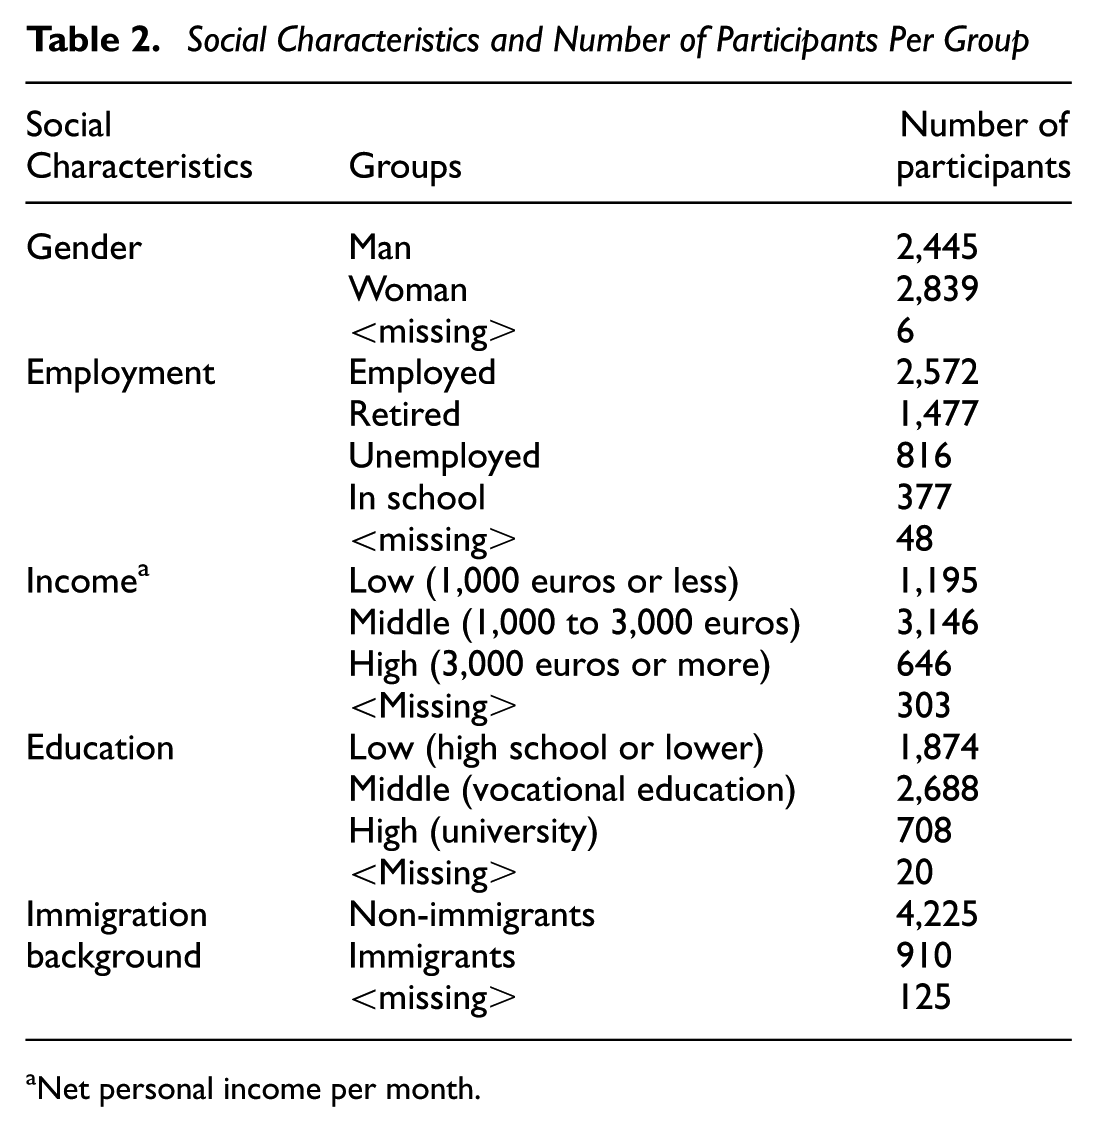
Net personal income per month.
SES
SES was measured using three participants’ self-reported indicators: education attainment, income level, and employment status. Education attainment was originally measured using six categories (see Supplementary Materials). For the purpose of group comparison, we merged categories of relatively few observations to form a broader category. Recoded education variable consisted of three levels: high school or lower, vocational education, and university (see Table 2). Income was measured using personal net monthly income. We used personal income instead of household income because our outcome variable occurs at the interpersonal level including interactions with family members. In the survey, 13 levels were provided, ranging from zero income to more than 7,500 euros. Based on the frequency distribution (see Supplementary Materials), this variable was recoded into three levels: 1,000 or less, 1,000 to 3,000 euros, and more than 3,000 euros. Participants’ employment status was derived from self-claimed primary occupation. Primary occupation was measured using 14 detailed options in the panel. Participants’ responses were recoded into four categories: “employed,”“unemployed,”“retired,” and “in school.” Our primary interest was to compare “unemployed” versus “employed”; the other two categories remained in the dataset for completeness.
Immigration Background
Immigration background was measured using five options (Dutch background; First-generation foreign, Western background; First-generation foreign, non-Western background; Second-generation foreign, Western background; Second-generation foreign, non-Western background). We combined the latter four categories to form a broader category, representing having an immigration background.
Results
Stage 1. Mapping the Distribution of Ostracism
We first visualized the distribution of ostracism experiences. Figure 1, Panel A displays the distribution of all ostracism scores across the domains; Figure 1, Panel B displays the distribution per domain. As the figures showed, we consistently observed a zero-inflated, heavily skewed distribution with the mode at the smallest value (i.e., 1 on the 1–7 scale), indicating ostracism as a rare experience; a tail on the right indicating higher frequencies of ostracism (skewness = 2.66; kurtosis = 7.81 in Figure 1, Panel A). This distribution reveals that the common practice of treating ostracism as a continuous variable and reporting average levels provides an incomplete characterization of ostracism experiences in a general population. While ostracism frequency can be low on average, ostracism disproportionately affects a small subset of individuals.
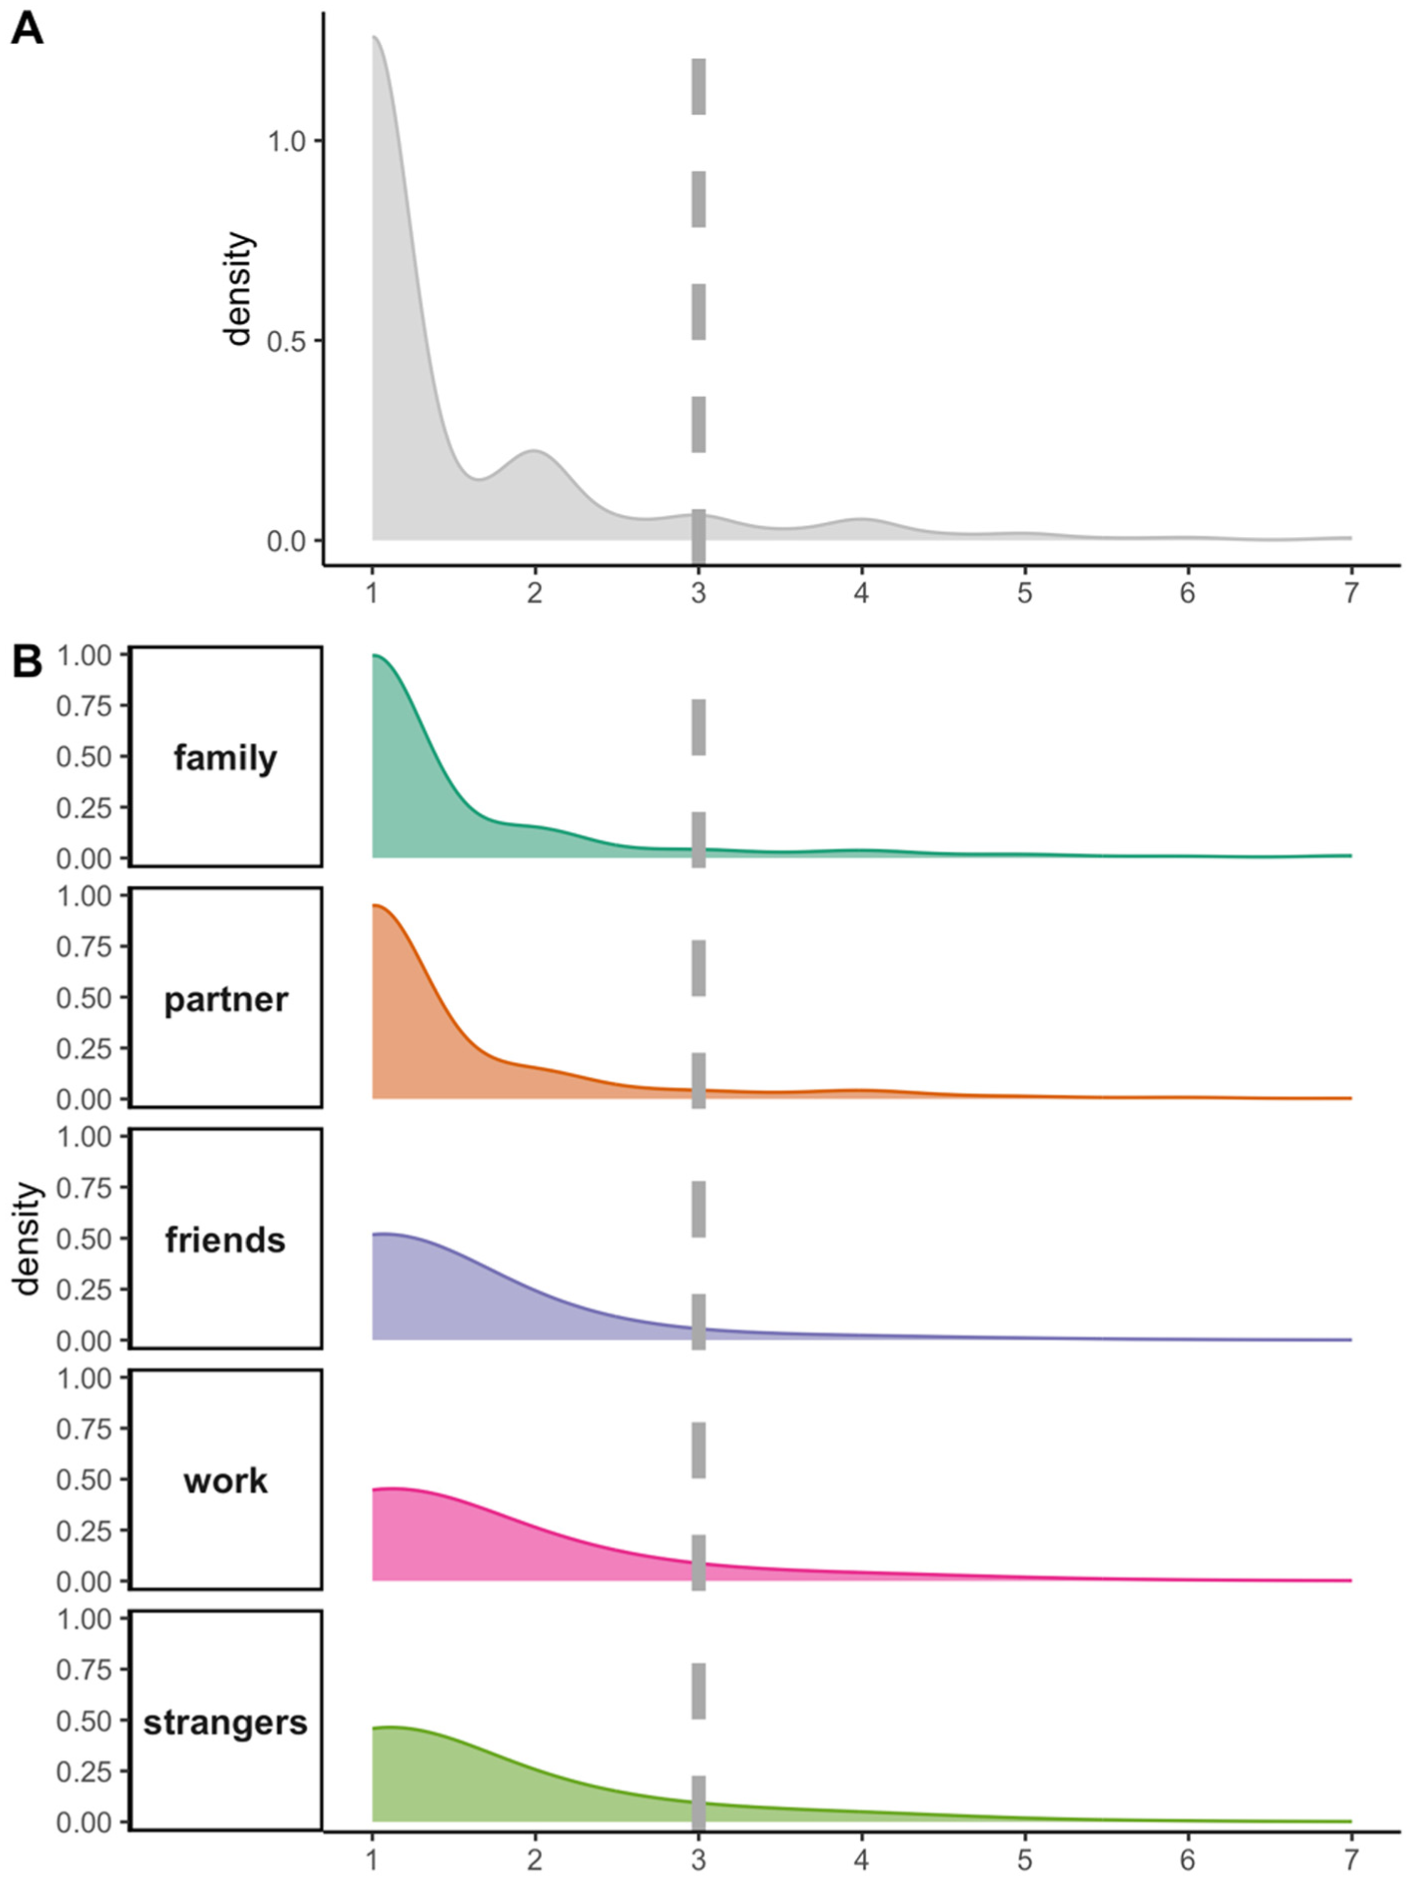
Zero-Inflated, Heavily Skewed Distribution of Ostracism Experiences
Given the data distribution, we discretized the raw values into 0 (non-outliers) and 1 (outliers). This treatment was guided by both statistical and theoretical considerations. Statistically, discretization offers a flexible and robust approach without assuming specific distributions, which is required by continuous approaches such as count models or log transformation (Harrell, 2015). Theoretically, dichotomizing the values distinguishes ostracism as a rare (0) versus frequent experience (1). These two types of experiences can be qualitatively different. Ostracism as a rare experience aligns with the reflective stage of the temporal model of ostracism, where the impacts are typically short-lived, and a full recovery is likely (Williams, 2009; Williams & Nida, 2022). In contrast, repeated, frequent ostracism, represented by the extreme values in our study, increases the probability of progressing to the resignation stage, which is characterized by more severe consequences such as depression (Riva et al., 2017; Williams, 2009). Note that while the decision to dichotomize the values was guided by Williams’ model, we do not imply that the cutoff value in our study can be treated as a universal threshold that corresponds to the transition from the reflective stage to the resignation stage.
To identify the cutoff for outliers, we followed the recommended approach for identifying outliers in highly skewed distributions. Using the interquartile range (IQR), we calculated two cutoff values for defining outliers. One is commonly used for defining “mild” outliers (the third quartile + 1.5 * IQR = 2.25), and the other is commonly used for detecting “extreme” outliers (the third quartile + 3.0*IQR =3.0). We repeated our analyses using both cutoff values, and the results are highly consistent. We report the results of mild outliers in Supplementary Materials; in the main text, we focus on the results of extreme outliers.
Stage 2. Partitioning the Variability in the Prevalence of Ostracism Outliers
The prevalence of outliers in the entire sample is 6.45%. To what extent do the sources (social groups, domains, and their interaction) contribute to the variability in the prevalence of these outliers? To answer this question, we conducted a variance component analysis.
Statistical Approach
We quantified the relative contributions of the three sources of variance (person, social domain, person * domain) by running an intercept-only logistic mixed-effect model with the outlier variable (0 = non-outlier; 1 = outlier) as the binary outcome (values were cross-classified by persons and social domains). To estimate the interaction component between person and social domain, following the existing practice (Kodapanakkal et al., 2021), we analyzed the two items of ostracism as repeated ratings (the same criteria for identifying outliers was applied).
We initially included random intercepts for persons, social domains, and the product interaction between the two. To assess any variability due to the measurement (being ignored vs. being excluded), we included additional random intercepts for the measure of ostracism, and the measure’s interaction with persons, and social domains. An optimizer (instead of the default) was used to handle the complicated random effects structure. We did not consider a three-way interaction to avoid further complicating the model with conceptually uninterpretable components. Warning messages indicated that variation due to some of the components, including “domain,” was (nearly) zero, suggesting an overly complicated random effects structure. For model parsimony, we removed these components. The final model thus included random intercepts specified for each person and for each person–domain combination.
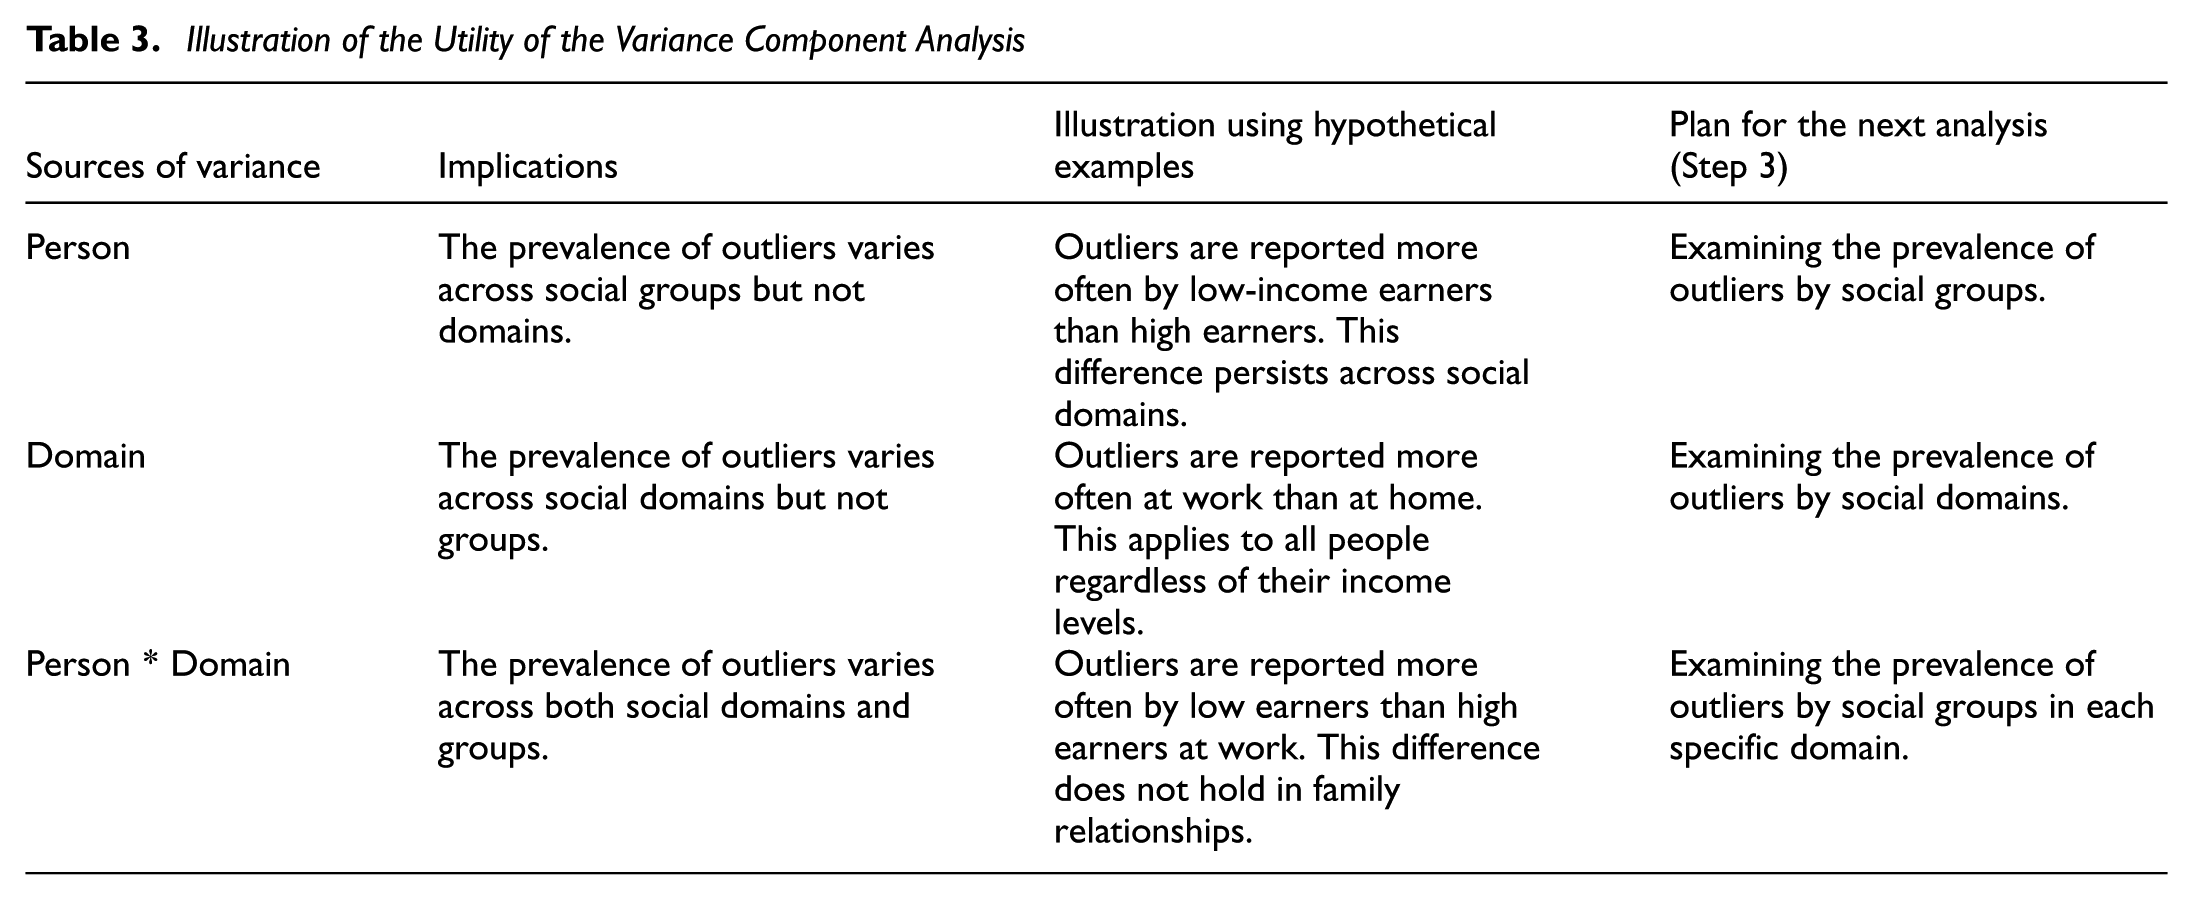
We extracted the estimated variances of each random effect from the fitted model and calculated the intraclass correlation coefficient (ICC) for each random effect. The ICC for each component represents the proportion contributed by the component to the total variance. This analysis permits quantifying the extent to which the prevalence of outliers was driven by between-person differences (e.g., based on social characteristics), social domains, or a combination of the two factors. Such results informed us how best to approach our next analysis. See Table 3 for further explanations.
Illustration of the Utility of the Variance Component Analysis
We fitted the model using the lme4 package in R (Bates et al., 2015). We further constructed 95% confidence intervals (CIs) using non-parametric bootstraps (10,000 resamples).
Findings
Between-person differences (the “person” component) accounted for 12% (95% CI = [0%, 13%]) of the total variance. The person and domain interaction component accounted for 87% (95%CI = [86%, 99%]). 3 These results revealed two important findings. First, there’s little variability in the prevalence of outliers due to social domains alone. That is, on average, ostracism as a frequent experience did not occur only in some social domains. Although the literature has selectively focused on certain contexts such as the workplace (Howard et al., 2020), frequent ostracism is not a unique problem in these contexts. We observed outliers in all social domains (in descending order): strangers (8.14%), workplace (7.14%), family (7.00%), partner (6.36%), and friendship (3.93%).
Second, the between-person variability in the prevalence of outliers (as indicated by the “person” component) was relatively small. The largest amount of variance was explained by the interaction component, suggesting that the probability of experiencing ostracism frequently is jointly determined by both between-person differences (e.g., differences based on social characteristics) and differences between social domains. The result here implies that the role of social characteristics such as SES is likely to vary across social domains. For example, low SES may be linked with higher chances of experiencing unusually high levels of ostracism at the workplace, but not at home with family members. Thus, to identify the specific risk groups for ostracism experiences at unusually high levels, it is important to consider each social domain separately (our next analysis).
Step 3. Prevalence of Ostracism Outliers by Social Groups and Domains
Statistical Approach
Following recent recommendations (VanderWeele, 2017), we estimated separate models for each sociodemographic characteristic (e.g., gender, SES indicators, immigration background), rather than a single mutually adjusted model, to provide interpretable associations (Lewer et al., 2025). Specifically, we assessed the associations of a single social characteristic with each of the domain-specific ostracism outcomes in turn. This approach will reveal the relevance of a social characteristic and how it varies across social domains. We did not analyze all social characteristics simultaneously in one model because these variables are inextricably linked with each other. For example, both gender and educational attainment could be determinants of income levels, immigration background may influence the probability of securing a job, and all three indicators of SES may share unobserved common causes. These intricate associations among these variables (and the unknown causal structure among them) make it undesirable to examine the variables simultaneously in one model, which may lead to uninterpretable results (VanderWeele, 2017).
Our analysis proceeds in the following steps for each social characteristics’ variable and the outlier indicator in each domain.
Carry out a chi-square test between a social characteristics’ variable and a domain-specific outlier variable.
Fitted standard logistic regression models using the glm function in R.
Both steps were repeated 25 times (5 social characteristics’ variables * 5 outcomes). To adjust the p-values for multiple comparisons, we used the false discovery rate approach (Benjamini & Hochberg, 1995). A significant adjusted p-value (<.05) indicates that a given indicator of social characteristics is associated with a given outcome. Although we did not have specific hypotheses regarding which indicator would be relevant to which domain, outliers may be more prevalent among disadvantaged and minoritized groups (i.e., women, unemployed, low income, low education attainment, immigrants) in social domains involving regular contact with unfamiliar others (i.e., workplace, strangers) rather than domains involving established close bonds (i.e., family).
Findings
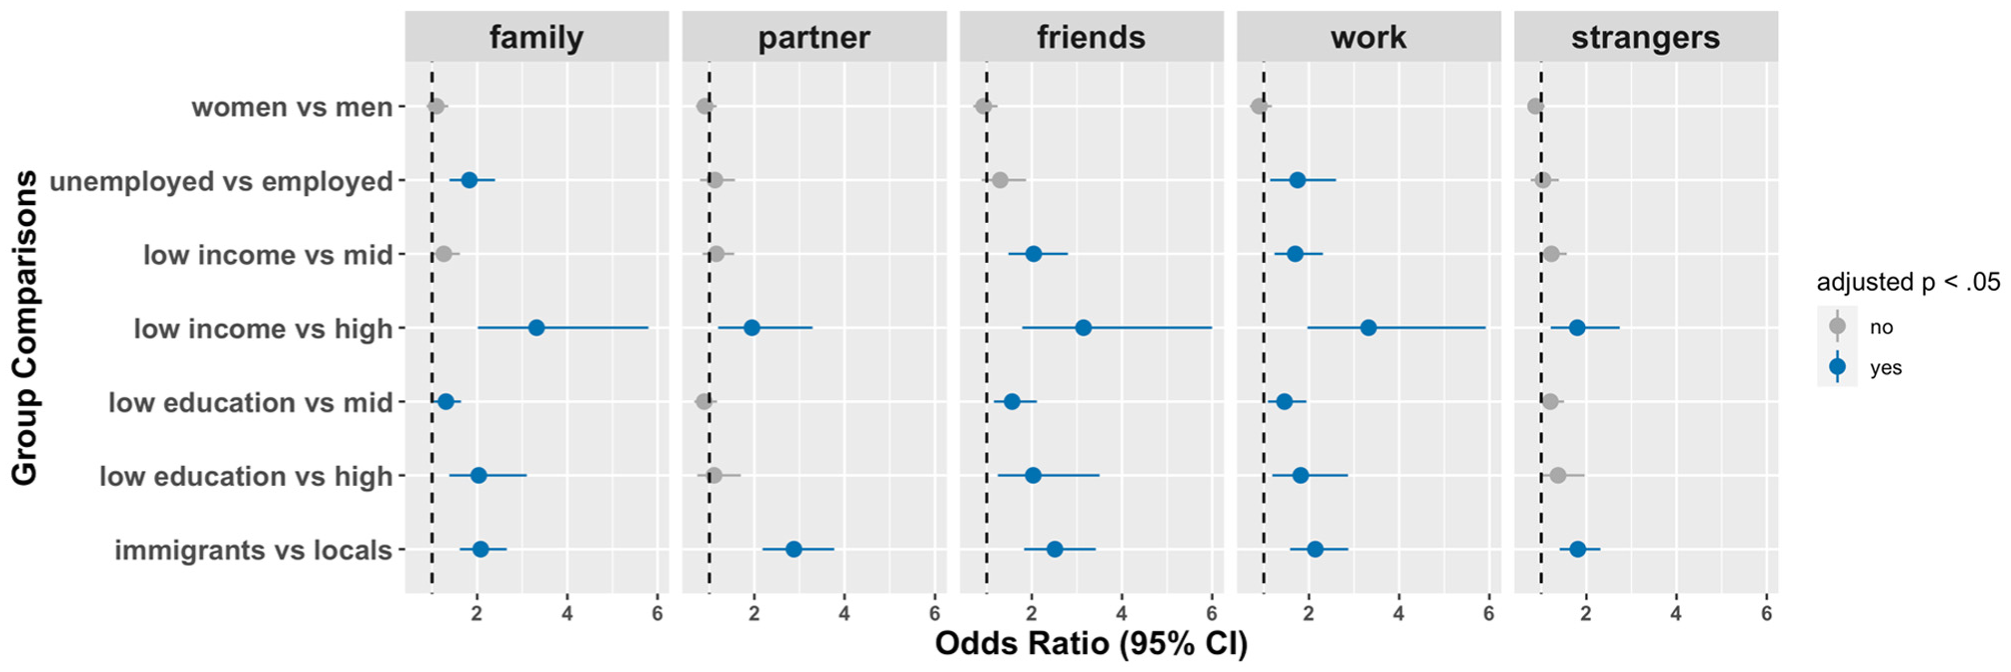
The prevalence of outliers by social characteristics’ indicators and domains is visualized in Figure 2. Significant p-values (after adjustment for multiple testing) of chi-square tests are visualized in the figure using boarders. Because we are interested in specific group comparisons (i.e., women vs. men, unemployed vs. employed, low education vs. higher education levels, low-income vs. higher-income levels, immigrants vs. non-immigrants), we plotted the corresponding odds ratios (OR) and their 95% CIs in Figure 3. Regression coefficients of logistic regressions (i.e., the estimated log odds ratio) and their 95% CIs are reported in Supplementary Materials.
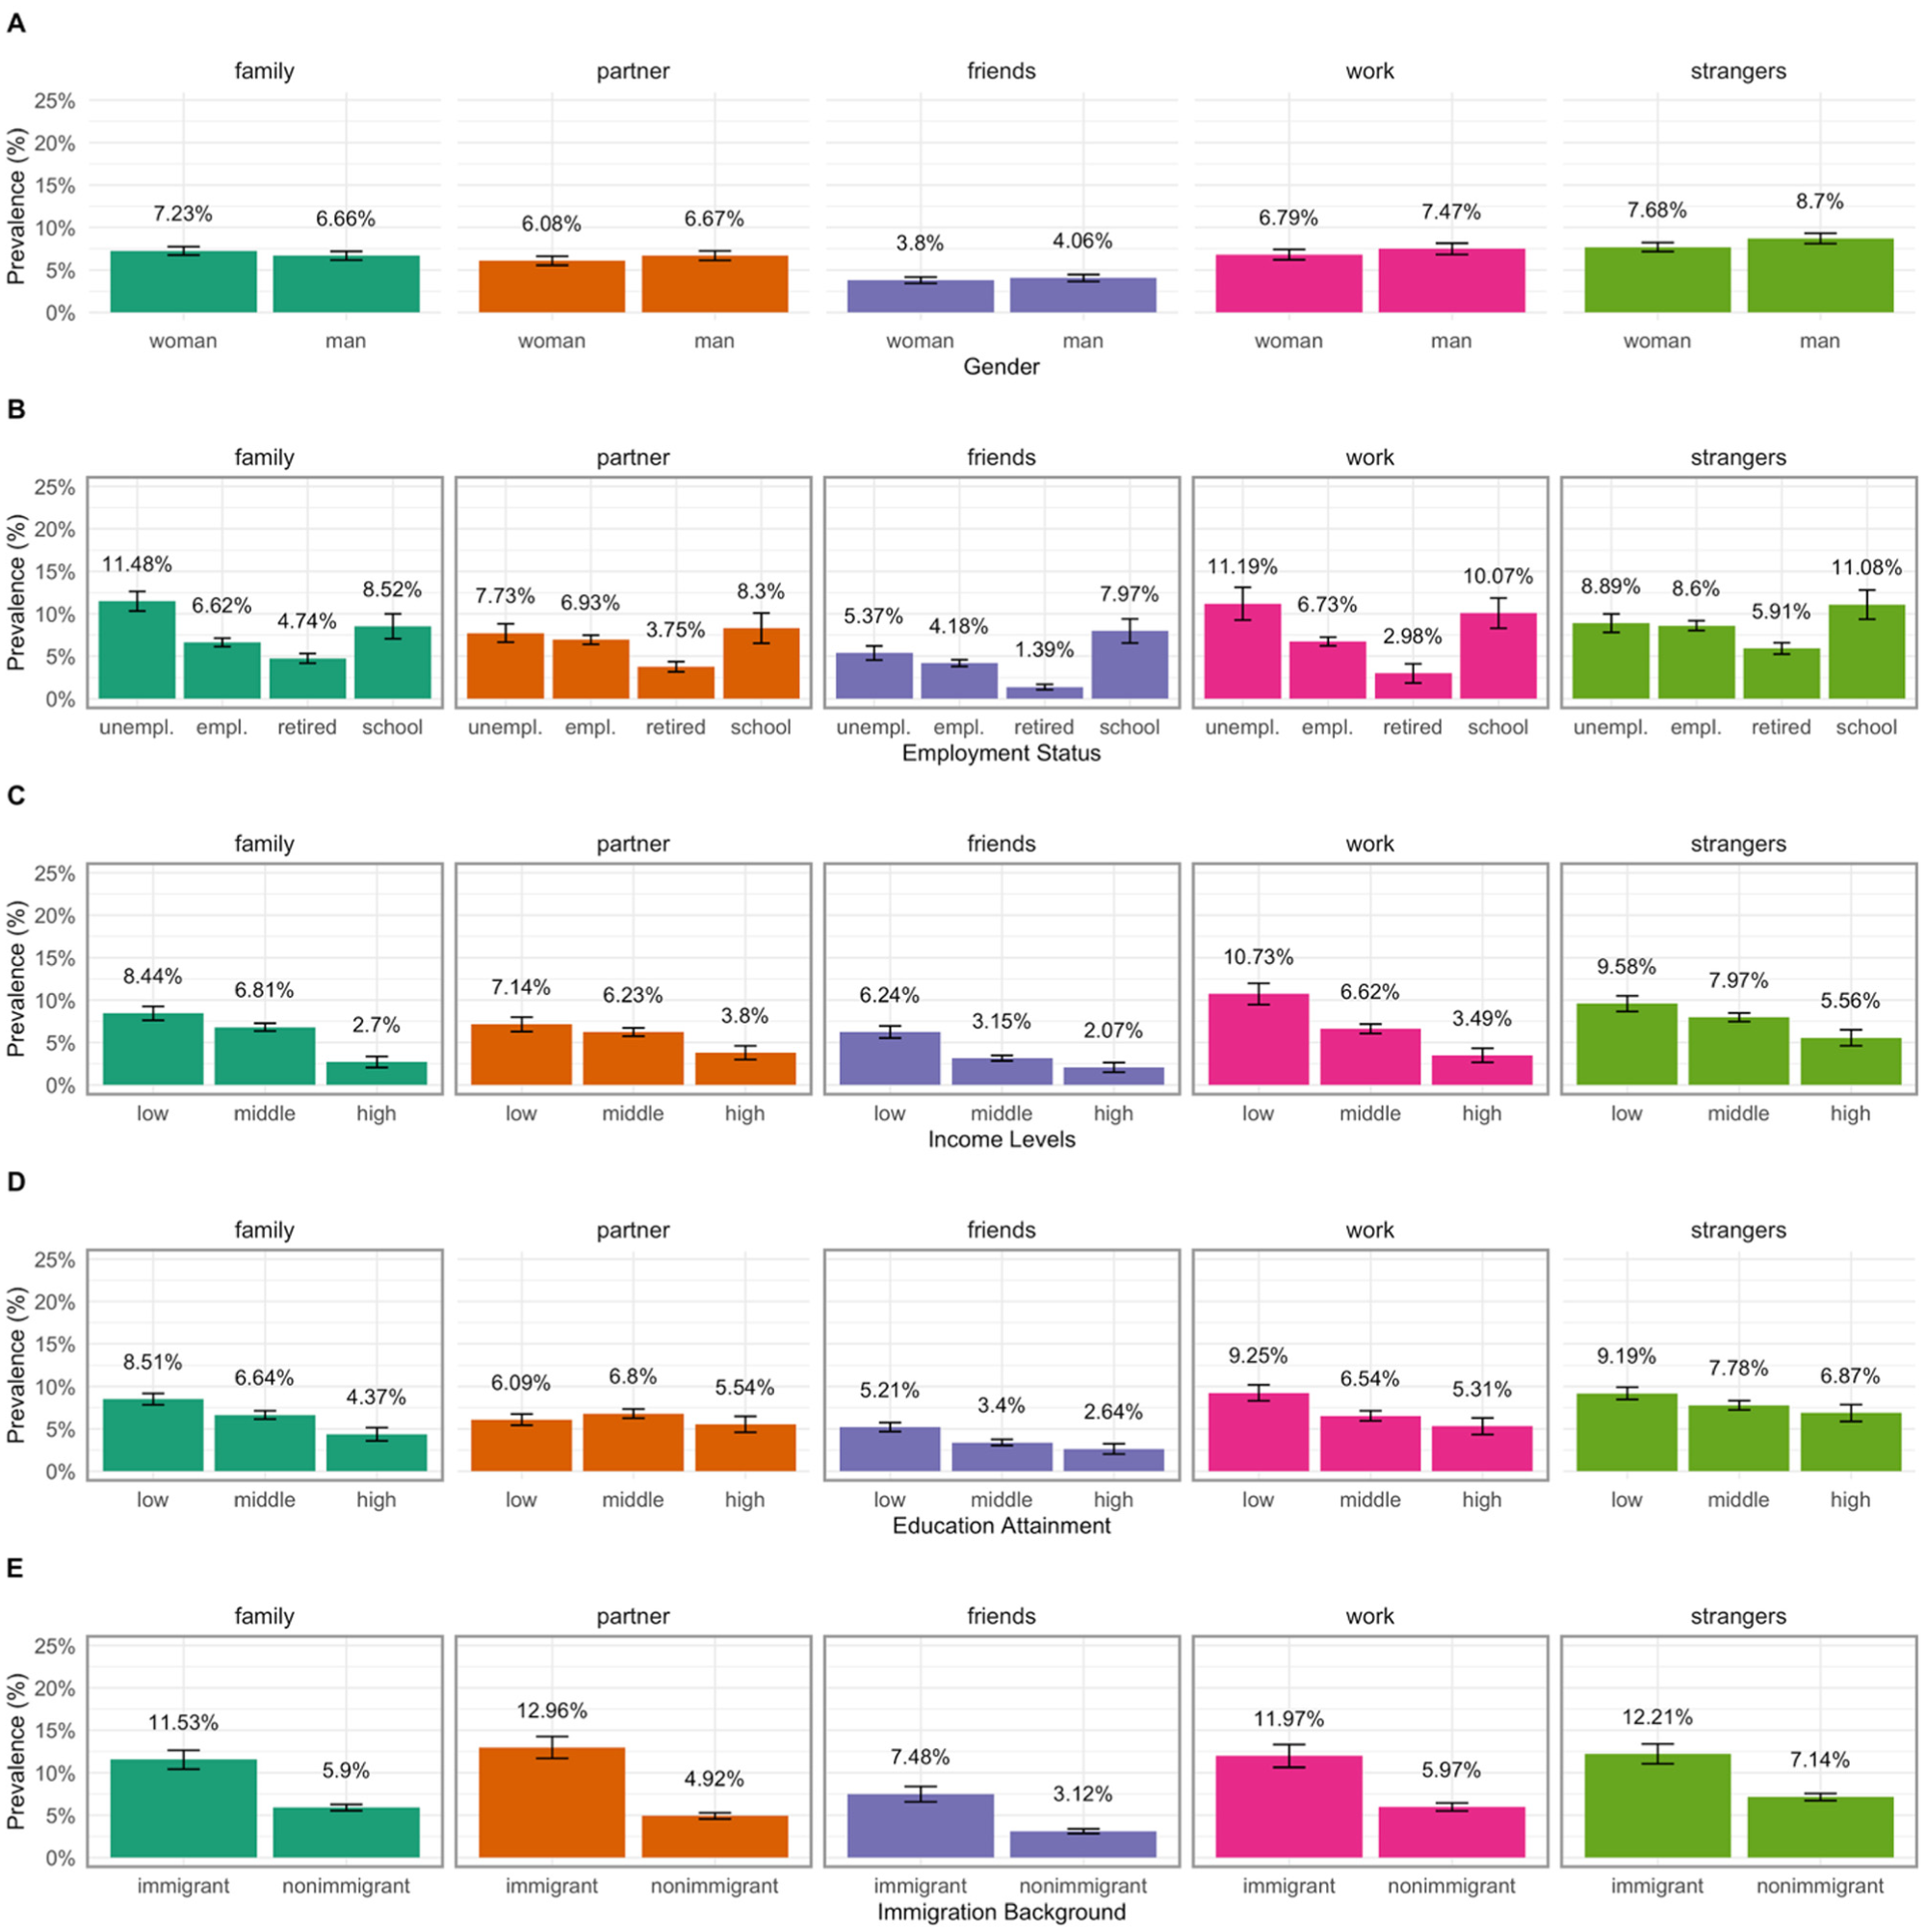
Prevalence of Outliers by Social Groups and Domains. (A) Prevalence by Gender. (B) Prevalence by Employment Status. (C) Prevalence by Income Levels. (D) Prevalence by Education Attainment. (D) Prevalence by Immigration Background
Group Differences in the Prevalence of Outliers Across Domains: Results from Logistic Regression Models
Are outliers recorded more often among women? No, we observed little gender difference in the ostracism outcomes across domains, suggesting that men and women had similar odds of experiencing ostracism at high frequencies.
Are outliers recorded more often among people of lower SES? Yes, but the strength of the association differed across domains. SES’s association with the prevalence of outliers was consistently significant for all three indicators of SES in two domains: the workplace and family relationships. Specifically, in these two domains, being unemployed, having low income, and having low education attainment were associated with greater odds of reporting an outlier value. Among the three SES indicators, income had the strongest association, with low-income earners having over three times higher odds of experiencing ostracism frequently compared to high-income earners.
Are outliers recorded more often among immigrants? Yes, and the evidence remains consistent across all domains, showing that individuals with (vs. without) an immigration background were more likely to experience ostracism at high frequencies across a variety of contexts (OR range = 1.81–2.88). The effect size was larger in partner and friendship domains. Specifically, immigrants had 2.88 times higher odds of experiencing ostracism frequently in the partner domain than non-immigrants and 2.51 times higher odds in the friendship domain. These results suggest that immigrants face challenges in building social connections across various social domains, particularly in forming or maintaining romantic relationships and friendships.
Note that we did not observe clear evidence to support the notion that social characteristics are more relevant in domains involving social contact with unfamiliar others versus close others. In fact, the results were surprisingly consistent across both the workplace and family relationships. This suggests that, contrary to expectations, factors such as low SES and having an immigration background could have a pervasive impact on people’s social lives, affecting even relationships with family members who are often relied upon for financial and social support.
Discussion
We studied the prevalence and distribution patterns of ostracism experiences among Dutch adults, leveraging a probability-based sample of 5,290 participants and 22,075 ostracism ratings. The distribution of ostracism ratings showed a cluster of values at the very left end of the spectrum, indicating ostracism as a rare experience; a smaller subset of higher values formed the right tail (statistical outliers), representing ostracism as a frequent experience. This distribution suggests that while ostracism is an occasional occurrence for most, some individuals experience it at higher frequencies. To describe this distribution, we recoded the raw values into a binary variable, distinguishing statistical outliers (ostracism as a frequent experience) from the rest of the observations.
We made several observations. First, out of all reported experiences, 6% were statistical outliers (ostracism as a frequent experience). Second, the presence of outliers was ubiquitous. It occurred in various social domains ranging from family dynamics to interactions with strangers. Third, individuals with low SES, including those who were unemployed, had low education attainment, or earned a low income, disproportionately experienced frequent ostracism in both the workplace and family relationships. Finally, immigrants were more likely to face ostracism at high frequencies across all domains, making them a particularly vulnerable subpopulation.
The current research offers a fresh perspective on ostracism. Survey research on ostracism has so far reported the raw values measured using Likert-type scales (Ferris et al., 2008; Rudert et al., 2020). For example, across four samples of employees, on a 7-point scale (1 = never, 7 = always), the averages ranged from 1.61 to 2.30 (Ferris et al., 2008). Among a sample of asylum seekers, the mean level was recorded as 1.86 (1 = not at all, 5 = very much). These low averages may lead one to quickly dismiss ostracism as a serious societal issue. Moving beyond the standard approach of reporting the means, here, we discretized the raw values and distinguished statistical outliers from other observations. Identifying these outliers is informative, as it helps distinguish ostracism as a frequent experience from a rare occurrence, allowing us to focus on ostracism experiences that may have more severe consequences (Riva et al., 2017; Williams, 2009).
Our research highlights the value of adopting a descriptive approach in ostracism research. The existing scholarship has largely focused on estimating causal effects and examining causal mechanisms. This focus has undoubtedly led to substantial knowledge about the causes, consequences, and processes of ostracism. Here, we demonstrated that descriptive research can advance the field by offering a complementary perspective. Specifically, it enables the estimation of ostracism’s prevalence in target populations and the identification of who is most likely to experience ostracism and in what contexts. These population-level patterns can inform theoretical development and help identify priority populations for interventions and policies.
In the current study, we reported important associations revealing the prevalence of ostracism as a frequent experience by several key factors, but there are many other relevant factors. For example, age is not of primary interest here because our data are cross-sectional, which is not suited for describing development trends (for interested readers, we reported ostracism experiences by age groups in Supplementary Materials). Future work could expand to other factors such as race and ethnicity, disability, and relationship and parental status, among many others. Another future direction is to investigate these factors as causes (Ren & Loh, 2024; Ren, Stavrova, et al., 2025) and the underlying causal processes. For example, individuals in vulnerable positions (e.g., low SES, immigrants) may be ostracized more frequently due to their stigmatized identities (Neel & Lassetter, 2019). In addition, in line with the diathesis-stress model (Colodro-Conde et al., 2018), these individuals may be more likely to interpret identical social events as ostracism because prior adversity can heighten sensitivity to social threat and reduce coping resources. Moreover, a future project may explore the possibility of collecting data longitudinally to monitor ostracism over time and from multiple countries to evaluate the generalizability of our findings across countries and explore country-level characteristics (e.g., SES may be a stronger factor in countries with higher level of social inequality). Finally, future studies may assess ostracism experiences as a possible causal mechanism that explains SES-based or immigration-based disparities in mental health (e.g., depression; Adler et al., 1994; Alegría et al., 2017; Bas-Sarmiento et al., 2017; Miech & Shanahan, 2000). This causal analysis can inform policies and interventions for enhancing equity in public mental health.
Supplemental Material
sj-docx-1-spp-10.1177_19485506251414824 – Supplemental material for Socioeconomic and Immigration Disparities in Ostracism: A Study of Statistical Outliers
Supplemental material, sj-docx-1-spp-10.1177_19485506251414824 for Socioeconomic and Immigration Disparities in Ostracism: A Study of Statistical Outliers by Dongning Ren, Olga Stavrova, Cathryn Johnson and Wen Wei Loh in Social Psychological and Personality Science
Footnotes
Acknowledgements
We thank Stein Jongerius for his excellent support for programming and fielding the survey. The first author is grateful to Kip Williams and Fred Zijlstra for their mentorship and generous support for pursuing this project.
Handling Editor: Christian Unkelbach
Ethical Considerations
This research received approval from the ethics board at Tilburg School of Social and Behavioral Sciences (ID: RP621).
Funding
The authors disclosed receipt of the following financial support for the research, authorship, and/or publication of this article: This research was supported by the Open Data Infrastructure for Social Science and Economic Innovations (ODISSEI; ![]() ), the University Fund Limburg (CoBes 24.039-P), and the Netherlands Organisation for Health Research and Development (ZonMw; 10430382410014).
), the University Fund Limburg (CoBes 24.039-P), and the Netherlands Organisation for Health Research and Development (ZonMw; 10430382410014).
Declaration of Conflicting Interests
The authors declared no potential conflicts of interest with respect to the research, authorship, and/or publication of this article.
Supplemental Material
The supplemental material is available in the online version of the article.
Notes
Author Biographies
References
Supplementary Material
Please find the following supplemental material available below.
For Open Access articles published under a Creative Commons License, all supplemental material carries the same license as the article it is associated with.
For non-Open Access articles published, all supplemental material carries a non-exclusive license, and permission requests for re-use of supplemental material or any part of supplemental material shall be sent directly to the copyright owner as specified in the copyright notice associated with the article.