
Abstract
Although perceptions of wealth are shaped by people’s social environment and ideological beliefs, few studies integrate these two perspectives. We address this oversight by examining the association between participants’ actual and estimated average neighborhood household income and whether political orientation moderates this relationship. Using a large, nationwide random sample of New Zealand adults (N = 14,853), our results reveal that both liberals and conservatives overestimated the wealth of their own neighborhoods—but these differences only emerged in the poorest and wealthiest neighborhoods. Specifically, in poor neighborhoods, conservatives were less accurate than liberals at estimating the average income of their neighborhood. In rich neighborhoods, liberals were less accurate than conservatives at this same task. The implications of these results for understanding (mis)perceptions of wealth on both sides of the political spectrum are discussed.
Economic inequality has increased markedly in most developed nations over the past few decades (Causa et al., 2019), posing one of the biggest challenges to health (Wilkinson & Pickett, 2017), social cohesion (Osborne et al., 2022), and democracy (Bartels, 2008) in the 21st century. Indeed, just 81 billionaires presently hold more wealth than half of the world’s population, and the wealthiest 1% gained 63% of the new wealth created between 2020 and 2021 (Christensen et al., 2023). Although the causes of economic inequality are multifaceted (Dabla-Norris et al., 2015; Neckerman & Torche, 2007), increasingly unequal income distributions—and the reduction of income redistribution—are cause for concern (Causa et al., 2019). Yet, with the exception of the Occupy movement in 2011, sustained efforts to change the distribution of wealth among the general public remain stagnant, despite public support for redistribution in most industrialized nations (see Guillaud, 2013).
One possible explanation for this impasse is that, despite being aware of the wealth gap, the general population overestimates societal wealth (see Dawtry et al., 2019; Hauser & Norton, 2017). Notably, there are several potential reasons why people overestimate societal wealth. Indeed, perceptions of wealth are constrained by the available information in their environment (see Dawtry et al., 2015; Galesic et al., 2012, 2018), including people’s personal socioeconomic standing (Davidai, 2022; Dawtry et al., 2015; Xu & Garand, 2010), exposure to media (Diermeier et al., 2017), and day-to-day encounters with wealth and inequality (García-Castro et al., 2022). Moreover, people’s ideological beliefs also shape their perceptions of—and sensitivity to—wealth and inequality (Chambers et al., 2014; Napier & Jost, 2008; Waldfogel et al., 2021). Taken together, people’s inferences about societal wealth may be constrained by both the available information about wealth in their environment and their ideologically based sensitivity to wealth.
In the present study, we investigate these two factors by examining the relationship between people’s actual and estimated average neighborhood household income, as well as the potential moderating effects of political orientation on this association. We argue that people’s estimates of their neighborhood income should positively correlate with the actual average household incomes of their neighborhoods, but that those living in wealthier (vs. poorer) neighborhoods should be more prone to overestimation. We also expect that accuracy will differ by political orientation. Liberals living in wealthier neighborhoods should be less accurate at discerning incomes in their neighborhoods than conservatives living in wealthier neighborhoods. Conversely, conservatives living in poorer neighborhoods should be less accurate at discerning the wealth (or lack thereof) of their neighborhood than their liberal counterparts. We outline the rationale for these predictions below, drawing on relevant literature on social sampling and political orientation as factors that shape perceptions of wealth.
Wealthy People Think People Are Wealthier
The social sampling model argues that judgments and estimates of population-level distributions are based on relevant instances in people’s social environment rather than that of the general population (Galesic et al., 2012, 2018). That is, perceptions of wealth are derived from individual experiences and day-to-day encounters rather than abstract understandings of inequality (Dawtry et al., 2019). Critically, Galesic and colleagues argue for two properties of social environments central to the social information people rely on for their judgments: (a) people with similar characteristics tend to live close to one another (McPherson et al., 2001; Mijs & Roe, 2021) and (b) different characteristics of the social environment have different distributions (Galesic et al., 2012). Income, for example, is highly skewed, and socioeconomic “segregation” between the rich and poor has increased over the last few decades (Mijs & Roe, 2021; Musterd et al., 2017). Consequently, individuals with high and low incomes are overexposed to similar others and, thus, overestimate the proportion of the population similar to themselves.
Consistent with this thesis, people’s understanding of wealth is biased toward their own experiences (see Willis et al., 2022). For example, wealthier people (relative to poorer people) report having more affluent social circles and, on average, tend to overestimate the wealth of the general population (Dawtry et al., 2019; Galesic et al., 2012; Page & Goldstein, 2016). Conversely, less affluent people tend to underestimate the wealth of the population (Norton & Ariely, 2011; Norton et al., 2014). Some authors suggest that the general public may overestimate income inequality, and this misperception is largely explained by people overestimating the incomes of the wealthy (Chambers et al., 2014; but see Davidai & Gilovich, 2018). Thus, although people are generally accurate at estimating the properties of their immediate social environments (Galesic et al., 2018), the cues from one’s local environment may foster misperceptions of wealth. In the present study, we argue that these misperceptions will manifest as overestimates of the average incomes of one’s own neighborhood, particularly among people living in wealthier (vs. poorer) neighborhoods.
Political Orientation and Sensitivity to Wealth
Although the local environment influences people’s perceptions of wealth, people’s ideological beliefs should also impact how accurately they perceive wealth in their environment. For instance, myriad studies suggest that political liberals (compared to conservatives) are more sensitive to disparities between the wealthy and the poor (Bartels, 2008; Chambers et al., 2014), perceive more inequality in their day-to-day lives (e.g., Minkoff & Lyons, 2019), have a lower tolerance for inequality (García-Castro et al., 2020), are faster to detect inequality affecting socially disadvantaged groups (Waldfogel et al., 2021), and perceive less social mobility (Chambers et al., 2015). These findings suggest that liberals (compared to conservatives) are more sensitive to inequality and variations in income. Accordingly, while people living in wealthier neighborhoods should, on average, overestimate the wealth of their neighborhoods more than people living in poorer neighborhoods, this difference may be especially pronounced among political liberals. In other words, liberals living in wealthier neighborhoods should overestimate the average incomes of their neighborhoods more so than (a) liberals living in poorer neighborhoods and (b) conservatives living in wealthier neighborhoods.
That said, conservatives may also misperceive wealth in their neighborhoods. Prior research suggests that people who endorse conservative (vs. liberal) ideologies tend to justify and support existing social hierarchies and, in turn, are more tolerant of inequality (Goudarzi et al., 2020; Jost, 2020; Jost et al., 2008). Conservatives also underestimate disparities between the poor and the wealthy (e.g., Kteily et al., 2017; Rodriguez-Bailon et al., 2017). Notably, misperceptions of the wealth of the poor (as opposed to the wealthy) may be particularly prevalent because conservatives overestimate mobility between social classes (Chambers et al., 2015; Davidai & Gilovich, 2018). Thus, while liberals, on average, may be more sensitive to wealth than conservatives, conservatives may be more sensitive to wealth in poorer neighborhoods than liberals living in poorer neighborhoods.
The present study is unable to discern whether the effects of political orientation on estimates of the wealth in one’s neighborhood arise from liberals’ ideological sensitivity to wealth or conservatives’ tendency to minimize inequality (or both). Instead, the present study examines whether political orientation moderates discrepancies between neighborhoods’actual average household income and the estimates of people living in those neighborhoods. More specifically, we use data from a nationwide random sample of New Zealand adults to test whether (a) people, on average, overestimate the wealth of their own neighborhoods, (b) political orientation moderates this association, and (c) differences between conservatives and liberals are specific to neighborhoods at the extreme ends of the wealth continuum. In doing so, we test the extent to which political orientation affects people’s estimates of their own neighborhood’s wealth, and whether this impact is felt equally across poor and wealthy neighborhoods.
Overview of Hypotheses
Research in the social sampling tradition suggests that people form reasonably accurate pictures of their immediate social environment (Dawtry et al., 2019; Galesic et al., 2012, 2018). Accordingly, we expect that people’s estimates of their own neighborhood’s average income will be higher in wealthy (vs. poor) neighborhoods. That said, participants living in wealthy (vs. poor) neighborhoods should be more prone to overestimation because people tend to overestimate the proportion of the population similar to themselves (see Dawtry et al., 2015). However, the accuracy of these estimates should critically differ by political orientation. Given that liberals are more sensitive to variations in wealth and the wealth gap (Bartels, 2008; Chambers et al., 2014), we expect that liberals living in wealthier neighborhoods will overestimate the wealth of their neighborhoods more so than conservatives living in wealthier neighborhoods. Conversely, because conservatives tend to underestimate disparities between the wealthy and the poor (Kteily et al., 2017) and overestimate social mobility (Chambers et al., 2015), we expect that conservatives living in poorer neighborhoods will overestimate the wealth of their neighborhoods more so than their liberal counterparts. In examining these hypotheses, we aim to discern where bias emerges in conservatives’ and liberals’ estimates to provide a more nuanced understanding of (mis)perceptions of neighborhood wealth.
Political Orientation in the New Zealand Context
The present study focuses on people’s self-reported political orientation and, accordingly, it is important to situate our analyses of liberals and conservatives within the New Zealand political context. In terms of its values, New Zealand is an ostensibly egalitarian nation, even when compared with other Western democracies (Freedom House, 2023; Organisation for Economic Co-operation and Development [OECD], 2023b), with average levels of affective polarization in international comparisons (Wagner, 2021). Nonetheless, New Zealand ranks 136th out of 161 countries for fair wealth distribution (Oxfam Aotearoa, 2023), and has a slightly higher-than-average Gini coefficient (0.32; OECD average = 0.31; OECD, 2023a), indicating that its egalitarian values do not necessarily translate into economic policies. Furthermore, political conservatives and liberals in New Zealand are characterized by similar values and attitudes to those in other Western democracies (e.g., Kivikangas et al., 2021). For instance, the two major political parties in New Zealand, the Labour Party (the center-left social-democratic party) and the National Party (the center-right conservative party), typically garner support from liberal and conservative voters, respectively. New Zealand voters have also become increasingly ideologically sorted; Labour and Green (left-wing) party voters have shifted toward liberal ideological ratings since 2014, while National party voters have become slightly more conservative (see Satherley et al., 2020). Thus, ratings of how liberal or conservative people perceive themselves to be represent important markers of political differences in New Zealand.
Method
Transparency and Openness
Our analyses were not preregistered. We report all sample sizes and measures used in the study. All analyses were conducted in Mplus v.8.9 (Muthén & Muthén, 1998–2023) and the syntax used in our analyses is available on the Open Science Framework: https://osf.io/75snb/. The overall New Zealand Attitudes and Values Study (NZAVS) project was approved by the University of Auckland Human Ethics Committee and is renewed every 3 years. Due to restrictions imposed by the Ethics Committee, the data presented in this study cannot be made publicly available. However, a deidentified data set containing the variables analyzed here is available for appropriately qualified researchers upon request for the purpose of replication.
Sampling Procedure and Participants
Although the NZAVS is an ongoing annual nationwide longitudinal panel study of New Zealand adults, we utilize data from Time 8 (2016) of the NZAVS because it was the largest cross-sectional sample size to date that included all our focal variables. As such, Time 8 offers the optimal sample size to conduct our multilevel analyses. Participants were initially randomly sampled from the electoral roll in Time 1 (2009; n = 6,518, response rate: 16.6%). Subsequent booster sampling was conducted at Time 3 (2011; nbooster = 2,966), Time 4 (2012; nbooster = 5,371), Time 5 (2013; nbooster = 7,757), and Time 8 (2016; nbooster = 8,270) to address sample attrition and diversify the sample. Time 8 (2016) contained responses from 21,936 participants, 13,666 of whom were retained from one or more previous waves. The sample retained 3,349 participants from Time 1 (2009; retention rate = 51.4%) and 11,933 participants from Time 7 (2015; retention rate = 85.6%). Sibley (2023) provides further information about the sampling procedure, retention rates, and ethics approvals for the NZAVS.
A total of 14,853 participants provided partial or complete responses to our focal variables at Time 8 (2016). Of these participants, 62.3% were women (0.3% gender-diverse, 37.4% men), and the average age was 50.41 (SD = 13.61; range: 18–97). Most participants were employed (78.7%), living in urban areas (65.6%), and born in New Zealand (80.0%). Concerning ethnicity, most participants identified as New Zealand European/Pākehā (82.2%) or Māori (11.0%), with a smaller percentage identifying as Asian (3.6%) or Pasifika (1.9%). The remaining 1.3% of participants did not disclose their ethnicity or identified as another ethnic group.
Measures
Actual Neighborhood Household Income
Data from the New Zealand census includes aggregate demographic data about each area unit/neighborhood of the country and is publicly available. Accordingly, the NZAVS includes data from national censuses to capture the geographic data of each participant. The smallest “units” of demographic data are captured using meshblocks, defined as a “geographic area, varying in size from part of a city block to a large area of rural land” (Statistics New Zealand, 2017). Because meshblocks are contiguous, they border on one another to cover all of New Zealand, providing small, but flexible, “building blocks” to form aggregate data. Here, we utilize statistical area 2 (SA2) units comprised of aggregations of meshblocks. SA2s capture socially homogeneous communities that share facilities, road networks, as well as similar land resources (i.e., high-density housing, farmland, wilderness, and water areas). Notably, SA2 units approximate single suburbs in major urban areas. Accordingly, SA2 units enable us to examine aggregate data from communities that interact together socially and economically (for further information, see Statistics New Zealand, 2017). Our analysis included 1,852 unique SA2 units, with an average of 8.02 participants per unit.
To measure participants’actual neighborhood household income, we utilized census data on the median household income of each SA2 unit. Figure 1 reveals that the distribution of actual median household incomes for SA2 units ranged from NZD $18,600 to $150,000, with $150,000 being the upper bound reported by Statistics New Zealand. The median household income for SA2 units was NZD $74,400, with lower and upper 10th percentiles of NZD $48,600 and NZD $116,100, respectively. For our analyses, actual neighborhood household income for each SA2 unit was scored in $1,000 units. Notably, participants included in our analyses, on average, lived in slightly wealthier neighborhoods (M = 84.62, SD = 27.69) than that of the general New Zealand population (M = 78.57, SD = 25.95).
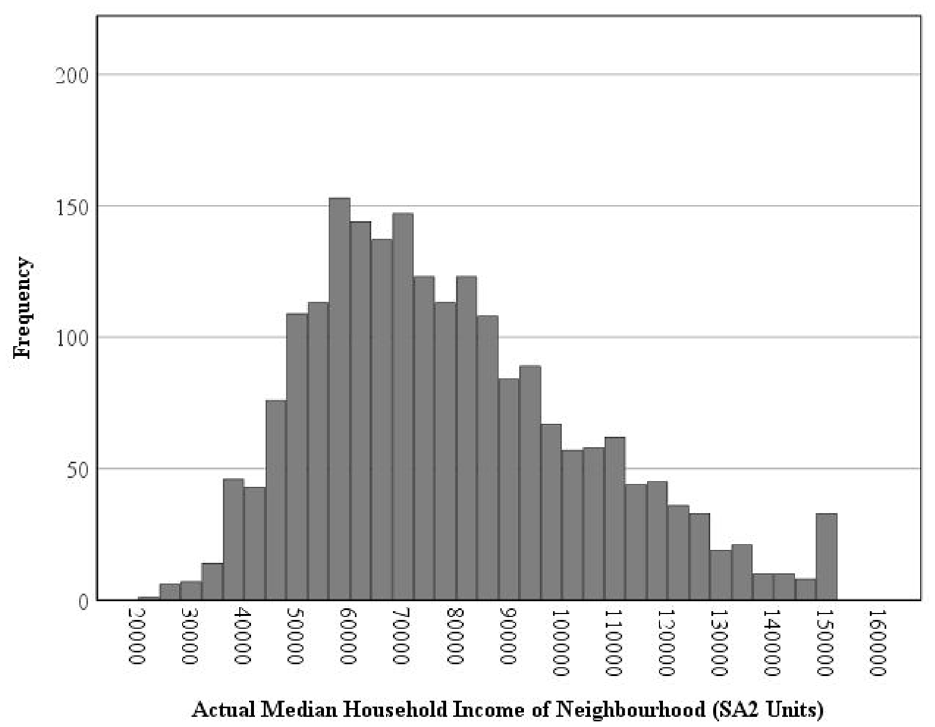
Histogram of Actual Household Neighborhood Income in SA2 Units
Participant Household Income
To control for the effects of participants’ personal household income in our analyses, we asked participants to estimate their total household income (before tax) for the year 2016. We scored household income in $1,000 units (M = 109.13, SD = 90.89).
Estimated Neighborhood Household Income
Our main predictor variable asked participants to “. . . think about all the other households in your immediate neighbourhood. Give your best estimate of the average income of those households.” Estimated neighborhood household income was scored in $1,000 units (M = 100.59, SD = 96.72).
Political Orientation
Political orientation was measured using a single item from Jost (2006): “Please rate how politically liberal versus conservative you see yourself as being.” Participants responded on a scale from 1 (Extremely liberal) to 7 (Extremely conservative; M = 3.60, SD = 1.38).
Results
The present study aimed to examine the moderating effects of political orientation on the relationship between the actual average household income of people’s neighborhoods and their estimates for their neighborhood’s household income. We assessed this predicted cross-level interaction using Multilevel Random Coefficient Modeling (MRCM) with Bayesian estimation, in which people were nested within geographic neighborhoods. Following recommendations from Asparouhov and Muthén (2019), the model decomposed political orientation into two uncorrelated latent variables representing within and between components. Political orientation was thus latent mean-centered, which is akin to group-mean centering but adjusts for measurement error (see Asparouhov & Muthén, 2019). The actual median income of each neighborhood (SA2 unit) was grand mean-centered. We also adjusted for participants’ household income (group mean-centered). Note that we did not decompose participants’ household income into within and between components as the between component was already represented using actual census estimates of median neighborhood household income. Political orientation and participants’ household income were modeled as random effects, allowing the mean level of these constructs to vary across neighborhoods. Table 1 displays the descriptive statistics and bivariate correlations between variables used in our analyses.
Descriptive Statistics and Bivariate Correlations Between Study Variables
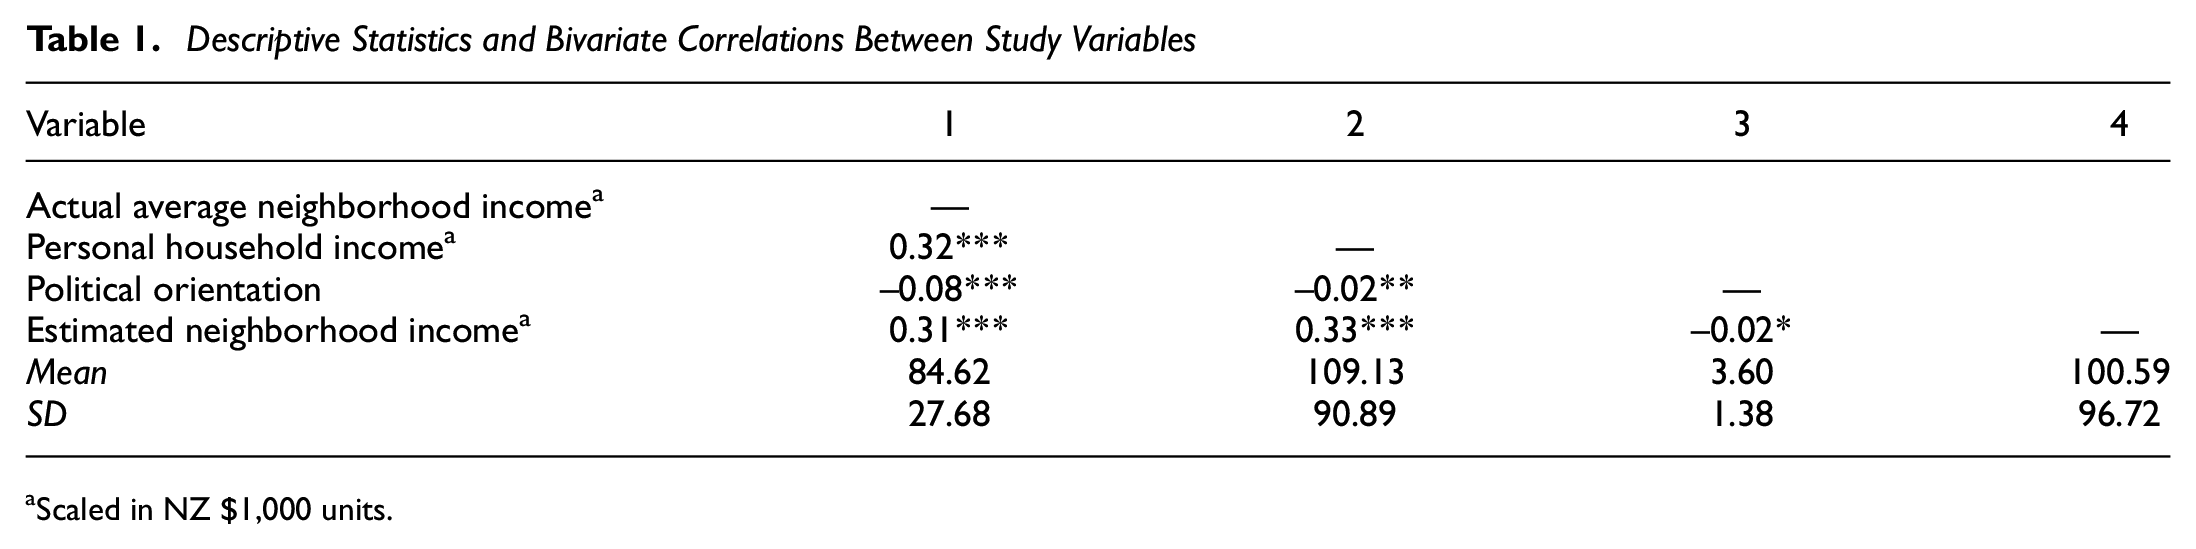
aScaled in NZ $1,000 units.
Table 2 presents the results from the MRCM and reveals that the actual median household income of their neighborhood significantly predicted participants’ estimates of their neighborhood household income (b = 1.05, 95% CI = [0.976, 1.111], p < .001). Similarly, participants’ household income was significantly associated with their estimates such that people with higher (vs. lower) incomes estimated higher household incomes for their neighborhood (b = 0.30, 95% CI = [0.269, 0.326], p < .001). Political orientation also significantly predicted participants’ estimates, with higher political conservatism predicting higher estimates of neighborhood household income (b = 0.05, 95% CI = [0.014, 0.082], p = .003). The random effects for both political orientation (b = 0.24, 95% CI = [0.207, 0.285], p < .001) and participant’s household income (b = 0.08, 95% CI = [0.055, 0.100], p < .001) were also significant.
Bayesian MRCM Predicting Participants’ Estimates of Their Neighborhood’s Average Household Income
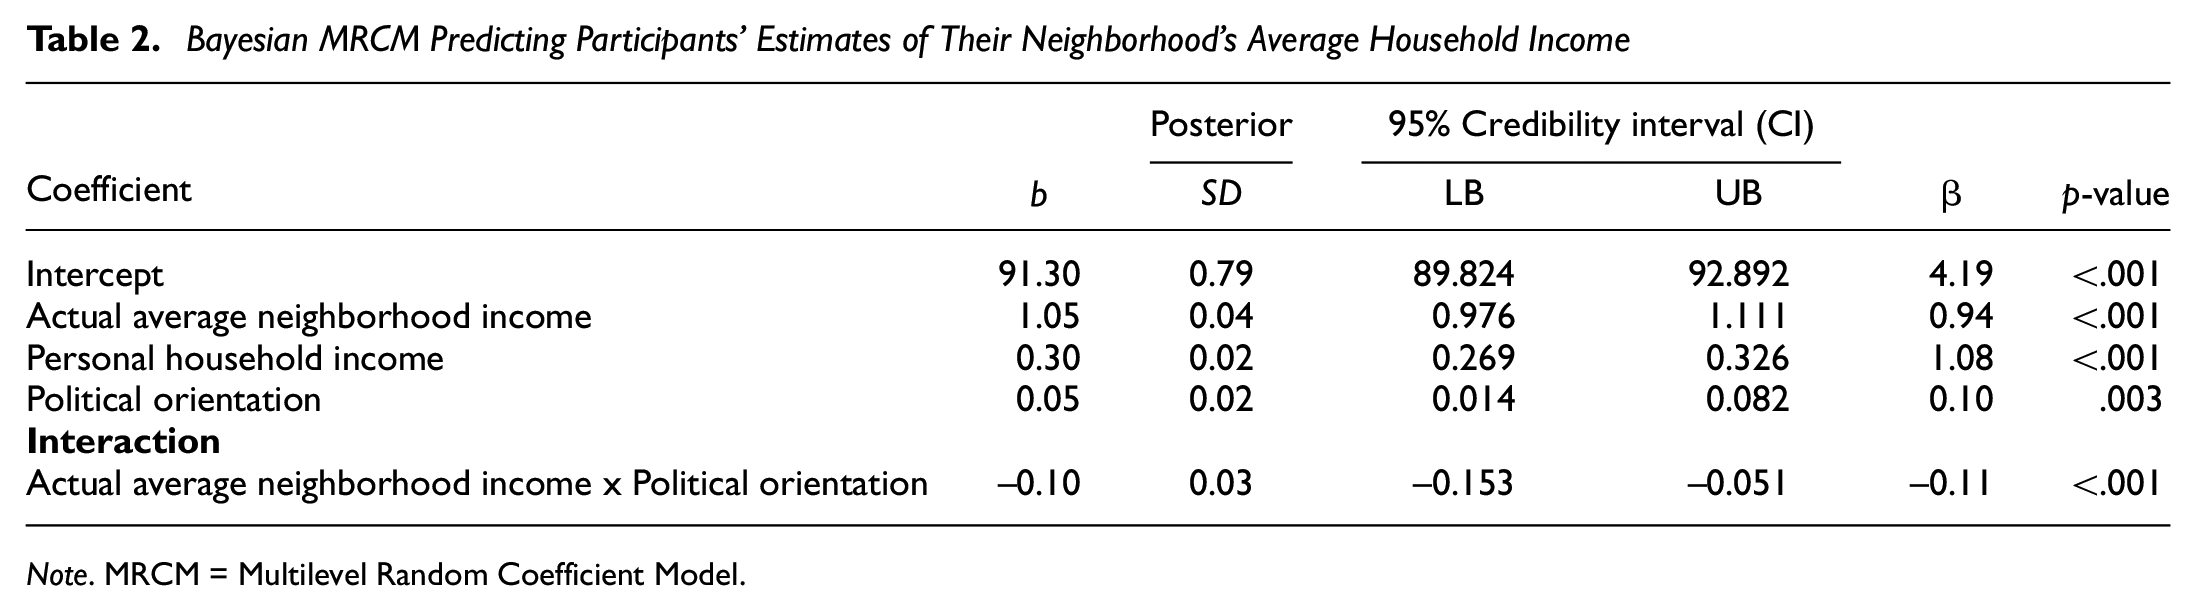
Note. MRCM = Multilevel Random Coefficient Model.
As hypothesized, political orientation moderated the relationship between actual and estimated neighborhood household income (b = –0.10, 95% CI = [–0.153, –0.051], p < .001). To further examine this cross-level interaction, we examined the simple slopes for political conservativism (+1 SD) and liberalism (–1 SD). We also visually inspected these slopes by plotting the association between the actual and estimated average household income of neighborhoods—conditioned by political orientation—for values from NZ$40,000 to NZ$130,000 (see the x-axis of Figure 2). We chose these values because they represented the (rounded) lower and upper 5% of the neighborhood income distribution in New Zealand (lower 5th percentile = NZD $42,800, upper 95th percentile = NZD $126,900). To assist in comparing participants’ estimated and actual average household incomes in their neighborhood, the gray dashed line in Figure 2 represents “perfect” accuracy (i.e., b = 1.0). In contrast, the vertical dashed lines reflect the 5th, 50th, and 95th percentiles for the actual average neighborhood household income.
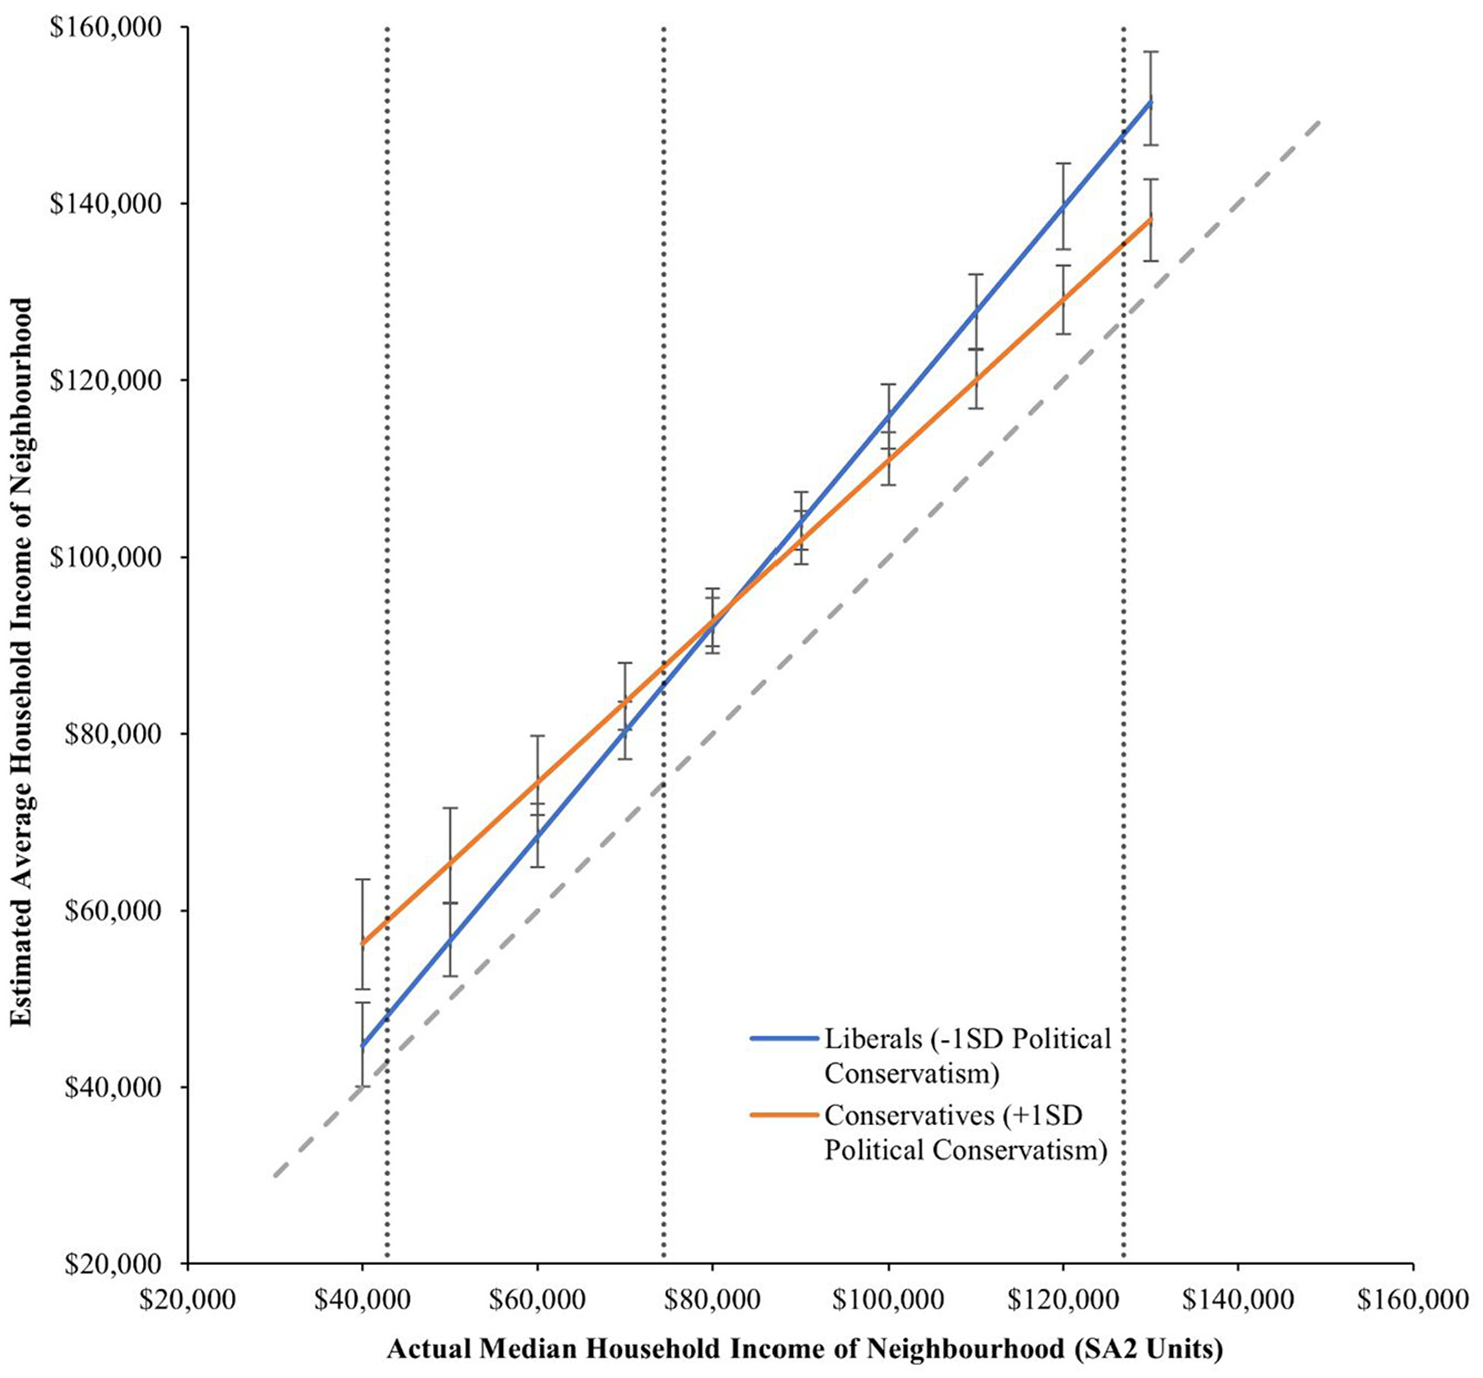
The Cross-Level Interaction Between Actual Neighborhood Income and Political Orientation Predicting Estimated Average Neighborhood Income
Our simple slope analyses revealed that participants’ actual median neighborhood household income was positively associated with estimates among both conservatives and liberals. Compared to “perfect” accuracy, conservatives were marginally undersensitive to wealth variations (b = 0.91, 95% CI = [0.797, 1.003], p < .001), while liberals were oversensitive to wealth variations (b = 1.19, 95% CI = [1.095, 1.279], p < .001). Figure 2 displays these slopes and further reveals differences in bias across the political spectrum. First, Figure 2 reveals that participants tended to overestimate the wealth of their neighborhoods, irrespective of their political orientation (i.e., all point estimates are above the gray dashed accuracy line). However, conservatives living in poorer neighborhoods (i.e., neighborhoods closer to the 5th percentile) were less accurate than their liberal counterparts at estimating the average income of their neighborhood. Conversely, conservatives living in wealthier neighborhoods (i.e., neighborhoods closer to the 95th percentile) were more accurate than liberals at estimating the mean income of their neighborhood. Critically, these differences only emerged at the “extreme” ends of the income distribution; differences between conservatives and liberals were negligible among participants living in neighborhoods with average median incomes close to the 50th percentile. Thus, conservatives and liberals displayed a bias in their estimates of their own neighborhoods’ income in only the poorest and wealthiest neighborhoods, respectively.
Discussion
The present study examined the association between people’s actual and estimated average household income of their neighborhoods and whether political orientation moderated this association. First, our results revealed that, on average, participants overestimated the average household incomes of their neighborhoods. This finding corroborates prior social sampling research suggesting that, although people are reasonably accurate at discerning wealth in their local environments, they tend to overestimate wealth, particularly when living in wealthier neighborhoods (Dawtry et al., 2015; Galesic et al., 2012, 2018). This finding may help to explain why efforts to redress the wealth gap are rare; if people believe their neighborhoods are better off than they are in reality, they may fail to see the need for systematic change.
Critically, our results also revealed differences in where along the income distribution conservatives and liberals overestimate the wealth of their neighborhoods. Although participants, on average, overestimated the average household incomes of their neighborhoods, liberals living in wealthier neighborhoods overestimated the average income of their neighborhoods to a greater extent than did their conservative counterparts. Conversely, in poorer neighborhoods, conservatives overestimated the average income of their neighborhoods more than liberals. These results corroborate previous assertions that perceptions of wealth differ across the political spectrum (Chambers et al., 2014, 2015) but extend this literature by revealing where along the income distribution these differences emerge. Indeed, while the interaction slopes initially suggest that liberals (compared with conservatives) are oversensitive to variations in income, inspection of the point estimates reveals that differences in accuracy only emerged between conservatives and liberals living in neighborhoods at the upper and lower bounds of the income distribution. Thus, both conservatives and liberals misperceive the average household incomes of their neighborhoods, but these ideologically based differences are unique to the “extreme” ends of the neighborhood income distribution.
Although one may be tempted to infer these results demonstrate symmetrical biases, we caution against assuming that conservatives and liberals are “equally” biased (see Baron & Jost, 2019, for discussion). Conservatives and liberals are motivated by different cognitions, with conservatives (relative to liberals) reporting higher intolerance of ambiguity and uncertainty and a greater need for shared reality, structure, and order (Jost, 2017a; Jost et al., 2018). Accordingly, conservatives living in the poorest neighborhoods may overestimate the average household income of their neighborhoods because of an underlying motivation to believe that the income distribution is fair or that they are better off than in reality (Jost, 2017b; Jost et al., 2015). In wealthier neighborhoods, these ideological motivations have fewer palliative benefits, and thus, it is unsurprising that conservatives estimate household income more accurately than liberals in wealthier neighborhoods. In contrast, liberals may overestimate the average household income in the wealthiest neighborhoods (compared with conservatives) because they are more sensitive to inequality and variations in income, and these perceptions are typically concentrated on misperceptions of the wealthy (Chambers et al., 2014). In other words, liberals living in wealthier neighborhoods may perceive the wealth gap as wider and themselves as better off than in reality. Nonetheless, testing these motivations is beyond the scope of the present study, and we are unable to determine whether the motivations underlying overestimates of wealth are asymmetrical across the political spectrum. We thus encourage future research to examine this possibility.
It is also important to examine whether the consequences of these misperceptions differ among conservatives and liberals. Conservatives living in poorer neighborhoods who overestimate the average household income of their neighborhood may, in turn, oppose income redistributive policies (see Dawtry et al., 2015) and perpetuate the justification of existing economic systems (Rodriguez-Bailon et al., 2017). In contrast, liberals living in wealthier neighborhoods may be more supportive of redistributive policies and less supportive of existing social systems (Zacher, 2024). Although examining these processes is beyond the scope of our study, we encourage future research examining misperceptions of wealth and income among the general population to consider the consequences of these perceptions across the political continuum.
Strengths, Caveats, and Future Directions
In addition to important theoretical and practical implications, the present study presents an externally valid assessment of the perceived income distribution using a large, nationwide random sample of adults. Specifically, our participants were nested in neighborhoods representing the actual income distribution. This allowed us to directly assess estimates of average household income among participants living in the least to most affluent neighborhoods in New Zealand. In doing so, our study identified where and how conservatives and liberals differ in their perceptions of their neighborhood’s income, providing a more nuanced understanding of how one’s social environment and political orientation shape perceptions of wealth.
There are, however, limitations worthy of consideration. First, our finding that participants, on average, overestimated the incomes of their neighborhoods may be due (in part) to participants estimating the perceived “average” household income of their neighborhood, while our measure of actual average neighborhood household income reflected the median income. Given that the mean household income is more influenced by “extreme” upper ranges of the income distribution within and between neighborhoods (see Perry, 2016), participants’ estimates may be more accurate if compared to the actual mean, rather than median, neighborhood household income. That said, people also overestimate their average neighborhood household income compared to mean income distributions (Dawtry et al., 2015). In addition, one’s social environment informs their income estimates (Dawtry et al., 2015; Galesic et al., 2012, 2018) and the most “typical” (i.e., median) household income of one’s neighborhood is likely to be more salient than the mean income. Even if one were to assume that people would, on average, be more accurate when compared to mean neighborhood household income, the finding that liberals and conservatives are less accurate (compared to each other) at different ends of the neighborhood income distribution would nonetheless remain. Finally, it is worth noting that our simple slopes analyses are calculated at one standard deviation above and below mean levels of conservatism; differences between conservatives and liberals may be more pronounced at extreme ends of the political spectrum. Future research should consider these potential methodological questions when examining perceptions of neighborhood household income.
It is also important to note that New Zealand is a relatively egalitarian Western nation that outperforms OECD averages for income, employment, education, and social indicators (OECD, 2023a, 2023b). Accordingly, our results may not generalize to countries with greater neighborhood income disparities or lower overall societal wealth. Likewise, New Zealand only has moderate levels of polarization (Satherley et al., 2020; Wagner, 2021). The tendency to overestimate the average income in one’s neighborhood may be greater (or, counterintuitively, weaker) in countries with greater attitudinal divides between conservatives and liberals. Finally, countries with higher homophily in social networks may increase biases in perceptions of wealth in one’s social networks (see Galesic et al., 2018; McPherson et al., 2001). Given that New Zealand is highly multicultural and less homophilic than countries such as the United States (Motyl, 2016), it is important to assess whether liberals and conservatives misperceive neighborhood wealth to a greater extent in more homophilic neighborhoods and nations. Future research should consider these cross-national differences when examining perceptions of wealth (or lack thereof) and the role of political orientation in shaping these perceptions.
Conclusion
Social sampling research suggests that inferences about wealth are informed by the available information about the income distribution in people’s social environment. However, one’s ideological sensitivity to wealth also influences their attention and interpretation of this information. The present study illustrates these processes by demonstrating that conservatives and liberals misperceive the average wealth of their own neighborhoods at opposite ends of the income distribution. Specifically, overestimates of the average household income of one’s neighborhood were more pronounced among (a) liberals living in the wealthiest neighborhoods and (b) conservatives living in the poorest neighborhoods. These results offer insight into where along the income distribution ideological differences may emerge in perceived wealth (and lack thereof), providing a springboard for future research to assess the impacts of these (mis)perceptions on support for redistributive policies and economic social change.
Footnotes
Handling Editor: Adam Hahn
Author Contributions
All authors conceptualized the study and approved the manuscript in its final form. KJL wrote the original manuscript and led the manuscript revisions. KJL and CGS conducted the analyses. CGS curated the data set and acquired funding. CGS and DO provided supervision. RD, RMS, CGS, and DO provided extensive feedback on the manuscript.
Declaration of Conflicting Interests
The author(s) declared no potential conflicts of interest with respect to the research, authorship, and/or publication of this article.
Funding
The author(s) disclosed receipt of the following financial support for the research, authorship, and/or publication of this article: Preparation of this manuscript was supported by a Templeton Religion Trust grant (TRT-2021-10418) awarded to the New Zealand Attitudes and Values Study.
Data Availability
The data described in the paper are part of the New Zealand Attitudes and Values Study (NZAVS). Full copies of the NZAVS data files are held by members of the NZAVS management team and research group. Due to restrictions imposed by the Ethics Committee, the data presented in this study cannot be made publicly available. However, a deidentified data set containing the variables analyzed here is available for appropriately qualified researchers upon request for the purpose of replication. Requests to access the data should be directed to Chris G. Sibley, c.sibley@auckland.ac.nz. The Mplus syntax used to test all models reported in this manuscript is available on the NZAVS OSF: ![]() .
.