
Abstract
Perceived polarization between U.S. Democratic and Republican voters has grown over past decades, and this polarization underpins a dwindling sense of hope about the future. Contrary to this trend, the present three experiments (one pre-registered) with 2,529 U.S. participants found substantial similarities between the groups in their fundamental values. We tested whether depicting these real value similarities in overlapping distributions can correct misperceptions of group differences and increase hope. Republicans and Democrats who saw overlapping distributions perceived the groups as more similar and expressed more hope in open-ended comments, compared with seeing commonly used barplots or receiving no information. The effect on qualitative hope was partially explained by a sense of shared reality and potential for compromise between groups. We call on the social sciences to report the amount of group overlap when communicating research findings on group comparisons to the media and public to help reduce harmful perceptions of polarization.
Keywords
U.S. Republican and Democratic voters are typically perceived as deeply divided. In fact, more than 80% of Americans express concern about this division, and supporters of both parties perceive the divide as growing (Pew Research Center, 2019a). Recent research, however, suggests that this divide is more perceived than real, with Republicans and Democrats overestimating their differences in terms of policy preferences (Enders & Armaly, 2019), political engagement (Druckman et al., 2021), and support for partisan violence (Mernyk et al., 2022). This perceived polarization has grown dramatically between the 1970s and the 2010s (Enders & Armaly, 2019; Westfall et al., 2015), and it underpins partisan animosity and a lack of hope about the future (Druckman et al., 2022; Pew Research Center, 2019b; PRRI, 2019).
The social sciences may play a harmful role in fueling these misperceptions. Although actual polarization between the groups is well-documented (e.g., Jost et al., 2008), this evidence is typically based on testing mean differences and glossing over intragroup variabilities. For instance, a medium effect size (Cohen’s d = 0.50) is considered a sizable difference but actually reflects an 80% overlap between groups (Hanel et al., 2019; Inman & Bradley, 1989). Despite this, conclusions in social sciences and media usually focus on the extreme 10% of Republicans and Democrats on either end, obscuring that the majority of responses are overlapping. In a re-analysis of data from over 2,000 U.S. American voters (Ponizovskiy, 2022), we found that despite significant differences between Republicans’ and Democrats’ human values, their median overlap was 90.9% (Figure 1 and Supplement Table S1). Conclusions that focus on the differences and ignore the overlap can be misleading when communicating research findings to the public, particularly in light of recent evidence that perceiving opposing partisans to be extreme causes individuals to adopt more extreme views themselves (Hartman et al., 2022). The present research examines whether presenting overlapping distributions (Figure 1, left-side panels), which accurately display group similarities alongside differences, can correct Republicans’ and Democrats’ misperceptions of polarization, with potential downstream effects on partisan animosity and hope.
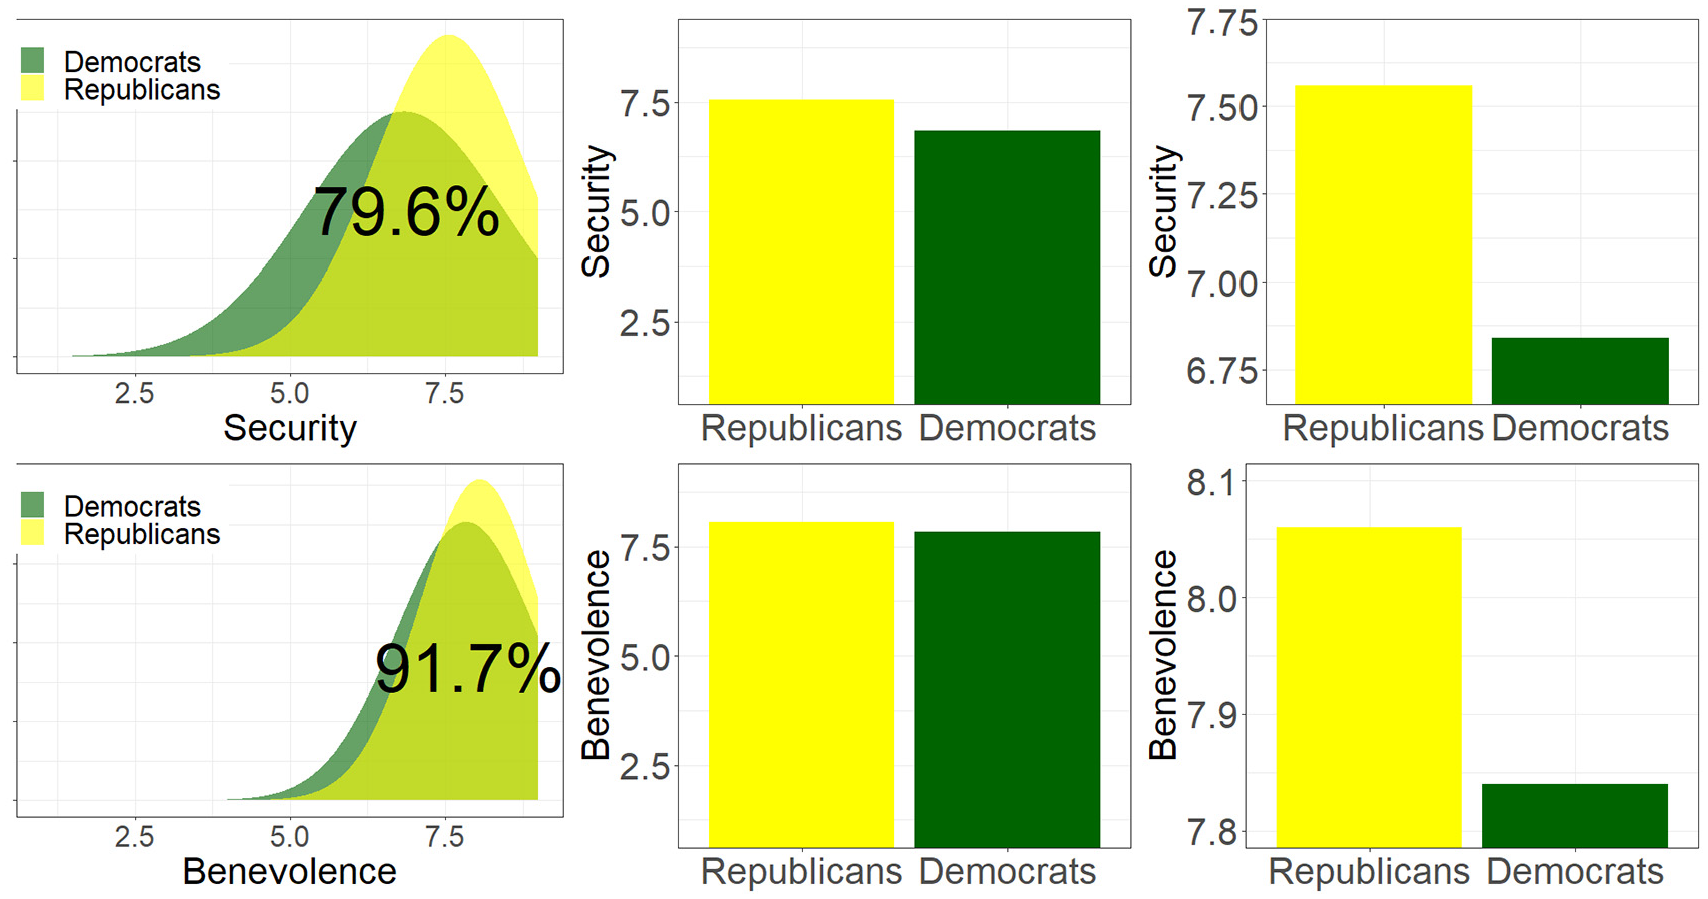
Graphs Were Produced From Real Data (Ponizovskiy, 2022)
There is growing literature seeking to correct partisan misperceptions. For instance, past work has presented information on outpartisans’ policy preferences (Ahler, 2014), political engagement (Druckman et al., 2021), desire for violence (Mernyk et al., 2022), or outgroup animosity (Lees & Cikara, 2020; Ruggeri et al., 2021; Voelkel, Chu, et al., 2023), generally finding that these interventions help to reduce perceptions of polarization. However, this work has presented outgroup averages (e.g., mean policy preferences), which as mentioned above, paint a simplified picture of the outgroup that may still perpetuate misperceptions of polarization. The present research goes beyond past work by presenting graphical information of ingroup and outgroup variability in overlapping distributions.
We focus on comparing the groups’ human values. This focus is important for several reasons. First, values are life-guiding principles that are central to what we believe makes us human, they carry great personal meaning, and they predict a wide range of attitudes and behaviors (Maio, 2016; Verplanken & Holland, 2002). Discovering similarities in values should hence be particularly meaningful and elicit robust effects. In line with this reasoning, classic theories of prejudice assume that perceiving value differences between groups is a major driving force behind prejudice (Rokeach et al., 1960; Stephan & Stephan, 2000). Similarly, from a political perspective, Finkel et al. (2020) suggested that political sectarianism, a superordinate term to political polarization, includes the tendency to view others as fundamentally different (i.e., othering), untrustworthy (i.e., aversion), and immoral (i.e., moralization). The fundamental and moral nature of values (Feldman, 2021), and the recognition that opposing partisans share these values, may hence provide a direct antidote to othering and moralization. Second, because we cannot observe values, we may often infer them from salient snippets of other people’s attitudes and behaviors, and this inference process is constrained by an overwhelming emphasis in the social sciences and media on reporting differences. A value-based intervention may hence be particularly beneficial by addressing the latent root of the issue. Third, we rely on Schwartz’s well-established model which has been tested across more than 80 countries (Bilsky et al., 2011; Schwartz et al., 2012) and has shown relevance across a wide range of contexts (Maio, 2016). We hence expect that a shared values approach will provide a powerful intervention that could be applied to various contexts and variables of interest.
There is abundant evidence that people possess highly similar values (Schwartz & Bardi, 2001). For instance, data from over 70 countries show that people’s values are far more similar than different across diverse characteristics (e.g., nation and gender; Hanel et al., 2019). And despite the highly divisive nature of the Brexit referendum, U.K. Leave and Remain-voters share around 90% of their values (Hanel & Wolf, 2020). Such value similarities are typically larger than similarities in other variables such as attitudes or policy preferences (Garcia-Rada & Norton, 2020; Syropoulos & Leidner, 2023). However, people substantially underestimate value similarities (Hanel, Wolfradt, Coelho, et al., 2018; Sanderson et al., 2019), and those who underestimate them more report greater prejudice toward immigrant groups (Wolf et al., 2019) and lower well-being (Wolf et al., 2021). Showing people their true level of value similarities may therefore bring important benefits.
In fact, prior work has found that presenting Leave and Remain-voters with overlapping value distributions can help reduce perceptions of polarization compared with truncated barplots (Hanel & Wolf, 2020). However, although truncated barplots are still a common way to visualize group differences and hence serve as a useful comparison (Hanel et al., 2019; Zhuang et al., 2021), they exaggerate differences and hence might actively increase perceived differences. The present three experiments go beyond past work by testing two additional conditions. Experiments 1 and 2 included an empty baseline condition, allowing us to determine whether the observed effects are in fact driven by displaying between-group overlap rather than emphasizing differences in truncated barplots. The pre-registered Experiment 3 also included untruncated barplots; a recommended method for visualizing group comparisons (e.g., Yang et al., 2021).
We compare these conditions on novel outcomes, including potential for compromise, partisan animosity, and hope about the future. Beyond our aim to reduce perceived polarization (i.e., higher perceived similarities), we examine the perceived potential for compromise given recent evidence that U.S. Republicans and Democrats actually enjoy cross-party conversations but avoid them because they expect disagreement (Wald et al., 2024). Reducing such perceived hurdles around cross-party interactions could hence bring downstream benefits in light of the well-documented benefits of intergroup contact (Pettigrew & Tropp, 2006). Furthermore, the focus on hope is important given widespread pessimism about the future of the United States (Najle & Jones, 2019; Pew Research Center, 2019a). Hope is an emotion that motivates individuals to find solutions to a problem, and it is linked with physical and mental well-being, as well as better coping with and taking action against societal challenges such as climate change (Frumkin, 2022; Stevenson & Peterson, 2015). These benefits on people’s health and societal engagement make it important to identify ways to increase hope.
We expected that overlapping distributions comparing Democratic and Republican voters would increase perceived similarities and potential for compromise, reduce partisan animosity, and increase hope about the future. We expected the baseline condition and the untruncated barplot conditions to fall between the overlapping distributions and truncated barplots’ conditions. The data (including explanations and syntax) and study materials are openly available at https://osf.io/tkjuv/?view_only=798d9f21d42045a7804bd7d53f3edd64.
Experiment 1
Method
Participants
Experiment 1 was conducted on Prolific in September 2021. We recruited approximately equal numbers of Democratic and Republican voters, who were U.S. nationals, 18+ years, with English as first language. The sample size was determined by funding availability. We excluded six participants with identical responses on the open-ended question. Based on a sensitivity analysis with G*Power 3.1.9.6 (Faul et al., 2009), our remaining sample of 409 participants provided 95% power to detect effect sizes of at least d = 0.44 in independent samples t-tests. Participants (Mage = 37.94, SD=11.18; 183 women, 222 men, 3 other; 200 Republicans, 209 Democrats) received approximately $11/h for the 10-min experiment.
Following the manipulation, participants completed measures in the following order: thoughts on the manipulation (these responses were coded for hope), perceived similarity and potential for compromise, and source attribution bias, intergroup attitudes, inclusion of other in the self, meta-perceptions, social distance, group efficacy, and group identification.
Procedure and Materials
See Supplement A for detail on all measures.
Human Values
The experiment started with a 21-item Schwartz (1992) values measure to familiarize participants with their nature. All present experiments showed substantial similarities between Republicans and Democrats (see Supplement Tables S2–S4).
Manipulations
Participants were randomly allocated to one of the three conditions: the overlapping distribution condition, the truncated barplot condition, or a baseline condition. To create the graphs, we used Ponizovskiy’s (2022) data from 1,016 liberal and 1,022 conservative U.S. Americans on the refined Portrait Value Questionnaire (Schwartz et al., 2012; Table S1). We re-labeled liberals as Democrats and conservatives as Republicans in all graphs, given evidence of high correlations between these political identities, r = .92 (Hanel, Wolfradt, Maio, & Manstead, 2018). To reduce participant fatigue, the experimental conditions showed a random set of three of Schwartz’s 10 value types.
The two experimental conditions informed participants that they were going to see real data. In one condition, participants saw overlapping normal distributions (e.g., Figure 1, left-side panels). The other condition showed barplots with the y-axis truncated so that it ended .10 units above and below the higher and lower score, respectively (e.g., Figure 1, left-side panels). Participants were asked to spend approximately 3 min on the task. In the control condition, participants proceeded directly to the dependent variables.
Experiment 1 included a fourth condition where participants saw overlapping distributions of the values of children of Democrats and Republicans (n = 131; Study N: 540). This condition was based on past evidence that thinking about children increases pro-social motivation (Wolf et al., 2022; results reported in Supplement C).
Open-Ended Question
Next, participants in the experimental conditions noted their thoughts, reactions, and anything they found interesting, surprising, or thought-provoking. The responses were coded by four raters, blind to conditions. They were asked to judge how hopeful the person who wrote the comment is about the future of the United States using a 5-point scale (1 = pessimistic; 5 = hopeful). The codings were averaged across raters (intraclass correlation coefficient [ICC] = .81, α = .85).
Perceived Value Similarity
Participants answered two items: “How similar [different] do you think Republicans and Democrats are in terms of their values?” (r = .71).
Perceived Similarity
Participants answered two items “How similar [different] do you think Republicans and Democrats are overall?” The third item was the Inclusion of the Other in the Self-item (IOS-scale; Aron et al., 1992).
Perceived Potential for Compromise
Participants answered three items: “How easily do you think Republicans and Democrats can get along with each other?” (Hanel & Wolf, 2020), “In your opinion, how politically divided is the country?” (Rutchick et al., 2009), and “In your opinion, is there potential for agreement or compromise on political issues in the US?” These three items did not intercorrelate highly (rs = .29–.36) and were analyzed separately.
Partisan Animosity
Participants answered “How motivated are you to engage in a discussion with someone who supports the Democratic [Republican] party?” (Hanel & Wolf, 2020). Ingroup favoritism was measured with four items asking how much participants liked or felt favorable toward typical Democrats (α = .94) and Republicans (α = .96). We subtracted the attitudes toward outgroup from the ingroup, with higher scores expressing more favorable views toward the ingroup. We also used the 13-item social distance scale (Bogardus, 1933; α = .93).
Identification
We measured identification with the ingroup using four items from Leach et al.’s (2008) identification scale (α = .91).
Results
Following a significant multivariate effect in a one-way between-subject multivariate analysis of variance (MANOVA) (F(13, 236) = 9.18, p < .001), we examined a series of analyses of variance (ANOVAs) (Table 1). Perceived value similarities and perceived similarities showed strong effects, with those in the distributions condition perceiving the other group as more similar than those in both other conditions. The truncated barplots and control conditions did not differ from each other.
Experiment 1: Impact of Intervention: One-Way Between-Subject ANOVAs
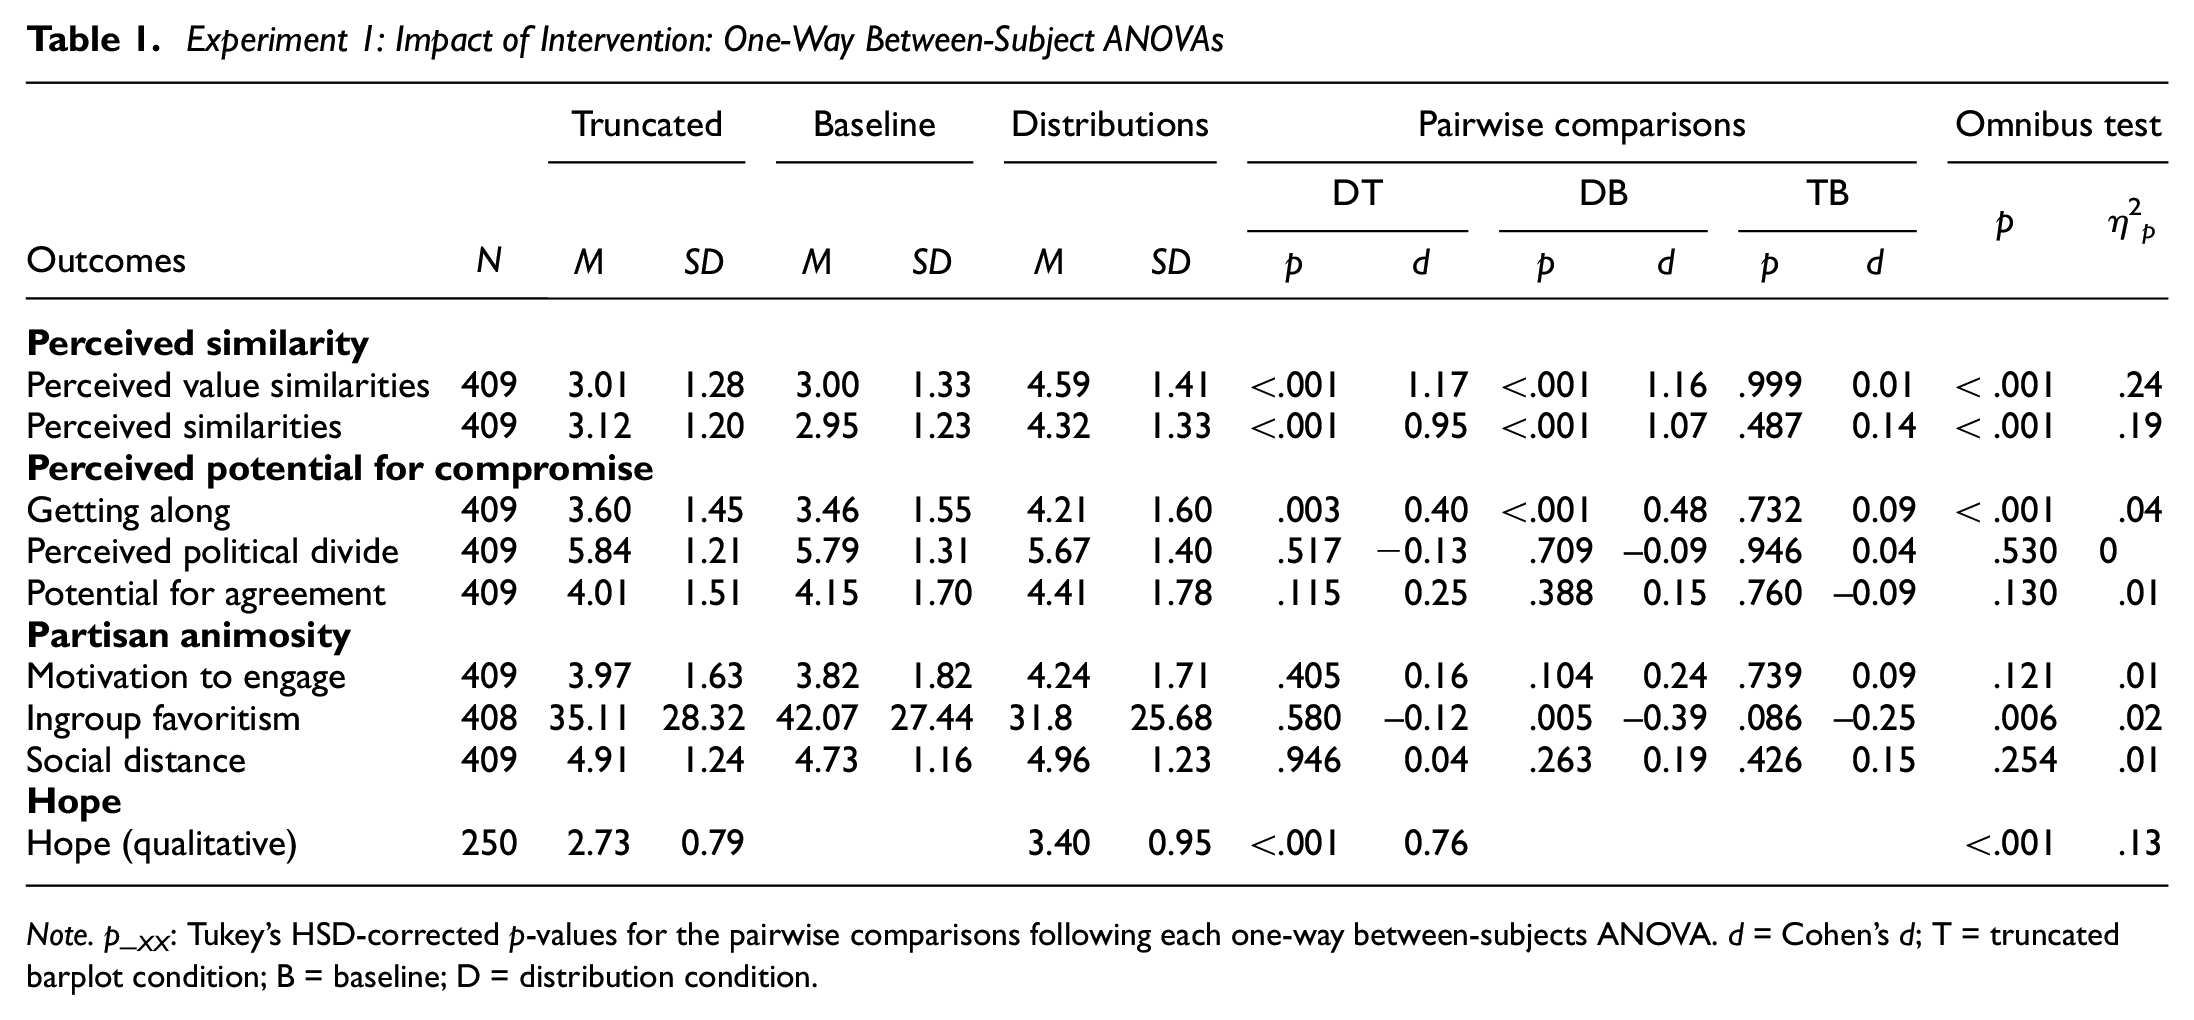
Note. p_XX: Tukey’s HSD-corrected p-values for the pairwise comparisons following each one-way between-subjects ANOVA. d = Cohen’s d; T = truncated barplot condition; B = baseline; D = distribution condition.
The effects on perceived potential for compromise and partisan animosity were mixed. Those who saw distributions perceived the groups to get along more easily than those in the other two conditions, and they showed greater ingroup favoritism compared with baseline. No effects emerged on perceived political divide, potential for agreement, motivation to engage, and social distance.
The experimental conditions differed in qualitative expressions of hope. Responses in the distributions condition were rated as more hopeful than responses in the truncated barplots’ condition (Figure 2), with a large effect size (see Supplement Table S13 for example comments). We found no effects on source attribution bias, meta-perceptions, or group efficacy beliefs (see Supplement Table S7).
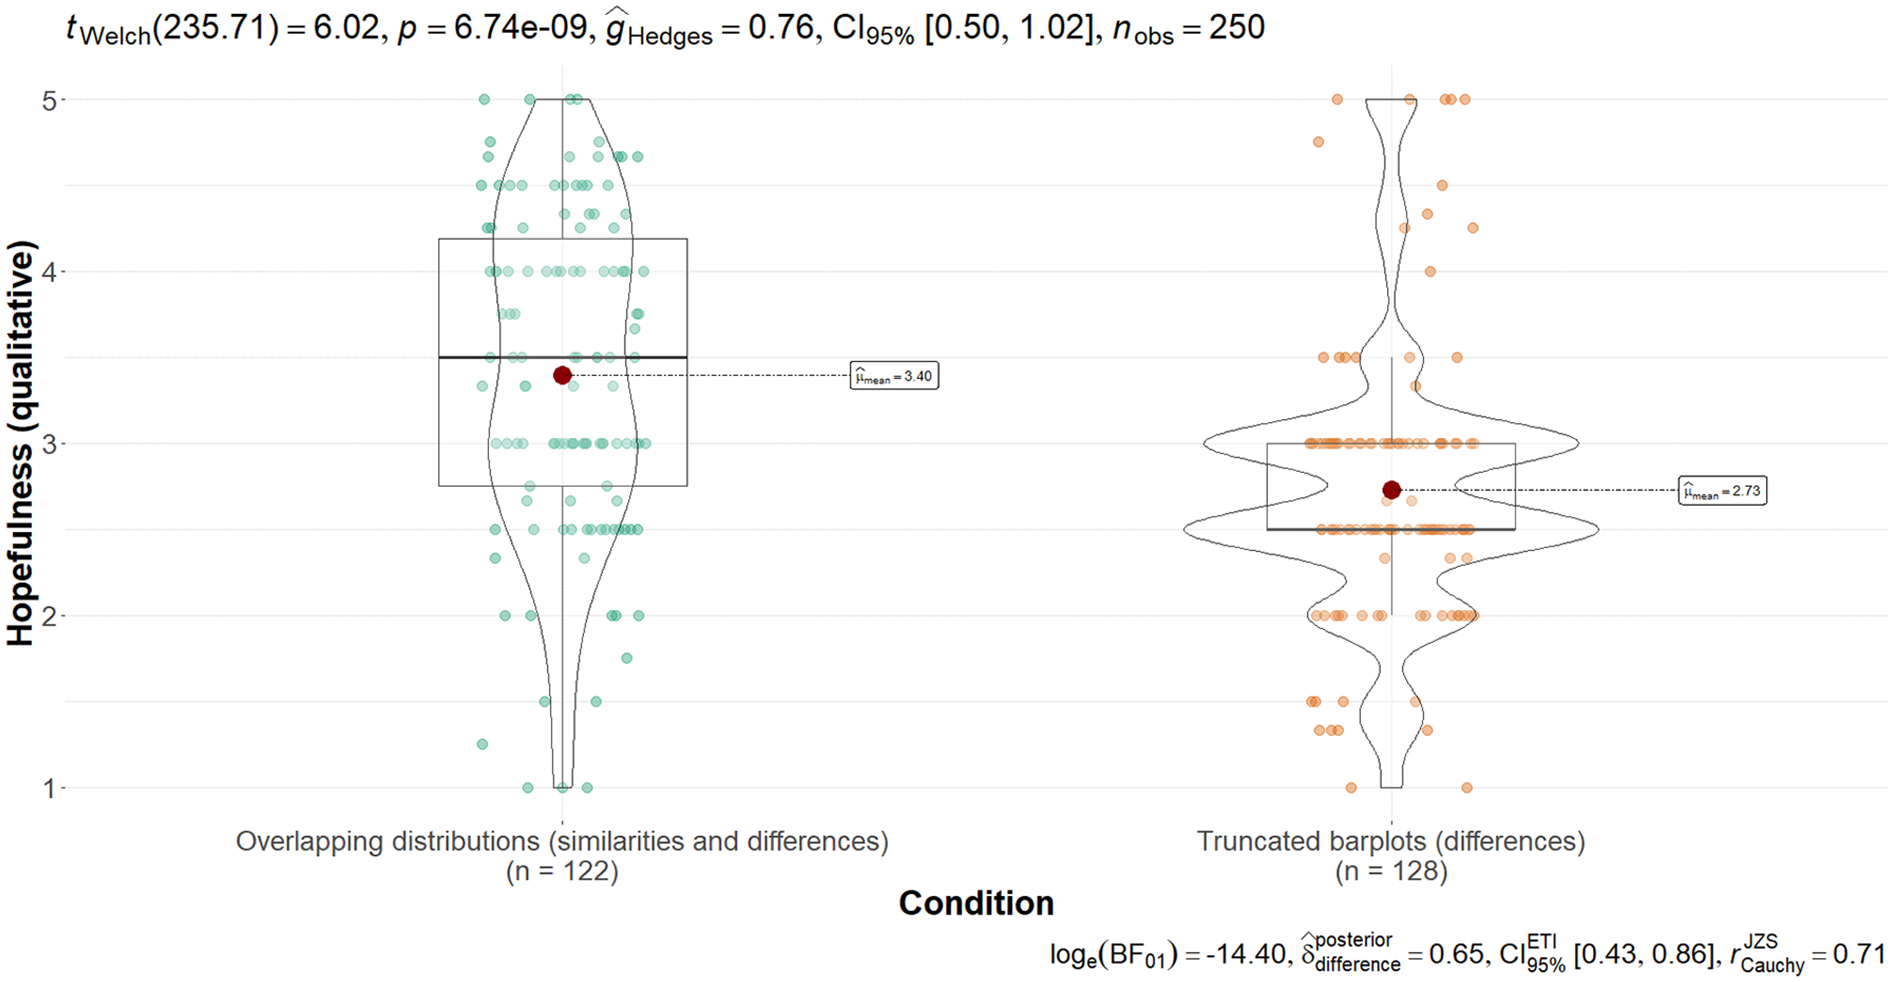
Effects on Hope
Discussion
The findings in Experiment 1 suggest that comparing groups in overlapping distributions can help correct common misperceptions of differences between Republicans and Democrats, relative to presenting the data in commonly used truncated barplots. Interestingly, there was no difference between the truncated barplot condition and baseline, suggesting that people assume exaggerated group differences at baseline. Experiment 1 also provided provocative evidence that showing overlapping distributions elicits hope. Experiment 2 sought to replicate these findings with a larger sample.
Experiment 2
Method
Participants
Experiment 2 was conducted on Prolific in summer 2022 and used the same inclusion criteria as Experiment 1. A power analysis showed that detecting an effect size of d = 0.30 (based on Experiment 1) with 95% power requires a sample size of 870 participants for independent samples t-tests with three groups. To ensure this sample size after exclusions, we recruited 997 participants. Twenty-four participants were excluded because they did not support either party. Participants (Mage = 48.08, SD = 15.50; 506 women, 460 men, 5 other, 2 declined to answer; 480 Republicans, 493 Democrats) received similar compensation as in Experiment 1.
Materials and Procedure
The overall procedure was similar to Experiment 1 with changes described below. Supplement A gives more information on the materials.
Perceived Similarity
We measured perceived value similarity (α = .85) and perceived similarity (α = .89) as in Experiment 1.
Perceived Potential for Compromise
We again used the item “How easily do you think Republicans and Democrats can get along with each other?” However, a second item asked “In your opinion, is there potential for agreement or compromise between Republican and Democratic voters?,” as opposed to asking about the potential on political issues (cf. Experiment 1). Third, we assessed attitude polarization around specific policies. This measure presented six scenarios, adapted from Westfall et al. (2015), including “Some people believe that we should spend much less money for defense. Others feel that defense spending should be greatly increased.” Participants answered two questions per scenario: “Where do you think typical Democratic [Republican] voters stand on this issue?” Responses were averaged and the outgroup average was subtracted from the ingroup average to reflect greater perceptions of attitude polarization (α = .63).
Partisan Animosity
We assessed ingroup favoritism as in Experiment 1 (αs = .97). We also asked participants: “How motivated are you to engage in a discussion with a Democratic [Republican] voter?” which was a small deviation in wording from Experiment 1 to refer to voters rather than party members.
Hope
Quantitative hope was measured with an 8-item scale based on Stevenson and Peterson’s (2015) climate change hope scale. Example items include “I believe people will eventually be able to tackle societal crises” (α = .91).
Ingroup identification was measured as in Experiment 1 (α = .93).
Results
A one-way between-subject MANOVA showed a significant multivariate condition effect (F(11, 590) = 23.42, p < .001). The distribution condition again elicited higher perceived value similarities and perceived similarities than the other conditions with a large effect size, and the barplot and baseline conditions did not differ from each other (Table 2).
Experiment 2: Impact of Intervention: One-Way Between-Subject ANOVA
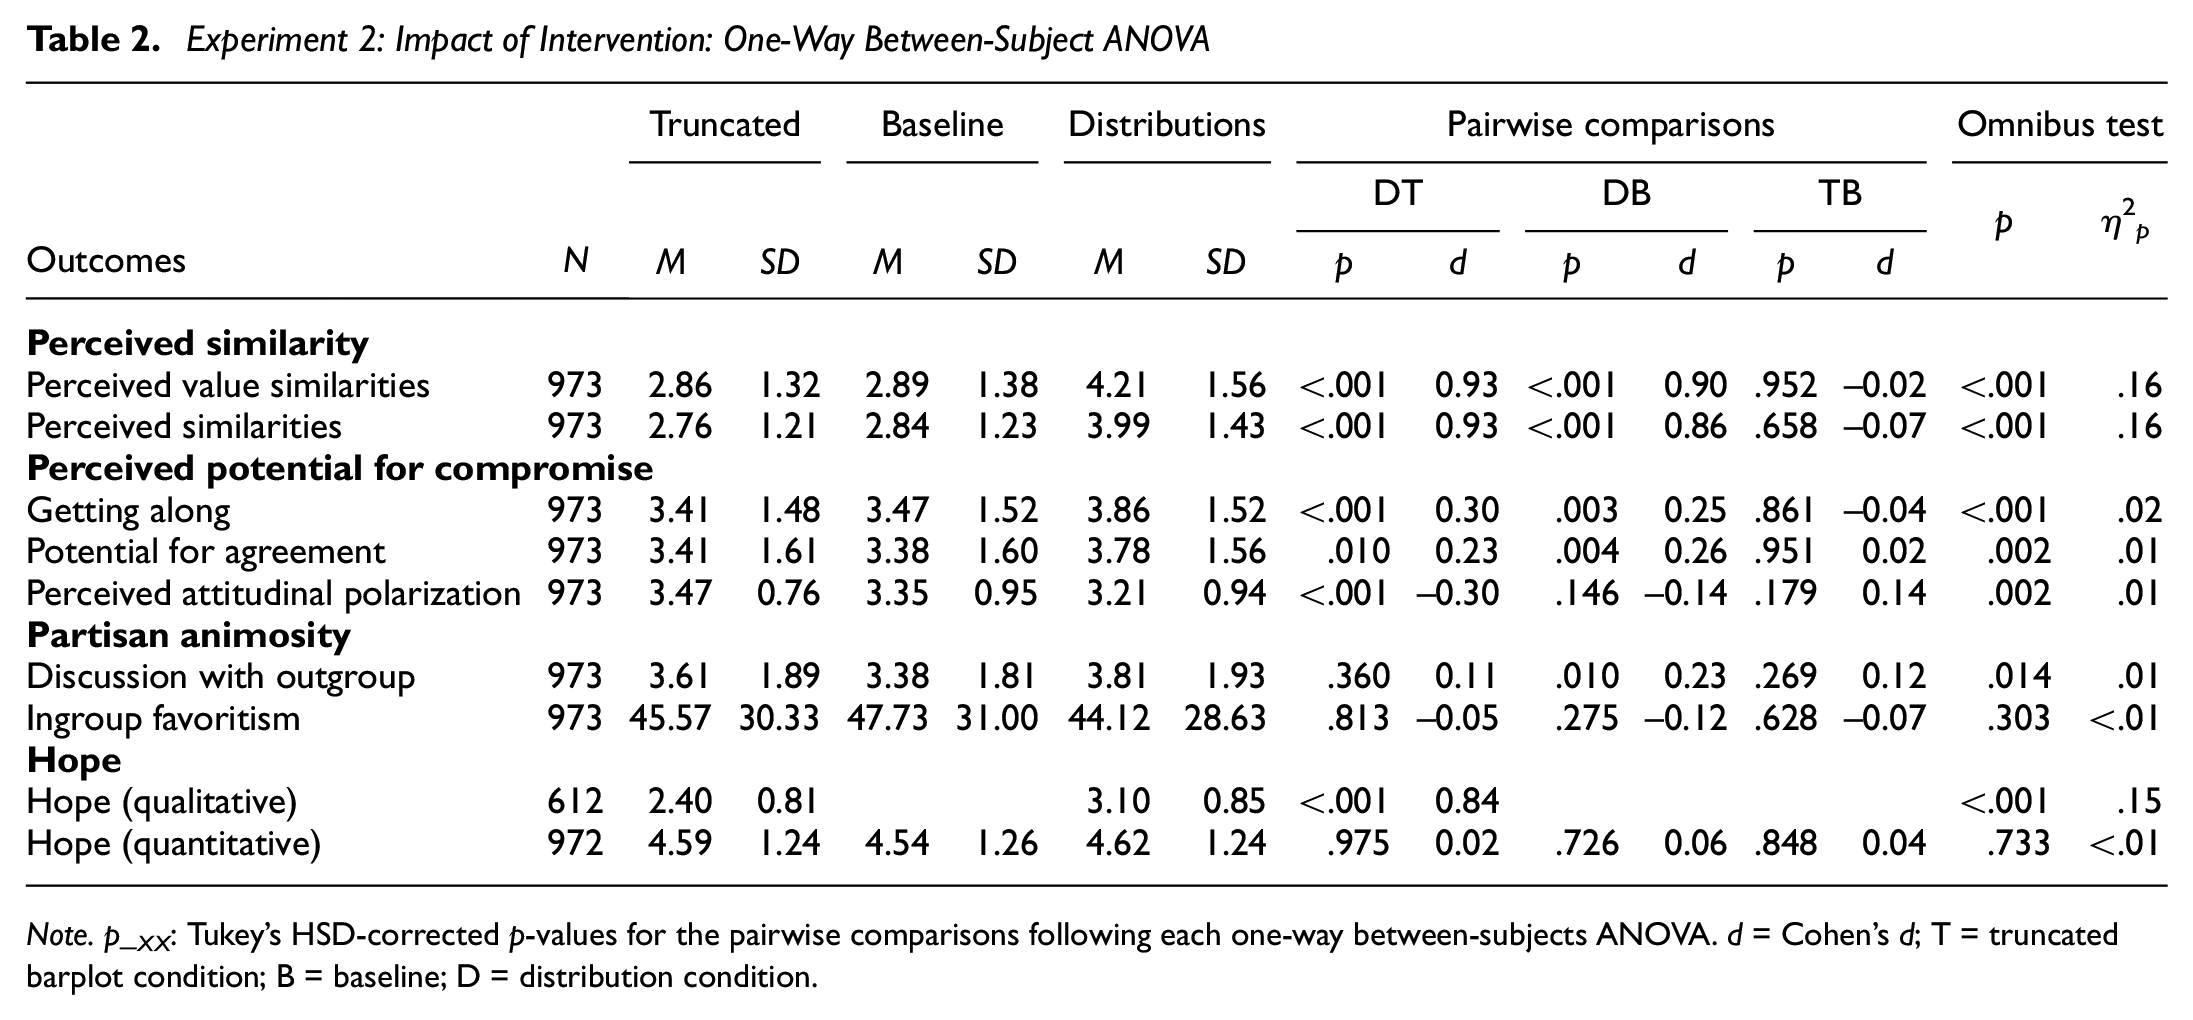
Note. p_XX: Tukey’s HSD-corrected p-values for the pairwise comparisons following each one-way between-subjects ANOVA. d = Cohen’s d; T = truncated barplot condition; B = baseline; D = distribution condition.
The distribution condition elicited higher perceived potential for compromise between the groups compared with the other conditions, with small-to-medium effect sizes. Seeing overlapping distributions also reduced attitude polarization compared with the barplot condition. Effects on partisan animosity were mixed as in Experiment 1.
The distribution and barplot conditions again differed in qualitative expressions of hope. Three raters (α = .79) coded responses in the distribution condition more frequently as expressing hope than responses in the truncated barplot condition (Figure 3), with a large effect size. We found no effects on a quantitative hope measure.
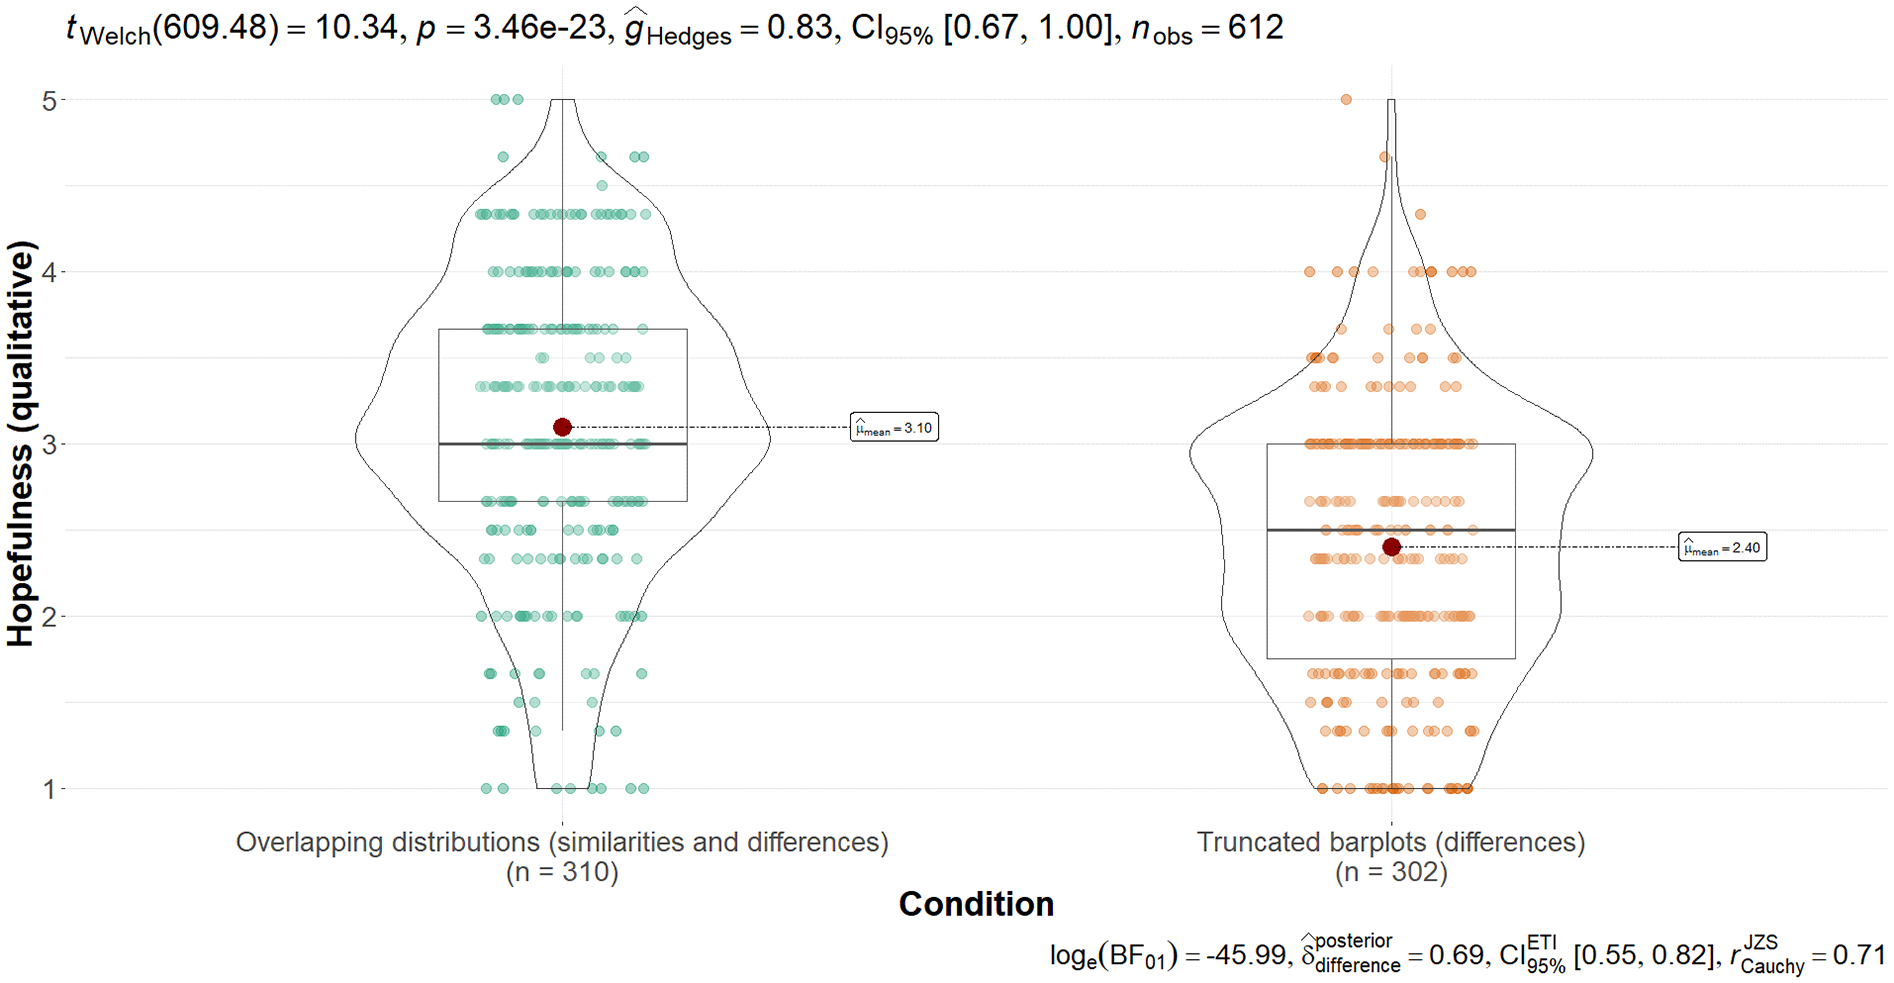
Effects on Hope
Discussion
Experiment 2 replicated the findings from Experiment 1 in a larger sample. Overlapping distributions helped correct misperceptions of differences between Republicans and Democrats, and these effects extended to greater perceived potential for compromise. As in Experiment 1, people appear to perceive substantial polarization at baseline. The overlapping distributions again elicited expressions of hope, but this effect was not found on a quantitative measure.
Experiment 3
Experiment 3 further extended these findings by testing an untruncated barplots’ condition: a recommended method for reporting group differences (e.g., Yang et al., 2021). We expected this condition to fall between the distribution and truncated barplot conditions, because although group differences will appear smaller in untruncated barplots, untruncated barplots still obscure the extent of overlap between groups. We pre-registered the experiment (https://osf.io/vmnhx/?view_only=a3bb76a5adaf47538ddeca055a139f5f). The pre-registered hypotheses state that, compared with the truncated barplot condition, the distribution condition will elicit greater perceptions of similarity and potential for compromise and more expressions of hope. We explored whether the untruncated barplot condition would fall between the other conditions on these and other outcomes.
Method
Participants
Inclusion criteria and sample size considerations are in line with Experiments 1 and 2 and are described in the pre-registration form. We recruited 1,153 U.S. American citizens participants (Mage = 46.97, SD = 14.24; 579 women, 565 men, 6 other, 3 refused to answer; 576 Republicans, 577 Democrats) in March 2024.
Materials and Procedure
The procedure was similar to Experiments 1 and 2. All materials and indices follow directly from the pre-registration (see Supplement A for further detail on the materials).
Manipulation
After the values measure, participants either saw overlapping distributions, truncated barplots (both as before), with a third condition presenting three barplots with an untruncated y-axis showing the full scale from 1 to 6 (Figure 1, middle panel). To create the graphs, we computed the weighted averages of the responses from Democrats and Republicans from Experiments 1 and 2 (Supplement Tables S2–S3). In all conditions, the subsequent open-ended question asked participants more directly than in Experiments 1–2 to write about how they feel about the future. Eight raters coded these responses for hope (instructions as before; α = .97) and cohesion (1 = society very divided; 5 = society cohesive; α = .92).
Outcome Measures
Participants indicated how strongly they feel each of eight emotions about the future. Among these emotions were optimistic and hopeful, which were averaged into a quantitative measure of hope (r = .85). Perceived similarities were measured with the IOS-scale. Perceived potential for compromise was measured with three items (α = .91). Perceptions of shared reality were measured with three items (Rossignac-Milon et al., 2021), including “Democrats and Republicans see the world in a similar way” (α = .94). Outgroup trust was assessed using three questions based on Noor et al. (2008a; 2008b), including “Most Republicans/Democrats can be trusted” (α = .96). Animalistic dehumanization and mechanistic dehumanization were assessed with two items each, adapted from Bastian et al. (2013), such as “I feel like Democratic/Republican voters are unsophisticated” (r = .44) and “I feel like Democratic/Republican voters are mechanical and cold” (r = .47).
Results
A one-way between-subject MANOVA showed a significant multivariate effect of condition (F(11, 1137) = 15.72, p < .001,
Experiment 3: Impact of Intervention: One-Way Between-Subject ANOVA
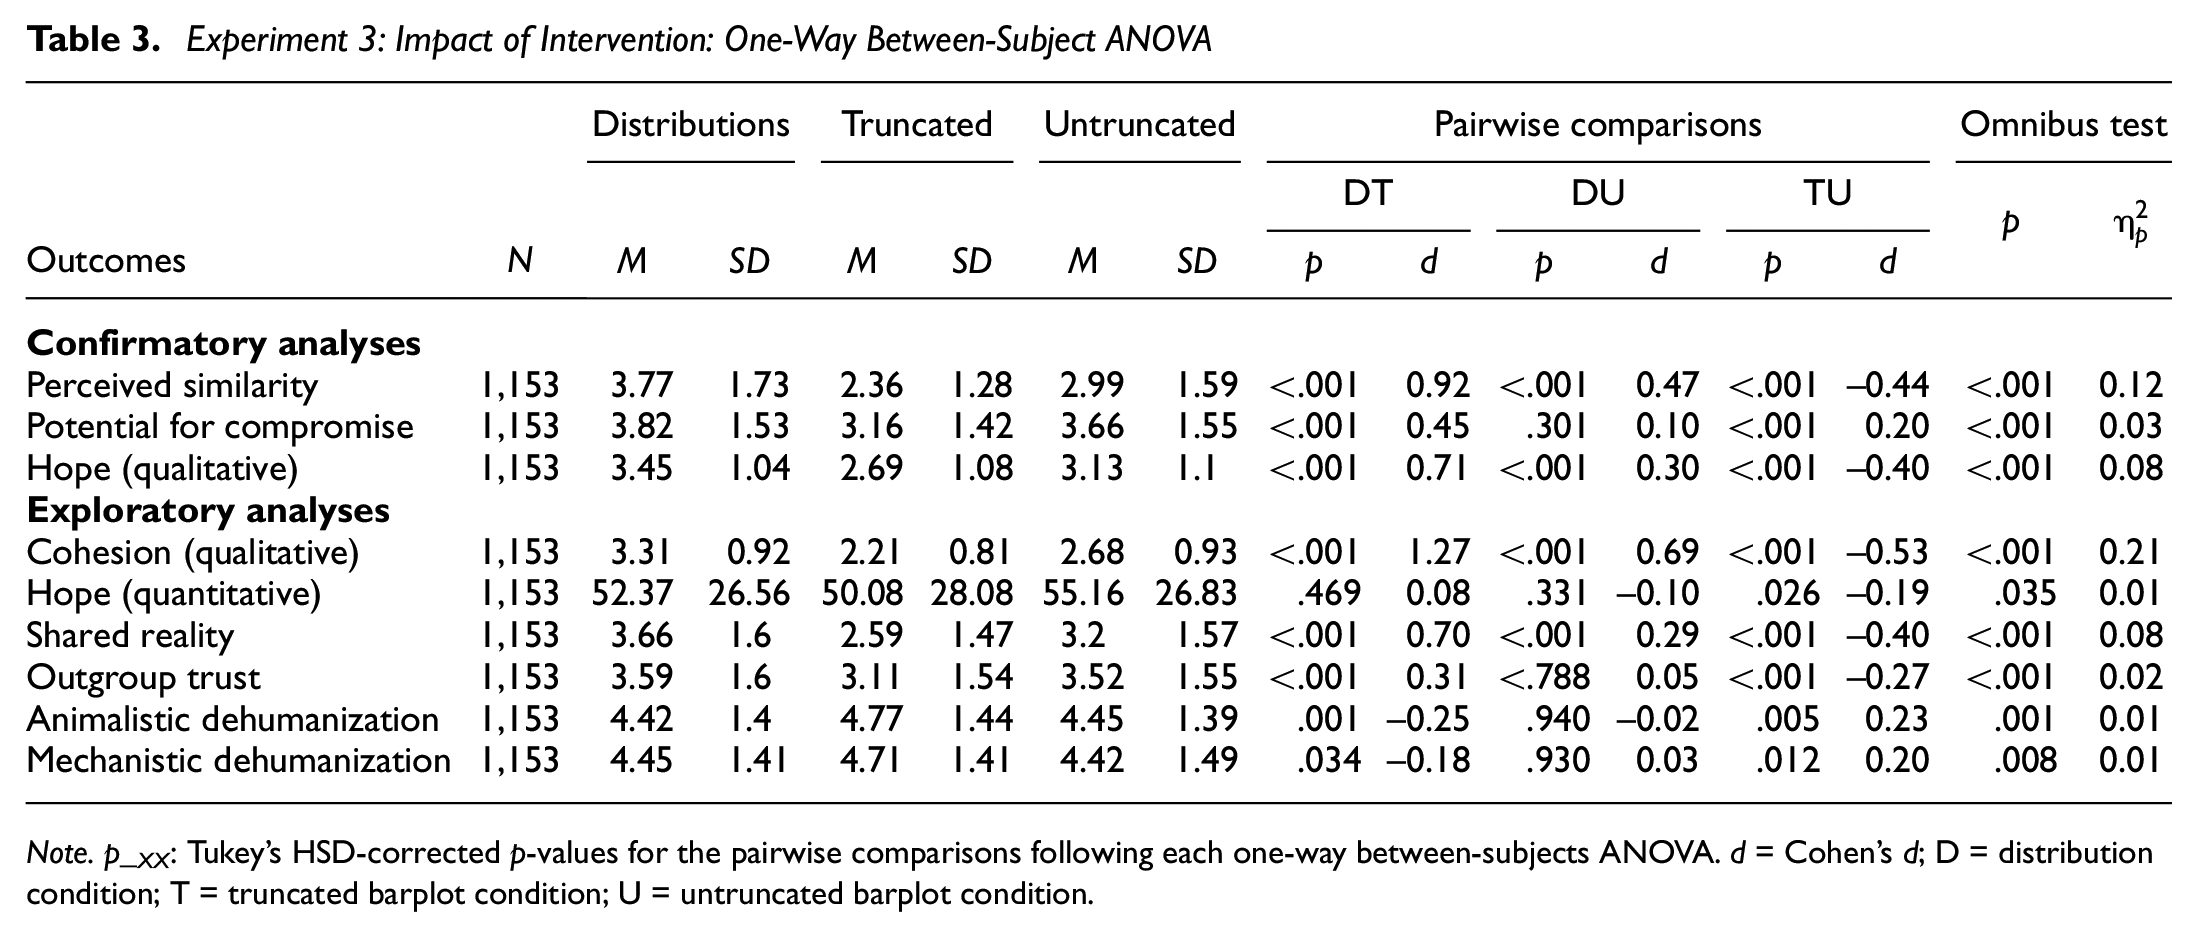
Note. p_XX: Tukey’s HSD-corrected p-values for the pairwise comparisons following each one-way between-subjects ANOVA. d = Cohen’s d; D = distribution condition; T = truncated barplot condition; U = untruncated barplot condition.
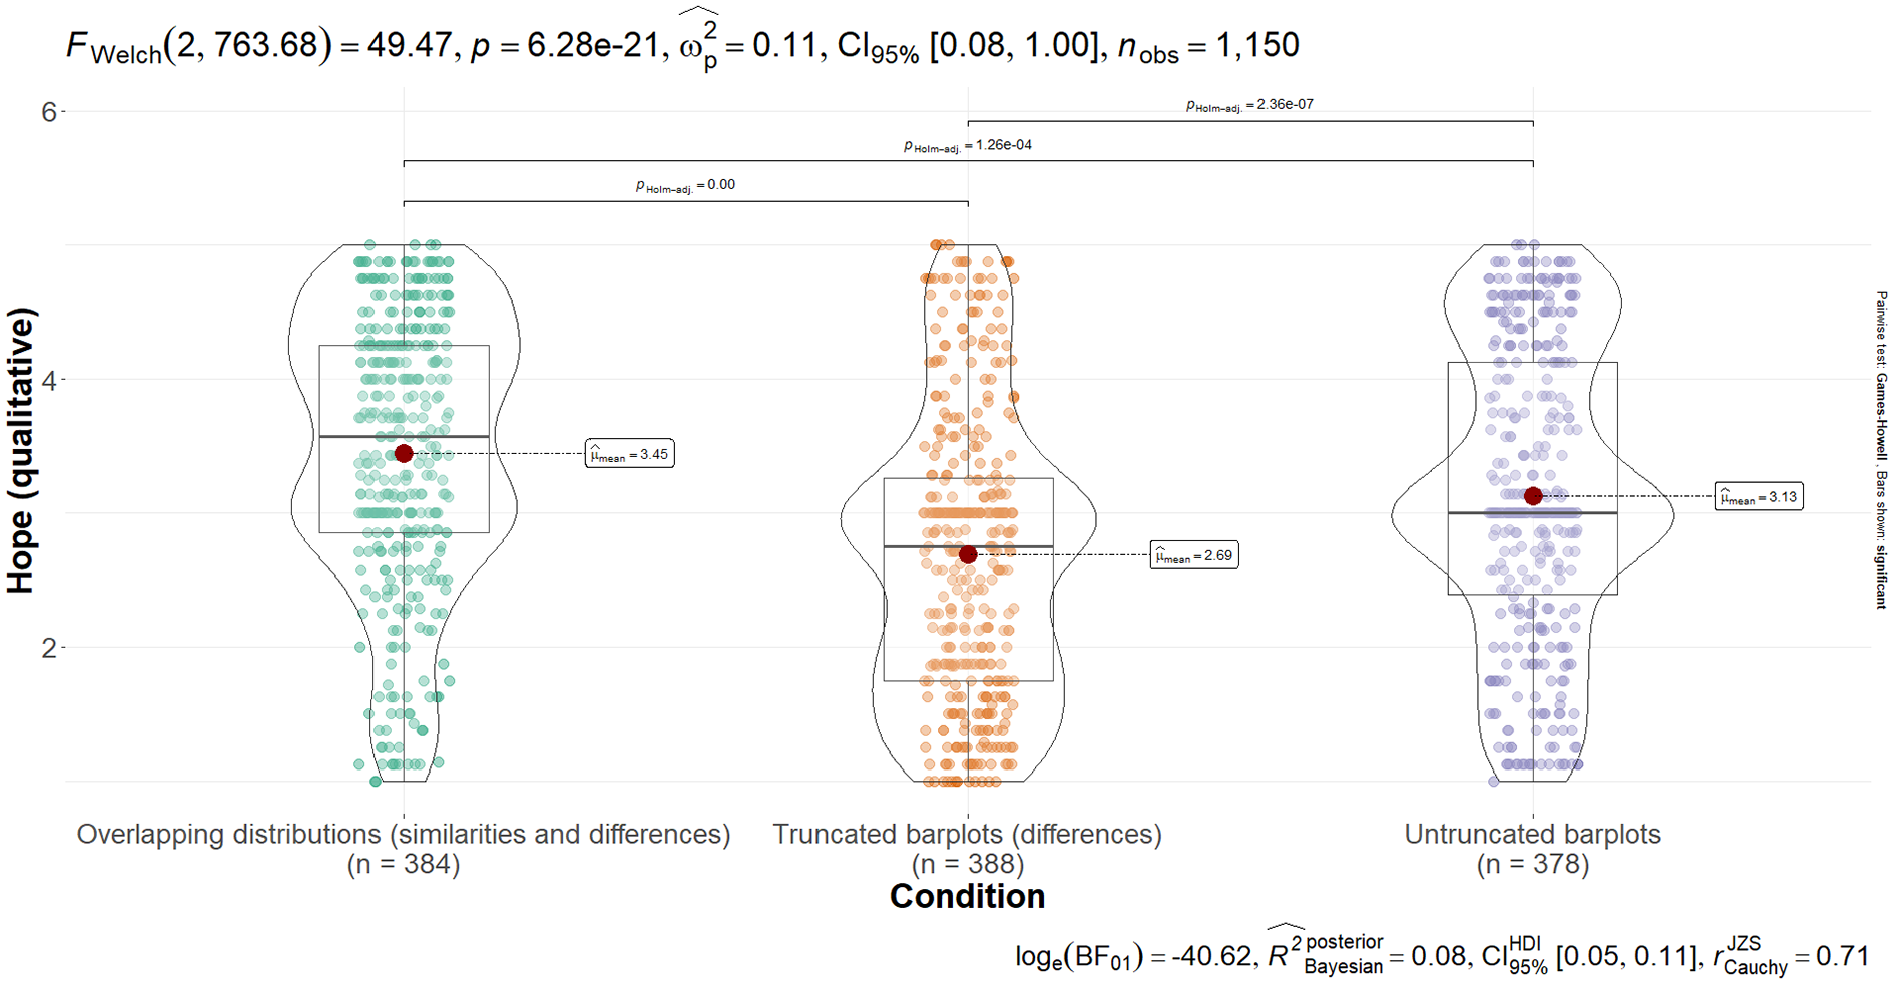
Effects on Hope
As in Experiment 2, compared with the truncated barplot condition, the distribution condition did not elicit higher hope on a quantitative measure, although the quantitative measure of hope correlated substantially with the qualitative measure (r = .48, p < .001) (Supplement Table S10). Surprisingly, the untruncated barplot condition showed a small but significant effect on quantitative hope compared with the truncated barplot condition.
We conducted a series of mediation analyses using the R-package psych, version 2.2.9 (Revelle, 2022) to test whether the effects of the distribution versus truncated barplot conditions on qualitative hope were mediated by perceived similarity, perceived potential for compromise, shared reality, trust, dehumanization, and qualitative ratings of cohesion. As shown in Supplement Table S12, all variables at least partially mediated the effect. Qualitative ratings of cohesion fully mediated the effects, whereas the quantitative measures of shared reality and potential for compromise showed the strongest partial mediation effects.
Across all three experiments, we explored whether any of the effects were moderated by political orientation (Democrats vs. Republicans), age, gender, ingroup identification, value endorsement, and order of value presentation. We found no evidence for moderation. Correlation tables between moderators, DVs, and demographics are reported in the supplement (Tables S6, S8, and S10).
General Discussion
Three experiments tested whether overlapping distributions that accurately depict similarities alongside differences between Republicans’ and Democrats’ values can correct misperceptions of differences and have positive downstream effects. We found consistently that participants perceived the groups to be more similar when they saw overlapping distributions, compared with seeing barplots or receiving no information.
Our other findings show why correcting misperceptions is important. Seeing truncated barplots performed similar to seeing no information, suggesting that the exaggerated depiction of group differences in truncated barplots is in line with people’s baseline perceptions. The social sciences and media may play a harmful role in fueling and perpetuating these biased perceptions through an emphasis on reporting group differences while ignoring the overlap. This emphasis is particularly problematic because it might set biased ingroup and outgroup norms that drive further polarization (Hartman et al., 2022). Group differences are often more newsworthy than commonalities, and although this focus can have its use and is unlikely to change, the overlapping distribution approach provides a method that can simultaneously display differences and similarities between groups for a more complete picture. Interestingly, this approach was also more effective in correcting misperceptions than untruncated barplots, which is a commonly recommended method for reporting differences in the social sciences (Yang et al., 2021). A reason for this greater effectiveness may be that distributions directly show the proportion of data points that are similar versus different, while additionally depicting the heterogeneity of both groups. Overlapping distributions may hence provide a more intuitive and comprehensive picture of group comparisons that translates into higher perceptions of similarity.
We found robust downstream effects of reduced misperceptions on qualitative expressions of hope; effects that were pre-registered in Experiment 3 and emerged consistently across three experiments and all 15 raters. Participants who received information on group overlap expressed more hope about the future of the country in open-ended comments compared with participants who saw truncated or untruncated barplots. This large effect was partially explained by a greater sense of shared reality between the groups and greater perceived potential for compromise. It was also fully mediated by qualitative ratings of how cohesive participants perceived U.S. society to be. Interestingly, these effects were robust across sociodemographic variables and order effects, suggesting widely applicable effects. Together, people appear to feel a sense of hopelessness because they see the country as deeply divided, and reducing the perceived division can help inspire new hope. These effects are particularly valuable in the face of growing pessimism in the United States (Najle & Jones, 2019; Pew Research Center, 2019a), and evidence that hope is a crucial driver for positive societal change and mental and physical health (Frumkin, 2022). Comparing groups that are commonly perceived as deeply polarized in overlapping distributions may hence be an optimistic signal that there is a way to find compromise and build a better future, thus eliciting greater expressions of hope.
It is surprising, however, that these robust effects on qualitative hope were not mirrored across two quantitative measures of hope. Experiment 2’s belief-based measure did not significantly correlate with the qualitative hope ratings, whereas Experiment 3’s affective measure showed a large correlation. There is clear overlap between qualitative comments that were consistently coded by raters as expressing high hope and the items used in both quantitative measures (e.g., “I feel very optimistic about the future”; see Supplement Table S13 for the comments). The findings suggest that although overlapping distributions robustly elicit unprompted expressions of hope, the effect is muddled when directly asking about hope, perhaps due to response biases or because participants consider other reasons for feeling hopeful or hopeless when prompted. Although the difference appears to be primarily methodological at first glance, with qualitative ratings showing the effect as opposed to quantitative measures, it should be noted that our measures of perceived potential for compromise may also be considered as reflecting a sense of hope, and these quantitative measures did show effects of the intervention. In any case, future research could take this evidence forward by testing whether expressions of hope also occur outside of written text, for example, in cross-party conversations, and whether conversations infused with hope are experienced as more pleasant, potentially eliciting more compromise and cooperative behavior.
The effects on perceived potential for compromise are further interesting because they extend to perceiving greater agreement on commonly divisive, concrete policies such as government spending on health and education. This finding may suggest that the intervention could open up conversations about progress on such divisive topics, rather than expecting deadlock and conflict that may thwart attempts from the start (Wald et al., 2024). Moreover, on this outcome, the overlapping distributions and untruncated barplots’ conditions showed comparable effects relative to truncated barplots. The reason may be that both methods provide a more accurate picture of the generally small group differences, and hence both methods could help improve people’s low expectations about cross-party interactions (Wald et al., 2024). Partisan animosity showed more mixed effects. There were no consistent effects on outgroup liking, but in Experiment 2, overlapping distributions elicited greater motivations to discuss with an outgroup member, and Experiment 3 found that overlapping distributions and untruncated barplots increased outgroup trust and reduced dehumanization. Although past evidence suggests that correcting misperceptions can reduce partisan animosity, these effects are generally small (e.g., Mernyk et al., 2022; Syropoulos & Leidner, 2023), and scattered effects are to be expected with small effect sizes (Lakens & Etz, 2017).
Recent evidence suggests that correcting some misperceptions can be more impactful than others, with information on outpartisans’ anti-democratic attitudes improving outcomes whereas information on outpartisans’ policy support or opportunism showed no effects (Voelkel, Stagnaro, et al., 2023b). As argued in the introduction, we would expect that discovering similarities in human values is particularly impactful because values are personally meaningful and relevant across a wide range of cultures and contexts, because actual value similarities are large, and because perceived value differences are often assumed but rarely corrected in everyday life. Future work may benefit from comparing or combining a value-based approach with other approaches. For instance, interventions could combine correcting misperceptions of ideological polarization (e.g., values) and support for anti-democratic attitudes (e.g., support for partisan violence; Mernyk et al., 2022), in light of evidence that improvements in ideological and affective polarization do not necessarily translate into effects on anti-democratic tendencies (e.g., Voelkel et al., 2023a). Future research could also test approaches that not only correct misperceptions of values but also of how these values are expressed in attitudes or behaviors (i.e., value instantiations; Maio, 2010) for a more comprehensive approach that simultaneously targets group differences at abstract and concrete levels.
Another important question for future research is the longevity of the effects. Past work has found that the effects can persist for several weeks after the intervention (Mernyk et al., 2022; but see: Lees & Cikara, 2020; Syropoulos & Leidner, 2023) but also that the effects are susceptible to introducing doubt (e.g., alluding to the uncertainty of science) or conflicting information (e.g., on differences in other variables; Druckman, 2023). Future work could test whether the present approach shows more enduring effects because perceptions of value similarities should remain personally meaningful and relevant across situations, and because the overlapping distribution method could build resistance against conflicting information that focuses exclusively on extremes and exaggerated group differences. Nevertheless, it should be acknowledged that information from a one-shot manipulation will not always be remembered and brought to mind in relevant situations, and we hence expect that repeated exposure paired with more explicit guidance (e.g., how to spot and correct for exaggerated differences) may be most effective.
The present research goes beyond past work in important ways. It presented information comparing real responses from U.S. Republicans and Democrats in graphical displays of overlapping distributions rather than presenting outgroup averages. In fact, similarity conditions in past work showing group averages to correct misperceptions of differences (Ahler, 2014) may be most comparable to our barplot conditions, suggesting that our intervention provides benefits beyond past work. Moreover, our approach not only provides a rich and visual intervention to correct people’s misperceptions of group differences, but this approach in our view also demonstrates an improved way of communicating group comparisons to the public. The social sciences and media may benefit from (additionally) reporting the extent of overlap between groups when communicating findings on group comparisons to the public (Hanel et al., 2019; Hyde, 2005), helping to correct overblown perceptions of polarization with positive effects for society.
Supplemental Material
sj-docx-1-spp-10.1177_19485506241263887 – Supplemental material for Correcting Misperceptions of Fundamental Differences Between U.S. Republicans and Democrats: Some Hope-Inspiring Effects
Supplemental material, sj-docx-1-spp-10.1177_19485506241263887 for Correcting Misperceptions of Fundamental Differences Between U.S. Republicans and Democrats: Some Hope-Inspiring Effects by Lukas J. Wolf and Paul H. P. Hanel in Social Psychological and Personality Science
Footnotes
Author Contributions
Both authors contributed equally to conceptualization, design, data collection, analysis, and write-up.
Data Availability
The data (including explanations and syntax) and study materials are openly available at ![]() . All reported studies follow ethical guidelines including obtaining informed consent from the human participants prior to participation, participants were not deceived, and their data were kept anonymously. All studies were granted ethical approval by the psychology research ethics committee where the research was conducted. The research complies with APA’s Principles and Guidance for Human Subjects Research.
. All reported studies follow ethical guidelines including obtaining informed consent from the human participants prior to participation, participants were not deceived, and their data were kept anonymously. All studies were granted ethical approval by the psychology research ethics committee where the research was conducted. The research complies with APA’s Principles and Guidance for Human Subjects Research.
Declaration of Conflicting Interests
The author(s) declared no potential conflicts of interest with respect to the research, authorship, and/or publication of this article.
Funding
The author(s) disclosed receipt of the following financial support for the research, authorship, and/or publication of this article: This project was in part supported by funding from the Economic and Social Research Council (ESRC) under grant agreement ES/P002463/1.
Supplemental Material
Supplemental material is available in the online version of the article.
Handling Editor: Tullett Alexa
Author Biographies
References
Supplementary Material
Please find the following supplemental material available below.
For Open Access articles published under a Creative Commons License, all supplemental material carries the same license as the article it is associated with.
For non-Open Access articles published, all supplemental material carries a non-exclusive license, and permission requests for re-use of supplemental material or any part of supplemental material shall be sent directly to the copyright owner as specified in the copyright notice associated with the article.