
Abstract
When people say a value is important to them, does it have consequences years later? Recent research found that among people who hold a value to be highly important, there tend to be strong relations between that value and behavior. But does this effect persist over time? The current research found that highly important values correlate with behavior, 1 and 2 years later, significantly more strongly than less important values, using a sample of Australian adults (n = 2,333 to 3,135). We found this between refined values and indices of value-expressive behaviors, as well as between tradition and universalism values and charitable donations. This adds to our understanding of the nature of values as priorities, showing that highly important values operate differently to less important values by having a stronger role in their effect on behavior, not just in the present but also in the future.
Keywords
The motivational character and stability of values implies that they should be a relatively persistent influence on behavior, across situations and over time (Sagiv & Roccas, 2021). However, there is limited empirical evidence to support this proposition. This article endeavors to fill this gap by investigating the nature of value-behavior relations over time. The study examines whether values are associated with future behavior 1 and 2 years later, and whether these associations differ along the distribution of value importance, such that they are stronger at higher levels and weaker at lower levels. This is significant theoretically, as it advances the understanding of the nature of values as a stable individual-difference variable that might have long-term consequences. It is also significant for application, as predicting behavior from values in any context may be encouraged (or discouraged) based on these findings.
Personal Values
Personal values are broad motivational goals that transcend situations and serve as guiding principles in life (Schwartz, 1992). They are organized as priorities within individuals, where each person has a personal hierarchy of values, with some values being highly important to them, and others less important (Schwartz, 2012). Value priorities are systematically related to a wide range of individual differences, including beliefs, attitudes, and behaviors (Schwartz et al., 2012). In adulthood, value priorities tend to be mostly stable (Leijen et al., 2022; Schuster et al., 2019), but little is known about the predictive stability of values over time and across situations.
Factors Influencing Value—Behavior Relations
Values have been shown to relate to a wide variety of behaviors, from everyday actions (e.g., Schwartz & Butenko, 2014) to important and long-term decisions, such as career choice (e.g., Sagiv et al., 2017). However, correlations between values and behavior have generally been found to be relatively weak (e.g., Schwartz & Butenko, 2014; Schwartz et al., 2017). Several factors may help to explain this. First, any specific action is a product of various factors (e.g., situational pressures and personal factors like fatigue or ability) of which values are just one (e.g., Maio, 2010). Second, a society’s culture may influence the strength of relations between values and behavior. Those from “looser” cultures (i.e., with looser cultural norms) have been found to express their values in behavior more than those from “tighter” cultures (i.e., with stronger cultural norms) (Elster & Gelfand, 2021). Third, values and behaviors that are highly normative tend to have weaker value-behavior relations (Bardi & Schwartz, 2003; Roccas & Sagiv, 2010). Fourth, it is argued that values need to be salient and activated to influence behavior (e.g., Maio et al., 2009).
Recent research has also found that value-behavior relations tend to be nonlinear and vary across the distribution of value importance (Lee et al., 2022). Specifically, more important values tend to be more strongly related to their expressive behavior, and less important values tend to be more weakly related, as measured approximately 2 weeks apart. This finding implies that most values may function differently at higher than lower levels of importance, in that more important values may have a much greater effect on behavior. This makes sense given that values are both motivational goals and priorities (Schwartz, 1992, 2012). If behavior is shaped by trade-offs between competing value priorities, it is intuitive that our most important values would have stronger relations with behavior as compared with less important values, as behavior expressing more important values should be prioritized over alternative actions. It is also possible that highly important values tend to be activated and, as such, more accessible in memory when making value-expressive choices. Furthermore, it is possible that highly important values are prioritized in actions that are based on careful decision-making, resulting in recurrent behaviors (e.g., dieting) that create habits. However, the potential implications of value importance for predicting future behavior are yet to be tested.
Few studies have examined value-behavior relations over time, and most of these have focused on value-behavior relations over relatively short periods. For example, in adults, values measured 1 to 2 months prior to an election have been found to relate to voting (e.g., Schwartz et al., 2010). Furthermore, while there are studies that examine value-behavior relations over longer periods, they do this using analysis conditioned on the mean, and for specific value-expressive behaviors in samples of children and adolescents, for whom values tend to be less stable (e.g., Benish-Weisman, 2015; Vecchione et al., 2020).
Given that values represent motivational goals, which are relatively stable across situations and over time, we would expect that they commensurately guide behavior over time and thus relate to future behaviors (see Sagiv & Roccas, 2021), possibly through habit formation, as suggested above. Considering this, there is a need to study value-behavior relations in adults over extended time periods to assess their predictive stability. Furthermore, given the finding that value-behavior relations vary across the distribution of value importance (Lee et al., 2022), there is also a need to examine whether highly important values are more strongly related to future behavior than less important values, as a consequence of the hierarchical nature of values meaning that some values are prioritized over others during value-driven decision-making (Schwartz, 2012). If this is the case, it would suggest a multiplying effect, whereby strongly held values continue to strongly influence behavior over time. This has implications for both our understanding of the nature of values and providing future directions for applied values research.
The Current Study
This study investigates value-behavior relations across their distributions, over a 2-year period. Part 1 examines quantile correlations between each of the 20 refined values and self-reported frequency of everyday value-expressive behaviors, 1 and 2 years later. This enables us to observe whether value-behavior relations over time vary across the distribution of value importance, and whether relations between highly important values and future behavior are stronger than between less important values and future behavior.
Part 2 examines quantile correlations between two basic values, tradition and universalism, and self-reports of donations to charities, 1 and 2 years later. These values were chosen as they have been found to have the strongest positive correlations with donations to specific causes (i.e., tradition to religious organizations and universalism to development, environmental, and animal welfare organizations in Australia and the United States; Sneddon et al., 2020). Investigating charitable donation enables us to observe whether relations between highly important values and future behavior are stronger than between less important values and future behavior for relatively more costly (i.e., spending) behaviors.
Method
Participants and Procedures
This study was part of a larger longitudinal project, fielded across three waves in late 2017 (T1), 2018 (T2), and 2019 (T3). In each wave, respondents completed a number of small (5–10 minute) online survey modules over several weeks, designed to reduce common method bias and respondent fatigue (Hulland et al., 2018). This study included three modules: the first measuring personal values, the fourth measuring value-expressive behaviors, and the fifth measuring spending behaviors. All modules can be viewed at https://osf.io/w6uen/. This research was approved by The University of Western Australia Human Research Ethics Committee (RA/4/1/8647).
Sample characteristics for each longitudinal analysis in Part 1 were as follows: T1 values with T2 behaviors n = 2,761 (Mage = 51.1 years, SD = 14.6; 61% women), T2 values with T3 behaviors n = 3,135 (Mage = 53.0 years, SD = 14.1; 64% women), T1 values with T3 behaviors n = 2,518 (Mage = 53.0 years, SD = 14.0; 61% women). However, in Part 2, it was necessary to consider outliers, given that respondents were asked to enter dollar amounts for categories of expenditure selected from the Australian Bureau of Statistics (ABS) Household Expenditure Survey (ABS, 2017) and the Consumer Expenditure Survey (U.S. Bureau of Labor Statistics, 2017), including charitable donations (see Measures). A small number of outliers were identified in the charitable donation data, using the conservative 3σ-rule. 73 people (<2% of the Part 2 sample) were removed as potential outliers, as they reported donation amounts above $389 per month (Mdonations = 22.4, SD = 122). The final sample characteristics for each longitudinal analysis in Part 2 were as follows: T1 values with T2 donations n = 2,333 (Mage = 50.7 years, SD = 14.7; 61% women), T2 values with T3 donations n = 3,089 (Mage = 53.0 years, SD = 14.0; 64% women), T1 values with T3 donations n = 2,483 (Mage = 52.8 years, SD = 14.1; 61% women).
Sample sizes were sufficient for the analyses undertaken. Sample size calculations for quantile correlations, which depend on the chosen quantiles examined, the effect size, and distribution of the data are provided in Supplementary Materials, Appendix D.
Measures
Values
Personal values were measured using the Best-Worst Refined Values scale (BWVr; Lee et al., 2019). This measure asks respondents to choose the value that is most important and least important to them from subsets of 5 value items. 21 value subsets are presented, based on a Youden balanced incomplete block experimental design. Each value is seen 5 times, and each pair of values is seen together once across all subsets.
Respondent scores were obtained for each of the 20 refined value items using the square root of the ratio of most-to-least counts, following Lee and colleagues (2022), as this method produces more scale points (i.e., 20) than other scoring procedures (see Louviere et al., 2015 for a discussion of scoring best-worst scaling estimates). Scores for each of the 10 basic values were also calculated from the 20 refined values following previous studies (see Lee et al., 2019; Schwartz et al., 2012). Specifically, basic values scores were calculated as the mean of their respective constituent refined values. See Supplementary Materials, Appendix C, for values descriptive statistics and Supplementary Materials, Appendix E for reliability analysis.
A best-worst approach to measuring values has some advantages over rating scale methods (Lee et al., 2008). First, as values are generally viewed as desirable, respondents tend to rate most value items from somewhat important to very important (Schwartz & Bardi, 2001). Schwartz (1992) suggested ipsatizing value rating scale scores, by taking the mean of all value-items from each item score, to account for this response bias and produce a measure of relative value importance. In contrast, the BWVr was designed to measure relative value importance, through a series of forced choice comparisons (Lee et al., 2019). Second, as mentioned above, the scoring of best-worst choices can generate a more fine-grained scale, with greater variance across the distribution of scores, than values rating scales.
Behaviors
Value-expressive behaviors were measured using an expanded version of Schwartz and Butenko’s (2014) 85 item Everyday Behavior Questionnaire (EBQ). This instrument has been used successfully in five countries, including Australia (see Lee et al., 2019; Schwartz et al., 2017). Respondents report how often they engaged in each behavior during the past year, relative to their opportunity to do so. The 5-point response scale was labeled 0 (never), 1 (rarely—about a quarter of the times), 2 (sometimes—about half of the times), 3 (usually—more than half the times), and 4 (always). Six items were added from Lee and Colleagues (2019), to measure behaviors expressive of the universalism-animals value. Three to six behavior items that express each refined value were included in this survey. Behavioral indices expressive of each value were formed by averaging responses to these item sets to reduce effects of situation-specific constraints, as recommended by Schwartz and Butenko (2014). See Supplementary Materials, Appendix C, for descriptive statistics and Supplementary Materials, Appendix E, for reliability analysis.
Donation to Charity
Donation to charity was measured in reference to how participants spent their money on average. Participants were asked to report their average monthly spend in each of 11 broad categories from the Australian Bureau of Statistics Household Expenditure Survey (ABS, 2017) and the Consumer Expenditure Survey (U.S. Bureau of Labor Statistics, 2017). These include (1) Food and nonalcoholic beverages, (2) Alcohol, tobacco and gambling, (3) Housing including mortgage, rent and utilities, (4) Clothing and footwear, (5) Transportation, (6) Medical care, (7) Recreation, (8) Education, (9) Communication, (10) Personal care and (11) Donations to charity. We calculated the total spend and examined donations to charity as a proportion of total spend to account for differences in monthly expenditure.
Analytical Strategy
Quantile correlations were used to assess whether relations between personal values and behavior become stronger as value importance increases, following Lee and colleagues (2022). Quantile correlation (Choi & Shin, 2022) extends the quantile regression model, which estimates relations between variables at different quantiles (τ) of a dependent variable, where τ∈ (0, 1). Specific quantiles represent points of interest along a distribution. For instance, the .5 quantile (τ = 0.5) represents the median or 50th percentile of a distribution, whereas the .8 quantile (τ = 0.8), represents the 80th percentile of a distribution. The τ = .8 quantile coefficient estimates the relation between the independent and dependent variable at the 80th percentile of the distribution of the dependent variable. This enables relations between variables to be examined at specific quantiles along the distribution of a given variable (Koenker & Hallock, 2001).
Quantile correlation is an extension of this method, which estimates the geometric mean of two quantile regression slopes (i.e., x on y and y on x), at a given quantile (τ). It enables the examination of relations at specified points along the joint distribution of two variables. In other words, quantile correlation is a tail-dependence measure that examines whether relations between two variables are sensitive to the quantile at which they are observed (Choi & Shin, 2022).
Both quantile regression and quantile correlation model relations by differentially weighting residuals depending on the quantile(s) at which relations are estimated (see Koenker & Hallock, 2001). In this way, the entire data set and distribution of both variables is used in estimations at any given quantile. That is, estimates do not examine a subset of the data around a specified quantile or otherwise require splitting data. Rather, they represent slope estimates at each of the chosen quantiles, which can be compared with enable researchers to easily identify, quantify and visualize potential nonlinear patterns of relations across the distribution of a dependent variable (Cade & Noon, 2003). This is in contrast to polynomial regression, which also examines the possibility of nonlinear patterns of relations, but does so by estimating multiple polynomial terms in one equation that is still conditioned around the mean.
Part 1: Values and Value-Expressive Behaviors
To examine relations between values and behaviors, we first calculated Pearson correlations between each of the refined values and their respective value-expressive behaviors measured 1 and 2 years later, with bootstrapped 95% confidence intervals (1,000 resamples). We then used quantile correlation (Choi & Shin, 2022) to estimate correlations at specific levels along the distribution of value importance.
Given that continuous variables are recommended for quantile techniques, we added small uniformly distributed perturbations to the values scores (“jittering”) to increase their continuity, in accordance with the method of Machado and Silva (2005). The jittered scores were indistinguishable, on average, from the raw scores, with perturbations having a mean of zero and standard deviation equal to approximately .2 times the smallest distance between unique scores. The use of jittering to increase continuity proved effective, yielding results which were highly comparable with equivalent analysis of raw scores, but with a lower rate of estimation failure, in particular for values which were less strongly correlated with behavior. Supplementary Materials, Appendix G, presents quantile correlation results using raw values scores for comparison.
Correlations were estimated at nine quantiles (τ = .1, .2, .3 . . . .9; that is, at the 10th, 20th, 30th . . . 90th percentile). Bootstrapping (1,000 resamples) was used to estimate 95% confidence intervals around each quantile. The quantile correlation confidence intervals were adjusted in accordance with the method of Zou (2007), to account for potential asymmetry in sampling distributions. This enabled comparison between the value-behavior quantile correlation estimates and also between the quantile correlation estimates and the Pearson correlation estimate, to evaluate significant differences. We chose to compare the median quantile (τ = .5) with the other quantiles (τ = .1, .2, .3, .4, .6, .7, .8, .9), as a conservative test of whether relations were stronger at high points along the distribution and weaker at low points. We applied this strategy to examine relations between refined values and behaviors 1 (T1–T2; T2–T3) and 2 years apart (T1–T3).
Part 2: Values and Donation to Charity
Part 2 employed the same strategy as Part 1 to assess relations between basic values, specifically tradition and universalism, and the proportion of monthly spending donated to charities, to examine whether these relations differed along their distributions. As in Part 1, we examined relations between these values and donations, 1 (T1–T2; T2–T3) and 2 years apart (T1–T3). All data and syntax required to replicate our analyses are available at: https://osf.io/23kt4/.
Results
Part 1: Values and Value-Expressive Behaviors
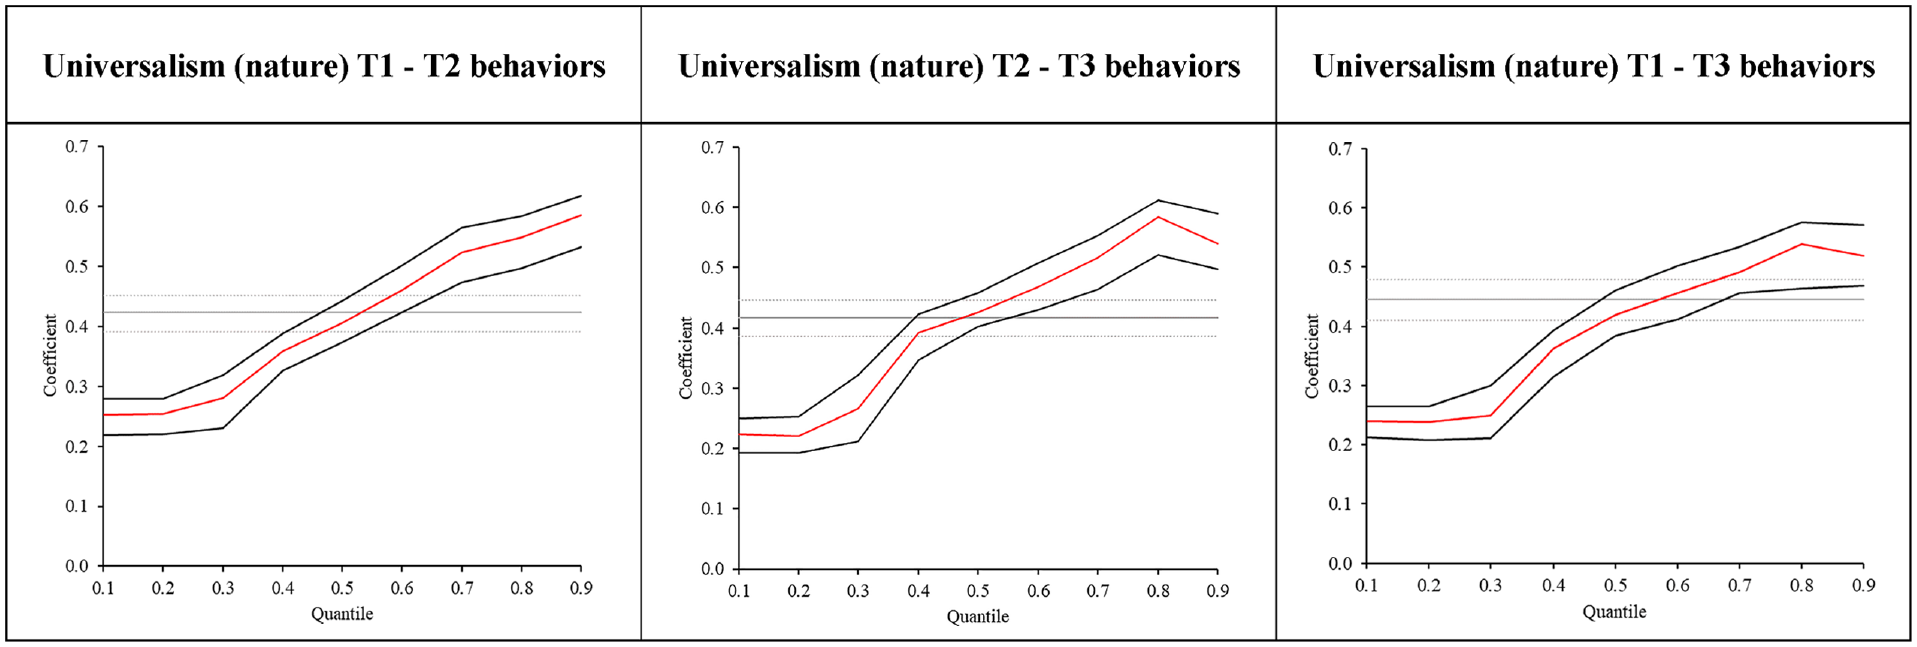
The graphs in Figure 1 show the Pearson and quantile correlations and their 95% confidence intervals for universalism (nature) values and their expressive behavior 1 (i.e., values at T1 and behaviors at T2 in column 1, and values at T2 and behaviors at T3 in column 2) and 2 years later (values at T1 and behaviors at T3 in column 3). Universalism (nature) was chosen, as it had one of the strongest Pearson correlations. The graphs in Figure 1 show the expected pattern of value-behavior relations over time, with significantly stronger correlations at the upper quantiles of the distribution than at lower quantiles, across all time periods. The Pearson correlation (the gray horizontal line) between universalism (nature) values at T1 and behaviors at T2 (r = .42), underestimated relations found at the higher quantiles of the distribution (e.g., at the 90th percentile
Value-Behavior Relations Over Time Across Distribution
A similar pattern was found across most values, with significantly stronger correlations at the upper quantile(s) of the distribution than at lower quantile(s) in 65% of the graphs across all time periods. The main exceptions were benevolence (caring and dependability), security (societal), conformity (rules), and hedonism. Furthermore, the Pearson correlation overestimated the relations at the lowest quantile in 63% of the graphs and underestimated the relations at the highest quantile in 30% of the graphs (see Supplementary Materials, Appendix A, for all graphs).
Following Lee and colleagues (2022), we also tested for differences between the median (τ =.5) quantile and other quantile correlation estimates for each value-behavior relation (see Table 1). For each value, the first row in Table 1 presents the correlations between T1 values and T2 behaviors, with row 2 and 3 presenting correlations between T2 values and T3 behaviors, and between T1 values and T3 behaviors, respectively. In Table 1, the green cells highlight correlations that are significantly stronger than at the median, and those in yellow highlight correlations that are significantly weaker than at the median. For example, relations between universalism (nature) at T1 and related behaviors at T2 show that the quantile correlations at the 70th, 80th, and 90th percentiles were significantly stronger, and those at the 10th, 20th, 30th, and 40th percentiles were significantly weaker, than at the median. A similar pattern was found at all three time points.
Quantile Correlations Between Values and Behaviors Over Time
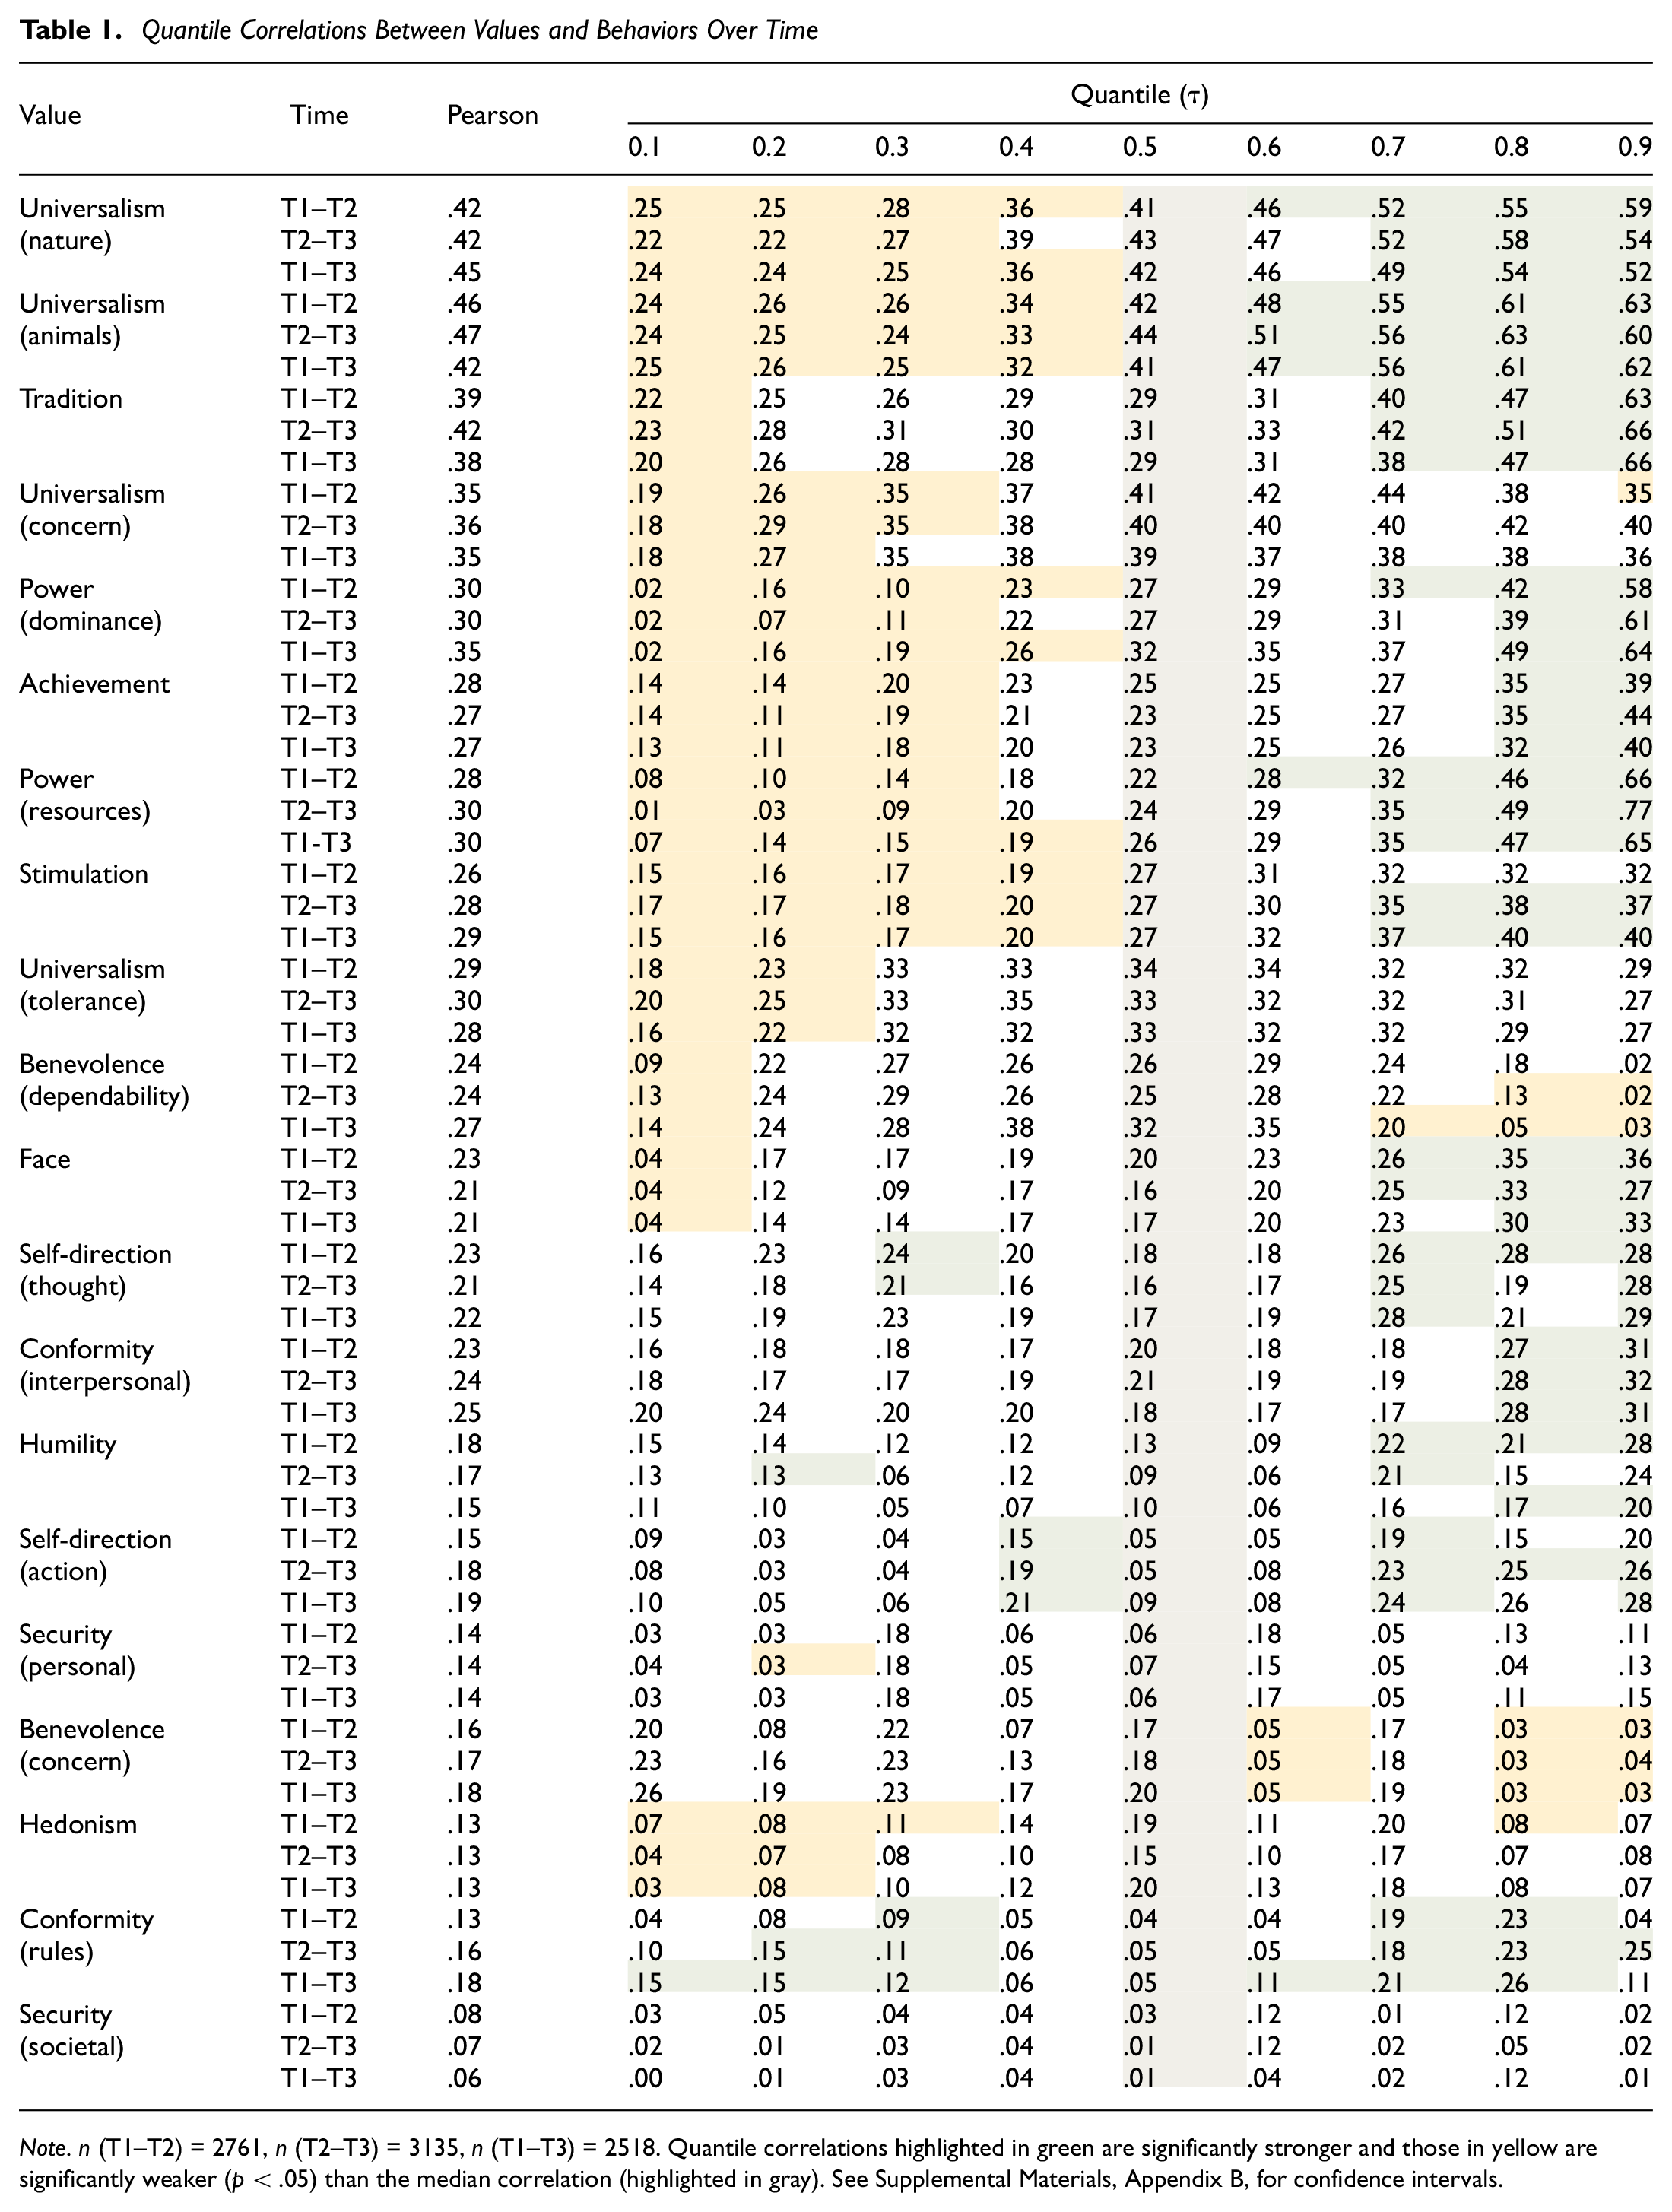
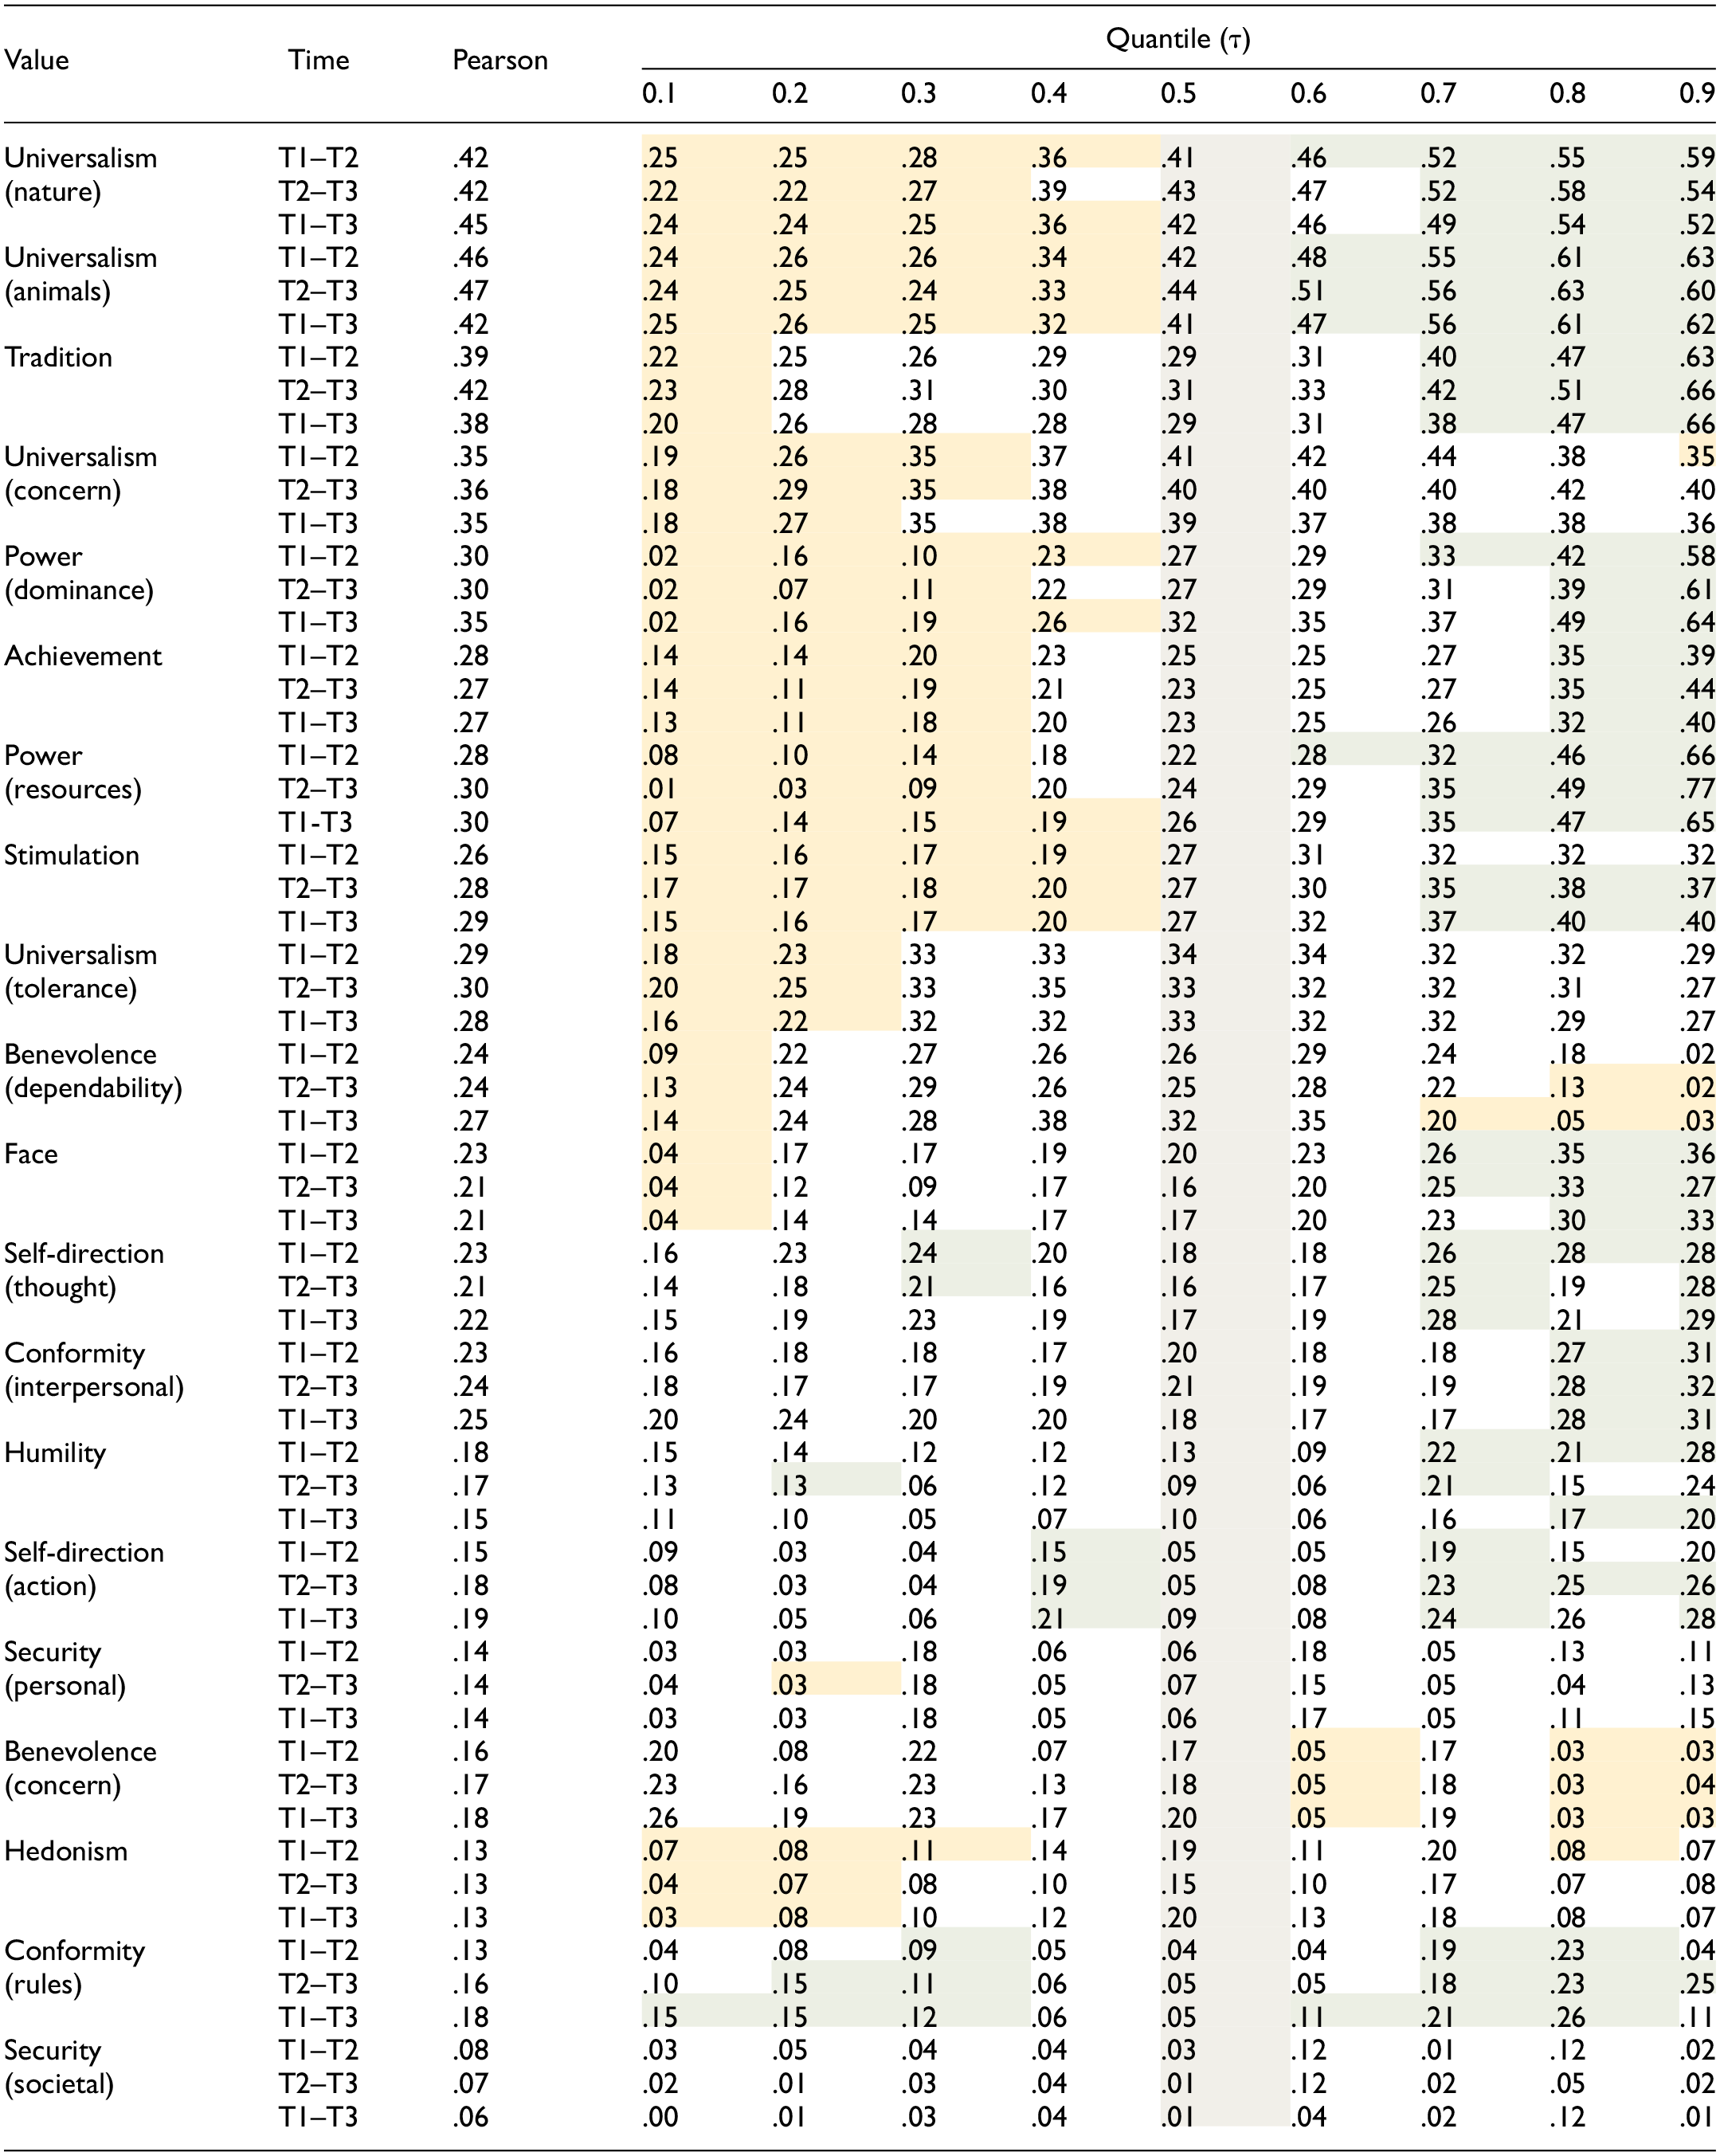
Note. n (T1–T2) = 2761, n (T2–T3) = 3135, n (T1–T3) = 2518. Quantile correlations highlighted in green are significantly stronger and those in yellow are significantly weaker (p < .05) than the median correlation (highlighted in gray). See Supplemental Materials, Appendix B, for confidence intervals.
Importantly, across value-behavior correlations in Table 1, those at the top quantile (i.e., 90th percentile) were significantly stronger than at the median in 50% (T1–T2) and 65% (T2–T3) of correlations 1 year apart, and 60% 2 years apart (T1–T3). Similarly, the top three quantile correlations were significantly stronger than at the median in 52% (T1–T2) and 57% (T2–T3) of correlations 1 year apart, and 52% 2 years apart (T1–T3). Moreover, the bottom quantile correlations (i.e., 10th percentile) were significantly weaker than at the median in 60% of correlations 1 year apart (60% T1–T2; 60% T2–T3), and in 60% of correlations 2 years apart (T1–T3). Similarly, the bottom three quantile correlations were significantly weaker than at the median in 48% (T1–T2) and 48% (T2–T3) of correlations 1 year apart, and 45% 2 years apart (T1–T3). Taken together, these results demonstrate the substantial gain in information afforded by examining value-behavior relations over time along different quantiles of the distribution.
For comparison, ordinary least squares (OLS) polynomial regression analyses between the value-behavior pairs were conducted to examine whether this would be effective in identifying nonlinear patterns of relations (see Supplementary Materials, Appendix F). Tables S15–S17 show that polynomial regression indicated few nonlinear relations (p < .05); 2 of 20 between T1 values and T2 behaviors, 1 of 20 between T2 values and T3 behaviors, and 2 of 20 between T1 values and T3 behaviors. This highlights the potential of quantile correlation analysis to not only provide a detailed picture of relations across a distribution, but also to uncover relations which would otherwise be masked by focusing solely on examining the conditional mean function.
Part 2: Basic Values and Donations to Charity
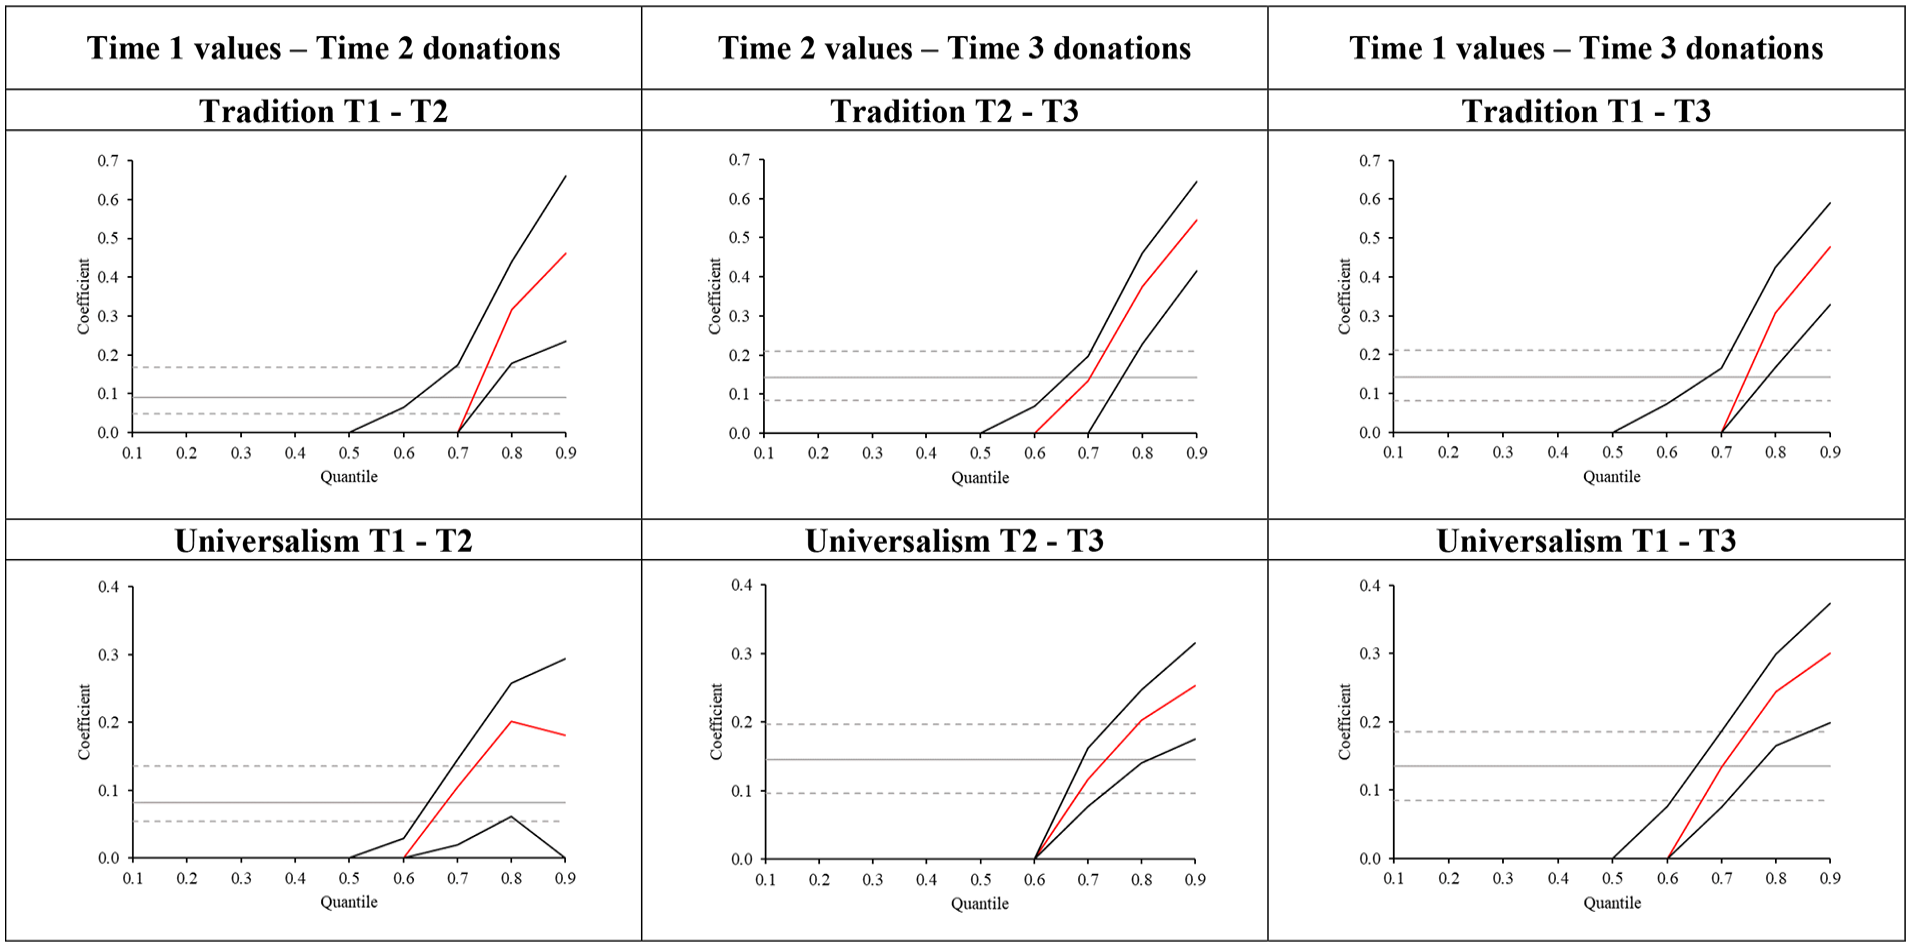
Figure 2 depicts Pearson and quantile correlations between the values of tradition or universalism and donations, 1 and 2 years apart. In each graph, the quantile correlation between tradition values and donations is estimated to be zero up to and including the 50th percentile, with correlations becoming stronger at the upper end of the distributions. For example, the plot of relations between tradition values (T1) and donations (T3), 2 years apart, show that the Pearson correlation significantly underestimates correlations at the 90th percentile (
Value-Donation Relations Over Time Across Distribution
As in Part 1, we also tested whether there were differences between the median (τ =.5) and the other quantile correlation estimates for each value-donation behavior relation (see Table 2). In Table 2, the green cells show correlations that are significantly stronger than at the median. For both tradition and universalism values, all of the top two quantile correlations were significantly stronger than at the median, and for universalism, the quantile correlations at the 70th percentile were also all significantly stronger than at the median. In contrast, there were no correlations observed in the lower half of the distribution.
Quantile Correlations Between Specific Values and Donation to Charity Over Time
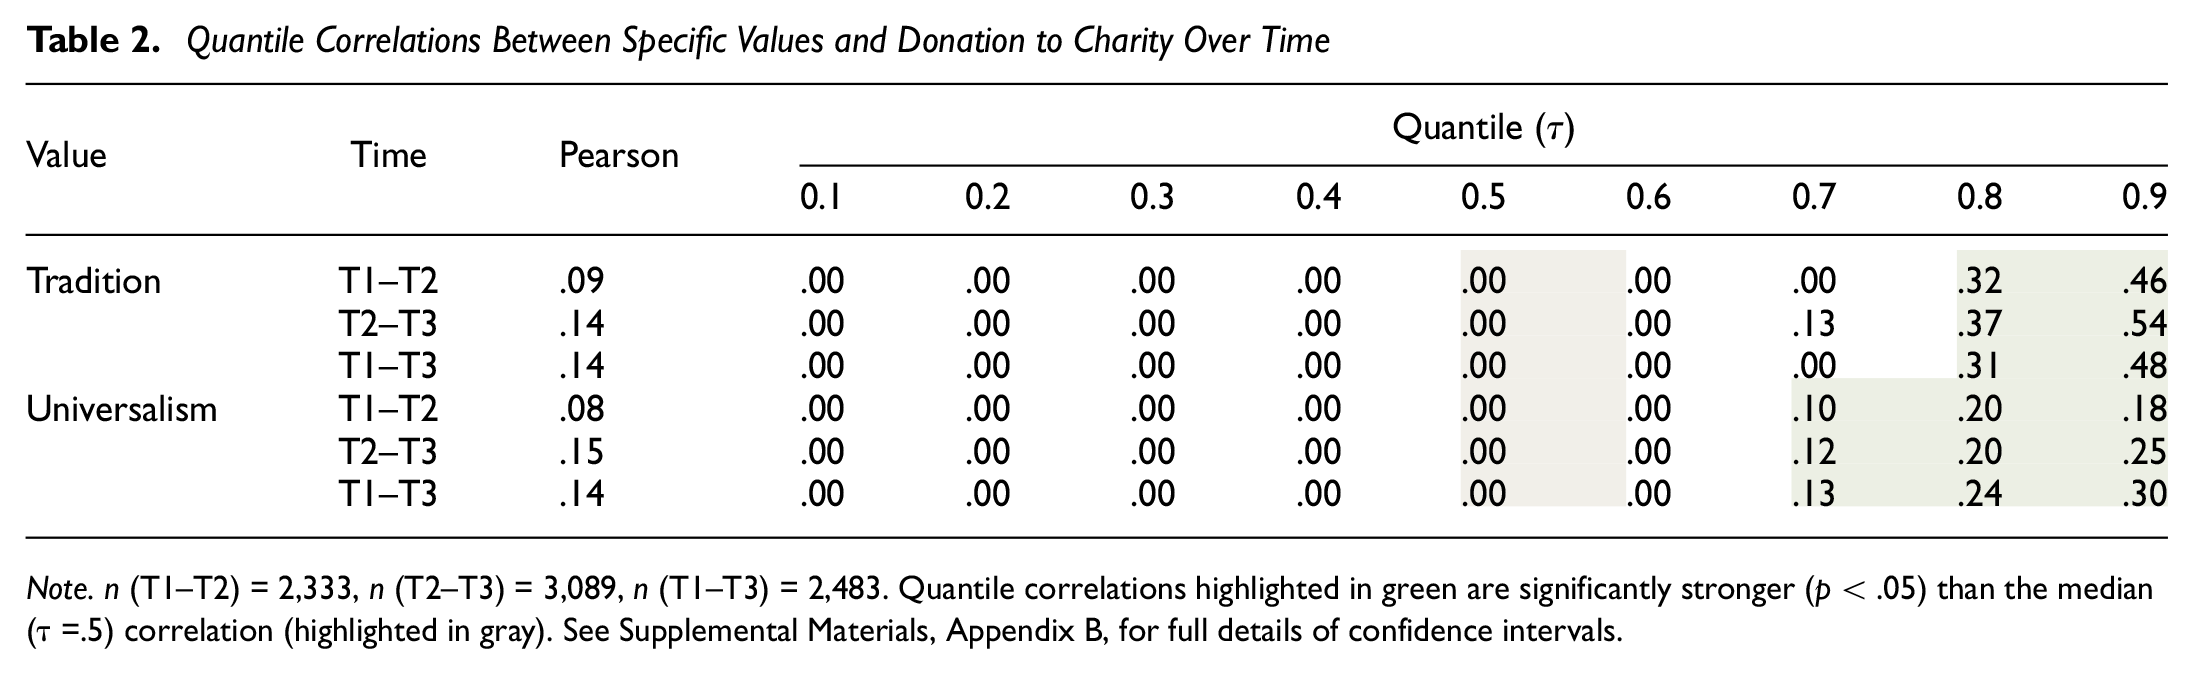
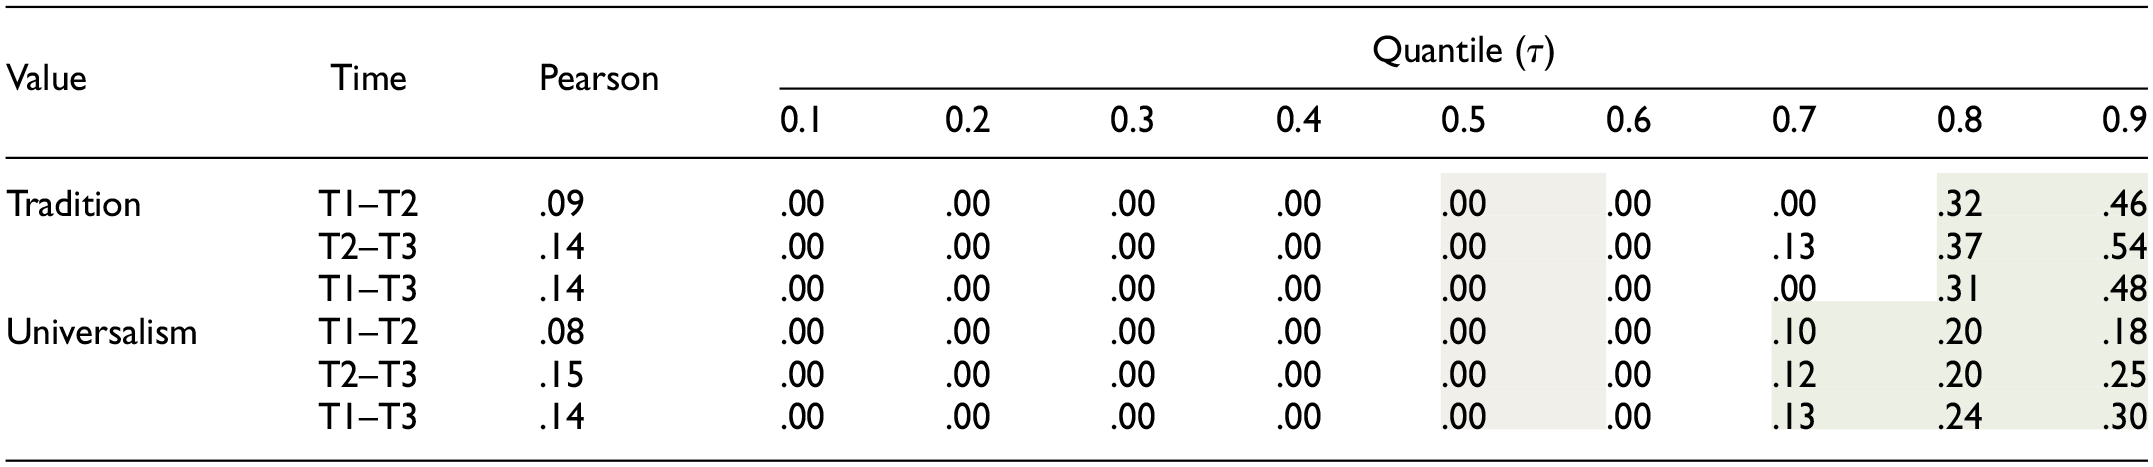
Note. n (T1–T2) = 2,333, n (T2–T3) = 3,089, n (T1–T3) = 2,483. Quantile correlations highlighted in green are significantly stronger (p < .05) than the median (τ =.5) correlation (highlighted in gray). See Supplemental Materials, Appendix B, for full details of confidence intervals.
We also conducted OLS polynomial regression analyses, as a point of comparison (see Supplementary Materials, Appendix F). Table S18 shows that polynomial regression did not identify nonlinear relations (p < .05), or indeed any relations, between tradition or universalism values and donations across any timepoints.
Discussion
Results show that strongly held values are consistently expressed in behavior over time. Value-behavior relations tend to be stronger at the upper end of the distribution of value importance than the lower end, or even the median, when behaviors are measured 1 and 2 years later. This extends the finding that values are generally more strongly related to behaviors when they are more important than when they are less important (Lee et al., 2022). The pattern was particularly striking for costly behaviors, where values only predicted later monetary donations to charity above median levels of value importance.
Findings imply that people to whom a value is highly important are more likely to exhibit associated behavior in the future, but not simply that people to whom a value is of low importance are less likely. Rather, when a value is of low importance, it is less closely related to behavior, or not related at all. Put differently, a one unit change in an important value is likely to be associated with a substantial shift in future behavior, whereas a one unit change in a value of low importance may be associated with only a minimal shift in behavior, or no change at all. This makes theoretical sense given that values reflect motivational goals which are organized in hierarchies within individuals (Schwartz, 2012). If behavior is shaped by trade-offs between competing values priorities (Schwartz, 1996), it is logical that more important values have commensurately stronger relations to behavior than less important values.
These results have important implications for values research. First, they help clarify why previous research may have found weak value-behavior relations using approaches focused on relations at the mean (e.g., Schwartz & Butenko, 2014). Furthermore, previous studies of value-behavior relations in adults only examined very short time periods (e.g., weeks to months; Schwartz et al., 2010), whereas the present findings demonstrate that relations can persist over an extended period when values are important. That is, values matter for future behavior if they are highly prioritized, but values that are less important generally have weaker relations with future behavior.
In the case of charitable donations, relevant values were not only more strongly correlated at the upper end of the distribution, but these relations were also predictively stable over time, providing evidence that the pattern of relations discussed above also holds true for costly behaviors. Value-donation relations did appear to be slightly stronger when considering donations at T3; however, this may be attributed to an increase in donations associated with the catastrophic bushfires in Australia around this time (see Boer et al., 2020; Claughton, 2021). Polling found that 53% of Australians donated to a bushfire appeal and 59% gave more than they would normally (Paul, 2020). This may help to explain slightly stronger relations between values and T3 donations, reflecting the activation of universalism and tradition values (see Schwartz, 2010).
The findings also have important practical implications. Significant investment is made toward the prediction of behavior by marketing and polling organizations 1 , and focusing on identifying values that are most important to a target audience should offer stronger prediction of value-expressive behavior. For example, if charities wish to target potential donors based on their values, it makes the most sense to invest in marketing appealing to people who tend to hold the relevant values with high priority. Furthermore, findings also indicate that values data can be used to predict behavior well into the future, without having to invest resources in re-measuring.
Limitations and Future Directions
There are several limitations to our findings. First, there were some exceptions to the general pattern of value-behavior relations. Benevolence values (dependability and caring) tended to relate to behavior more weakly at the upper and lower ends of the distribution, compared with the median. This reflects Lee and colleagues’ (2022) findings, who argued this may be because benevolence values and behaviors are highly normative. Normative pressures encourage people to behave consistently, no matter their individual value priorities. This potential explanation is supported by the fact that benevolence values and behaviors had the highest mean levels in our sample (see Supplementary Materials, Appendix C). Moreover, benevolence also tends to be at the top of the value hierarchy across cultures (Schwartz & Bardi, 2001).
Second, values and behavior data were obtained using self-reports. The limitations of self-report, especially for behavior, have been widely discussed (e.g., Paulhus & Vazire, 2007). The EBQ measures behavior during the past year, which avoids some issues associated with measuring behavioral intentions. Furthermore, an earlier version of the EBQ yielded meaningful relations with values even when behaviors were rated by acquaintances (Bardi & Schwartz, 2003). Nonetheless, future studies could consider alternative behavior measures, such as recording actual expenditure.
Third, while the data collected were longitudinal, statistical analyses conducted were not tailored to panel data. Rather, quantile correlations were estimated between individuals’ values and behavior at later timepoints in discrete analyses. Thus, panel data over the full 2-year period could not be incorporated into a single model with panel structure specifications, nor could other individual difference variables be incorporated into the model to evaluate their potential effects on value-behavior relations. While the r package rqpd (Koenker & Bache, 2011) enables fitting fixed-effects and correlated-random-effects quantile regression models using panel data, this was considered inappropriate in the present study as rqpd models estimate relations at levels of an outcome variable. This would estimate quantile relations along the distribution of the behavior, rather than the distribution of values or the overall distribution, which was the target in this article.
Conclusion
The present work found that highly important values predict behavior well, even 2 years later. The strength of relations between values and future behaviors tend to vary systematically along their distribution. Our results strengthen previous findings that highly important values provide a much stronger guide for behavior than mean-centered analyses would indicate, by finding that they are predictively stable over time. Hence, highly important values have strong effects both concurrently and into the future.
Supplemental Material
sj-docx-1-spp-10.1177_19485506241233646 – Supplemental material for How Far Into the Future Can Values Predict Behavior? It Depends on Value Importance
Supplemental material, sj-docx-1-spp-10.1177_19485506241233646 for How Far Into the Future Can Values Predict Behavior? It Depends on Value Importance by Joshua Lake, Joanne Sneddon, Anat Bardi and Julie Lee in Social Psychological and Personality Science
Footnotes
Handling Editor: Peter Rentfrow.
Declaration of Conflicting Interests
The author(s) declared no potential conflicts of interest with respect to the research, authorship, and/or publication of this article.
Funding
The author(s) disclosed receipt of the following financial support for the research, authorship, and/or publication of this article: This research was funded by an Australian Research Council Linkage Grant in partnership with Pureprofile (Project LP150100434). J.L. was supported by an Australian Government Research Training Program Scholarship and University Postgraduate Award.
Supplemental Material
Supplemental material is available online with this article.
Notes
Author Biographies
References
Supplementary Material
Please find the following supplemental material available below.
For Open Access articles published under a Creative Commons License, all supplemental material carries the same license as the article it is associated with.
For non-Open Access articles published, all supplemental material carries a non-exclusive license, and permission requests for re-use of supplemental material or any part of supplemental material shall be sent directly to the copyright owner as specified in the copyright notice associated with the article.