
Abstract
As economic inequality grows, more people stand to benefit from wealth redistribution. Yet in many countries, increasing inequality has not produced growing support for redistribution, and people often appear to vote against their economic interest. Here we suggest that two cognitive tendencies contribute to these paradoxical voting patterns. First, people gauge their income through social comparison, and those comparisons are usually made to similar others. Second, people are insensitive to large numbers, which leads them to underestimate the gap between themselves and the very wealthy. These two tendencies can help explain why subjective income is normally distributed (therefore most people think they are middle class) and partly explain why many people who would benefit from redistribution oppose it. We support our model’s assumptions using survey data, a controlled experiment, and agent-based modeling. Our model sheds light on the cognitive barriers to reducing inequality.
Global economic inequality has risen steeply over the last century (Piketty, 2014). Today, the wealthiest 1% of the people in the world own approximately 50% of the world’s wealth, whereas the poorest 70% own less than US$10,000 (Suisse, 2018). This rising inequality not only has serious public health consequences (Frank, 2013; Freund & Morris, 2006; Marmot & Sapolsky, 2014; Pickett & Wilkinson, 2015), but it also represents a puzzle of human decision making. Rational choice models suggest that as income inequality grows, economic interest should motivate more people to support income redistribution. When the mean income surpasses the median income, the median voter, who controls the majority, has an interest in reducing inequality (Meltzer & Richard, 1981). Yet roughly equal numbers of voters tend to support and oppose policies aimed at reducing inequality, such as taxes and social welfare benefits, even as inequality rises (Gallup, 2018; Gelman et al., 2010; Page & Jacobs, 2009; Saad, 2011; Shapiro & Young, 1989). These attitudes about redistribution have been remarkably stable, even as inequality has risen steeply (Piketty, 2014). The counterintuitive division over the value of redistribution implies that inequality will continue to rise, even in democratic societies.
Many past studies have focused on the role of institutional and social factors that drive rising inequality. For example, voting behavior is sensitive to campaign finance laws, technological changes, and gerrymandering (Bonica et al., 2013; Evans & Tilley, 2012; Overton, 2000). Voters may also be motivated by social and moral values (Skitka & Bauman, 2008) and symbolic concerns about power and status (Pratto et al., 1994). These social and institutional factors may plausibly influence rising inequality, and it is not our goal to dismiss these influences. We instead propose that, above and beyond these factors, voters’ subjective understanding of how their own income relates to others’ incomes may play a crucial role in rising inequality. The goal of this article is to articulate a model of how well-established cognitive tendencies contribute to an aversion to wealth redistribution, ultimately perpetuating income inequality.
Two Factors May Influence Perceptions of Subjective Income
Our explanation of people’s paradoxical division over redistributing income focuses on the cognitive processes involved in gauging the value of redistribution. Our model is premised on the idea that people do not just rely on their actual income to gauge their support for redistribution, mostly because people find it too difficult to estimate how fiscal policies such as tax cuts and federal benefits will affect them given their income (Bartels, 2005; Mettler, 2011). Instead, people appear to form opinions about fiscal policies using their subjective perception of their income (henceforth named “subjective income”)—determined primarily based on their perceived status compared to others in society (Brown-Iannuzzi et al., 2015). Even though many factors shape peoples’ attitudes toward redistribution, subjective income may have a particularly strong influence on these attitudes because it provides an accessible heuristic for gauging self-interest. However, subjective perceptions of income can also be distorted by cognitive tendencies related to social comparison and insensitivity to large numbers.
Social comparisons to similar others
The first cognitive tendency that we focus on arises from social comparison. People calculate their subjective income by comparing themselves to others, but not just anyone. Many past studies show that people select similar others as comparison targets, even in random samples (Wood, 1989). Of course, the pool of possible social comparisons in real life is not random. High-status earners may often have more visible wealth than low-status earners (Hicks et al., 2016; Lewis-Beck et al., 2008), and people are often residentially and socially segregated (Iceland & Weinberg, 2002). Yet the latter of these factors should actually increase people’s tendency to compare to similar others. This evidence suggests that poorer people will compare to comparison targets who are also poor, and as a result, they will feel wealthier than they truly are (Festinger, 1954). Conversely, wealthy people will compare to other wealthy people, leading them to feel less wealthy than they truly are. The net effect is that subjective income should be more compressed toward the “average” level than actual income. Consistent with this assumption, most people rate themselves as “middle class” on surveys (Brown-Iannuzzi et al., 2015).
Insensitivity to large numbers
The second cognitive tendency relates to how people interpret numerical differences. Past studies have shown that people tend to be insensitive to large numbers (Kahneman & Tversky, 1979). A $10,000 difference seems large when it is between people who earn $50,000 and $60,000 but seems inconsequential when it is the difference between people earning $500,000 and $510,000. As numerical values become larger, people become proportionally less sensitive to their actual magnitude. Income distributions are positively skewed, with income inequality primarily driven by the highest earners. However, insensitivity to large numbers implies that large incomes in the tail end of the income distribution will have diminishing marginal effects on subjective income. Insensitivity to large numbers predicts that subjective income distributions should be normally distributed even in highly unequal societies, with roughly equal numbers of people feeling poorer and wealthier than average.
In sum, our model holds that people derive their attitudes toward redistribution based on their subjective income—rather than solely on their actual income—and that subjective income is susceptible to cognitive tendencies associated with selective social comparisons and insensitivity to large numbers.
Model Assumptions
This model makes three assumptions. Assumption 1 holds that subjective income should predict people’s attitudes toward redistribution above and beyond objective income. Assumption 2, derived from the social comparison effect, holds that people who have the same level of actual income should report lower subjective income when they compare to wealthier individuals compared to when they compare to poorer individuals. Assumption 3, derived from the insensitivity effect, holds that someone’s subjective income has a logarithmic relationship with the difference between their actual wealth and someone else’s actual wealth—such that growing income gaps result in marginal impacts on subjective income.
If these assumptions are true, then subjective income will almost always be normally distributed, even when real income distributions are highly skewed. Insensitivity to large numbers and social comparison will lead most people to feel “average,” with half of the population feeling below average and half feeling above average. And if attitudes toward redistribution are influenced strongly by perceived income, this implies that the population will remain evenly divided over the value of redistribution as inequality grows.
Current Research
We evaluate our model with a multimethod set of analyses. Studies 1 and 2 use empirical data to test our model’s assumptions. Study 1 analyzes a nationally representative survey of Americans to test whether people’s subjective perceptions of their income can predict attitudes about redistribution above and beyond their actual income (Assumption 1). Study 2 tests whether such insensitivity is magnified when people compare to similar others (Assumption 2) and whether social comparisons to others’ incomes show insensitivity to large income disparities (Assumption 3). Finally, Study 3 is an agent-based simulation that integrates our empirical findings into a computational model to test whether our model reproduces persistent voting divisions around redistribution as inequality grows. Code and data from all studies are available at our project page (https://osf.io/5afgu/?view_only=e90ea3d4ba5f4b71891cca9624632269).
Study 1: Nationally Representative Survey
Our first study used a large representative survey of Americans to test whether people’s reports of their subjective income could predict their attitudes toward redistribution above and beyond their actual income.
Method
Sampling
Study 1 sampled 53,474 individuals from the general social survey, which has been conducted across several waves since 1974. Our data set included individuals from the 1974 wave to the 2010 wave. The general social survey includes a wide range of questions, including questions concerning respondents’ own wealth and respondents’ ideological attitudes. Not all respondents answer all questions, which is why degrees of freedom vary depending on the exact statistical test. For all analyses, our sample size gave us >99% power to detect small effects (d = .20).
Measures
Objective income
We measured respondents’ self-reported actual incomes using the “realinc” item, which assessed “family income in constant dollars,” converting all values to 1986 dollars to adjust for inflation.
Subjective income
We measured subjective income using the item “finrela,” which asked respondents: “compared with American families in general, would you say your family income is (1) ‘far below average,' (2) ‘below average,' (3) ‘average,' (4) ‘above average,' or (5) ‘far above average.'”
Attitudes about wealth redistribution
Several items from different waves of the general social survey measured respondents’ attitudes about wealth redistribution. For our primary analyses, we identified 9 items that assessed participants’ attitudes toward wealth redistribution (e.g., “The rich should pay a greater share of taxes compared with the poor”). Because there was high inter-item correlation, we created a composite of these items (α = .81). Our supplemental materials (Table S1) describe the phrasing and measurement for each of these items. Table S1 also shows how each item relates to self-reported income and subjective income. We conducted these tests using the same regression model—containing both income and subjective income—that we describe below.
Analysis Plan
We estimated the distributions of subjective and self-reported income, predicting that subjective income would be normally distributed, whereas actual income would have a positive skew. We next tested for whether subjective income predicted participants’ attitudes toward redistribution, with the prediction that participants’ subjective income would predict attitudes about redistribution over and above actual income. To control for nestedness in the data, we used cross-classified multilevel modeling in a maximum likelihood regression, with intercepts randomly varying across states and year. We note that results are substantively similar regardless of whether or not the random effect of year is included.
Results
Actual and subjective income were correlated at r = .34, p < .001, suggesting they were associated but not redundant.
Distribution of Subjective and Objective Income
Participants’ subjective income ratings had a normal distribution (γ1 = −0.11), whereas their self-reported income showed a large positive skew (γ1 = 7.17; see Figure 1). The positive skew for actual income reflects inequality, as a minority of individuals earn most of the income. The normal distribution of subjective income indicates that most people report an “average” level of income, with roughly equal numbers feeling above and below average. This suggests that many people who actually have far less than the average American still considered themselves to have “average” wealth. Subjective and actual income were measured on very different scales in this study, but we consider it unlikely that the scale differences can account for the fact that the actual income distribution was approximately 70 times more skewed than the subjective income distribution.
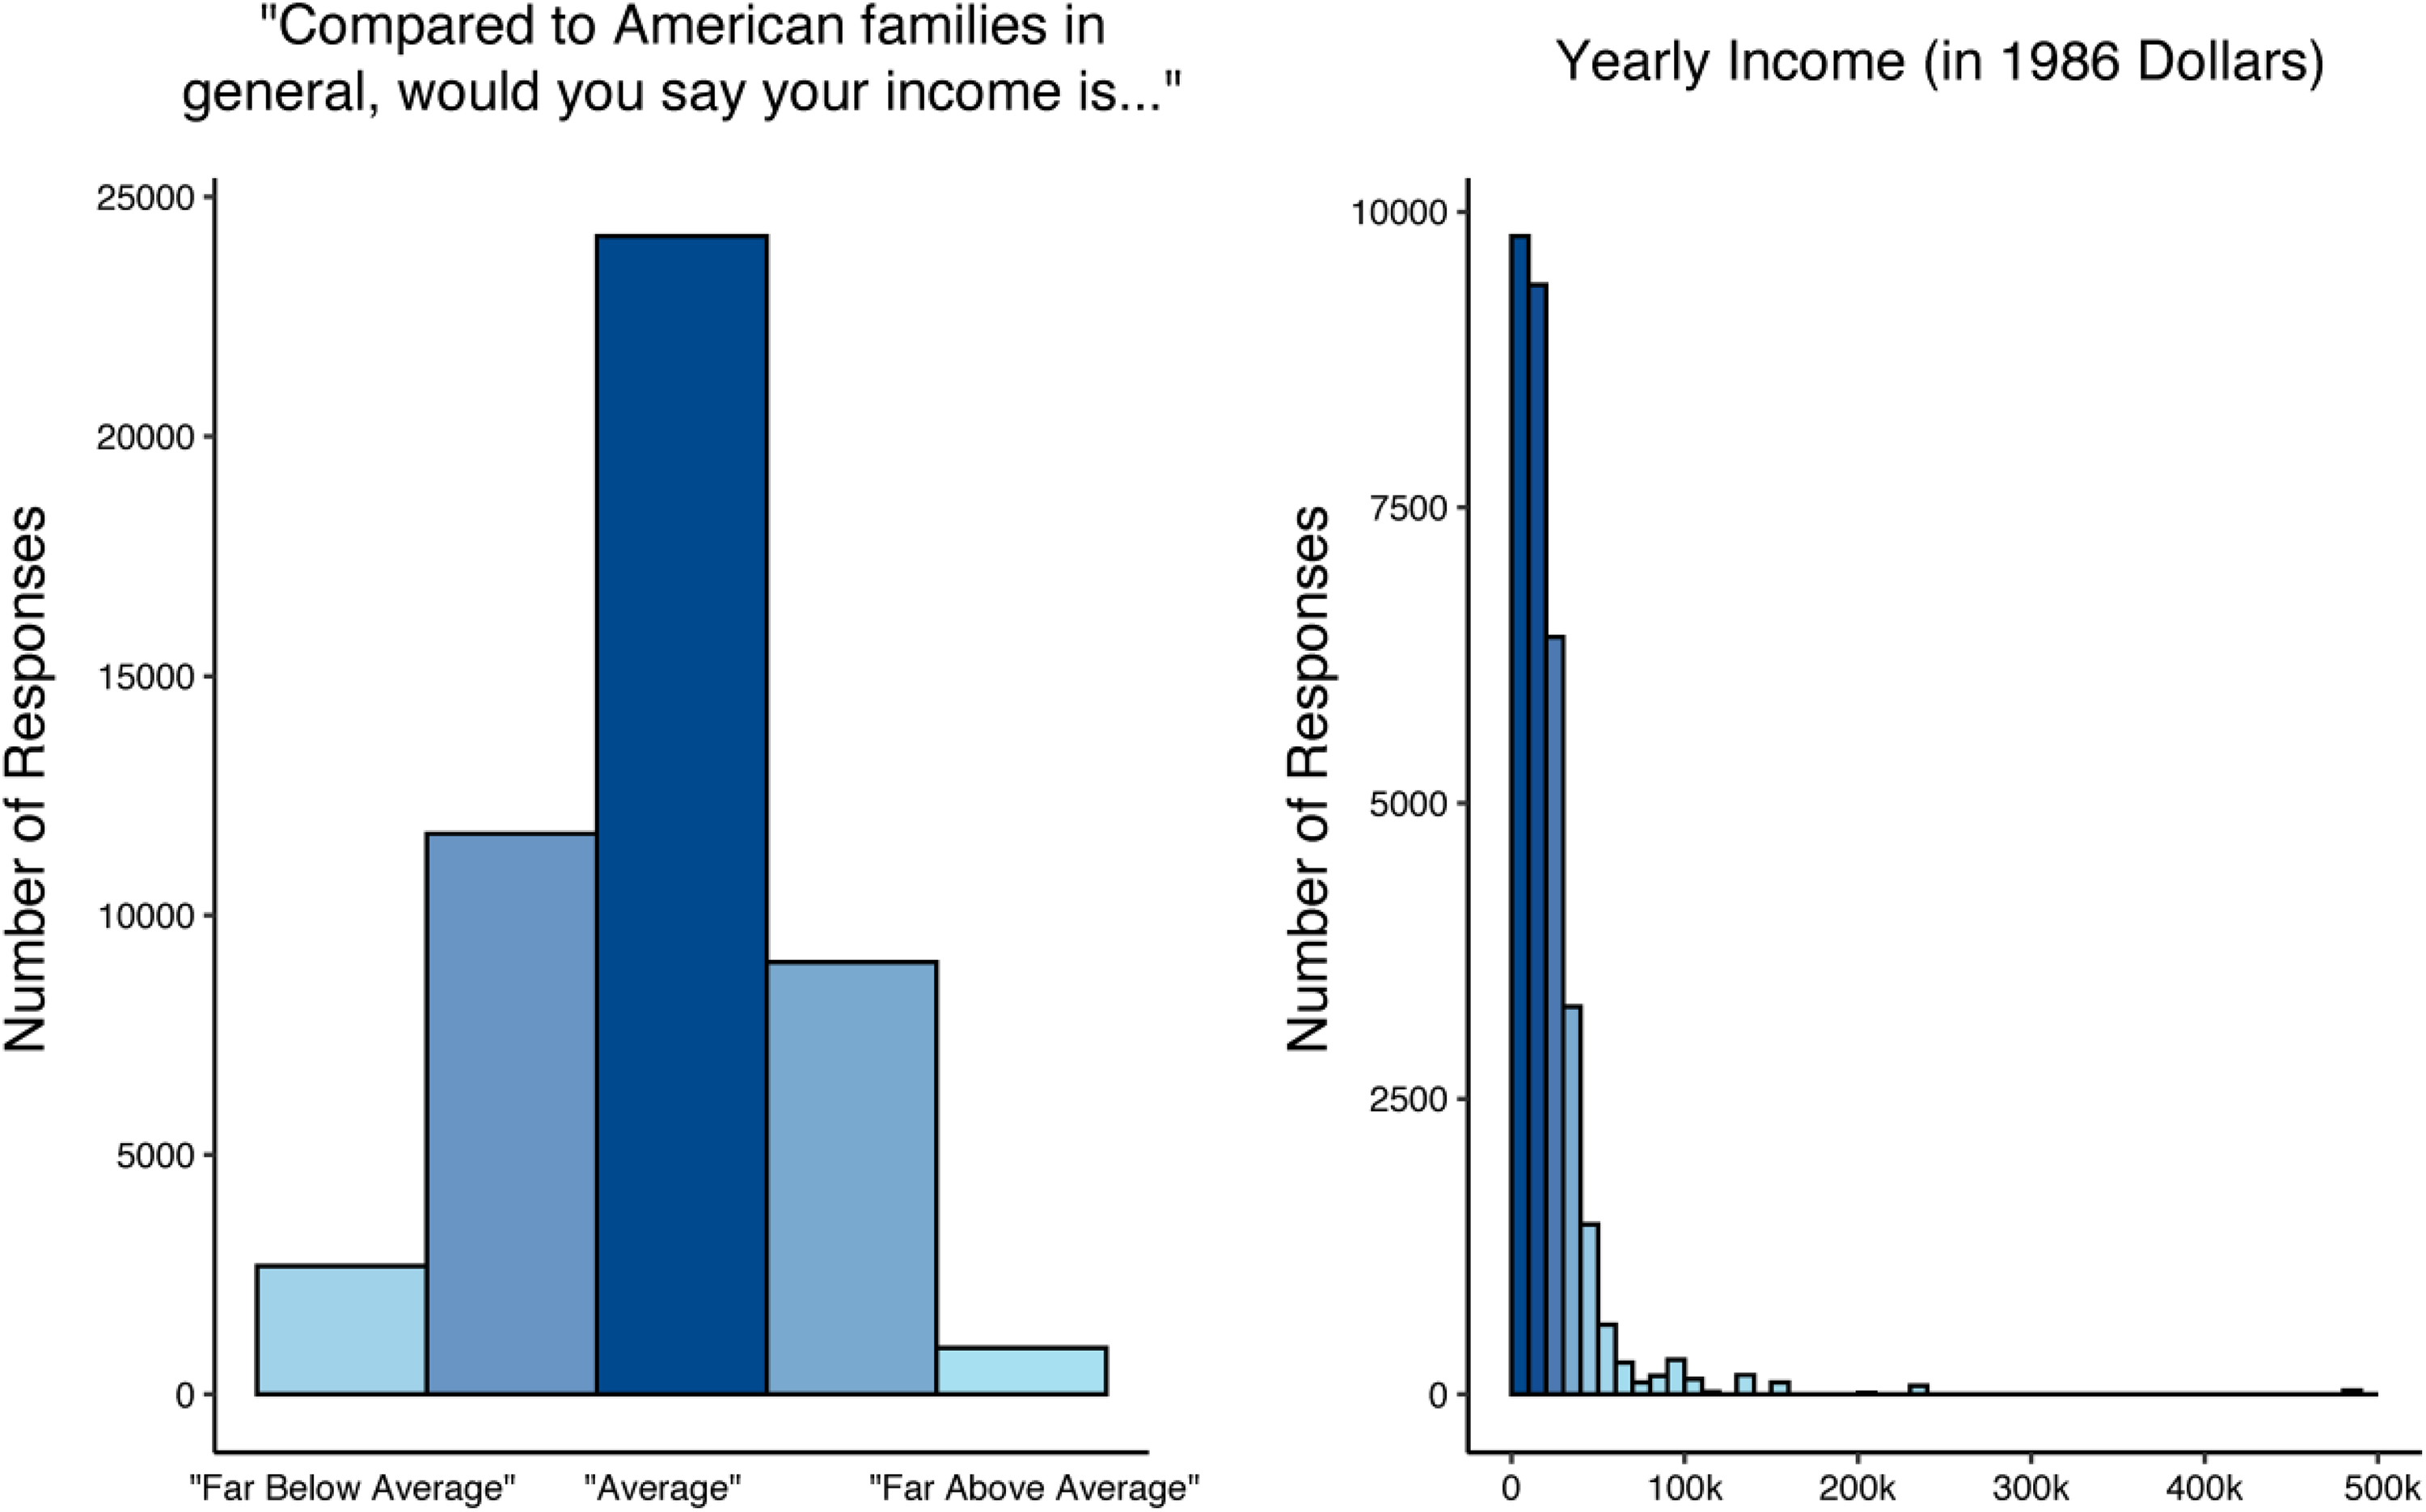
Left: The distribution of subjective income. When people evaluate their subjective standing when comparing their income to the income of other households, the distribution is normal. Right: The distribution of actual income, in 1986 USD. Note. Real income has a highly skewed positive distribution.
Does Subjective Income Predict Attitudes Toward Redistribution?
Consistent with Assumption 1, individuals with higher subjective income were significantly less supportive of redistribution, β = −.14, t = −22.16, p < .001, after controlling for actual income. Unsurprisingly, individuals with a higher actual income were also less supportive of redistribution, β = −.10, t = −15.07, p < .001. These results suggest that estimates of subjective income can predict attitudes toward redistribution above and beyond people’s actual yearly income. By extension, reliance on subjective income may turn people against redistribution who would benefit from it because in a normal distribution, roughly half of the population always feels wealthier than average.
Discussion
In a large sample of representative Americans, people’s subjective income robustly predicted their attitudes about redistribution. We also found that subjective income was normally distributed, even though people’s incomes had a large skew. These different distributions are consistent with our assumption that cognitive tendencies distort people’s subjective perceptions of their own income. Study 2 examined whether social comparison and numerical insensitivity play a role in this distortion.
Study 2: Experiment
Study 1 confirmed that people’s subjective perceptions of their income play a significant role in their attitudes toward wealth redistribution. Study 2 used an experiment on a representative sample of Americans to test whether these subjective perceptions are distorted by the cognitive tendencies highlighted in our model. Specifically, we tested whether comparison to similar others (Assumption 2) and insensitivity to large numbers (Assumption 3) each contributed to the distortion of subjective income judgments.
Sampling
Study 2 sampled 350 individuals (87 men, 263 women; M age = 43.2, SD age = 15.14) from a Qualtrics panel that recruited a sample that was representative of the United States on political affiliation, household income, and ethnicity. We based this sample size off a pilot study (n = 99). Power analyses based off the effect sizes from this pilot suggested that a sample of 350 would give us 86% power to detect our hypothesized effect of social comparisons (Assumption 2) and >99% power to detect our hypothesized effect of insensitivity (Assumption 3). Three participants did not complete the experiment and were not included in the analyses.
Procedure and Measures
Participants read that they had been assigned a small bonus of a randomly assigned point value and that they would be viewing several other participants’ bonus amounts throughout the study. In reality, participants were randomly assigned one of three values as their bonus: a “low” bonus (20,346), a “medium” bonus (33,875), or a “high” bonus (60,452). These numbers represented the first tertile, median, and third tertile value of a distribution we sampled from the real distribution of U.S. income. The distribution of bonuses in this study was therefore consistent with the real distribution of income in the United States.
After reading the opening instructions, participants then viewed the bonuses of other individuals who were ostensibly taking the study over 50 trials and rated how they felt about the value of their bonus “right now” after viewing each value, using a 1–100 scale anchored at 1 (very low) and 100 (very high). Participants in the “nonclustered social comparison” condition viewed all values from our 50-value wealth distribution over the course of the study. This meant that participants assigned 20,346 points mostly viewed comparison targets getting more points than they were, whereas participants assigned 60,452 points mostly viewed comparison targets getting less than they were. In contrast, for participants assigned to the “clustered social comparison” condition, 80% of their comparison targets were sampled from their own tertile, meaning that they were comparing to individuals getting approximately the same number of points that they were (in this condition, approximately half of comparison targets were getting more points and roughly half were getting less points). The remaining 20% of comparison targets were sampled randomly from the remaining values in the distribution.
After viewing all 50 comparison targets and rating their feelings about their bonus assignment 50 times, participants rated their feelings about their bonus one last time, without any visible comparison. Participants then completed demographics and the study ended.
Analysis Plan
We tested Assumptions 2 and 3 in this experiment, which both concerned how individuals’ subjective income would change based on their social comparisons. Assumption 2 held that participants’ final estimates of subjective income would track their actual income when they were able to compare to a representative sample of the population, but not when they compared to comparison targets who had been assigned similar bonuses. We predicted that participants’ subjective income would be significantly less tied to their actual income in the clustered condition than in the nonclustered condition. We tested this hypothesis with an analysis of variance (ANOVA), using slicing and a Holm–Bonferroni p-value correction to test, in our post hoc tests, whether income condition mattered more for participants in the nonclustered condition than participants in the clustered condition.
Assumption 3 held that people would report lower subjective income after comparisons where they had a lower bonus than their comparison target and higher subjective income after comparisons where they had a higher bonus. However, the point discrepancy between them and their target would show diminishing marginal effects on their subjective income ratings, reflecting a logarithmic relationship. We tested Assumption 3 by entering participants’ within-person centered raw comparison discrepancies and log-transformed discrepancies together in a multilevel regression that nested 17,350 observations within 347 participants. We predicted that log-transformed point differences would explain participants’ subjective income judgments above and beyond the raw point difference. Log-transformed point values are particularly useful for testing diminishing marginal effects because the exponentiation involved in log-transformation creates a plateau for y values as x values grow larger.
We standardized the subjective income and within-person centered point discrepancy variables before fitting our regression models. Standardized variables are not universally considered a measure of effect size in multilevel modeling because multilevel models’ effect sizes can be decomposed across Level 1 and Level 2 sources of variation. But standardization still has the advantage of setting variables to the same scale, so that β coefficients can be more easily interpreted. Furthermore, since our predictors were centered within person, our fixed effects estimates did not conflate Level 1 and Level 2 variances.
Results
Social Comparisons
In support of Assumption 2, a 3 × 2 ANOVA showed a significant Income × Clustering interaction, F(2, 342) = 4.34, p = .01,
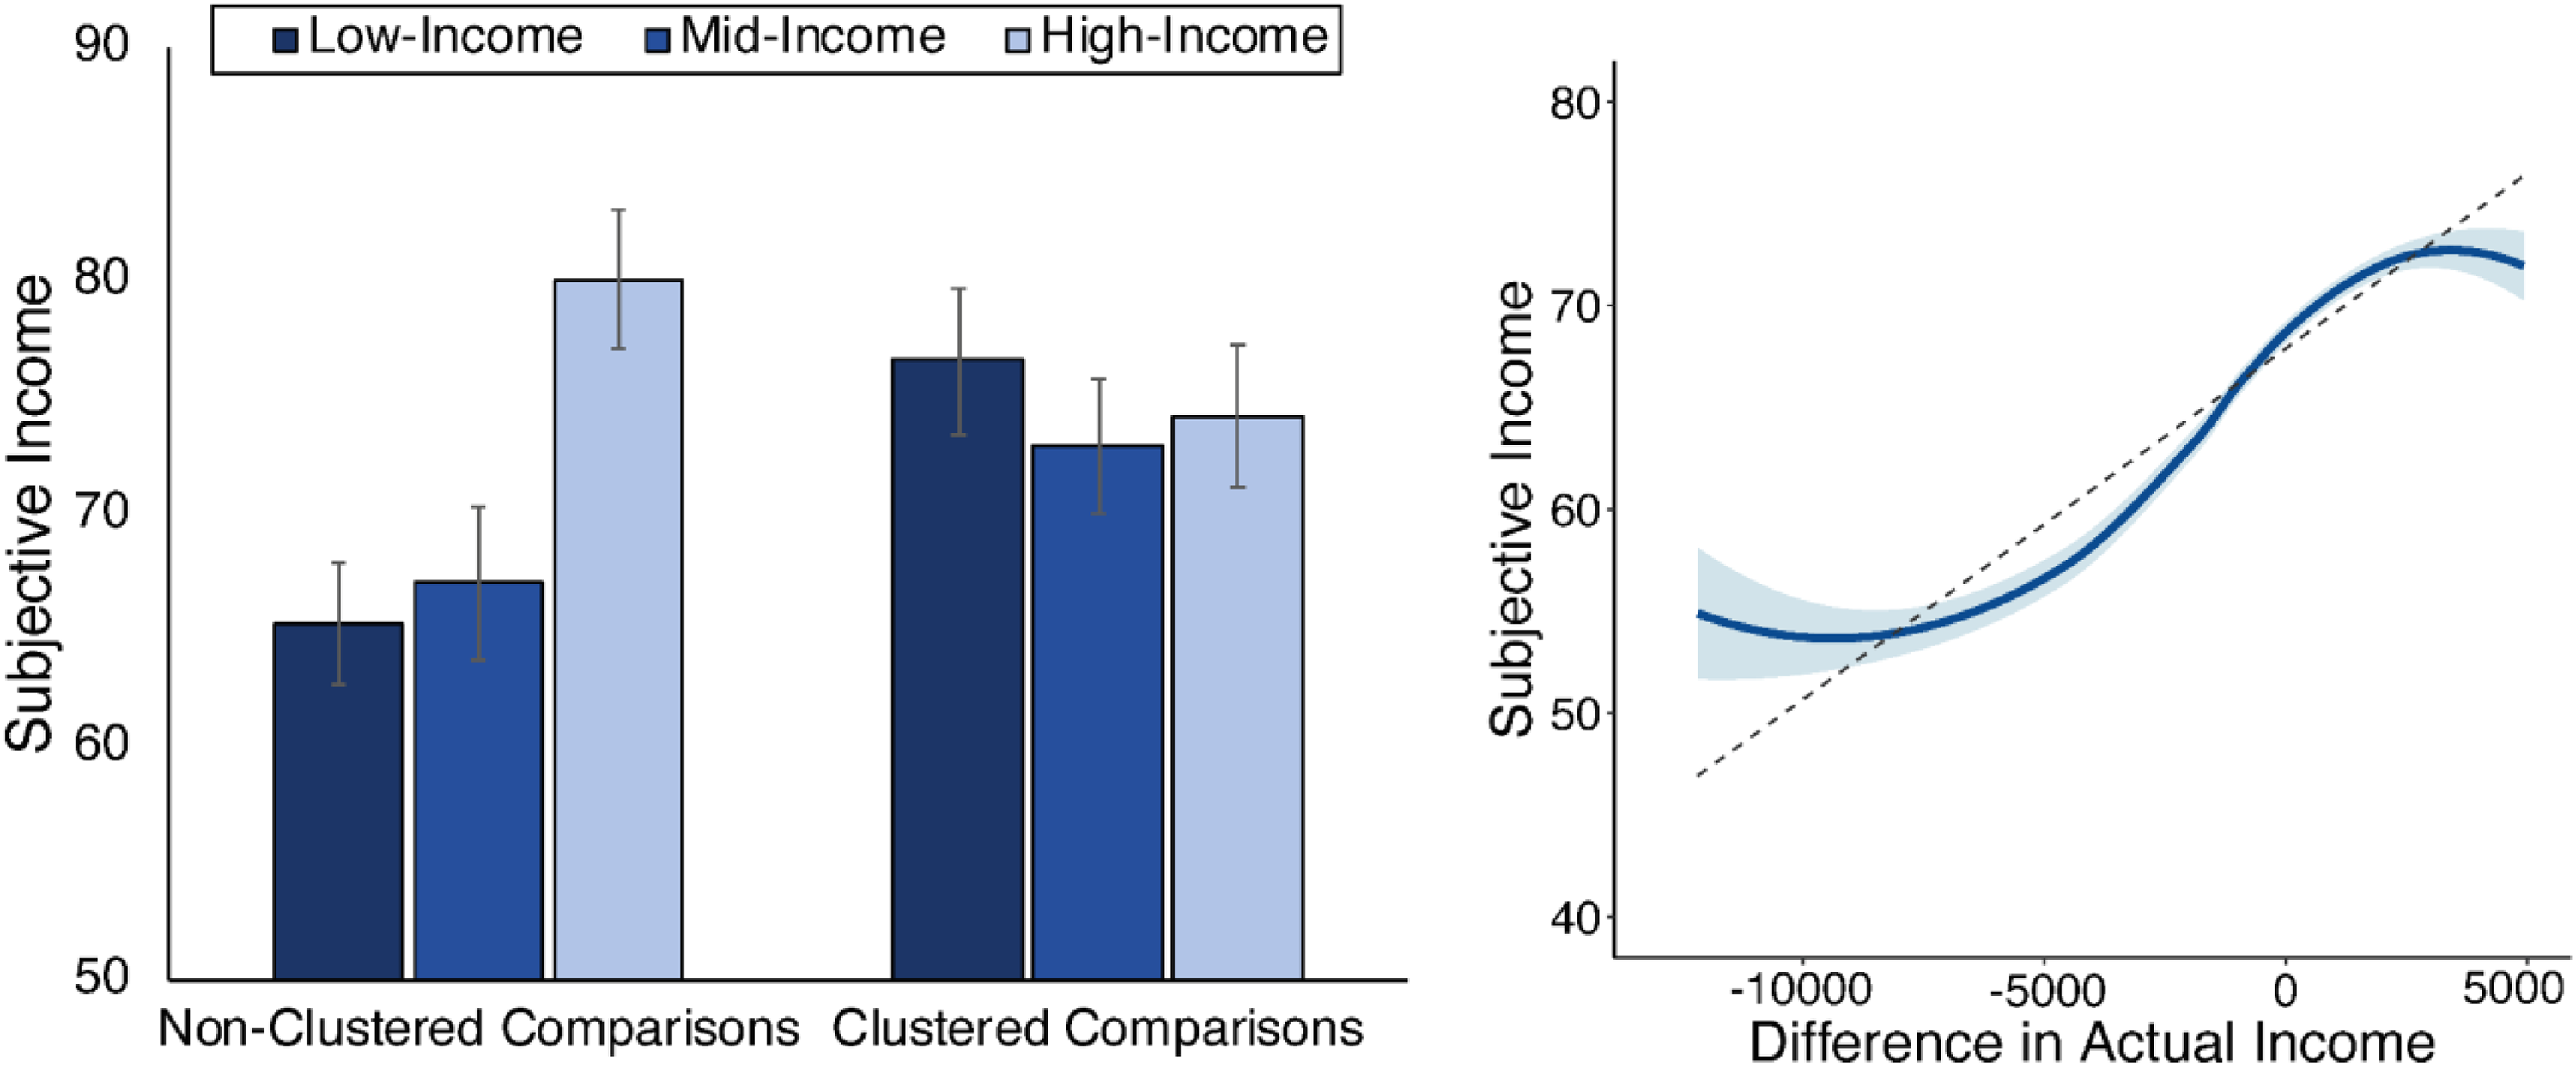
Left: Participants’ subjective income as a function of their income level and their social comparison condition. When participants compared themselves to similar others, they felt similarly about their income regardless of how many points they had. When participants compared themselves to a representative sample of the population, those with more points felt like they had more income. Right: A loess curve showing how participants’ subjective income as a function of the difference between their income and their comparison target’s income. Participants felt like they had more income if they made more than their comparison target and poorer if they made less, but their subjective income was insensitive to the magnitude of this gap. Note. The dashed gray line plots the linear relationship between point difference and subjective income. The error bars (left panel) and shaded region (right panel) represents standard error.
Insensitivity
In support of Assumption 3, log-transformed point discrepancies were significantly more predictive of subjective income, β = .14, SE = .01, t(1,702) = 18.80, p < .001, 95% CI [.12, .15], than linear point discrepancies, β = .05, SE = .01, t(1,701) = 6.62, p < .001, 95% CI [.03, .06]. Participants’ estimates of subjective income were therefore sensitive to whether they had more or less than others but insensitive to the degree of difference as the discrepancies grew large (see Figure 2, right).
Discussion
Study 2 offered support for the effects of selective social comparison and insensitivity in people’s estimation of their subjective income. When people compared to a representative sample of others, their subjective perceptions were calibrated to their actual incomes. But comparing to others who were similar made participants feel intermediate, regardless of their actual incomes. Moreover, participants were insensitive to large gaps between their incomes and other people’s incomes. Study 3 used computational methods to test whether these processes could account for divisive attitudes about redistribution in the face of growing inequality.
Study 3: Agent-Based Modeling
Studies 1 and 2 suggest that subjective income is normally distributed and is used as a proximal basis for attitudes toward redistribution. Subjective income is shaped by social comparisons, is affected by the degree of similarity to comparison targets, and is insensitive to large discrepancies. Study 3 used an agent-based model to test whether these findings could reproduce realistic patterns of voting on wealth redistribution (Jackson et al., 2017). Below, we summarize the model verbally. We then explain the parameters of our model.
Method
Plain-Text Description of Model
Imagine that you live in a society where everyone has some level of income. Income in this society is not equally distributed, but the society is democratic and individual people can vote on policies to reduce (or increase) income inequality. When people vote on this income inequality legislation, they use real information about their money (their actual income) and their feelings about their income (their subjective income) as a guide. People who feel wealthy tend to oppose redistribution, whereas people who feel poor tend to favor redistribution.
People determine their subjective income by comparing their actual income to other people in the society, which they do once before each round of voting. Several conditions determine exactly how this comparison happens. In the clustered and insensitive condition, people are especially likely to choose comparison targets that have levels of income similar to their own. Furthermore, people can always tell whether they have more or less than a comparison target, but they are not sensitive to the magnitude of the difference between their wealth and the comparison target’s income—especially when the difference is very large. In the insensitive-only condition, people are equally likely to compare their income to anyone in the society, but they are not sensitive to the magnitude of the gap between their income and the income of their comparison target. In the clustered-only condition, people make comparisons with others like them, but they can accurately evaluate how much more or less they have compared to their comparison target. In the no clustering and no insensitivity condition, people are equally likely to compare their income to anyone in society, and they are sensitive to the magnitude of income gaps. In all conditions, voting behavior is not solely influenced by attitudes toward redistribution but is also shaped by previous voting decisions. Multiple other unknown factors influence voting in addition to subjective income, which we model by adding randomness to voting decisions through a noise parameter.
This process of comparing and voting repeats 500 times, with inequality fluctuating over time depending on how people vote. If most people vote against redistribution, inequality goes up; if people vote for it, inequality goes down. Given these assumptions, the model estimates how clustering and insensitivity to large numbers shape how inequality changes over time.
Symbolic Description of the Model
In this model, samples of simulated agents were given an “income” each round i, which was raised to the power of k such that higher values of k would produce more skewed distributions of income and greater inequality over time. At the end of each round, agents could vote on whether to raise or lower k, simulating democratic voting on policies that would increase or decrease redistribution. If more than 50% of agents favored redistribution, k was reduced by some policy factor p, which we varied in sensitivity analyses. If fewer than 50% of agents favored redistribution, then k was increased by a factor of p. This meant that—if agents voted consistently with their objective personal interest—k would quickly drop to zero and agents would receive a uniform income. How unequal could income become before agents voted to equalize the distribution?
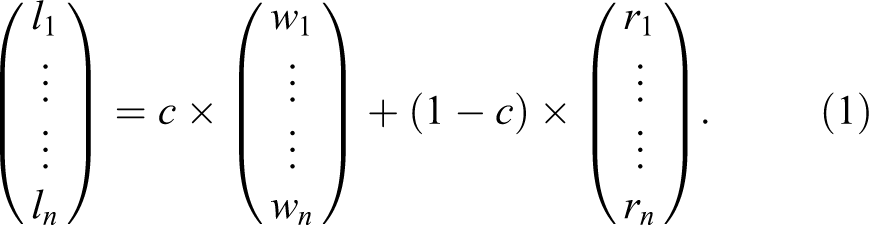
Participants’ attitudes toward redistribution—and their voting tendencies—were based on an equal weighting of their actual income and their perceptions of subjective income, which they gauged by repeatedly comparing their income to the income of other agents. These social comparisons gave us the opportunity to vary two key parameters from our behavioral studies. First, we varied whether agents’ social comparisons were random or clustered through a parameter c. We multiplied c through a vector w of location coordinates that ascended based on agents’ wealth, multiplied c-1 through a vector r of randomly ascending location coordinates and then summed w and r to produce agents’ location coordinates in any given round. Higher values of c translated to more clustering based on income (see Equation 1).
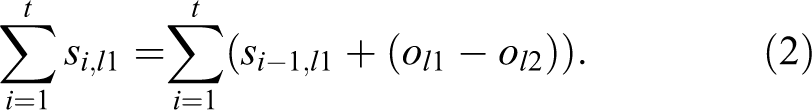
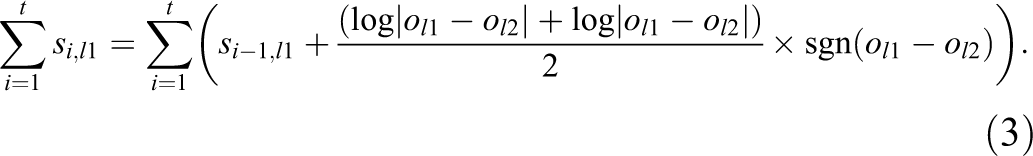
Second, we varied whether agents could accurately gauge the differences between their own income and the income of others. In non-insensitivity conditions, agents adjusted their wealth based on the raw difference between their income and the income of their comparison target (see Equation 2), whereas in the insensitivity conditions, participants adjusted their subjective income based on the log-transformed difference between their own income and the income of their comparison target (see Equation 3). Therefore, if agents had $10,000 less than their comparison target, their subjective income would decrease by the log transformation of $10,000. This transformation was the same transformation that we applied to point differences in our experimental study to model fluctuations in real people’s subjective income as a function of social comparisons (see Table 1 for all parameters).
List of the Model’s Key Parameters.
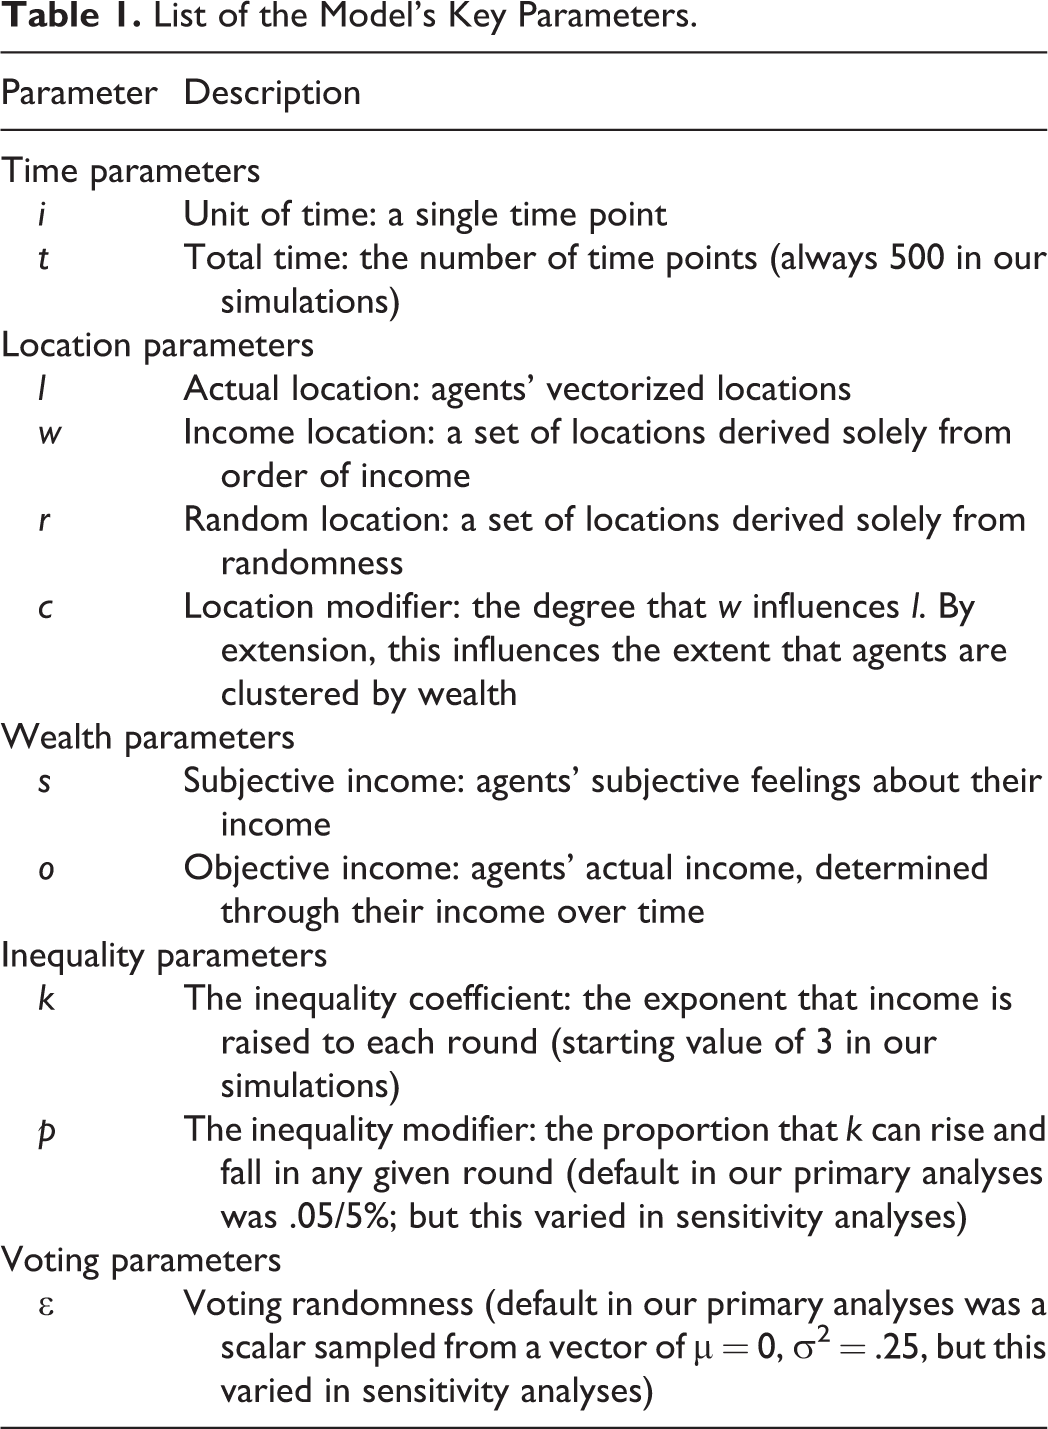
Equations 1 –3. Equation 1 depicts how agents are sorted into their location vector l. Equation 2 depicts how agents compare “raw” income. Equation 3 depicts how agents compare wealth with insensitivity to large numbers.
Results
We ran this model 40 times across four conditions. In runs 1–10, agents made clustered social comparisons (c = .95) and showing insensitivity to large numbers. In the remaining runs, we removed either clustered social comparisons (runs 11–20) insensitivity to large numbers (runs 21–30) or both tendencies (runs 31–40) from the model.
Impact of Biases on Attitudes Toward Redistribution
As predicted, clustered social comparisons and insensitivity to large numbers both impacted the progression of inequality. Runs where agents possessed both biases concluded with an average Gini coefficient of .99, indicating extremely high inequality. By contrast, runs in which agents were not segregated ended with an average Gini of .42, runs where agents were not insensitive to large income differences ended with an average Gini of .34, and runs where agents were neither clustered nor insensitive to large income differences ended with an average Gini of .34. In sum, agents with insensitivity to large numbers and clustered social comparisons allowed inequality to rise rapidly without voting for redistribution, but agents without these tendencies curbed inequality before it could rise beyond moderate levels, consistent with rational economic self-interest. Figure 3 displays both Gini and the inequality coefficient k over time across conditions. As illustrated in Figure 3, clustering and insensitivity both contributed to rising inequality, but the effect of clustering was larger than the effect of insensitivity to large income gaps. This difference suggests an important asymmetry in how these cognitive tendencies contribute to attitudes about redistribution, perhaps because comparing to similar others prevents considering large income differences in the first place.
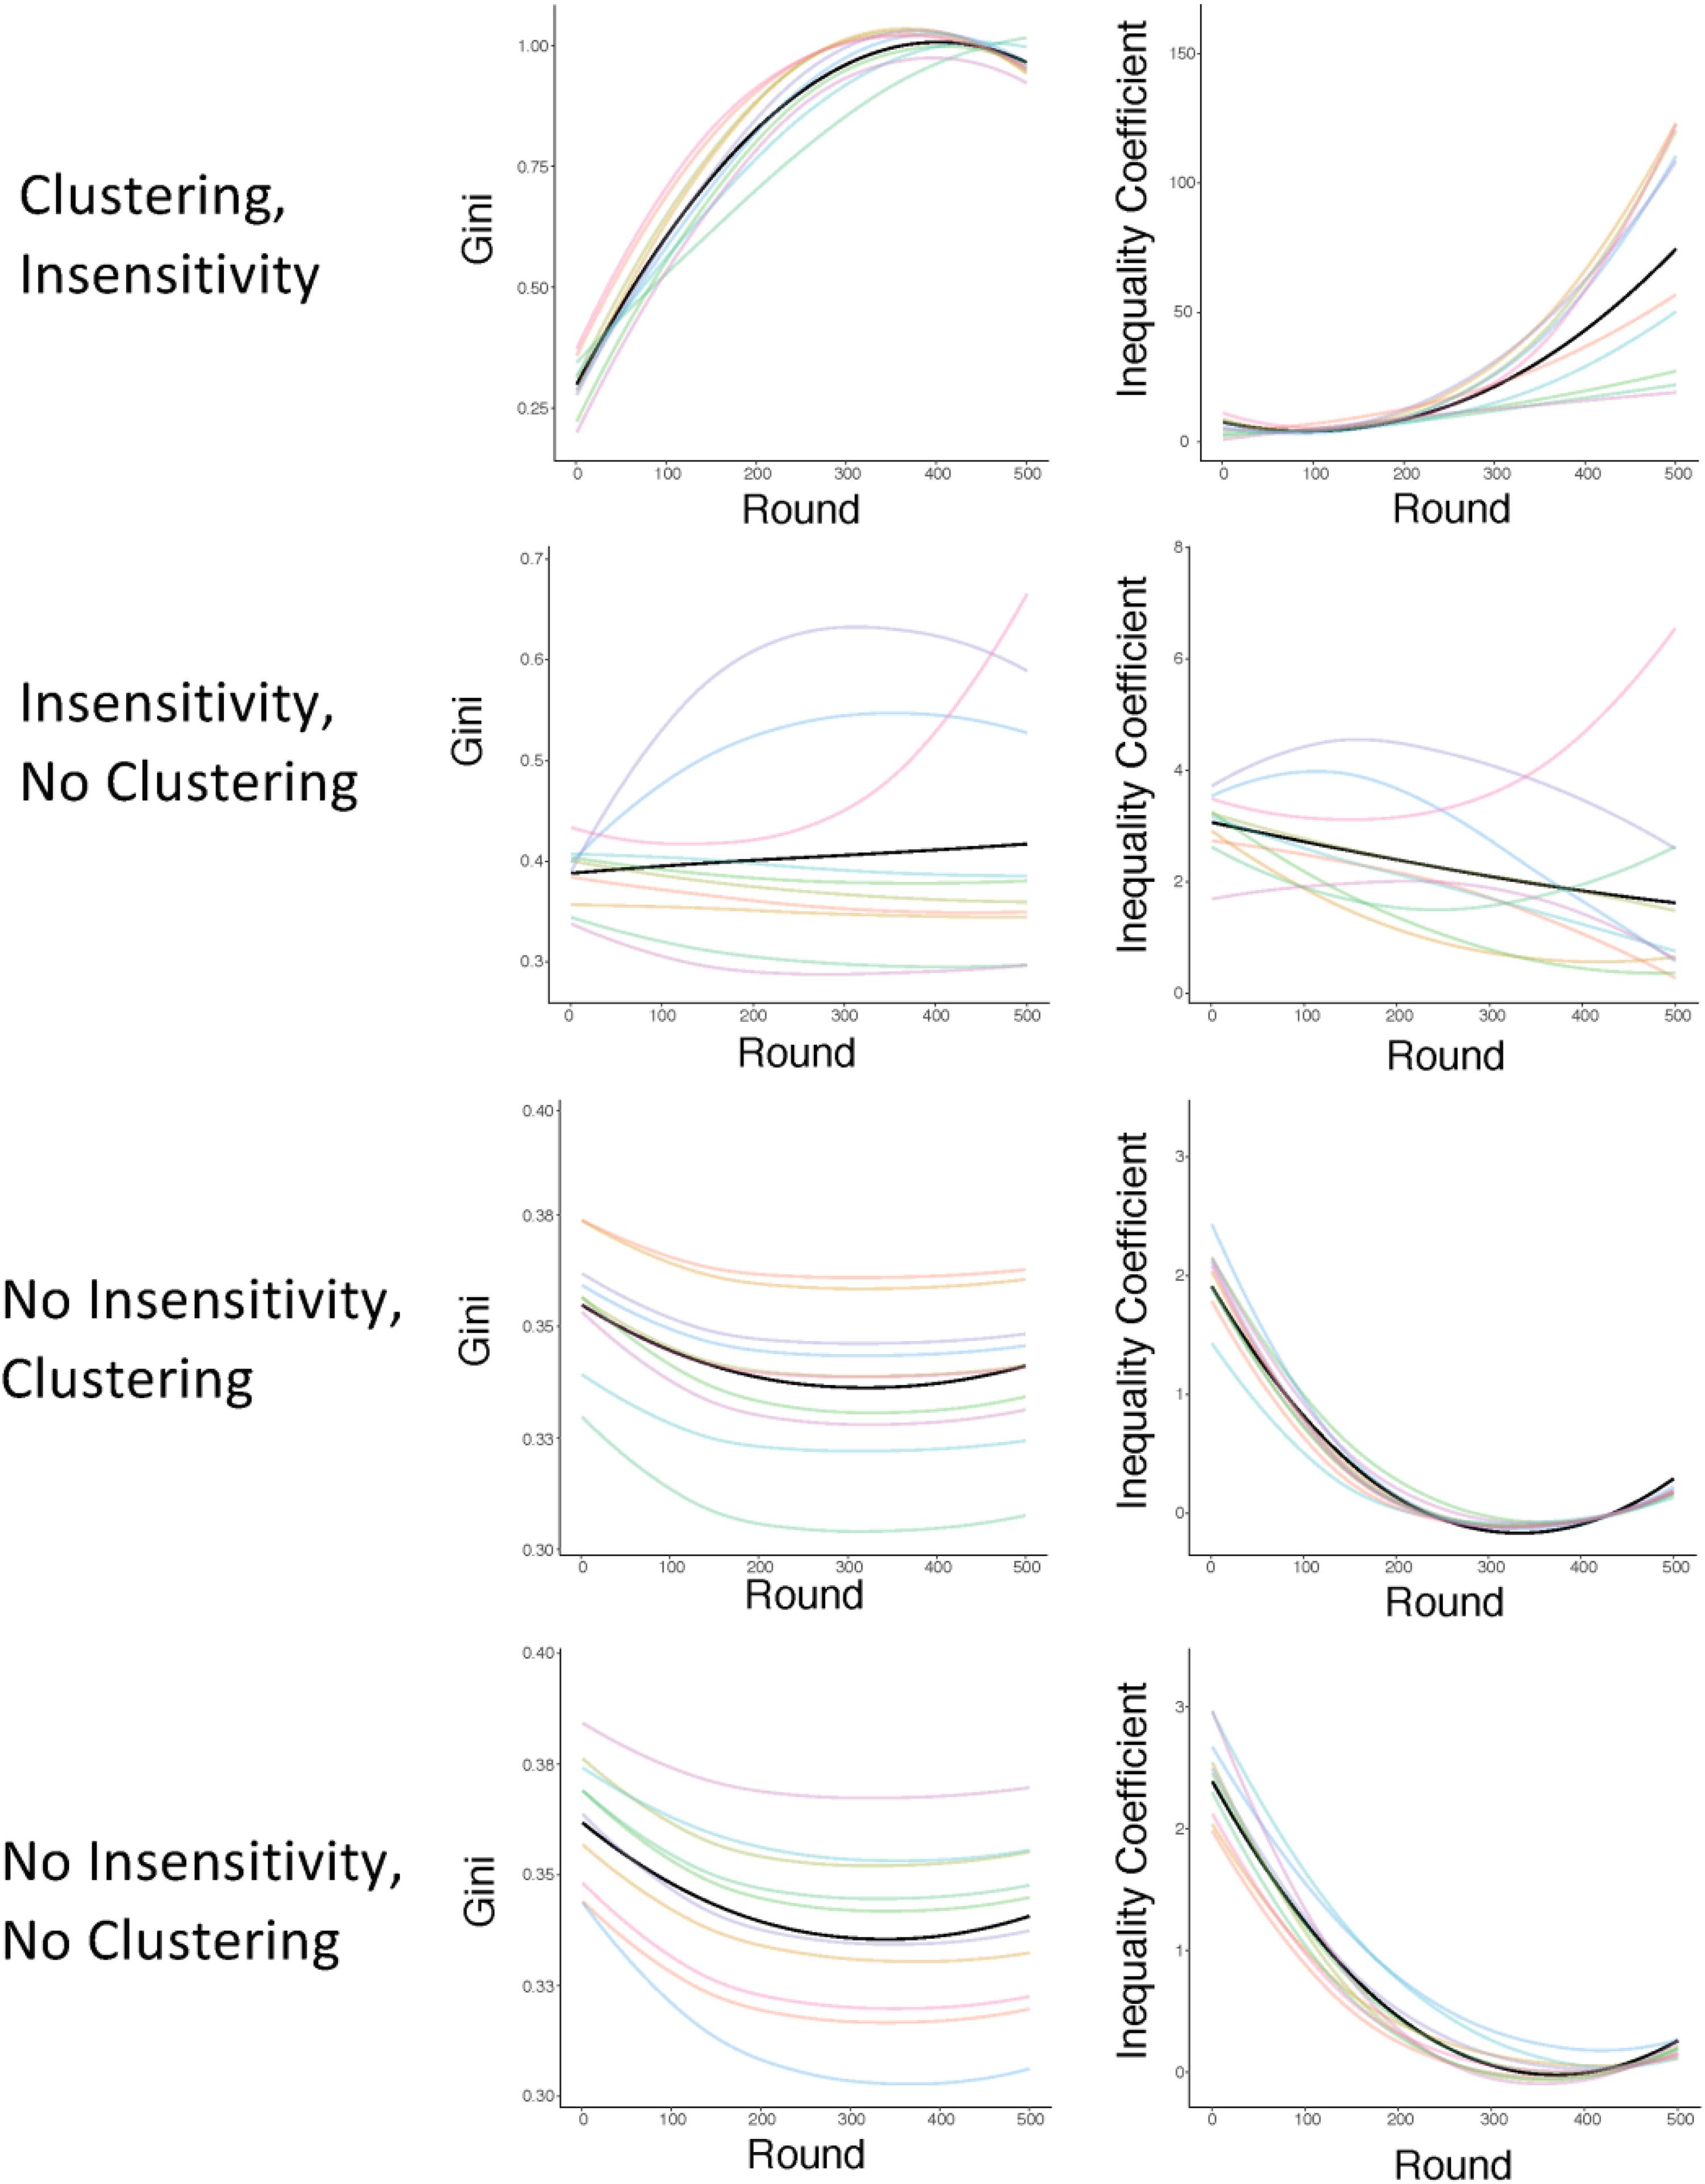
The level of inequality over time in agent-based models across the four simulation conditions. Note. The dark line represents the average Gini coefficient (left) and inequality coefficient k (right) across runs, whereas the colored semi-transparent lines represent individual runs.
Why was inequality so high in runs where agents made clustered social comparisons and were insensitive to large numbers? Further analyses suggested that the relationship between voters’ attitudes about redistribution and their economic interest was key to this dynamic. When agents made clustered social comparisons and showed insensitivity to large numbers, their support for redistribution was not aligned with their economic self-interest (whether agents were above or below the population’s mean income). In fact, these numbers were correlated slightly and nonsignificantly negatively, r = −.02, p = .08. This correlation was similar in the condition with insensitivity to large numbers but no clustering, which showed the second most inequality, r = −.01, p = .31. But when agents made social comparisons to a representative pool of the population, attitudes toward redistribution were highly correlated with economic self-interest, both in conditions where agents showed insensitivity to large numbers, r = .61, p < .001, and when they did not show insensitivity, r = .77, p < .001. Since agents who made clustered social comparisons did not vote according to their economic self-interest, they did not vote to curb rising inequality. Figure 4 breaks down self-interest and attitudes toward redistribution over time across the different conditions.
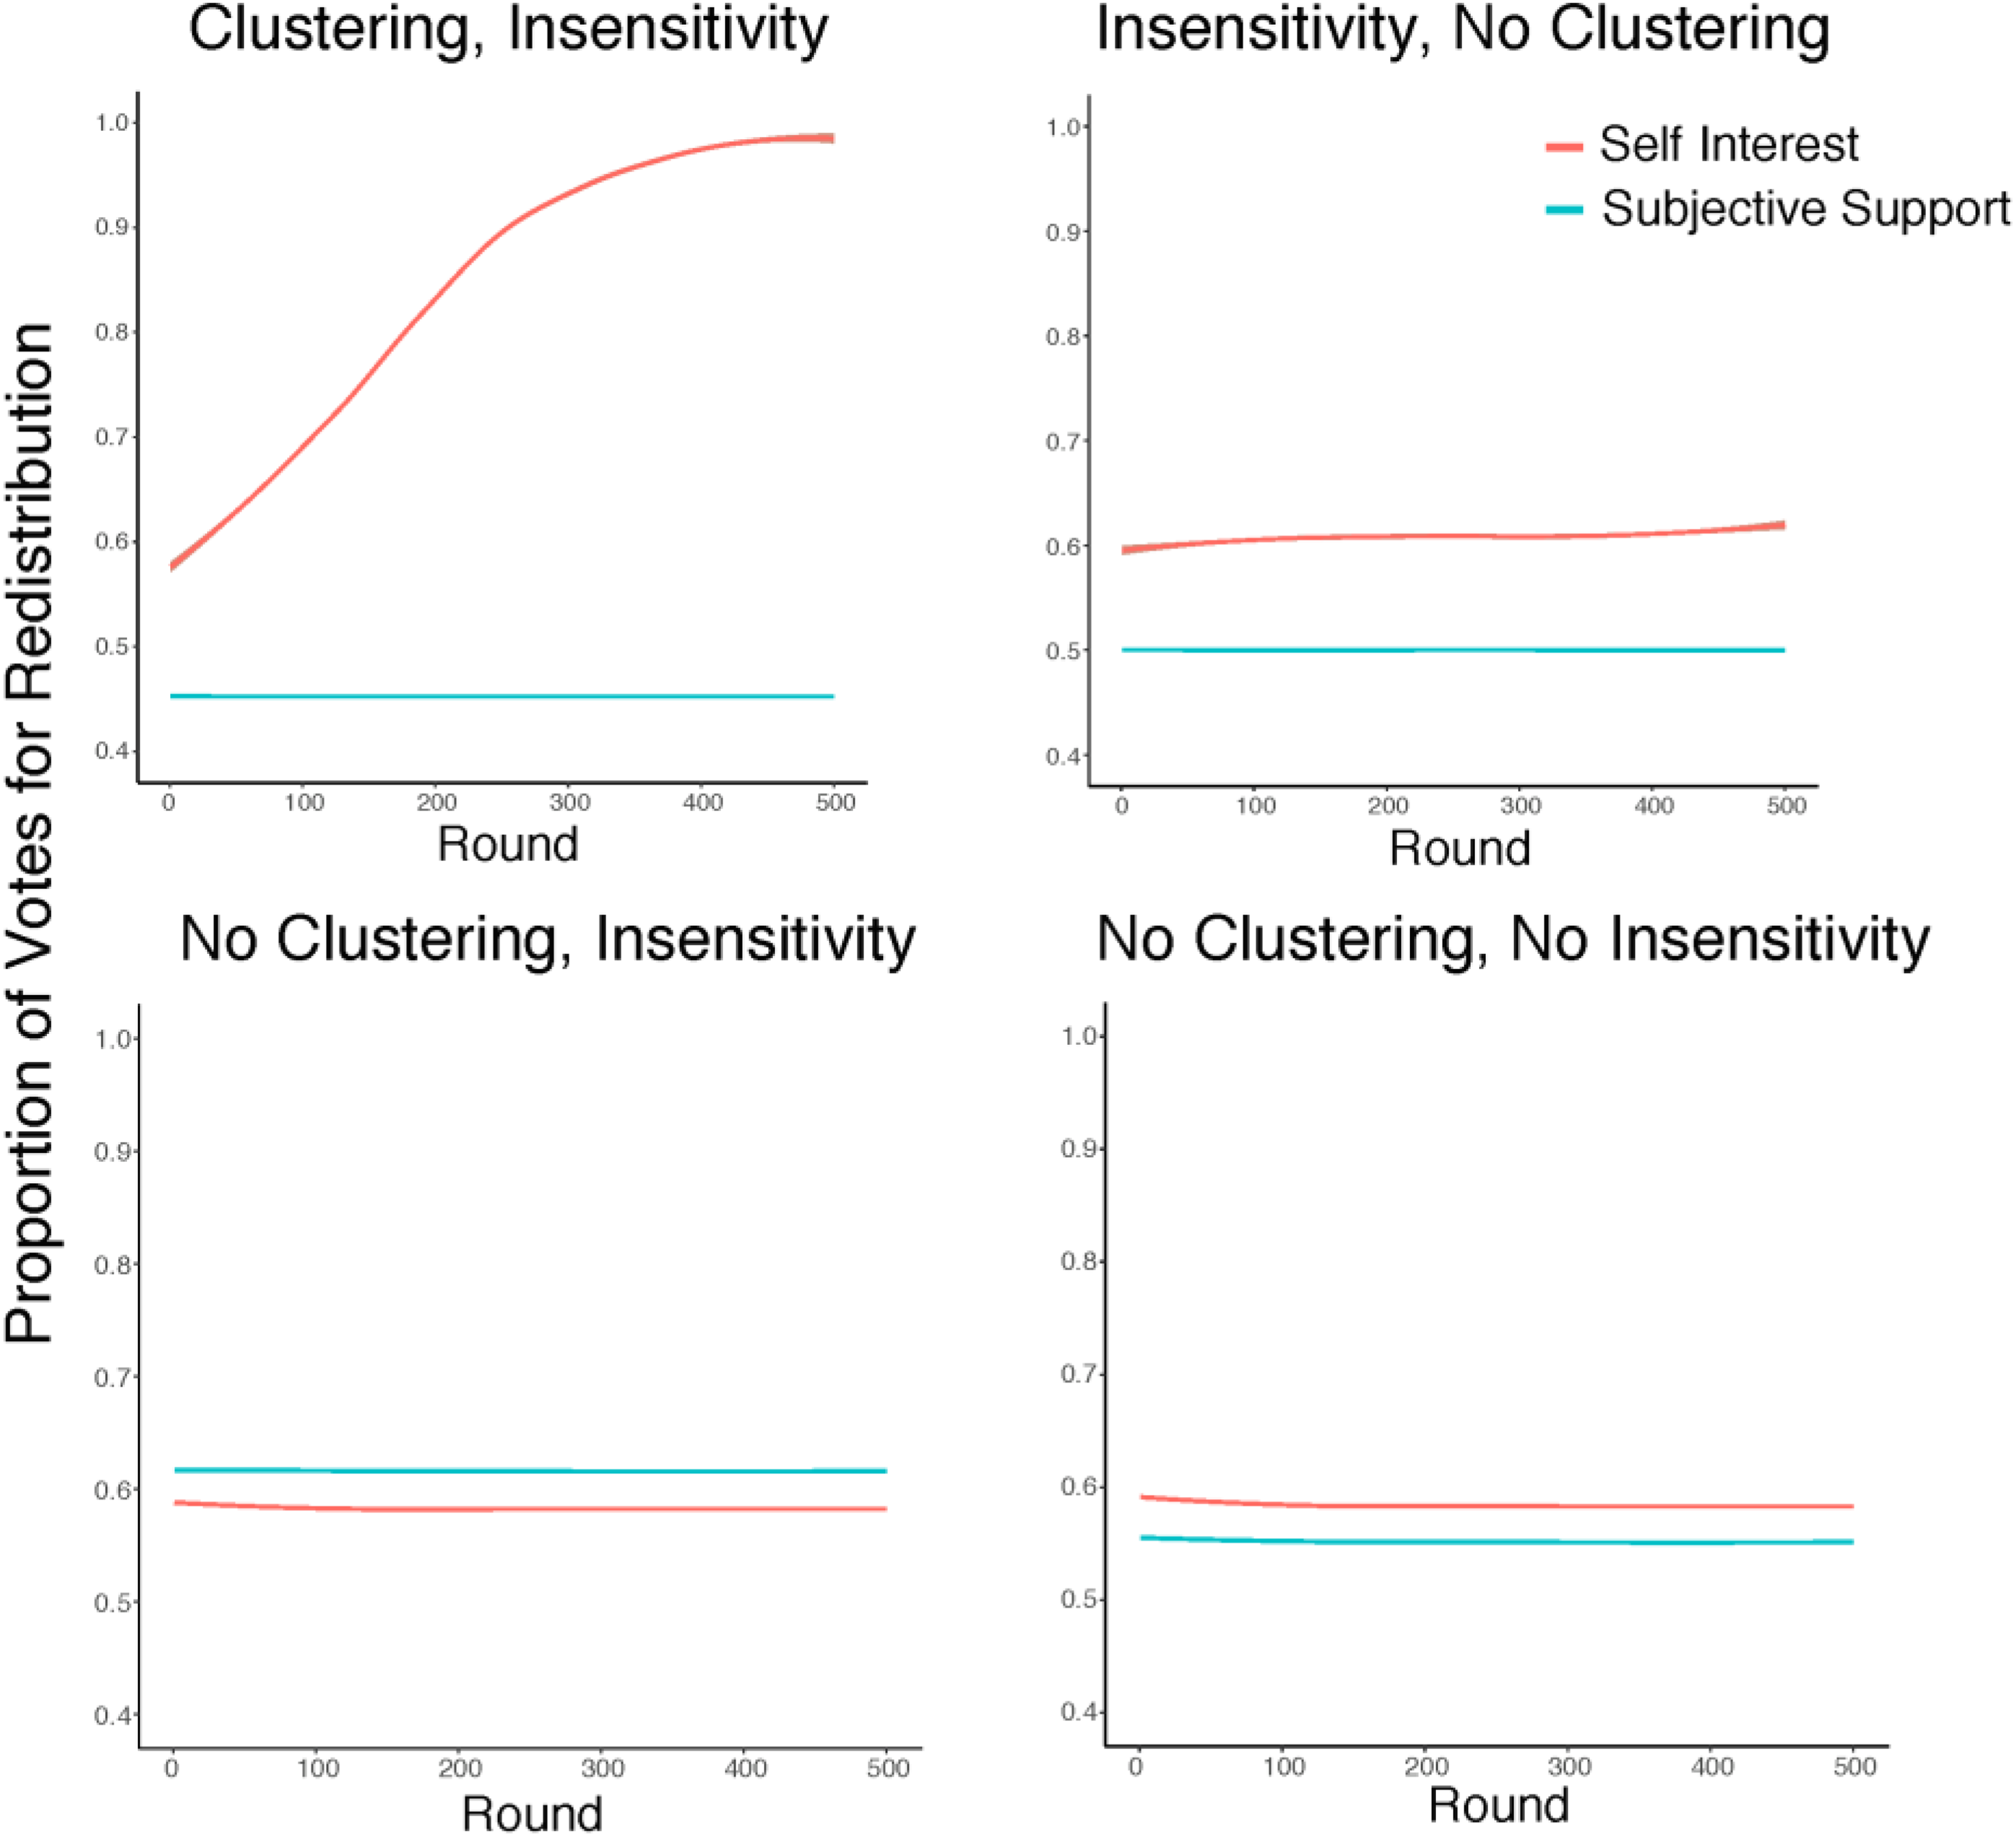
The proportion of agents who favor redistribution (in blue) and the proportion of agents who would stand to benefit from redistribution (in red) for each condition of the model.
Discussion
These agent-based models offered evidence that when people judge their income accurately in comparison to a random sample of others, their attitudes toward redistribution follow economic self-interest. However, insensitivity to large discrepancies and (especially) the tendency to compare to similar others may undermine the link between self-interest and attitudes toward redistribution. This article’s supplemental information contains further exploration of our model as well as sensitivity analyses demonstrating how results changed based on fluctuation in key parameters such as clustering level, voting randomness, and the rate that inequality is allowed to change. Nevertheless, each of these analyses converge on the conclusion that cognitive tendencies around calculating subjective income can drive persistent inequality in democracies.
General Discussion
These findings emphasize a new perspective on inequality. In addition to institutional drivers of inequality, our studies outline several cognitive constraints on people’s calculation of their support for wealth redistribution. By relying partly on subjective income to determine whether redistribution is in their interest, people leave themselves open to the effects of selective social comparison and insensitivity to large numbers. These cognitive tendencies help explain why most people believe they are middle class, occupying the middle of a bell-shaped distribution of socioeconomic status, despite the extreme skew present in actual income distributions.
Both of these problems can potentially be mitigated. Accessible resources that help people learn whether they will benefit from wealth redistribution could help people select economic policies that are in their best interest. On a larger scale, reducing residential segregation or otherwise increasing intergroup contact across social class lines could facilitate more representative social comparisons and more accurate judgments of economic self-interest.
Attitudes about redistribution are not the only influences on people’s voting decisions and contribute to rising inequality. Institutional factors like gerrymandering may distort voting outcomes, and social factors such as moral and intergroup values may lead people to vote against their economic interests in favor of symbolic or group interests. These factors may also influence attitudes toward income redistribution (see Franko et al., 2013; Mutz & Mondak, 1997), and we encourage future research to investigate this process. The main contribution of our model is to suggest an explanation for why most people feel middle class, and about half of the population feels that redistribution is against their interests, even in conditions of extreme inequality.
The distribution of resources is a fundamental political decision faced by all societies. Political theory and economic models often assume that decisions are made based on rational self-interest. Our model suggests that well-established cognitive tendencies can lead to specific and predictable distortions in how people understand their self-interest, with implications for income inequality.
Supplemental Material
Modeling_Inequality_Revision_-_Supplement_(To_Submit)_(2) - Cognitive Barriers to Reducing Income Inequality
Modeling_Inequality_Revision_-_Supplement_(To_Submit)_(2) for Cognitive Barriers to Reducing Income Inequality by Joshua Conrad Jackson and Keith Payne in Social Psychological and Personality Science
Footnotes
Author Contributions
Joshua Conrad Jackson conceptualized the research program, designed the studies, collected and analyzed the data, wrote the manuscript, and approved the submission. Keith Payne conceptualized the research program, designed the studies, wrote the manuscript, and approved the submission.
Declaration of Conflicting Interests
The author(s) declared no potential conflicts of interest with respect to the research, authorship, and/or publication of this article.
Funding
The author(s) disclosed receipt of the following financial support for the research, authorship, and/or publication of this article: This research was supported by a National Science Foundation Graduate Research Fellowship, a Caroline H. and Thomas S. Royster Fellowship to Joshua Conrad Jackson, and a National Science Foundation Grant (Grant 1729446) to Keith Payne.
Supplemental Material
The supplemental material is available in the online version of the article.
References
Supplementary Material
Please find the following supplemental material available below.
For Open Access articles published under a Creative Commons License, all supplemental material carries the same license as the article it is associated with.
For non-Open Access articles published, all supplemental material carries a non-exclusive license, and permission requests for re-use of supplemental material or any part of supplemental material shall be sent directly to the copyright owner as specified in the copyright notice associated with the article.