
Abstract
Objective
Although knee osteoarthritis (KOA) is a common disease, there is a lack of specific prevention and early treatment methods. Hence, this study aimed to examine the molecular changes occurring at different stages of KOA to elucidate the dynamic nature of the disease.
Design
Using a low-force compression model and analyzing RNA sequencing data, we identified molecular changes in the transcriptome of knee joint cartilage, including gene expression and molecular pathways, between the cellular changes and structural damage stages of KOA progression. In addition, we validated hub genes using an external dataset.
Results
Gene set enrichment analysis (GSEA) identified the following pathways to be associated with KOA: “B-cell receptor signaling pathway,” “cytokine-cytokine receptor interaction,” and “hematopoietic cell lineage.” Expression analysis revealed 585 differentially expressed genes, with 579 downregulated and 6 upregulated genes. Enrichment and clustering analyses revealed that the main molecular clusters were involved in cell cycle regulation and immune responses. Furthermore, the hub genes Csf1r, Cxcr4, Cxcl12, and Ptprc were related to immune responses.
Conclusions
Our study provides insights into the dynamic nature of early-stage KOA and offers valuable information to support the development of effective intervention strategies to prevent the irreversible damage associated with KOA, thereby addressing a major clinical challenge.
Introduction
Osteoarthritis (OA) is a prevalent global condition characterized by joint cartilage degeneration and joint deformation. 1 Posttraumatic osteoarthritis (PTOA) is osteoarthritis that develops after joint injury. The knee is one of the most frequently injured joints in the body, possibly leading to knee osteoarthritis (KOA). Pain and deformity caused by KOA considerably impair lower limb function in patients. Conservative treatment and joint replacement surgery are the primary approaches to managing KOA. However, the prevention and treatment of KOA are limited to physical therapy and nonsteroidal anti-inflammatory drug (NSAID) use, with joint replacement surgery remaining the ultimate option for most patients. 2 Consequently, KOA is associated with a high disability rate, which severely decreases the quality of life of patients and imposes a substantial economic burden on families and society.3,4 To develop effective strategies for KOA prevention and treatment, it is necessary to investigate the underlying mechanisms of its early development.
The onset of KOA pathology may be slow, 5 with the earliest stages limited to only cellular changes (de Windt et al., 2013) 6 —“pre-osteoarthritis” (pre-OA) stage 7 —making it crucial to employ molecular biology and bioinformatic techniques to elucidate these molecular changes. Animal models are an effective approach for studying KOA progression. However, most studies have focused on inducing rapid knee joint destruction, reflecting end-stage OA tissue,8-11 with limited attention paid to the early progression of KOA before the occurrence of irreversible structural damage. We previously developed a rat model in which KOA was induced through a single session of low-force cyclic compression. 12 Our observations revealed that cysts and cavities in the tibial cartilage appeared 6 months after compression, while fissures in the cartilage were observed after 1 year of compression. We believe that this model can provide valuable insights into the progression of pre-structural damage in pre-OA patients. Therefore, this study aimed to explore the molecular changes at the transcriptomic level, from cellular changes to irreversible structural damage, including changes in gene expression, molecular pathways, and interaction networks.
Methods
Animals and Treatments
Healthy male Wistar rats at 12 weeks of age (provided by SHIMIZU Laboratory Supplies Co., Ltd., Kyoto, Japan) were used. The rats were housed in a standard environment at a temperature of 24°C, humidity of 55% ± 5%, good ventilation, and ample space for activity. The rats were provided food (standard solid pellet feed) and water. The rats in the compression group were subjected to low-force compression as reported previously.13,14 Briefly, a single session of cyclic compression, which did not cause structural damage to the right knee joint, was applied. This was followed by normal feeding (adequate standard solid pellet feed, water, and exercise space) until the desired time points (8 rats allocated for each time point). The rats in the control group underwent identical anesthesia procedures but did not undergo compression. They were collected at the same time points as in the compression group (8 rats allocated for each time point). Previously, 12 we defined the pre-structural damage stage as 12 weeks post-compression (+12 weeks group) and the structural damage stage as 6 months post-compression (+6 months group).
Histology
The rats were euthanized by overdose of isoflurane inhalation followed by exsanguination. Tissue blocks were collected from the right knee joint of each rat. For histological observations, tissue blocks were fixed in 4% paraformaldehyde, decalcified in 10% ethylenediaminetetraacetic acid, and embedded in paraffin. Joint tissue blocks were sectioned in the sagittal plane. Sections were mounted on glass slides and deparaffinized. For Safranin O/Fast Green staining, the sections were stained with 0.02% Fast Green followed by 0.1% Safranin O. Tibial cartilage damage was quantified using a modified Mankin scoring system. 15
RNA-Sequencing and Bioinformatic Analysis
Cartilage samples were collected from the tibial plateau of the right knee, immediately frozen in liquid nitrogen, and stored at −80°C. Total RNA was extracted using an RNeasy Plus Universal Mini Kit (Qiagen, Valencia, CA, USA) following the manufacturer’s protocol. Each RNA sample for total RNA sequencing (RNA-Seq) was extracted from 2 individuals treated under the same conditions simultaneously and pooled to ensure sufficient RNA quantity while reducing the impact of individual variability. Analyses were performed in 4 replicates (N = 4 pooled RNA samples per group and time point). RNA quality assessment, cDNA library construction, and RNA sequencing were conducted at SignAC (Single-cell Genome Information Analysis Core at WPI-ASHBi, Kyoto University, Kyoto, Japan). Samples with an RNA integrity number (RIN) greater than 7, indicating intact RNA, were used for RNA-Seq. Sequencing was performed using NovaSeq6000 with 151-bp paired-end reads.
After sequencing, the SnakePipes (v. 2.7.0) mRNA-Seq pipeline was used for data processing and analysis. Low-quality reads, adapter contamination, and high-content unknown nucleotide (N) noise reads were filtered out using Fastp (v 0.23.2). The remaining “clean reads” were aligned to the reference genome (NCBI mRatBN7.2) using STAR (v 2.7.10a). Low expression data (molecules with 0 values greater than 50% across all samples) and genes that had not yet been specifically named or annotated were further filtered out. Sequence data from each group were analyzed. Principal component analysis (PCA) (version 3.6.0), k-means cluster analysis, and gene set enrichment analysis (GSEA) (version 4.8.1) were performed using the transformed data. DEseq2 16 was used to detect differentially expressed genes (DEGs). DEG analysis was conducted between the +6 months and +12 weeks groups using a threshold of |logFC| > 1 and false discovery rate (FDR) < 0.05, for both the compression and control groups. Functional annotation was performed using the ClusterProfiler software (version 4.8.1). Protein-protein interactions (PPIs) were analyzed using the Search Tool for the Retrieval of Interacting Genes/Proteins (STRING) 17 and Cytoscape (v. 3.9.1, Institute of Systems Biology, Seattle, WA). 18
Validation of the Hub Genes
External validation was conducted to evaluate the capacity of the hub genes in distinguishing between cellular changes and structural damage stage using data from Gene Expression Omnibus (GEO) databases (GSE28958, GSE42295, and GSE103416). Table 1 lists the characteristics of the datasets. To create an integrated GEO dataset, batch effects were removed,19,20 and the samples were grouped based on known histological information.21,22 The integrated dataset was then subjected to receiver-operating characteristic (ROC) analysis using pROC (v. 1.17.0.1) to obtain the area under the curve (AUC).
Descriptive Statistics.
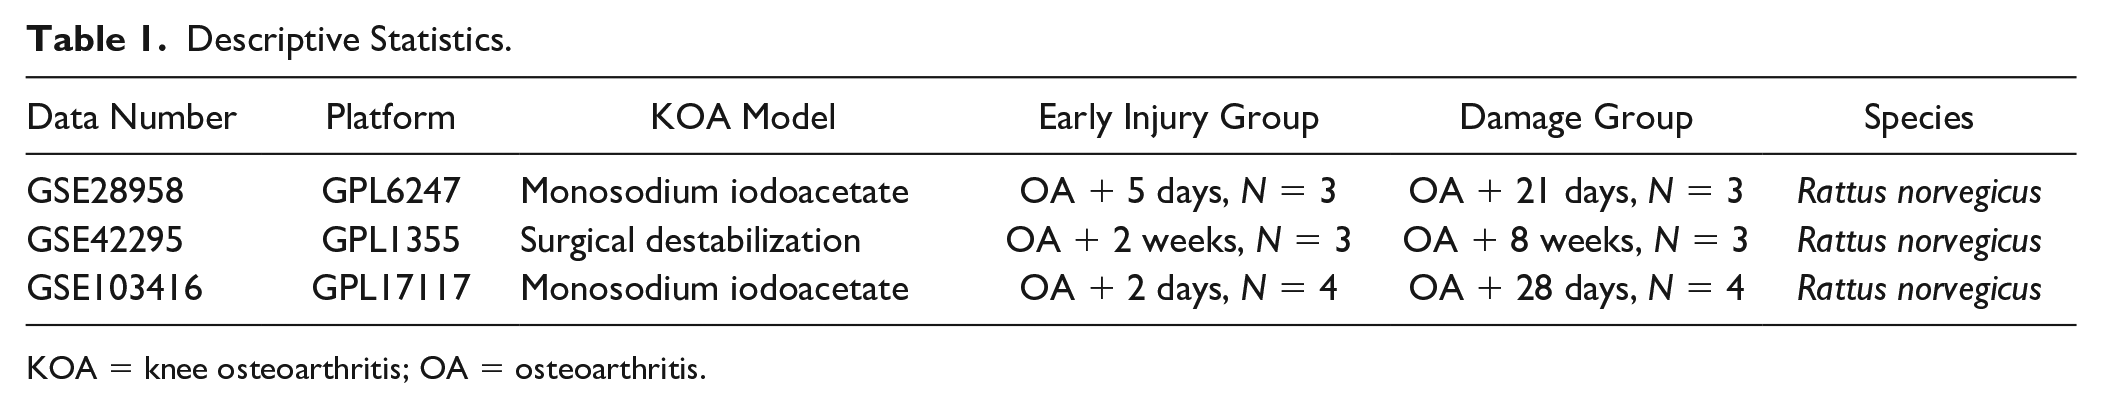
KOA = knee osteoarthritis; OA = osteoarthritis.
Overall Workflow
The overall workflow involved the RNA-Seq of rat cartilage samples at different time points after being subjected to low-force cyclic compression. The 12-week time point (+12 weeks), characterized by minimal observable structural cartilage damage and early injury manifesting as cellular changes, was designated as the early injury stage. Whereas the 6-month time point (+6 months), characterized by the presence of intra-articular cysts and cavity damage, was designated as the damage stage. Differential analysis was conducted between the compressed cartilage samples at +12 weeks post-compression and those at +6 months post-compression to elucidate the progression of cartilage injuries following compression. Similarly, cartilage samples from the control group underwent differential analysis at the same 2 time points to elucidate the intrinsic background changes in the cartilage over time. The data analysis process included quality control, genome alignment, gene expression quantification, differential analysis, clustering analysis, GSEA, gene function enrichment, PPI network analysis, and external dataset validation (
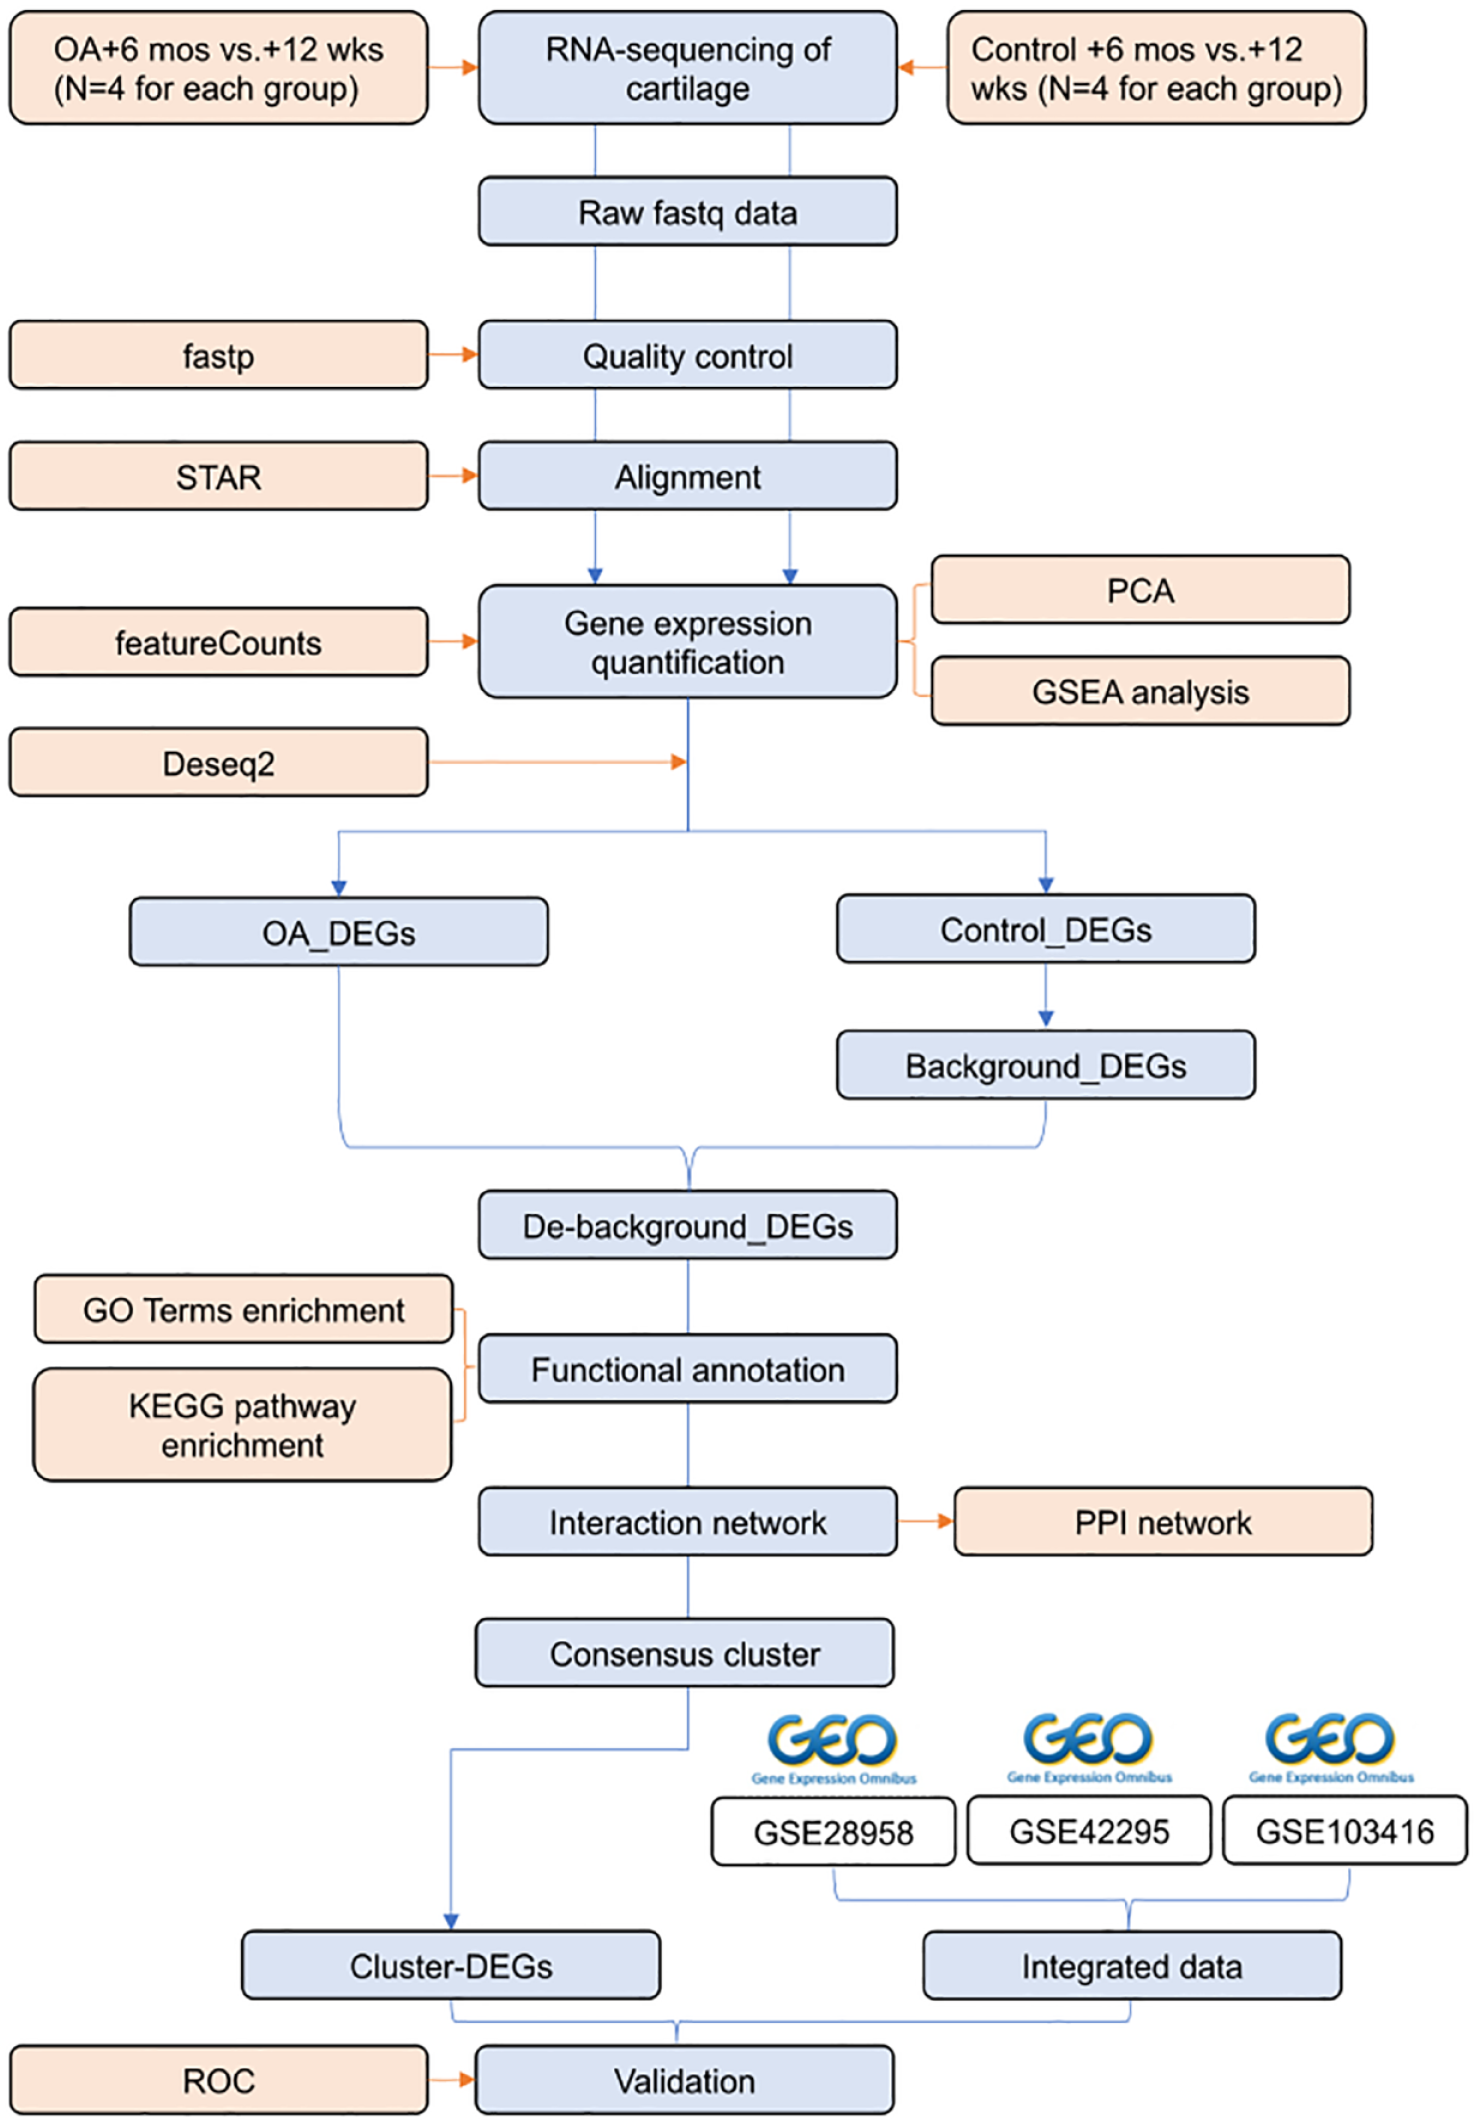
Study flow chart. PCA = principal component analysis; GSEA = gene set enrichment analysis; OA = osteoarthritis; DEGs = differentially expressed genes; KEGG = Kyoto Encyclopedia of Genes and Genomes; GO = Gene Ontology; ROC = receiver-operating characteristic; PPI = protein-protein interaction.
Statistical Analysis
Tissue histology data were statistically analyzed using the GraphPad software (v. 9.4.1). The non-parametric Mann-Whitney U test was employed to compare differences among groups, and differences were considered statistically significant at P < 0.05.
Results
Morphology of Cartilage at Different Time Points
Figure 2A
displays the macroscopic tissue images. The cartilage surface of the +12 weeks group exhibited slight granularity compared with the uncompressed cartilage, whereas visible cartilage surface ulcers were observed in the +6 months group.
Figure 2B
shows the histological observations. In the +12 weeks group rats, the cartilage showed only features of reduced staining and hypertrophic nuclei, whereas in the +6 months group rats, the cartilage exhibited evident intra-articular cysts and cavities in the middle layer. Histological scoring indicated significant KOA progression at +6 months compared to that at +12 weeks (
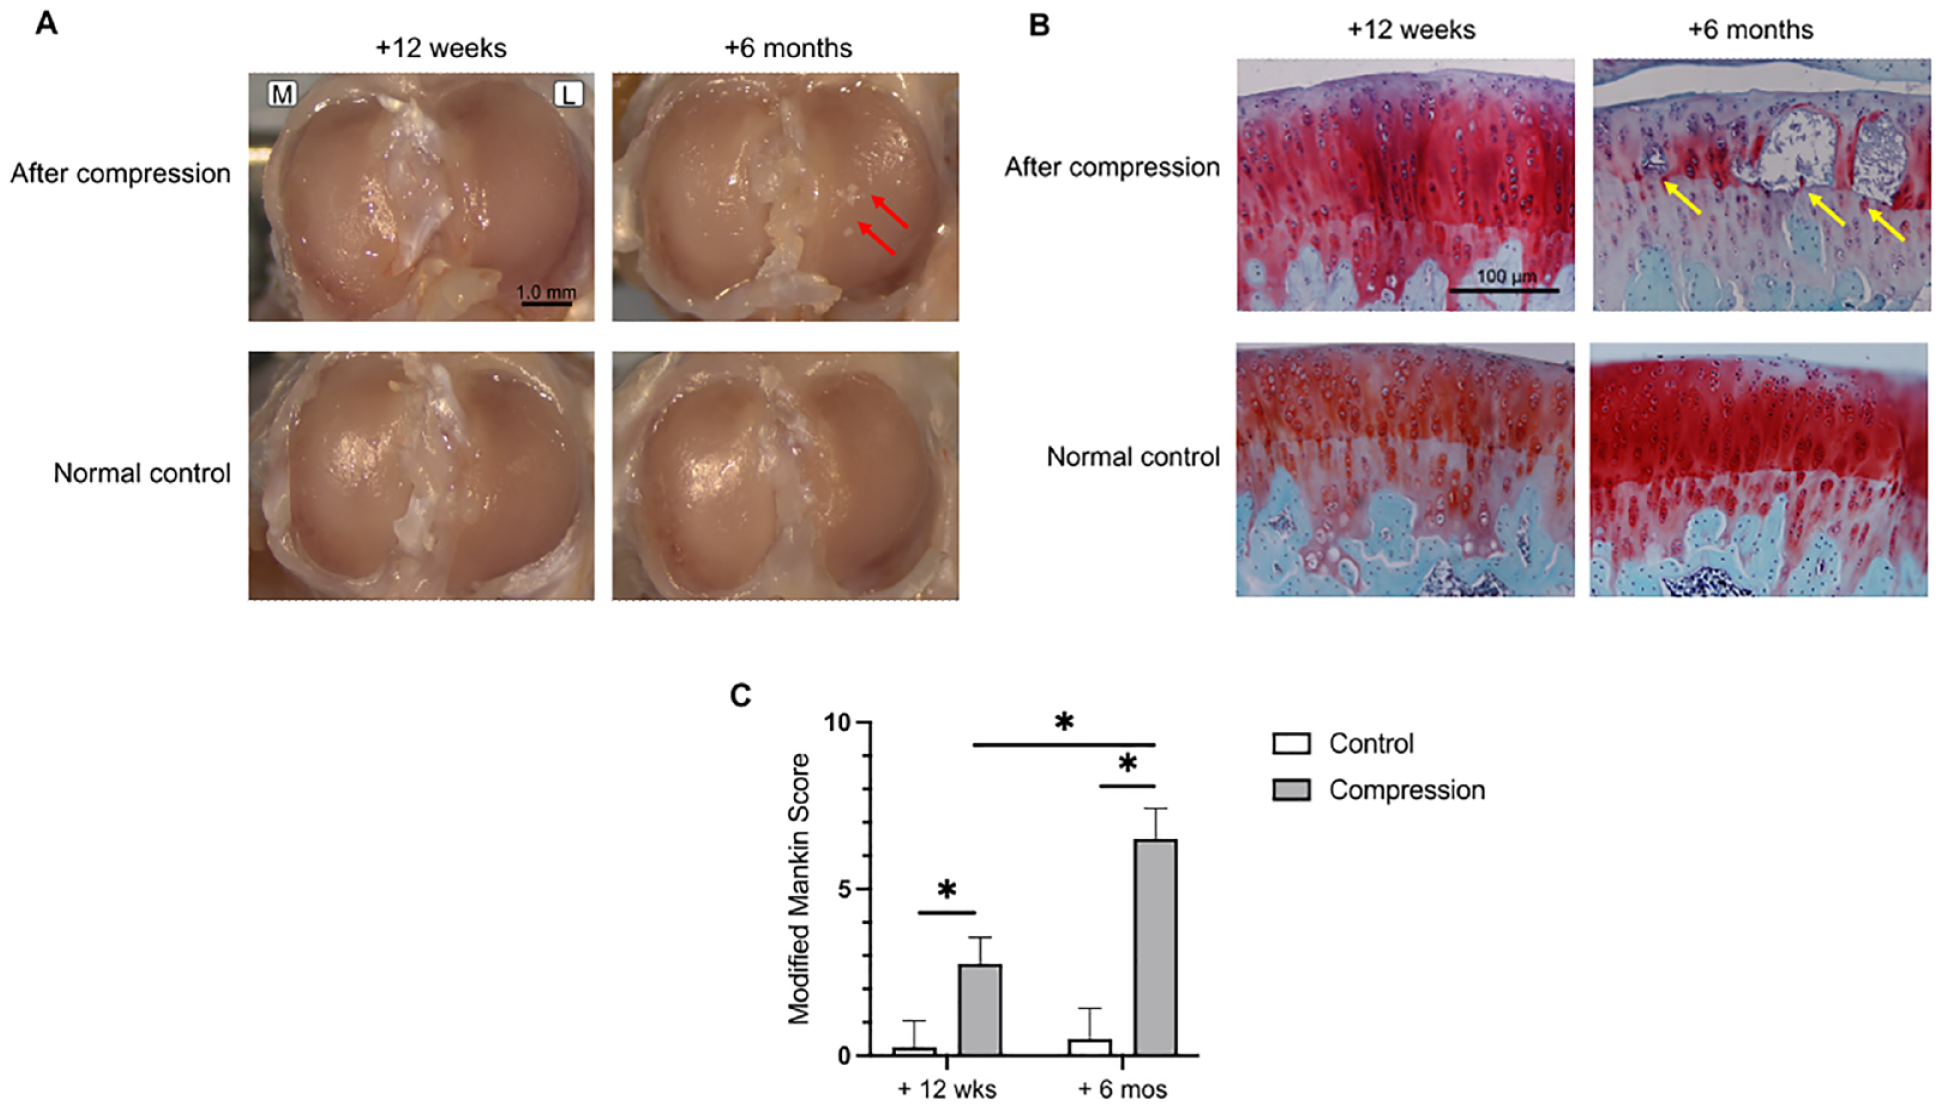
Morphological observation and analysis. (
Gene Expression Profiles Among the Groups
A total of 33,294 genes were identified across all samples and subjected to further analysis after screening. The median, interquartile range, and maximum and minimum values of gene expression were comparable among samples (
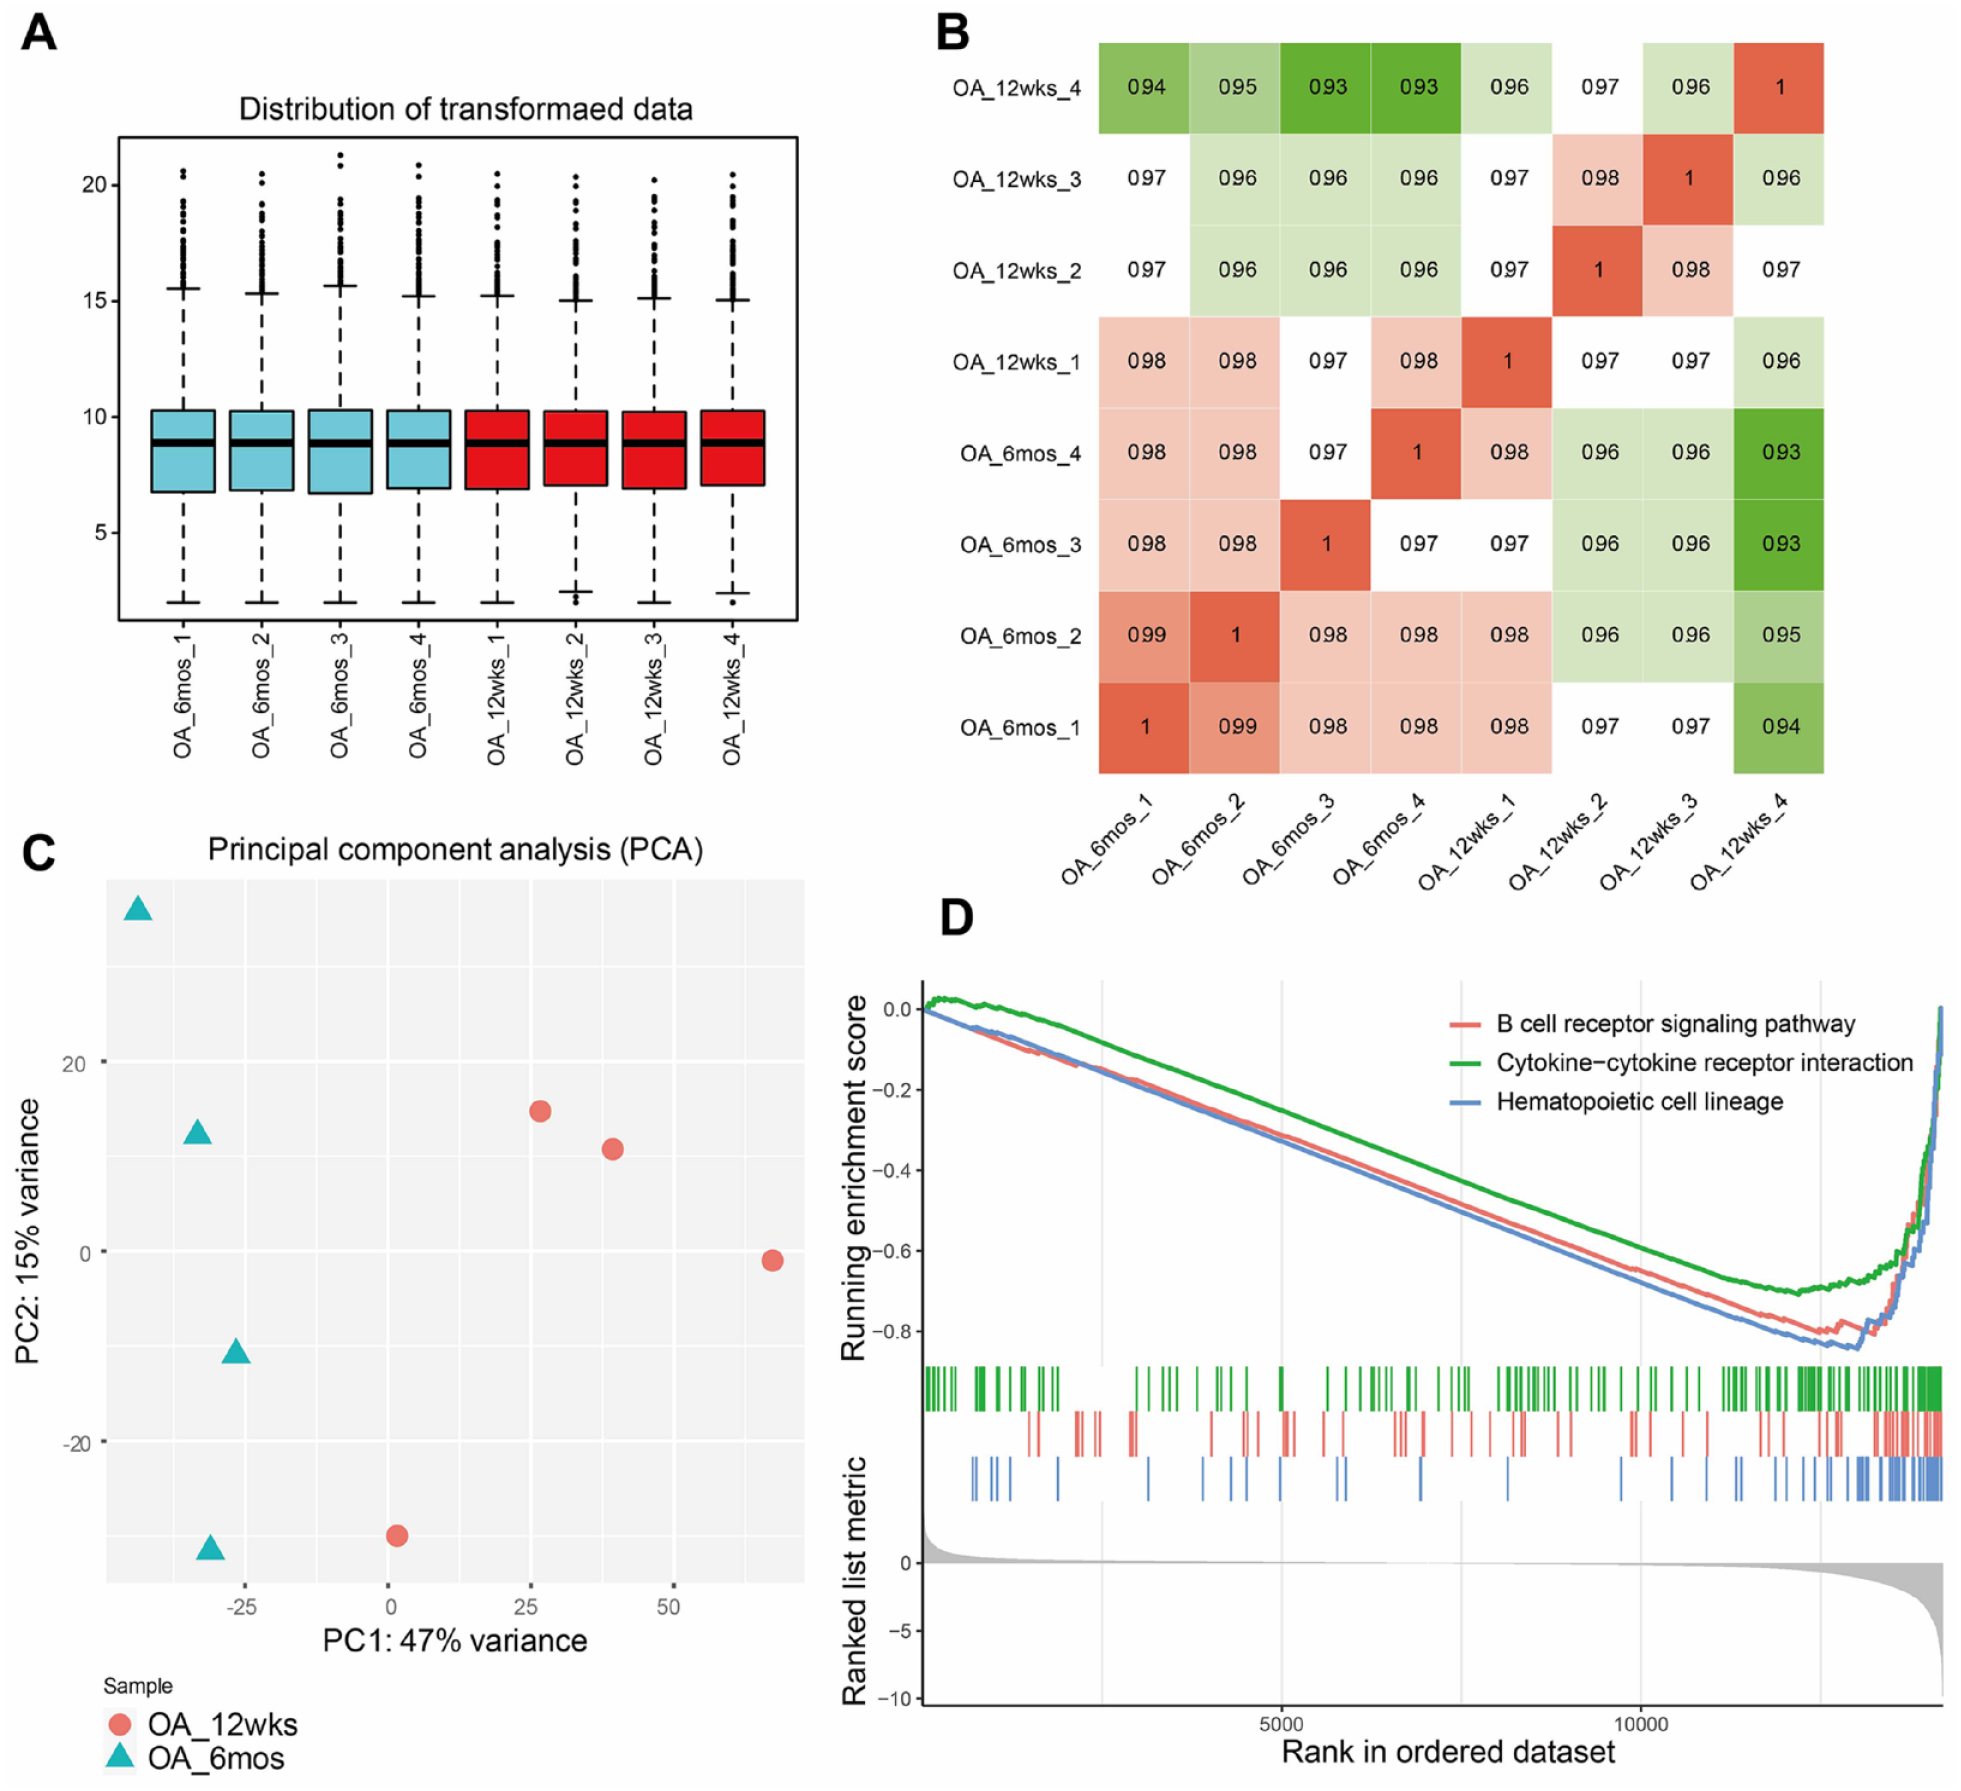
Analysis of gene expression profiles of the +12 weeks and +6 months groups. (
K-means analysis was performed on the 2,000 most variably expressed genes (
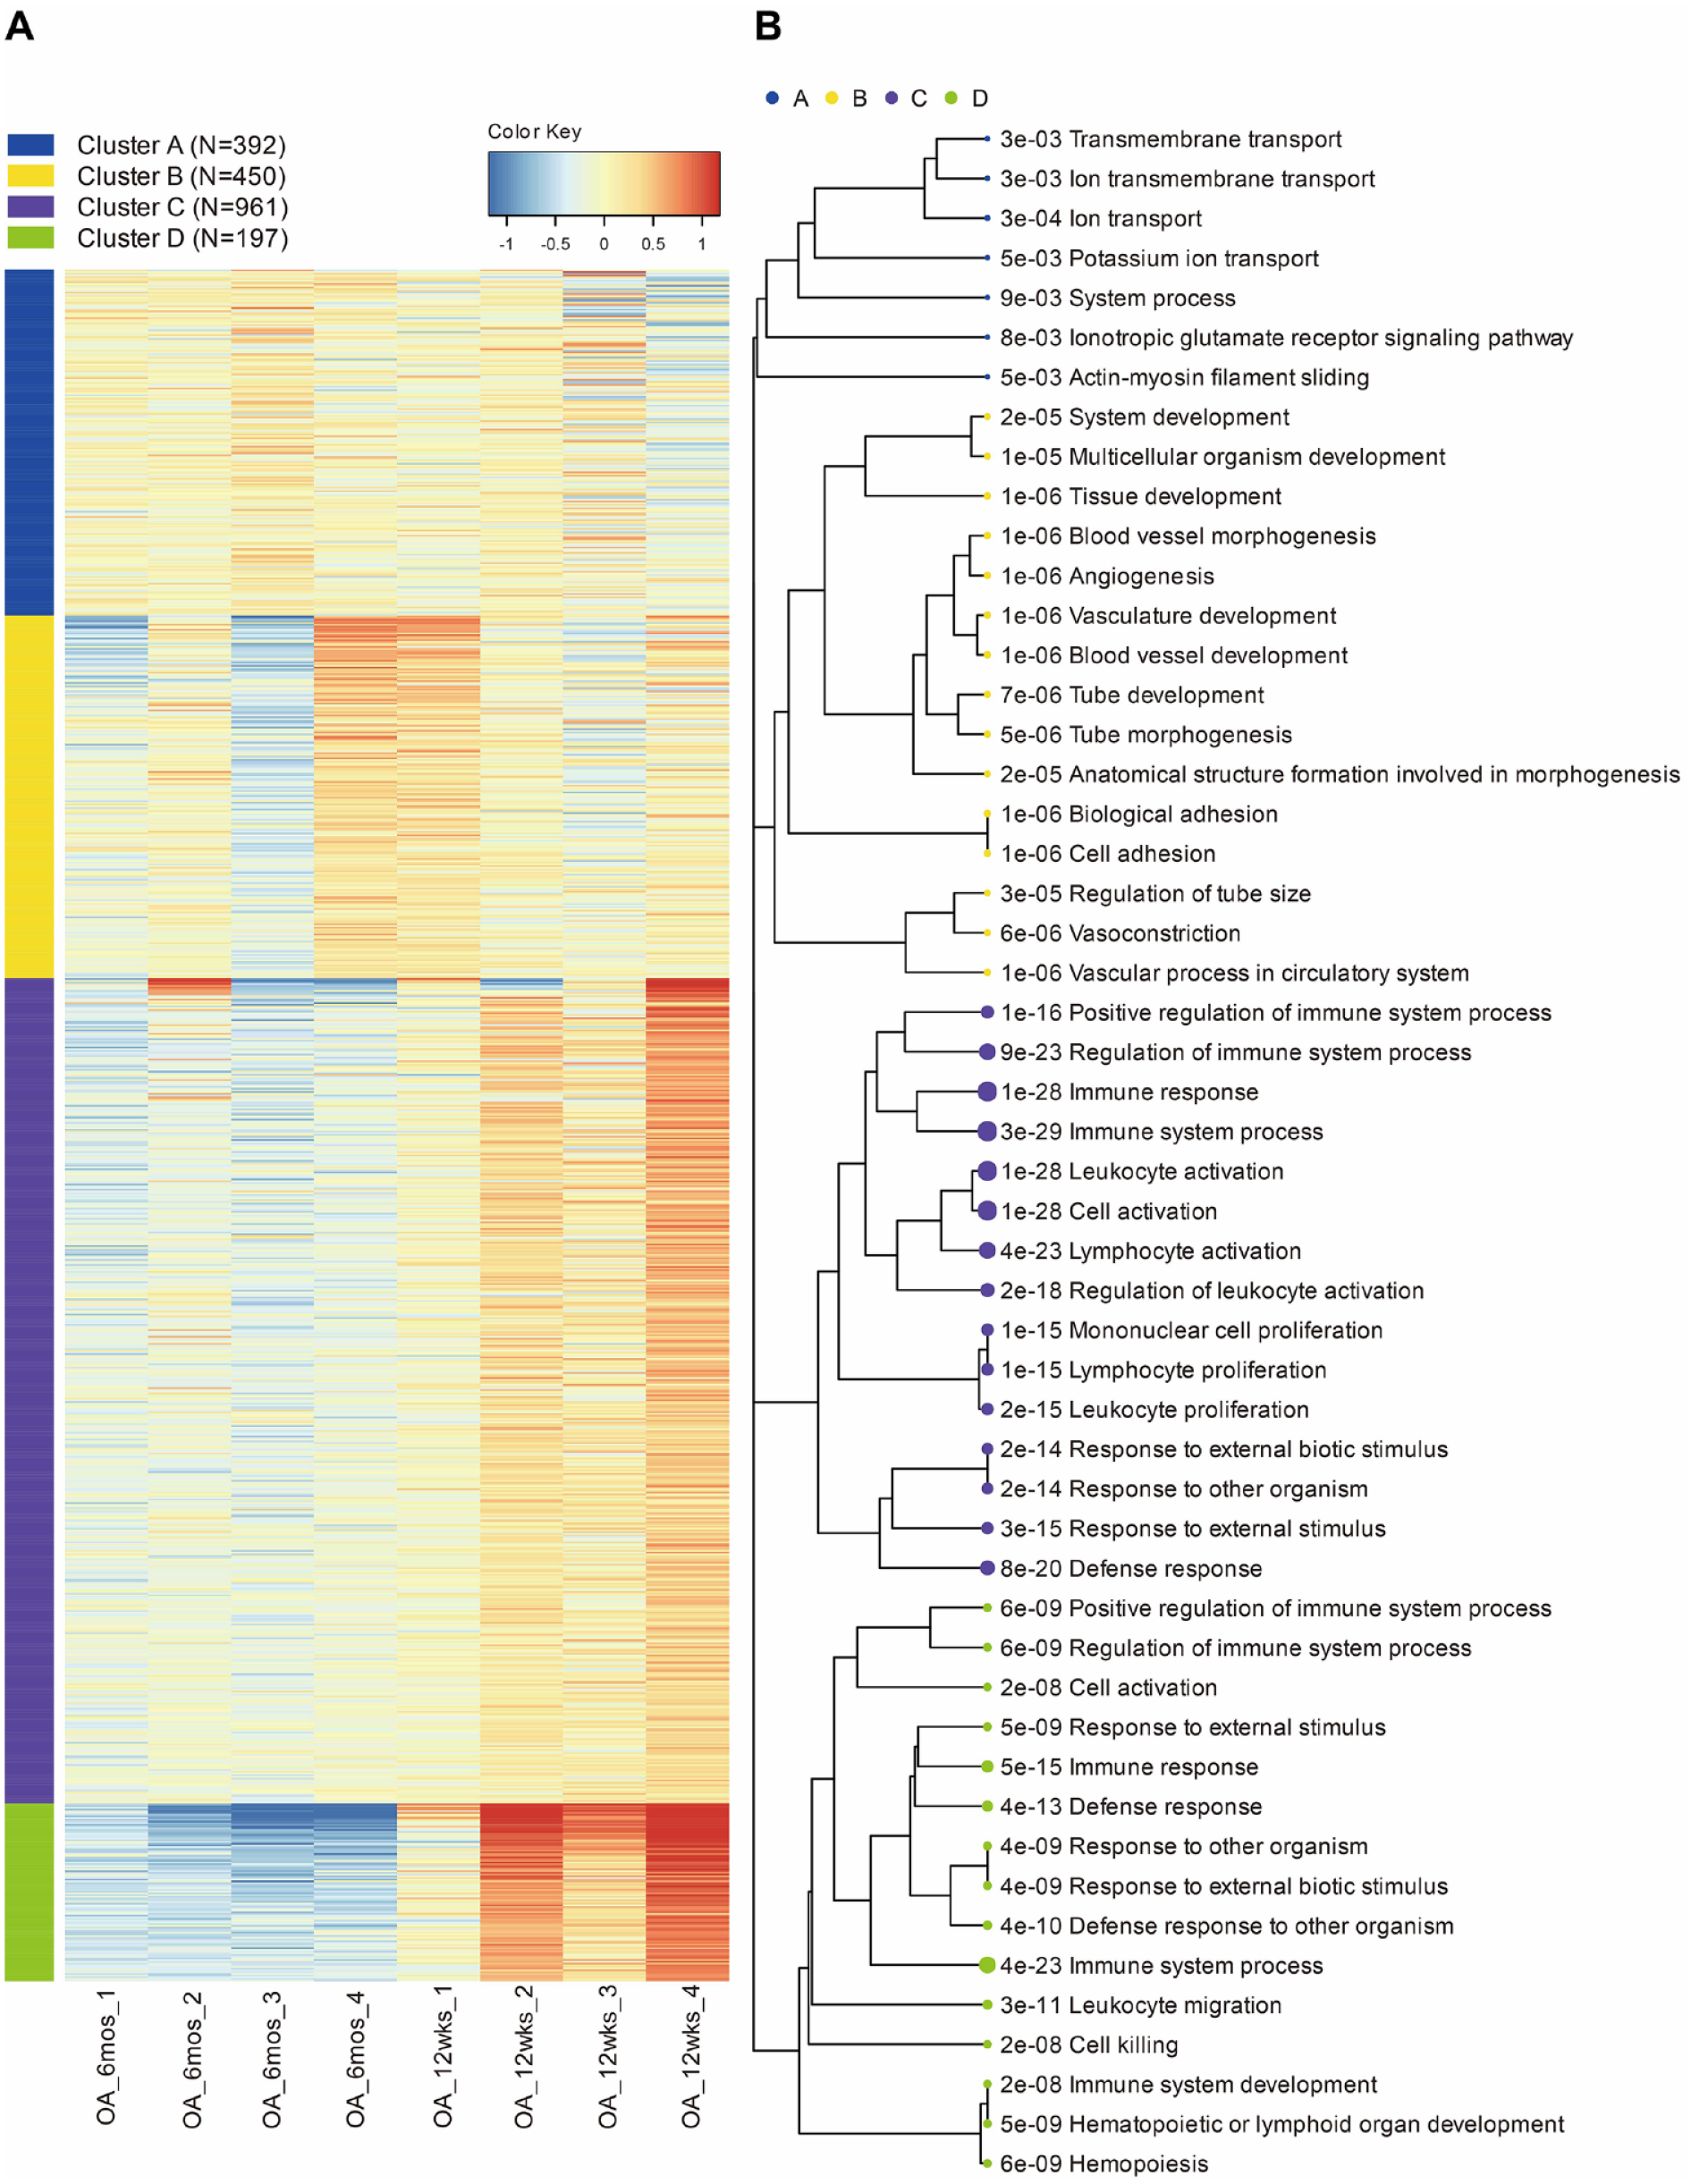
K-means cluster analysis and enrichment results. (
Identification of Differentially Expressed Genes
In total, 585 DEGs were identified between the +6 months and +12 weeks groups (Supplement 1). Among these, 579 genes were downregulated and 6 genes were upregulated (

DEG analysis. (
Enrichment of DEGs
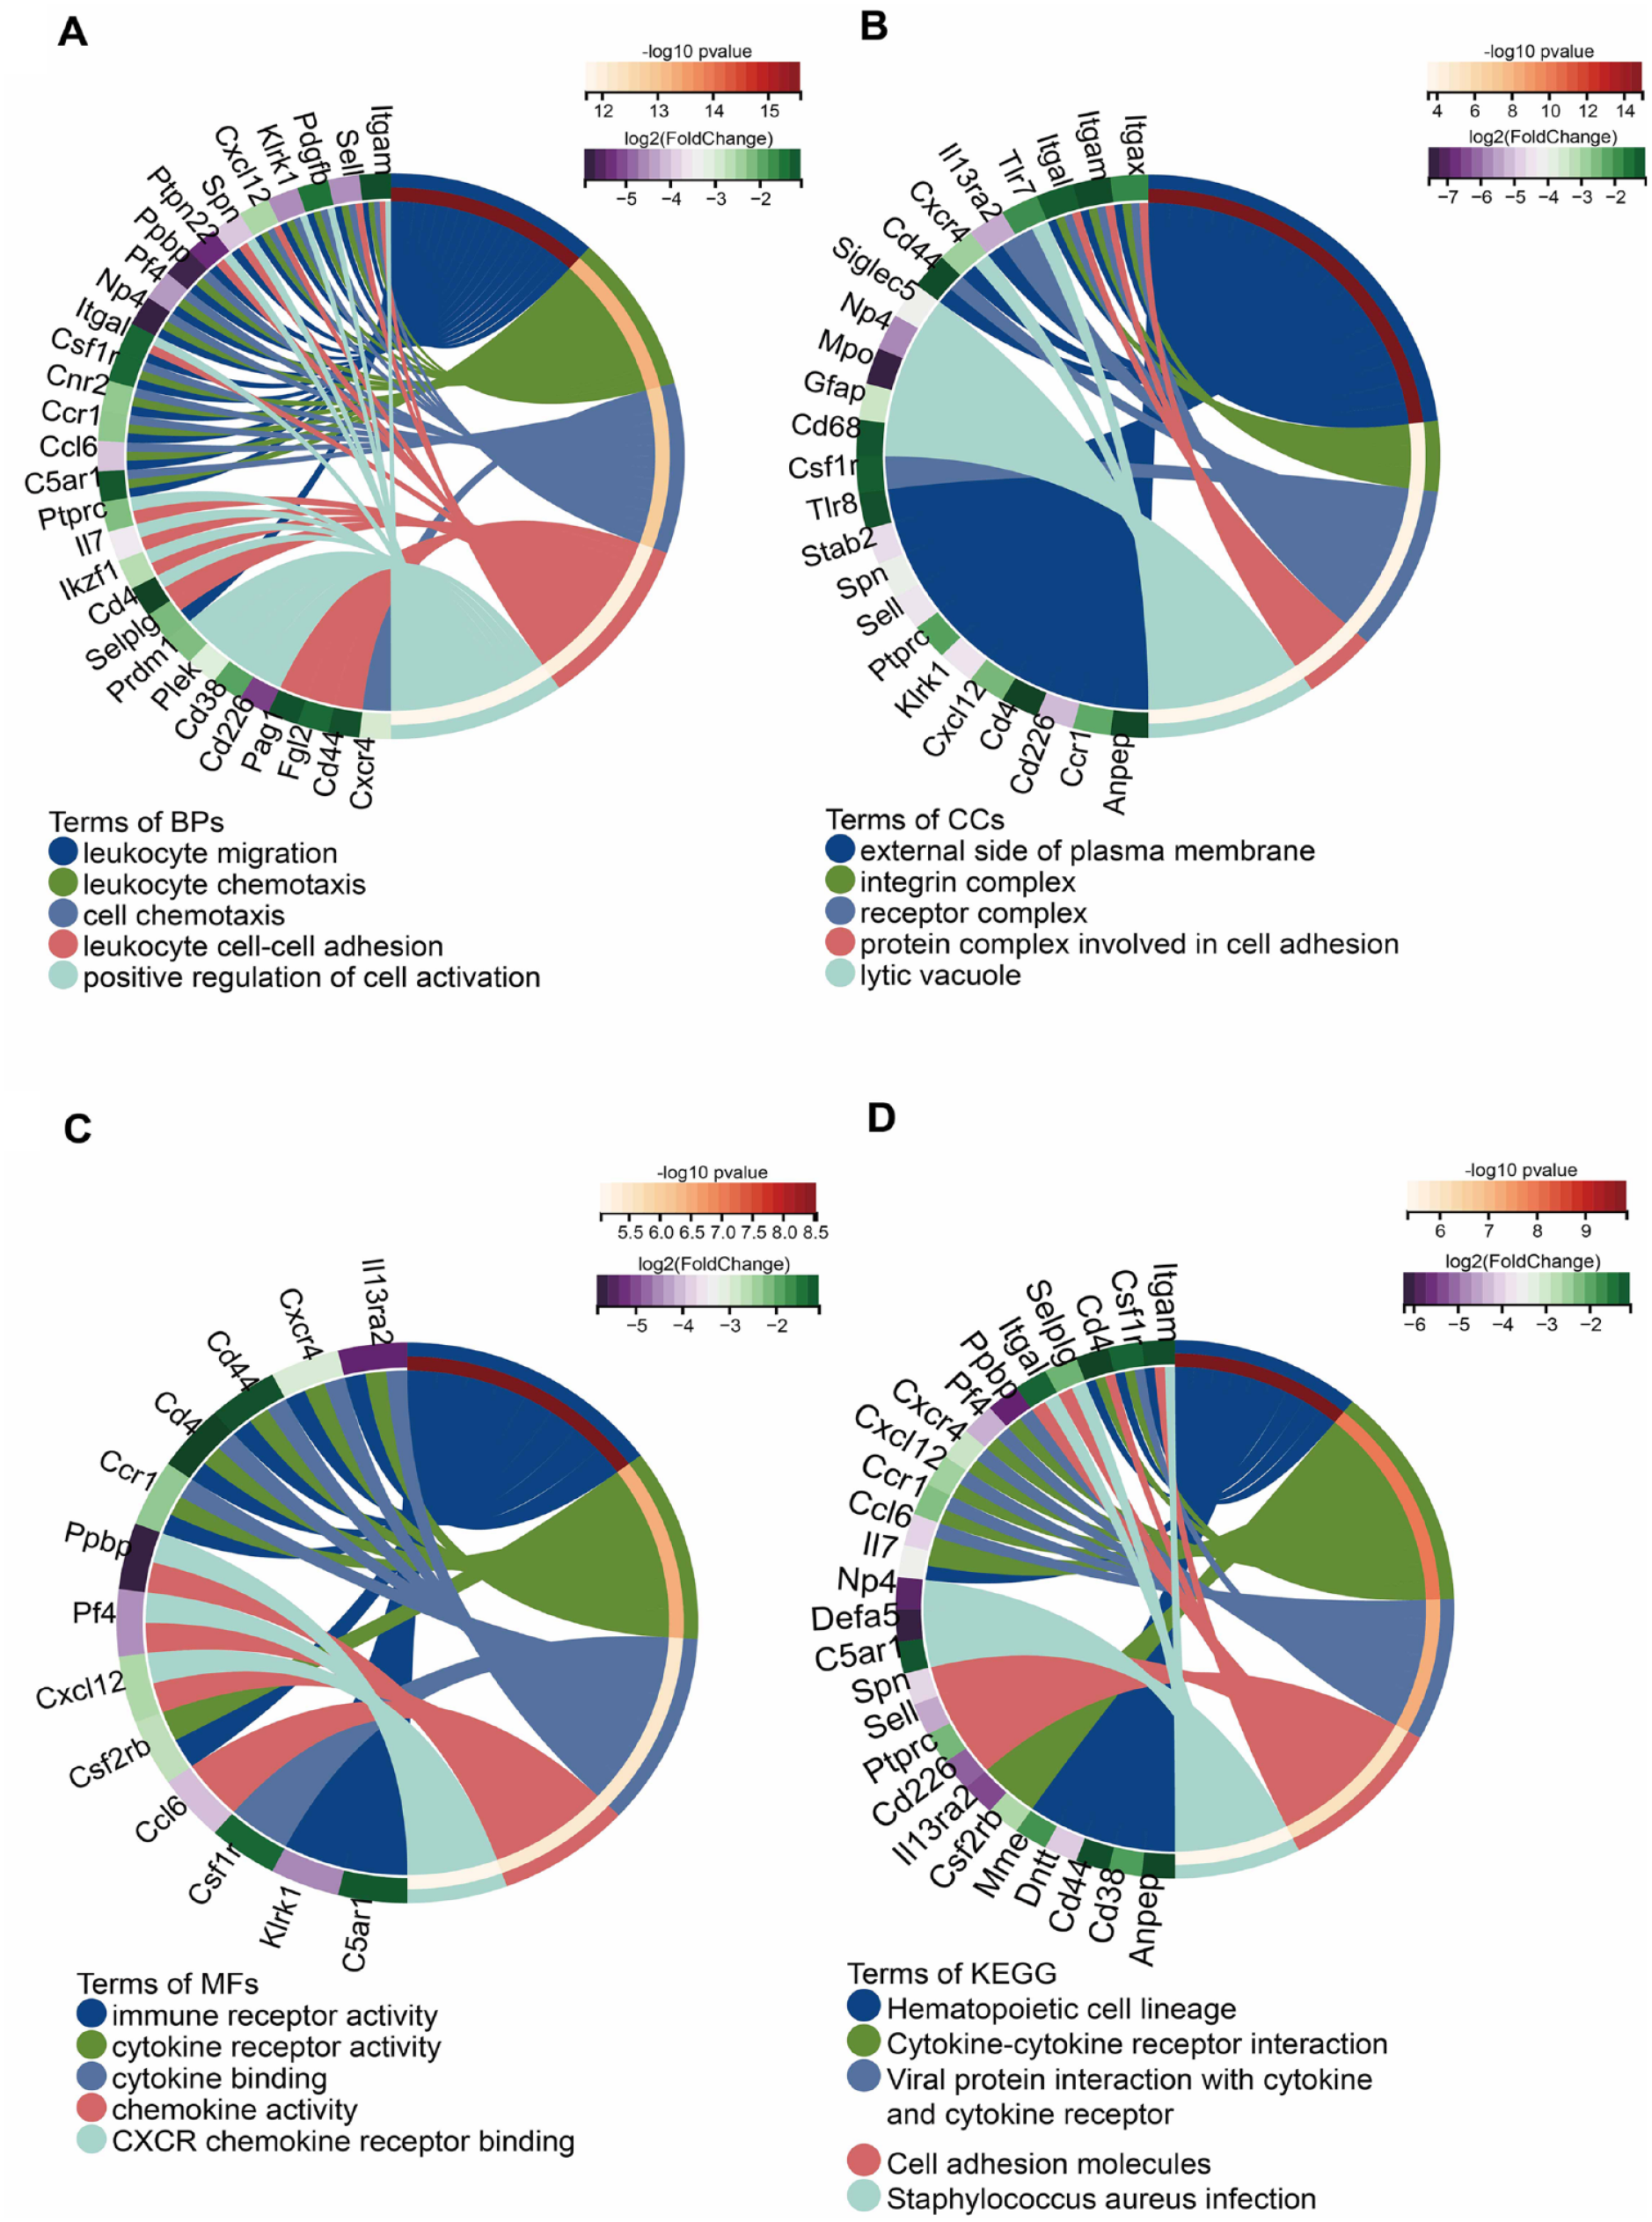
All DEGs were annotated using Gene Ontology (GO) terms and Kyoto Encyclopedia of Genes and Genomes (KEGG) pathways. GO enrichment focused on gene functions and processes. In the GO term enrichment analysis, the top 3 significantly enriched terms in the categories of biological process (BP), cellular component (CC), and molecular function (MF) were “leukocyte migration,” “myeloid leukocyte activation,” and “leukocyte proliferation”; “external side of plasma membrane,” “integrin complex,” and “protein complex involved in cell adhesion”; and “cell adhesion molecule binding,” “cytokine binding,” and “integrin binding,” respectively (
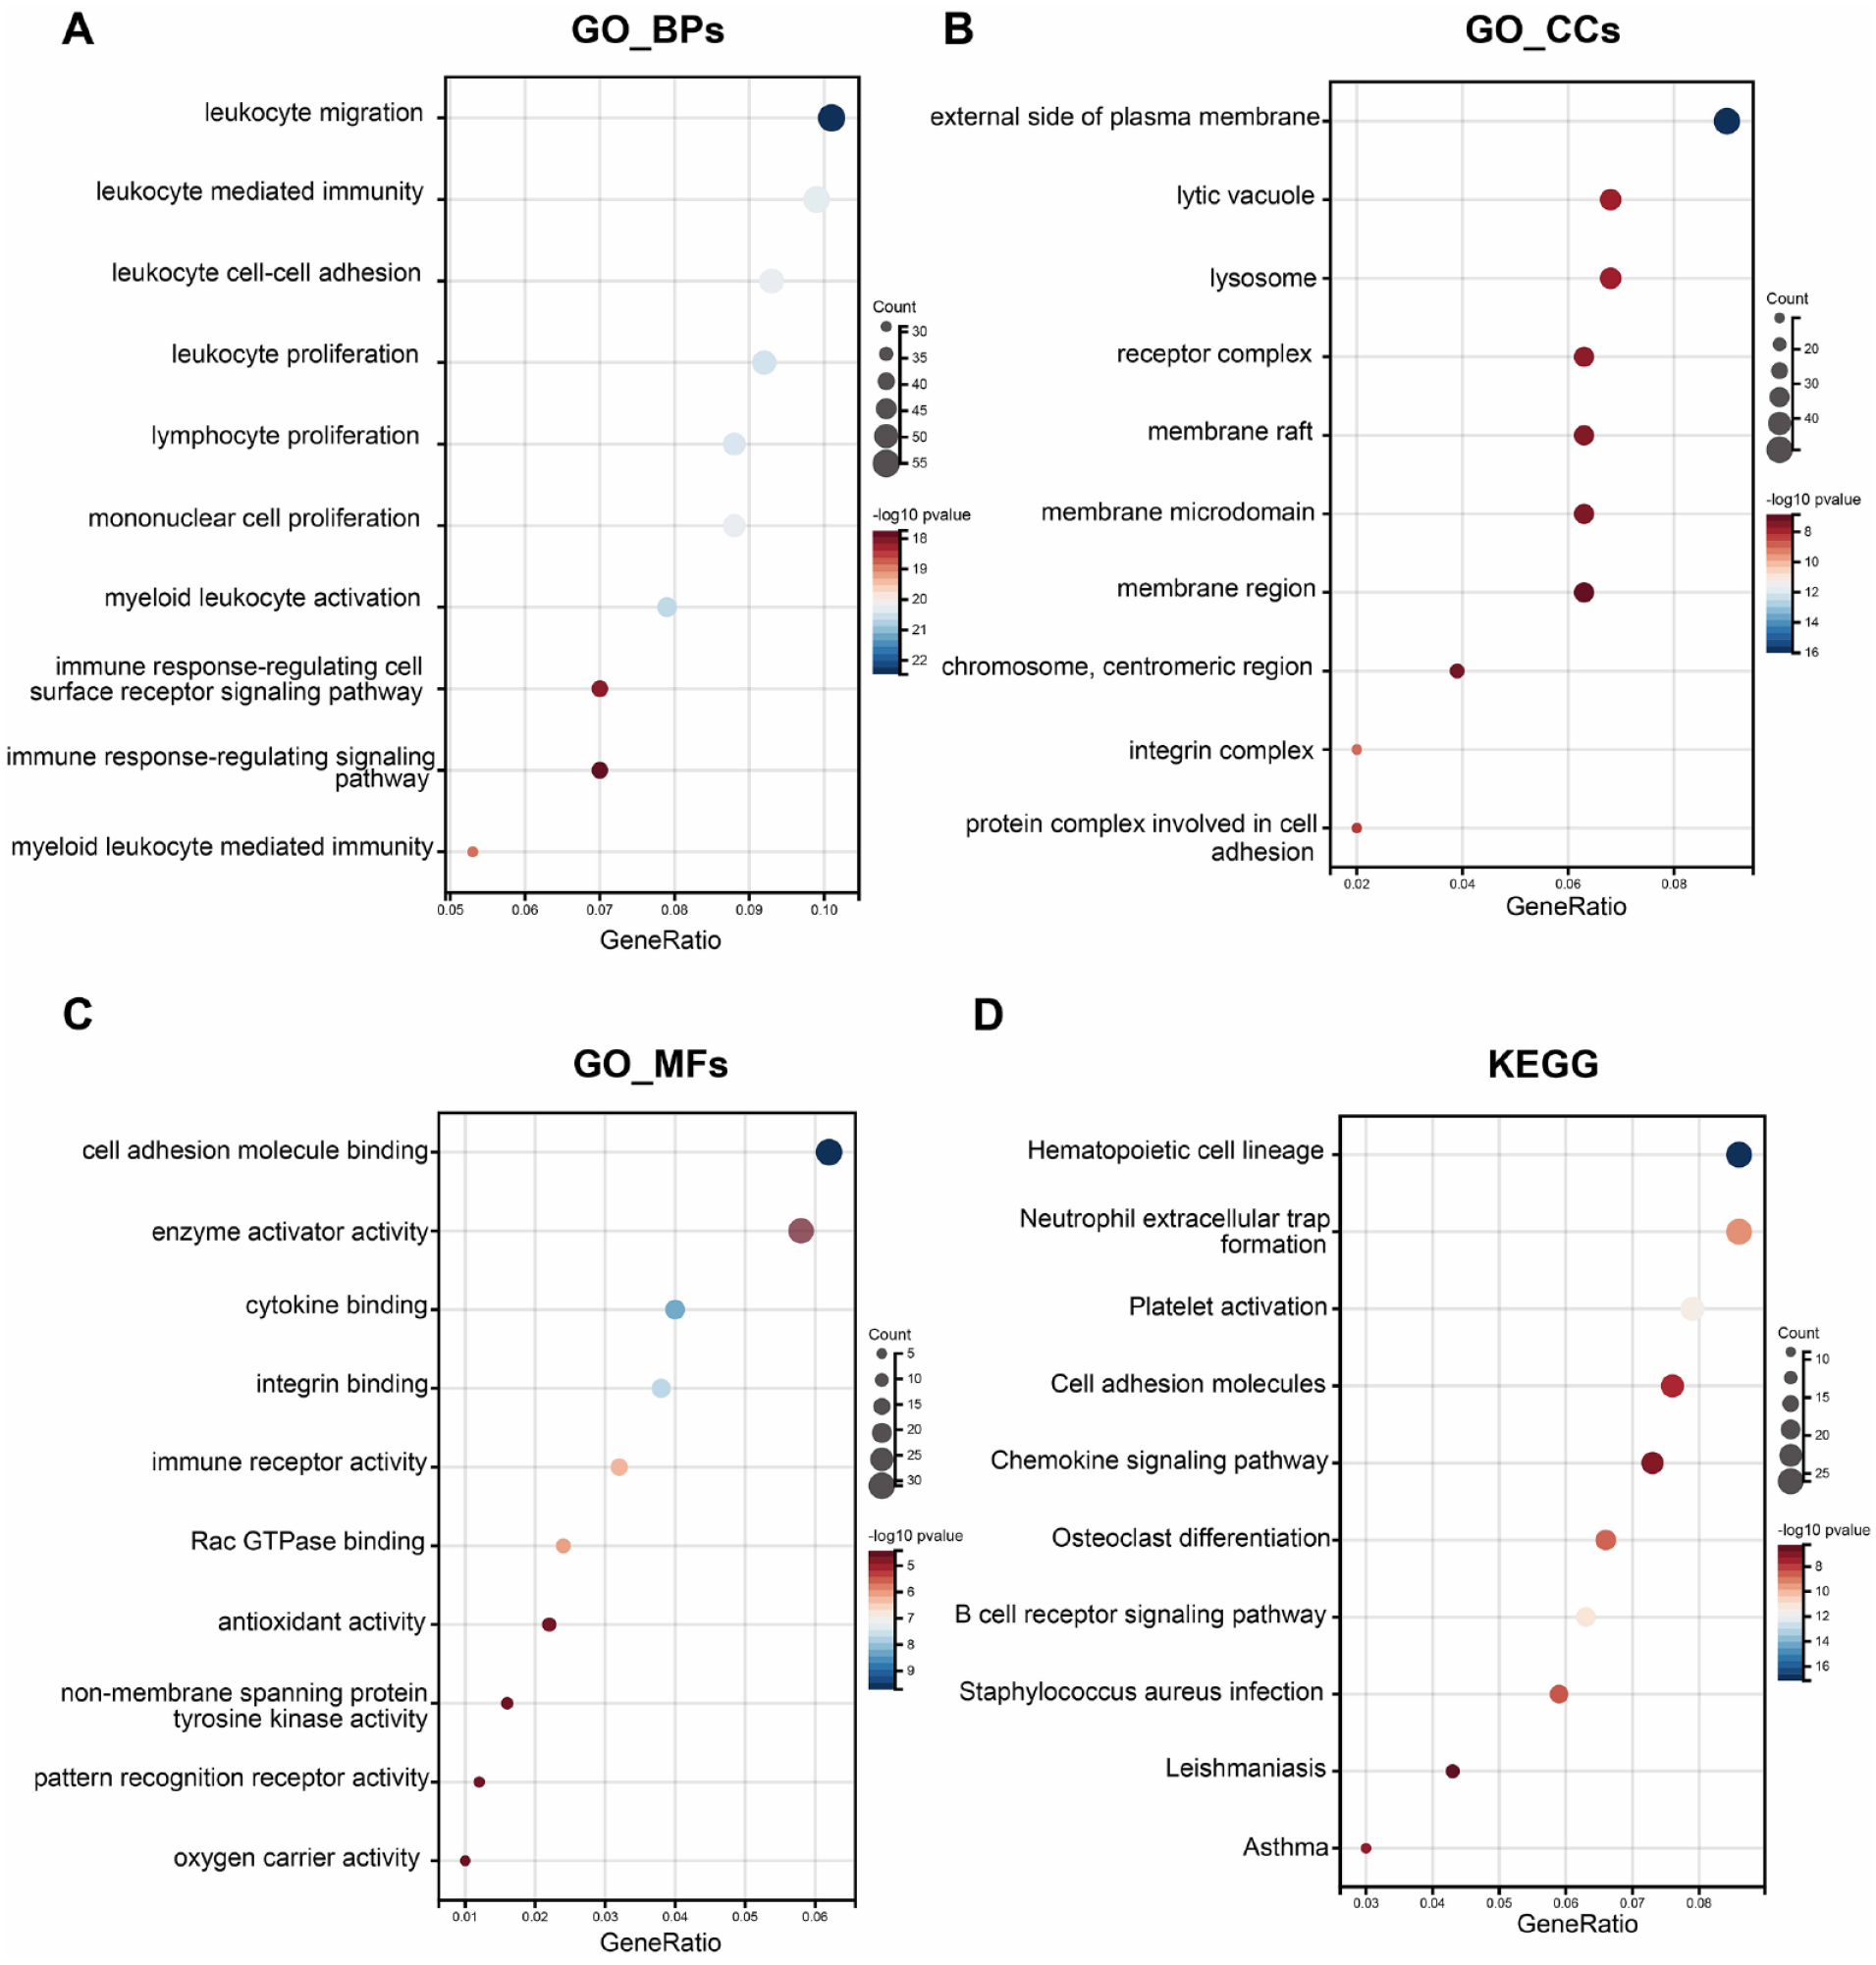
DEG enrichment. (
Removal of the Background Variation
To eliminate the influence of background changes during cartilage tissue development over time, we performed RNA-Seq and data acquisition on normal control cartilage at the same time points to identify control-DEGs. We identified 62 downregulated and 40 upregulated control-DEGs between the control +6 months and control +12 weeks (
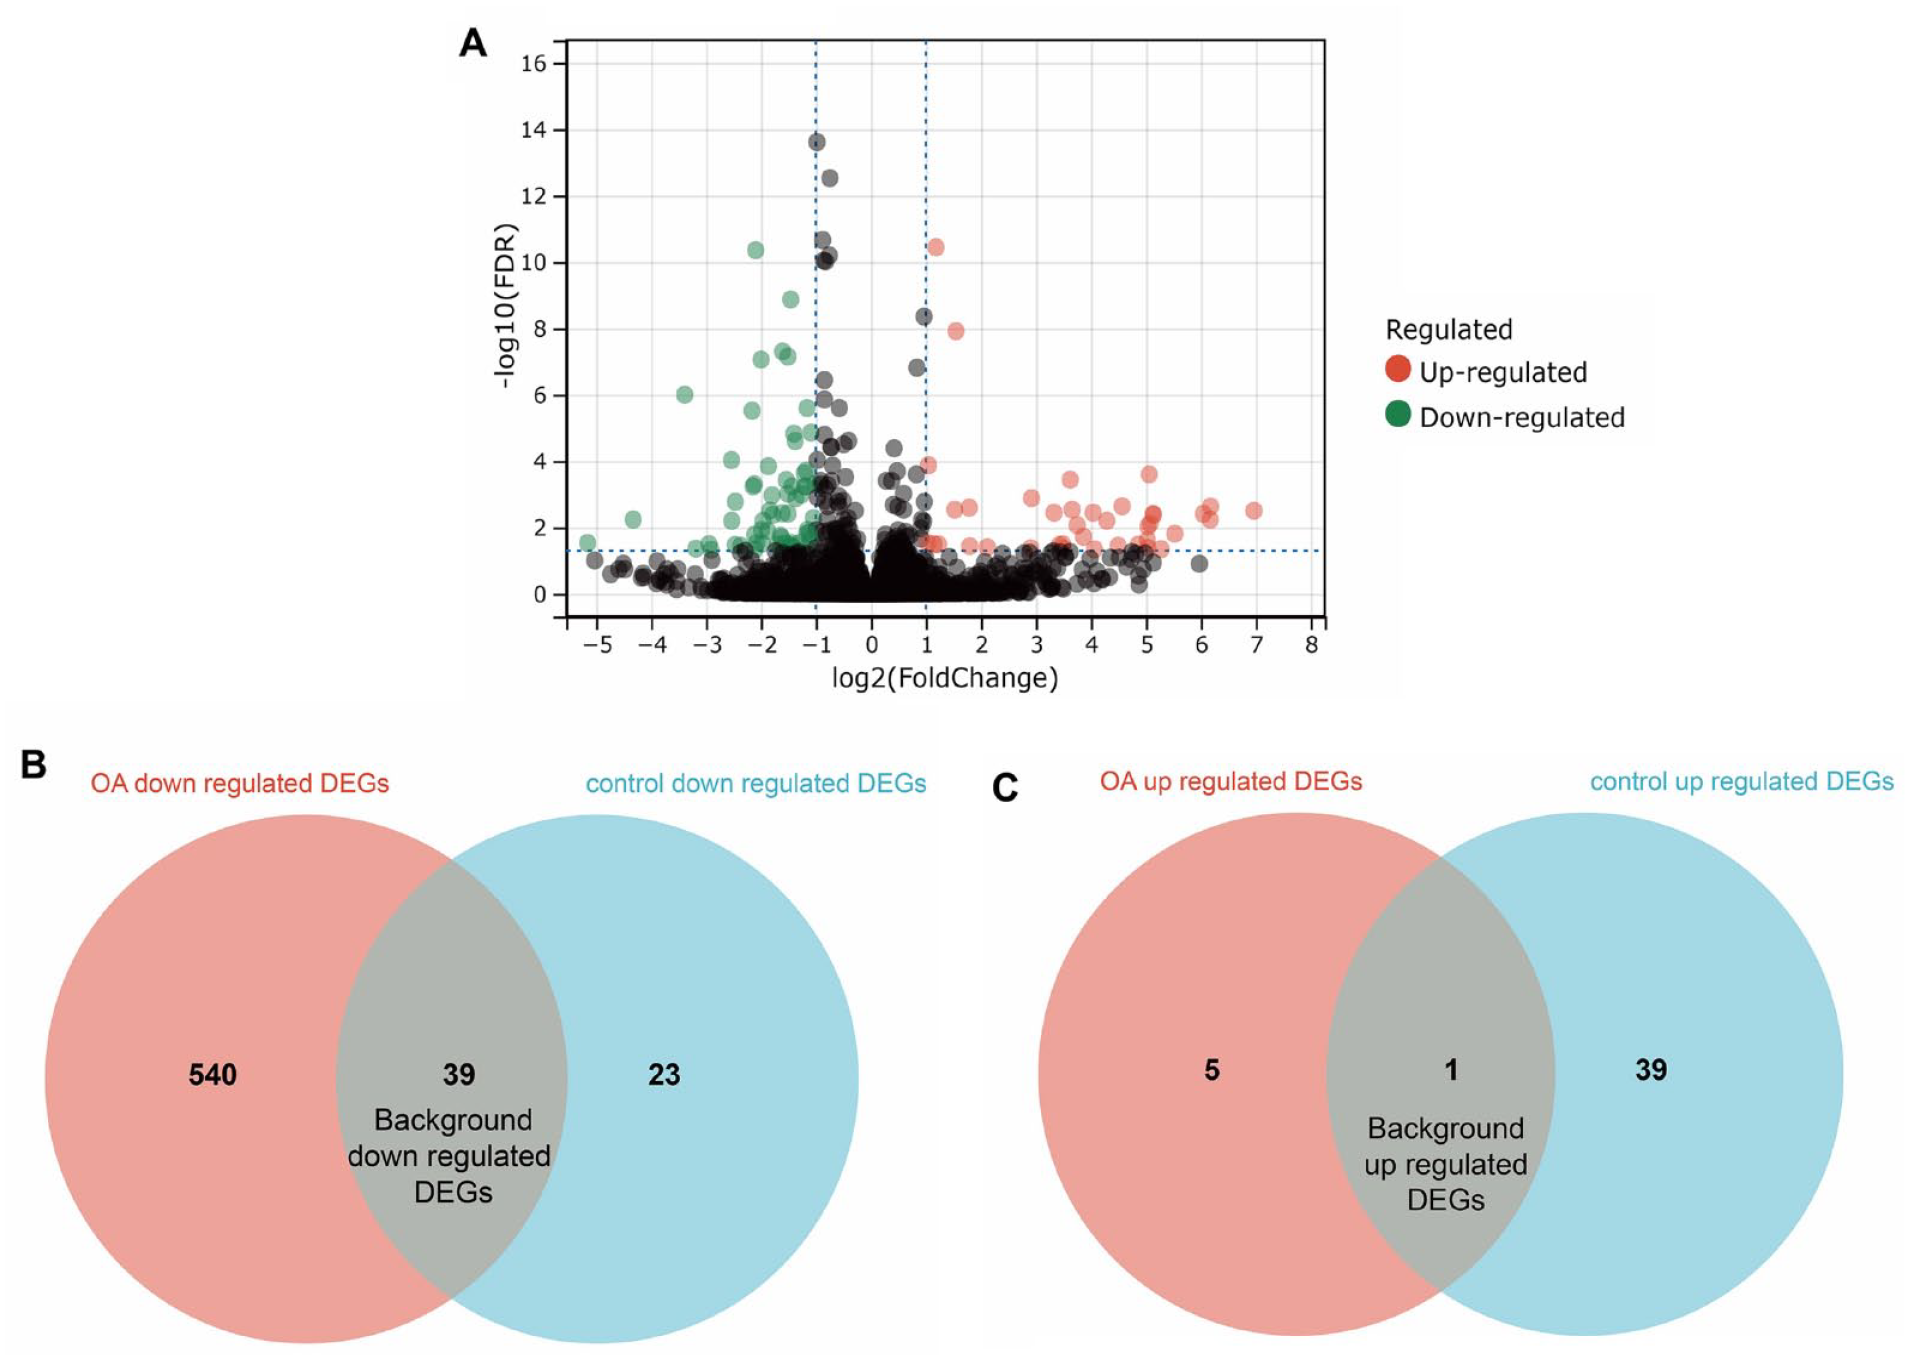
Identification of background variation. (
PPI Network and Identification of Cluster
We constructed a PPI network to explore the interactions between the proteins encoded by the DEGs. Subsequently, we used a Markov clustering algorithm to cluster the molecules, resulting in 114 clusters (Supplement 2). Seven of these clusters contained 10 or more genes (
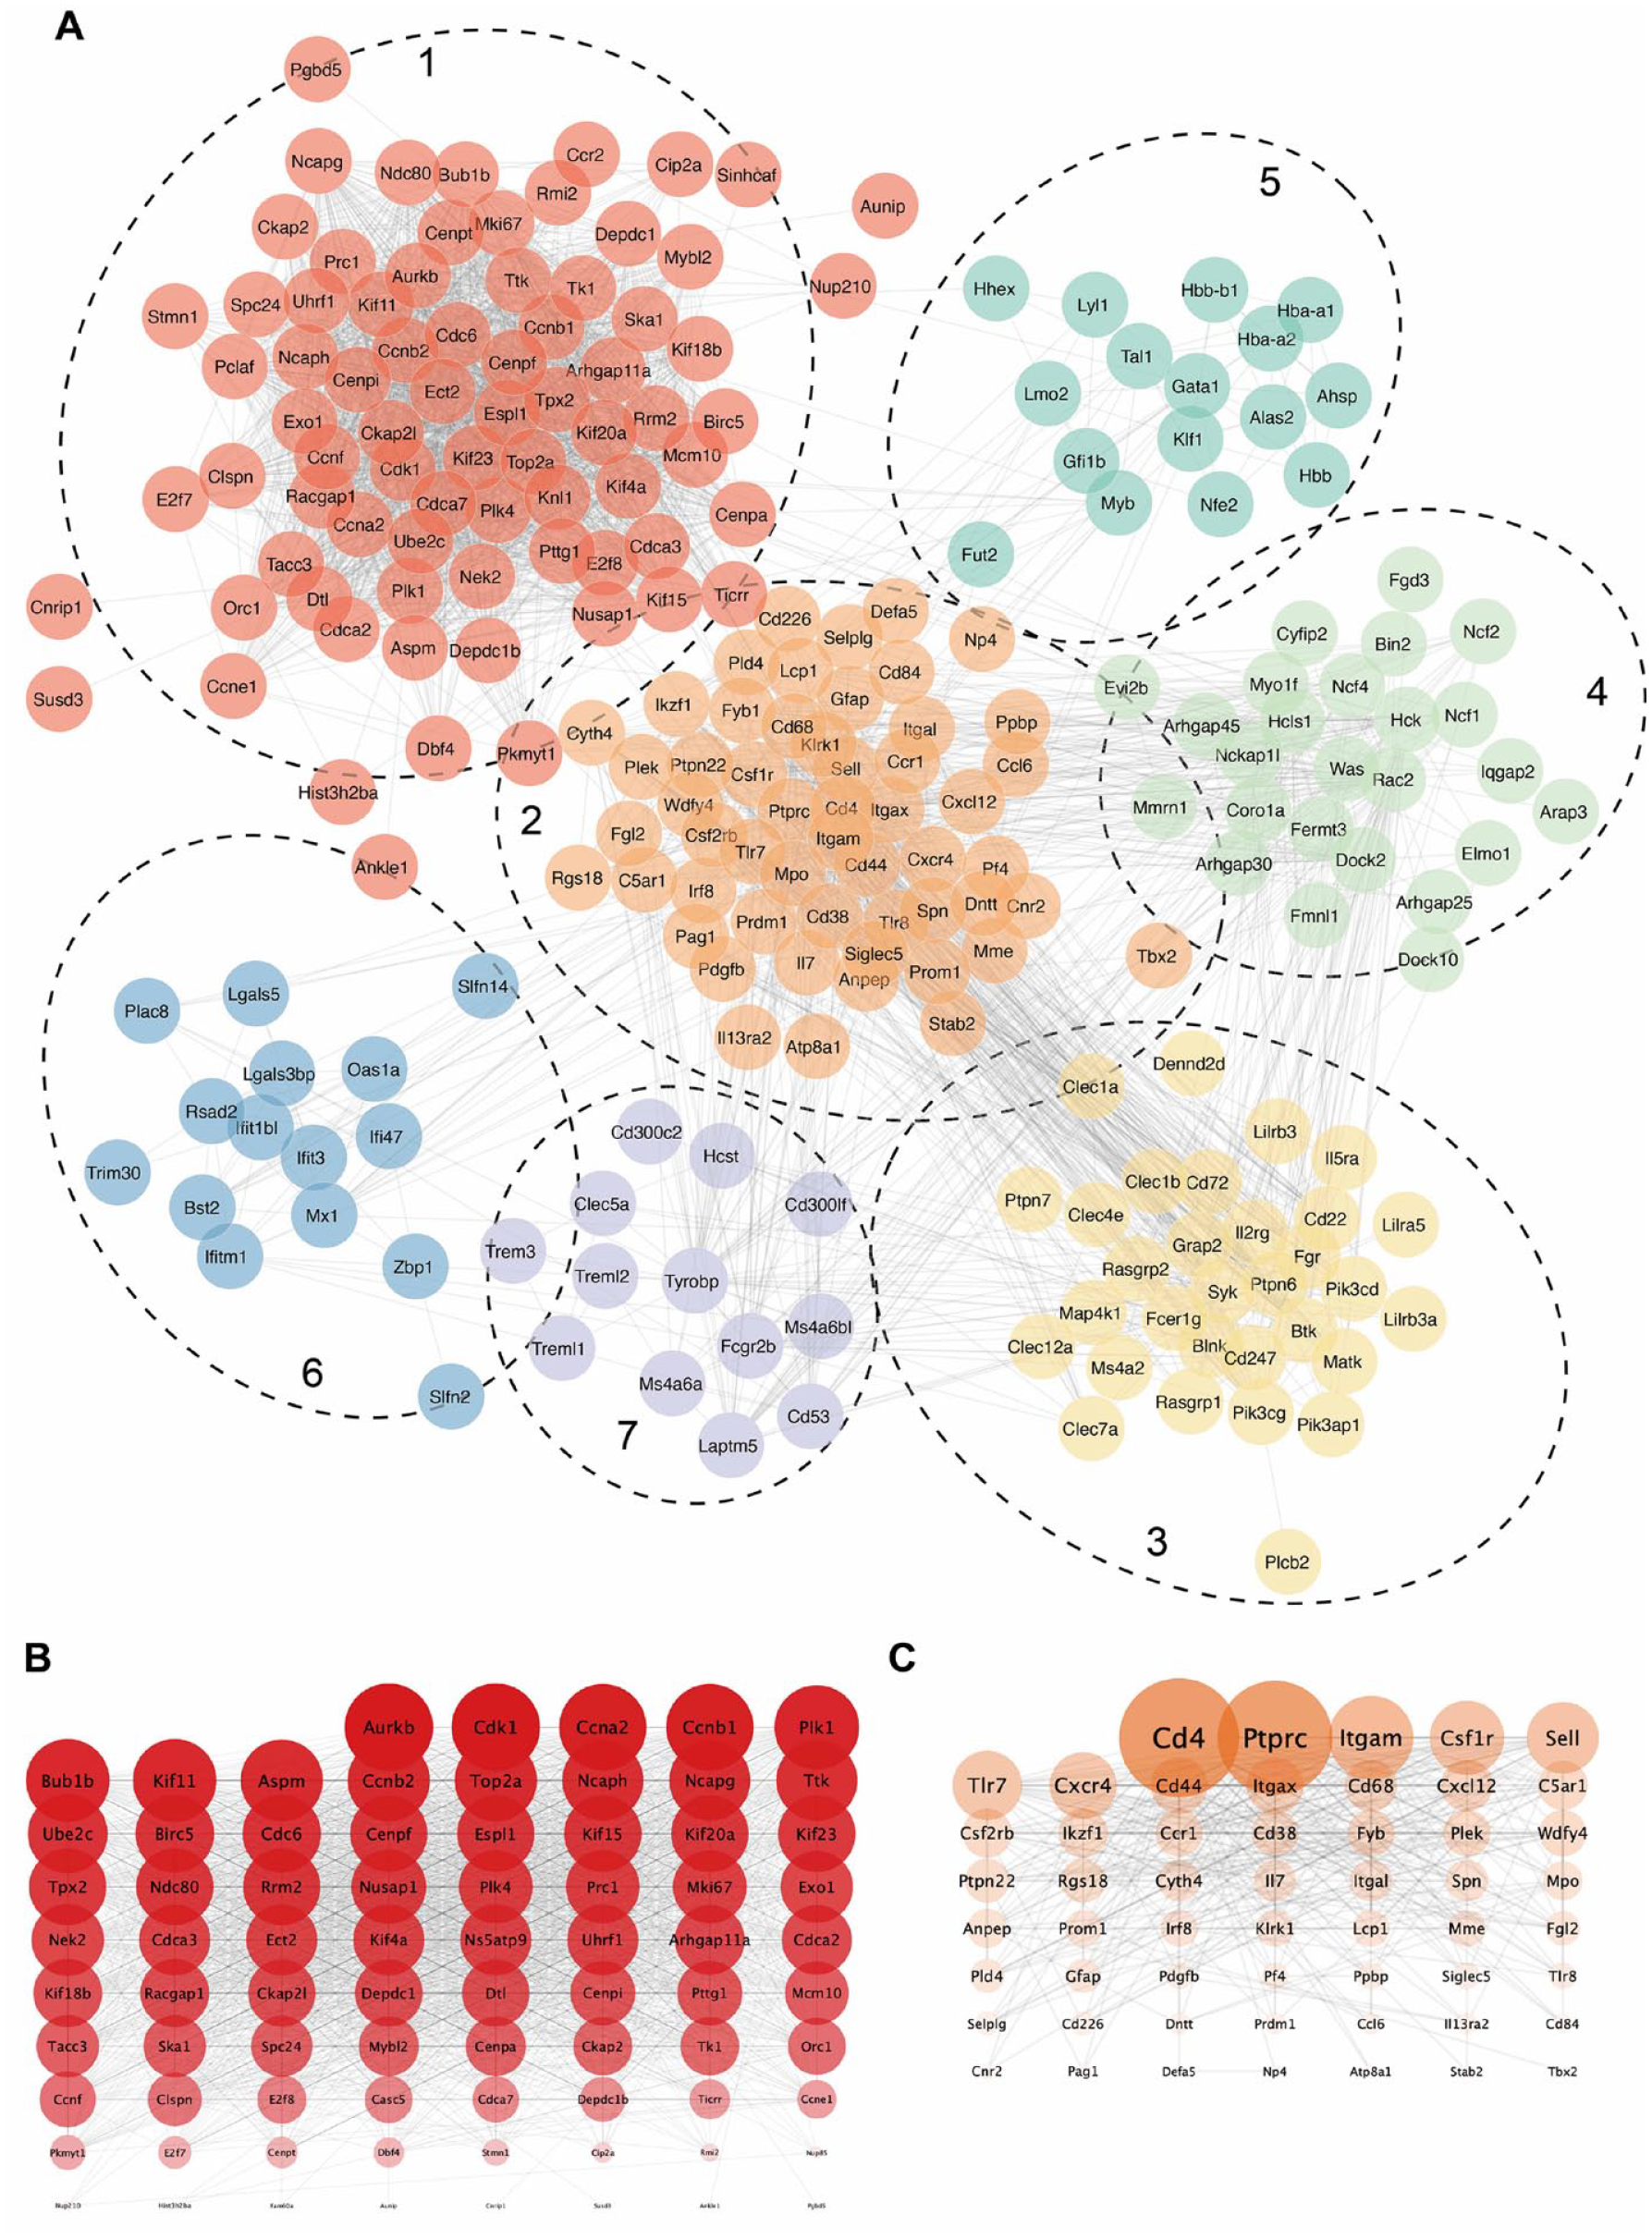
Construction of a PPI network and generation of Markov clustering. (
Cluster-DEG Functional Annotation
Enrichment analyses of Clusters 1 and 2 were performed, annotating them to the GO and KEGG databases. In the GO term enrichment analysis, Cluster 1 genes were found to be associated with cell cycle, with the most significantly enriched BP, CC, and MF terms being “chromosome segregation,” “spindle,” and “microtubule binding,” respectively (
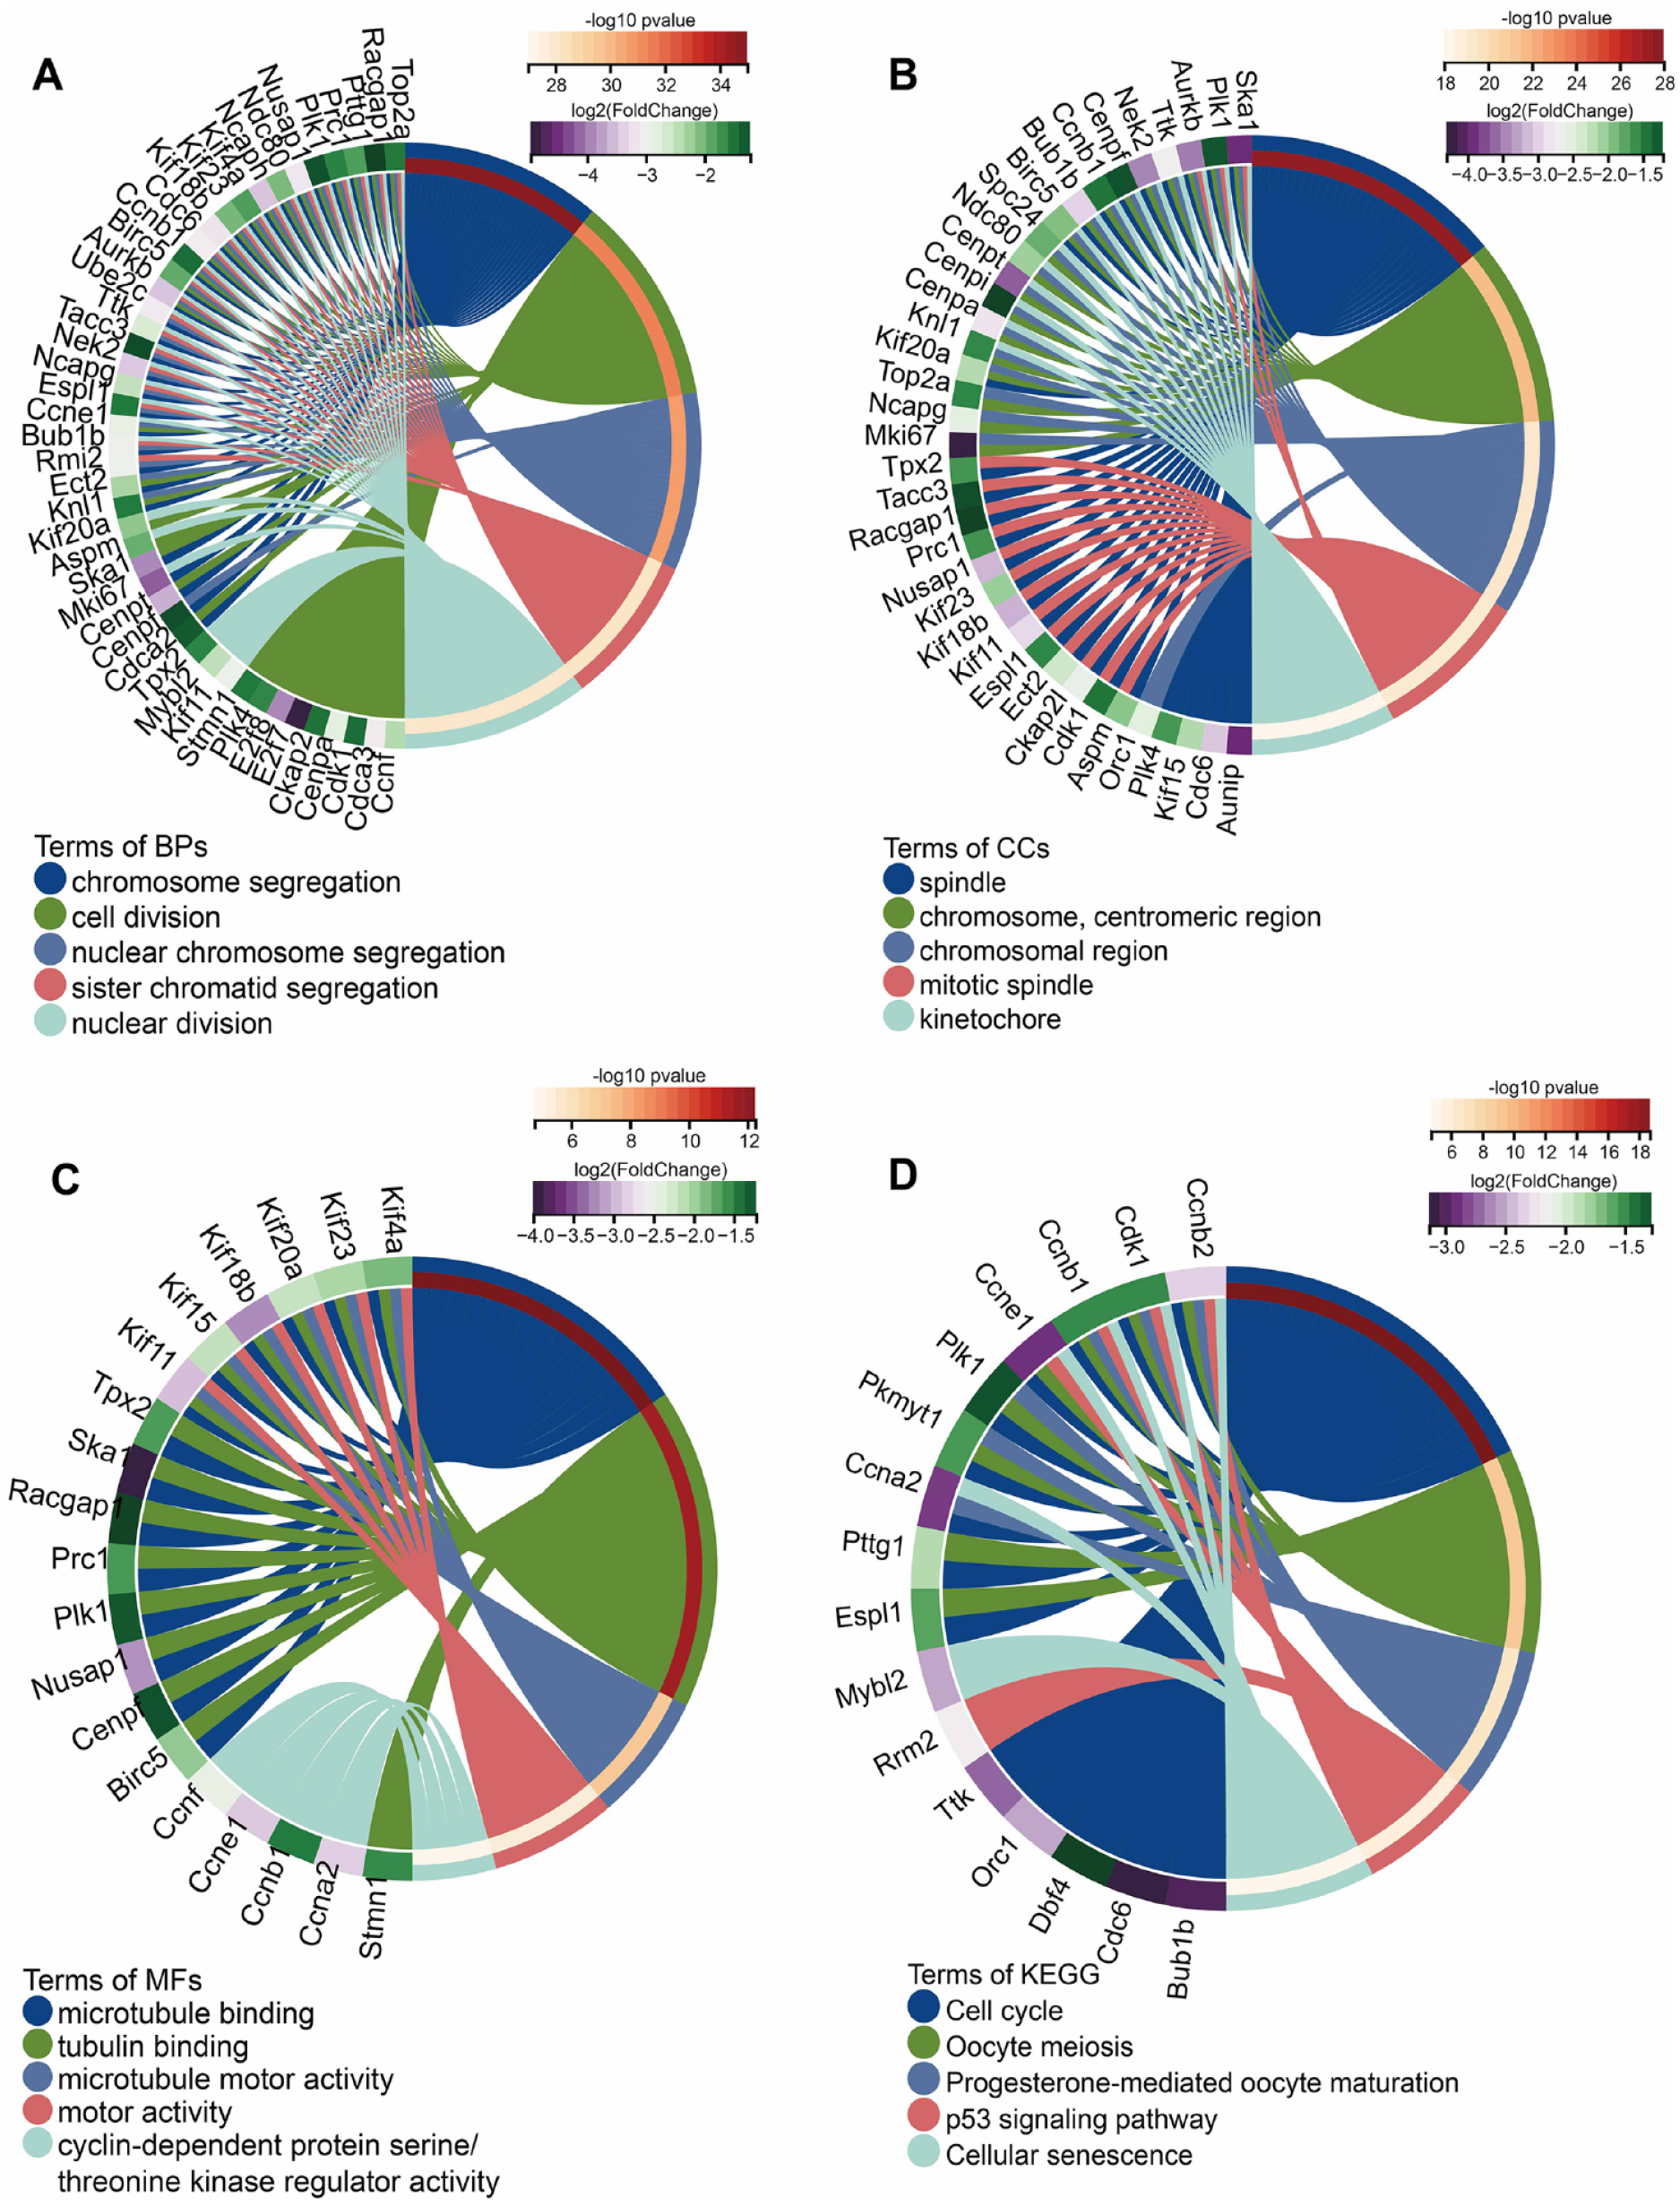
Enrichment analysis of cluster 1 DEGs. (
Enrichment analysis of cluster 2 DEGs. (
Identification of Hub Genes
Since many analytical results point toward immune-related processes, we aimed to further identify hub immune-related genes. Functional module construction using the MCODE plugin in Cytoscape was performed using Cluster 2 DEGs. The results revealed the presence of 3 modules with a top module score of 11.529, comprising 18 nodes and 98 edges. Subsequently, the top 10 hub genes were selected using the 12 different topological methods provided by the CytoHubba plugin in Cytoscape. Among these modules, 10 genes (Ptprc, Tlr7, Csf1r, Cd4, Itgam, Sell, Cd44, Cxcr4, Itgax, and Cxcl12) appeared in over half of the modules ( Table 2 ).
Twelve Topologically Selected Genes.
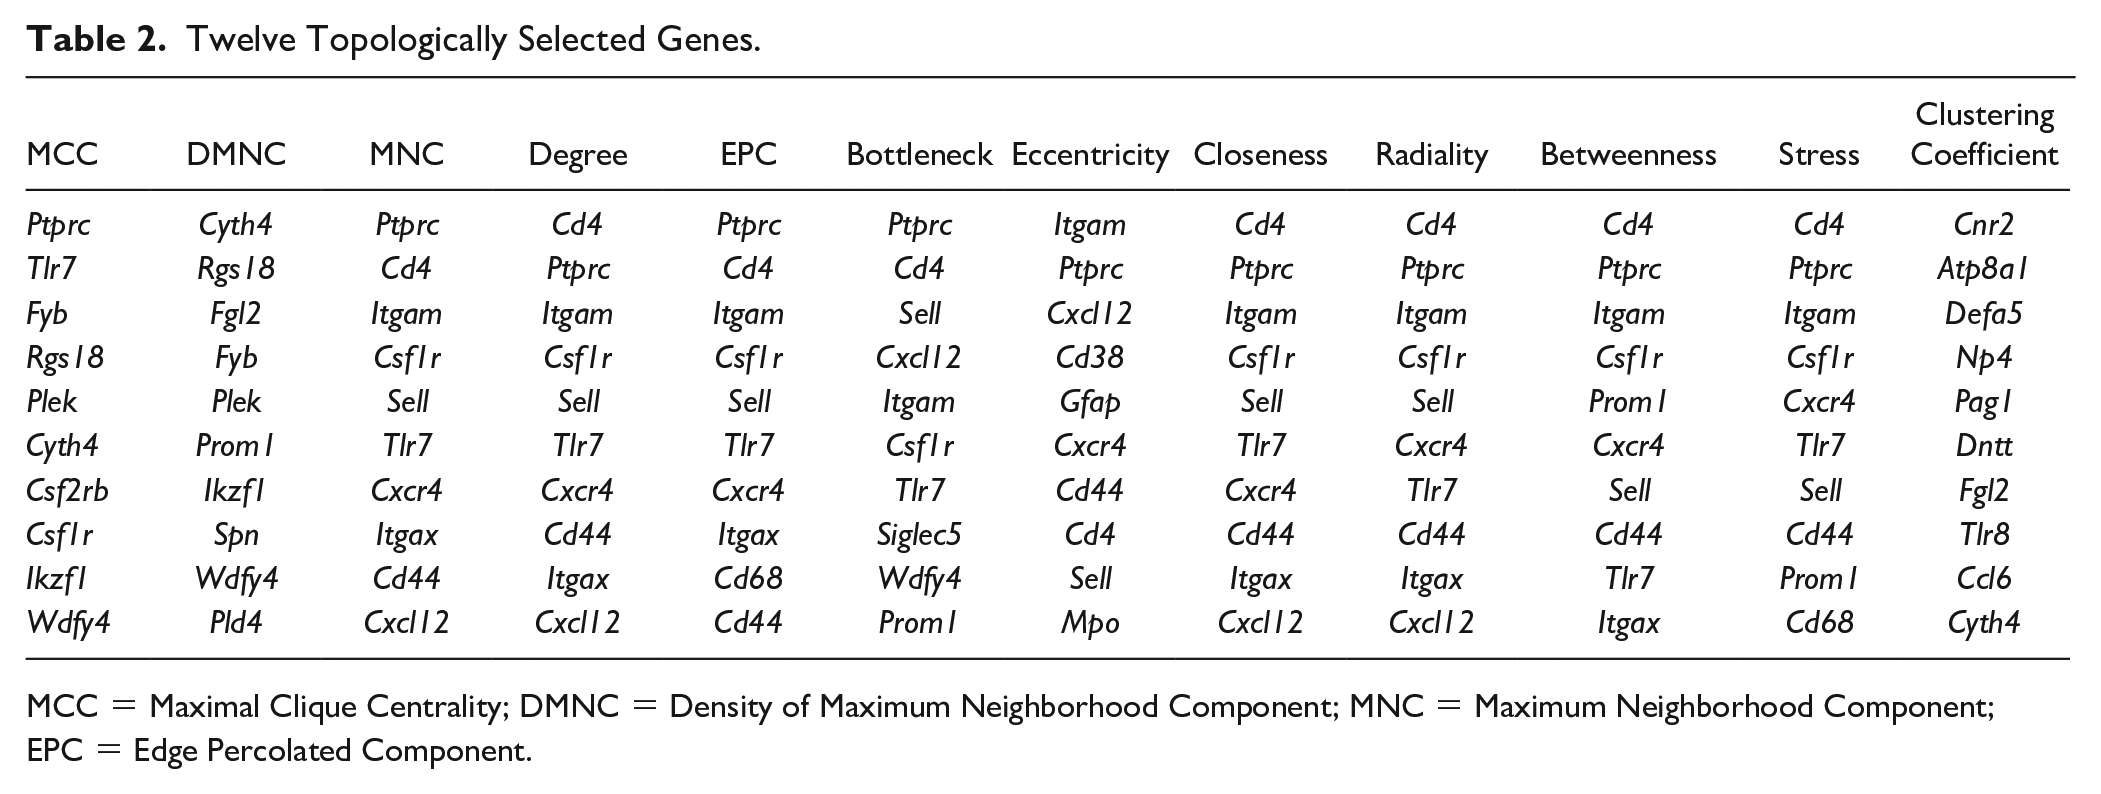
MCC = Maximal Clique Centrality; DMNC = Density of Maximum Neighborhood Component; MNC = Maximum Neighborhood Component; EPC = Edge Percolated Component.
Validation of the Hub Genes
The ability of the hub genes to discriminate between early and late stages of OA in previously published datasets was evaluated. Three GEO datasets were retrieved and integrated. After batch effect removal, the median expression levels were consistent across datasets (
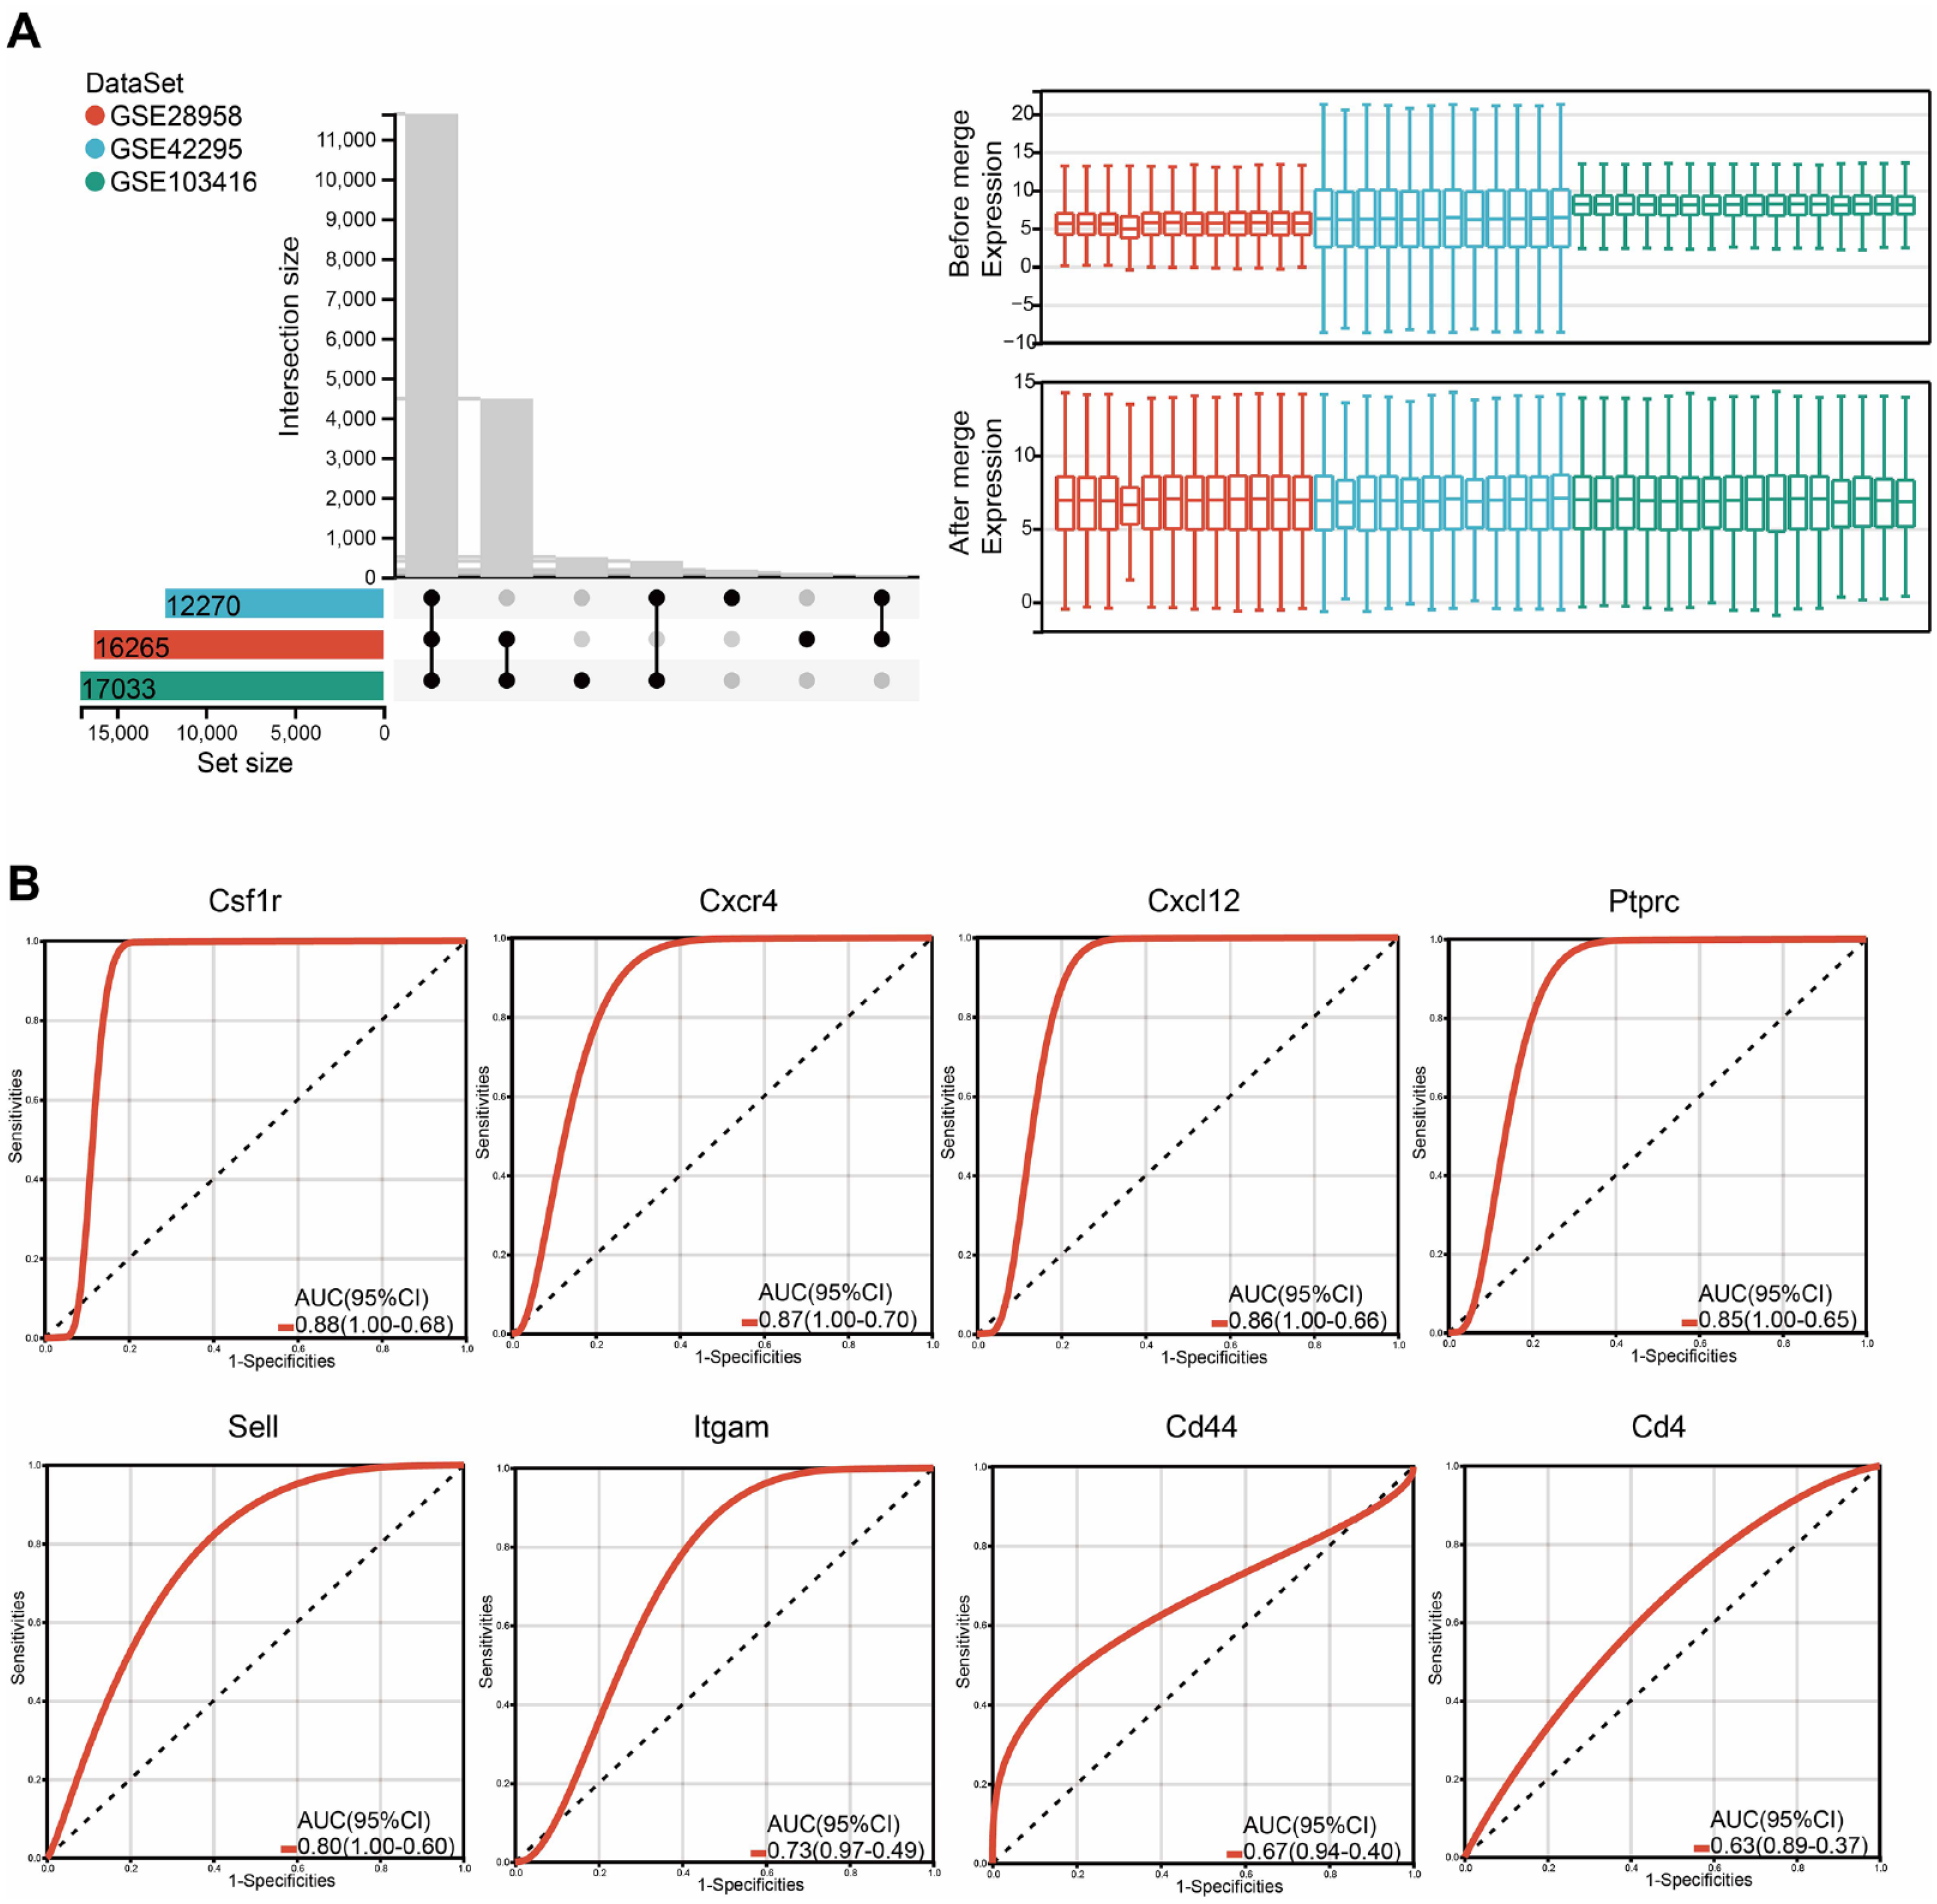
Validation of hub genes. (
Discussion
This study reports the molecular changes and characteristics of the rat knee joint cartilage transitioning from cellular to structural OA damage. Throughout this progression, most DEGs were downregulated, with immunological processes such as the “B-cell receptor signaling pathway” prominently featured. Among these DEGs, a clear cluster emerged: one cluster participated in a series of cell cycle–related BPs, while the other engaged in immune-related processes exemplified by “leukocyte migration.” Importantly, these molecules reflected a decrease in their gene expression compared to early disease, surpassing the levels that could be attributed solely to aging. This suggests a progression of pathology from cellular to structural alterations.
The study of OA progression within a time series is crucial because failure to grasp the progression of the disease can have implications for disease management. However, research on this topic is limited. Most studies have focused primarily on comparing end-stage OA tissues with their normal counterparts. Previously reported upregulated genes in late-stage OA tissues, including cartilage, synovium, and subchondral bone, have exhibited enrichment in pathways and processes associated with protein hydrolysis, extracellular matrix degradation, and collagen breakdown metabolism, whereas downregulated genes are related to cellular proliferation and the responsiveness of cells to stimuli.9,11,23,24 Our results indicate that this downregulation was also significant in OA cartilage over time as the disease progressed from cellular changes to structural damage, suggesting that OA has a relatively long disease course and exhibits distinct BPs at various developmental stages. Early-stage disease is more likely to manifest as initial cellular changes in response to stimuli, whereas late-stage disease is dominated by tissue remodeling characterized by structural alterations in the joint.25,26 In future studies on OA treatment approaches, it may be important to consider the effects of the dynamic nature of the disease itself. Neglecting this aspect may result in incorrect identification or overestimation of treatment effects.
Chondrocytes are the only cell type found in healthy cartilage and are responsible for producing collagen and proteoglycans to maintain the cartilage matrix. 27 In normal joint cartilage, chondrocytes remain quiescent, have ceased differentiation, and maintain an unmineralized matrix.28,29 However, during OA, chondrocytes frequently undergo hypertrophy, followed by matrix alterations leading to cartilage loss. Therefore, the pathogenesis of OA is thought to recapitulate developmental processes. 30 In our study, the KEGG pathway and GO term enrichment analyses revealed numerous important terms associated with cell cycle and mitosis-related processes in Cluster 1 of DEGs. Within Cluster 1, genes involved in the cell cycle and spindle formation, such as Cdk1, Ccnb1, Ccnb2, Aurkb, and Bub1b, were identified. The transcriptional products of these genes exhibit a high degree of interaction with other proteins in the cluster. In addition, Ccnb1, Aurkb, and Bub1b in Cluster1 are involved in chromosome segregation. Cdk1 is a crucial cell mitosis regulator that regulates the transition from the G2 phase to the M phase of the cell cycle by interacting with the cell cycle proteins cyclin A1 and cyclin B1.31,32 Cdk1, Ccnb1, and Ccnb2 of Cluster 1 are involved in the p53 signaling pathway and cellular senescence. Alterations in the expression of these proteins profoundly affect the G2 cell cycle arrest. When their expression is decreased, the cell cycle is halted in the G2/M phase, leading to the inability of cells to undergo mitosis and cell death. 31 p53 plays a critical role in regulating apoptosis33,34 and autophagy, 35 which are typical pathological changes in OA. 36 A previous study has indicated that p53 deletion rescues chondrocyte apoptosis, but fails to enhance chondrocyte proliferation. 37 Aurkb is involved in regulating chromosome alignment and separation during mitosis and meiosis by binding to microtubules. Bub1b is expected to play a role in the mid-to-late transition of the mitotic cell cycle and protein localization to chromosomes and kinetochore regions. Aurkb and Bub1b have been identified as potential target genes in microarray-based studies on OA.38,39
In our study, we observed significant involvement of immune-related mechanisms during the transition from the stage with only cellular changes to the stage with the appearance of structural cystic lesions in the cartilage. In this study, GSEA of all genes expressed at both injury time points demonstrated enrichment of the B-cell receptor signaling pathway. B cells originate from pluripotent hematopoietic stem cells and are part of the adaptive immune system. B-cell response dysregulation can ultimately lead to autoimmunity, 40 making B cells a common target for treating inflammatory arthritis and systemic autoimmune diseases. Recent studies have shown changes in B lymphocyte responses in patients with OA. Chronic B-cell activation occurs in OA, and these changes cannot be solely explained by age. 41 Consistent with our GSEA results, enrichment analyses of k-means clustering and cluster 2 DEGs indicated that immune response–related processes exhibit a significant pattern of transition from the early injury stage to the damage stage. The Csf1r-Cxcl12/Cxcr4 axis found in Cluster 2 is involved in leukocyte-related processes such as leukocyte migration and leukocyte chemotaxis. Csf1r promotes macrophage differentiation, activation, and osteoclastogenesis. 42 Csf1r has been reported to participate in various processes, including osteoclast differentiation regulation and bone resorption modulation. 43 Studies have shown that inhibiting Csf1r expression has a protective effect on bone and cartilage in experimental arthritis.44,45 The Csf1r-Cxcl12/Cxcr4 axis may play a crucial role in the inflammatory response of OA, and our validation using external datasets also demonstrated that these molecules exhibit the best classification performance. Ptprc is an important antigen receptor signaling regulator in T cells and B cells. 46 It plays a role in modulating the JAK/STAT pathway targeted in inflammatory diseases. 47 A previous study has indicated that the loss of Ptprc leads to an increase in JAK/STAT signaling. 48
The distinctive feature of the compression model utilized in this study lies in its relatively mild dose, which does not immediately induce substantial structural changes in the joint, but rather triggers only minor cellular alterations. This sets it apart from many other commonly employed PTOA models that induce rapid OA onset and progression through high-energy physical impacts or surgical procedures. For example, rats underwent anterior cruciate ligament transection and partial medial meniscectomy, followed by three 30-minute sessions of forced exercise each week. After only 4 weeks, disordered cartilage fiber alignment became evident. 21 Macroscopic cartilage damage was observed, and a significant reduction in cartilage thickness was noted within 9 days of injecting monoiodoacetic acid into the rat knee joint. After 21 days, nearly the entire cartilage layer had disappeared. 22 These rapid models help shorten the experimental timeline but cannot accurately reflect OA. A slower disease progression may provide a favorable window of opportunity for research into the prevention and intervention of PTOA. It is worth noting that despite the use of various methods to induce the rapid onset and progression of OA, the hub genes we selected performed well in distinguishing between the early injury and damage stages of KOA. This corroborates the existence of a stage, regardless of the triggering event, where cartilage function remains intact; however, BPs at the cellular level have already commenced joint degradation. 7 This stage represents the optimal opportunity for implementing intervention measures to prevent irreversible structural damage.
This study had several limitations. First, it was conducted with only male animals, and further investigations are warranted to assess the impact of sex and validate the findings in human samples. Second, owing to experimental constraints, we compared different individuals at different time points of development, and additional experimental methods should be designed to include self-control within the same individual. Finally, although our study aimed to provide an overview of the changes in mRNA and protein levels during the transition from the early injury to the damage stage, we did not include numerous samples in our analysis. Furthermore, since all samples are from the early injury to the damage stage and given that our sample size was small, individual variation between samples likely influenced the correlation analysis and PCA results. Our DEG threshold was set conservatively to avoid false negatives. Future studies should use larger sample sizes. Additional omics studies, single-cell analyses, and laboratory experiments can improve our understanding of this disease.
In summary, observing and comparing the different stages of KOA according to the duration of OA is necessary. In our study, we observed downregulation of genes from the early injury stage to the damage stage of KOA. The molecules encoded by these genes exhibit 2 distinct patterns: one is involved in the transition of chondrocytes from a quiescent state to a differentiated state, accompanied by cell death, and the other is involved in immune-related processes, indicating immune dysregulation within the cartilage microenvironment. Csf1r, Cxcr4, Cxcl12, Ptprc, Sell, Itgam, Cd44, and Cd4 may be key candidate genes for immune-related patterns. However, further research is required to elucidate the functional roles of these important genes and their causal relationships with immune responses. These results will be useful for future research on the prevention and treatment of KOA.
Supplemental Material
sj-xlsx-1-car-10.1177_19476035231213174 – Supplemental material for Analysis of Molecular Changes and Features in Rat Knee Osteoarthritis Cartilage: Progress From Cellular Changes to Structural Damage
Supplemental material, sj-xlsx-1-car-10.1177_19476035231213174 for Analysis of Molecular Changes and Features in Rat Knee Osteoarthritis Cartilage: Progress From Cellular Changes to Structural Damage by Zixi Zhao, Akira Ito, Hiroshi Kuroki and Tomoki Aoyama in CARTILAGE
Supplemental Material
sj-xlsx-2-car-10.1177_19476035231213174 – Supplemental material for Analysis of Molecular Changes and Features in Rat Knee Osteoarthritis Cartilage: Progress From Cellular Changes to Structural Damage
Supplemental material, sj-xlsx-2-car-10.1177_19476035231213174 for Analysis of Molecular Changes and Features in Rat Knee Osteoarthritis Cartilage: Progress From Cellular Changes to Structural Damage by Zixi Zhao, Akira Ito, Hiroshi Kuroki and Tomoki Aoyama in CARTILAGE
Footnotes
Author Contributions
All authors were involved in drafting and revising the manuscript and approved the final version for publication. Study conception and design: Zixi Zhao, Akira Ito, Tomoki Aoyama, and Hiroshi Kuroki. Analysis and interpretation of data: Zixi Zhao and Akira Ito. Zixi Zhao drafted the manuscript.
Acknowledgments and Funding
We thank the Single-cell Genome Information Analysis Core (SignAC) at WPI-ASHBi, Kyoto University, for their support. The author(s) disclosed receipt of the following financial support for the research, authorship, and/or publication of this article: This work was supported by JST SPRING, grant JPMJSP2110 (ZZ), JSPS KAKENHI, grants JP21H03302 (AI), JP21K19709 (HK), JP23H03245 (HK), and JP18H03129 (HK).
Declaration of Conflicting Interests
The author(s) declared no potential conflicts of interest with respect to the research, authorship, and/or publication of this article.
Ethical Approval
This study was approved by the Animal Research Committee of Kyoto University (approval number: Medkyo21082).
Data Availability
Computational methods were implemented in the R package, which can be downloaded from various websites. All external dataset data can be found in GEO under the accession code. All other data are available in the manuscript and supplementary files.
References
Supplementary Material
Please find the following supplemental material available below.
For Open Access articles published under a Creative Commons License, all supplemental material carries the same license as the article it is associated with.
For non-Open Access articles published, all supplemental material carries a non-exclusive license, and permission requests for re-use of supplemental material or any part of supplemental material shall be sent directly to the copyright owner as specified in the copyright notice associated with the article.