
Abstract
Objective
To investigate the characteristics of the anterior tibiotalar fat pad (ATFP) in the ankle joint in a population of patients 1 year after an ankle sprain and its correlation with systemic factors and local articular pathology.
Design
The study is a secondary analysis of an observational case-control study. We included 206 patients who were followed 6-12 months after ankle sprain. T1 MRI scans were assessed for signal intensity and area of ATFP by mapping the fat pad using dedicated imaging software (Mimics 18.0). Quantitative values of intensity and area were generated. Linear regression analysis was used to examine the association between both local and systemic factors and the ATFP. Variables with a P value <0.2 were entered in 5 stepwise multivariate models: (1) age-sex-body mass index (BMI); (2) anamnesis; (3) physical examination; (4) radiographic findings; and (5) MRI findings. Predictors in these separate models were entered in the final model.
Results
The final multivariate model showed a significant positive association between age (P = 0.04; 95% confidence interval [CI] = 1.13 ± 1.06), BMI (P = 0.05; 95% CI = 3.61 ± 3.53), and sex (P < 0.01; 95% CI = −49.26 ± 30.04) with T1 intensity. The final model also showed a significant negative association between age (P < 0.01; 95% CI = −0.57 ± 0.34), diffuse cartilage loss in the lateral talus (P = 0.03; 95% CI = −0.71 ± 0.63), and Kellgren and Lawrence score in the tibiotalar joint (P < 0.01; 95%CI = −21.61 ± 7.24) and ATFP area. A positive association was found between BMI (P < 0.01; 95% CI = 2.25 ± 1.15) and ATFP area.
Conclusion
This study demonstrates a correlation between ATFP and both systemic factors and local pathology in the ankle joint.
Introduction
Obesity features prominently as an important risk factor for the development of osteoarthritis (OA) next to trauma and age. 1 Increased strain by excessive loading of weightbearing joints and associated changes in joint kinematics may lead to the initiation and progression of OA.2,3 However, the risk of OA in non-weightbearing joints such as joints of the hand is also increased in obese people. 4 Both systemic adiposity and pathological processes in local joint-associated fat tissue may contribute to this enhanced susceptibility. 5
Patients with central obesity have higher risk and disease severity of OA. This could be explained by the high amount of visceral adipose tissue, known to secrete more proinflammatory cytokines compared with peripheral subcutaneous adipose tissue. 6 It is composed of adipocytes, macrophages, lymphocytes, and granulocytes. Thus, adipose tissue may influence the OA disease process by the production of inflammatory mediators. Locally, in the knee joint, the infrapatellar fat pad (IPFP) is also a source of inflammatory mediators. IPFP inflammation, reflected by signal alterations on MRI, may already be present in early stages of OA. 7
Besides mechanical damage, trauma can induce joint inflammation by activation of inflammatory responses in synovium, bone, and cartilage. In the knee joint, the IPFP is also considered to be involved. The presence and type of macrophages in the IPFP are influenced by the presence of intra-articular pathology, with a tendency toward more proinflammatory macrophages after rupture of the anterior cruciate ligament. 8 Activated macrophages secrete cytokines, interleukins, growth factors, and adipokines that may induce inflammatory and destructive responses in the cartilage and the synovium. As such, they are highly important in the postinjury phase and the eventual progression toward OA in the knee joint. 5
The ankle also contains a fat pad, which can be defined as the anterior tibiotalar fat pad (ATFP). 9 The ATFP is located posterior to the extensor tendon sheaths and attaches to the periost of the tibia 1 cm proximal from the talocrural joint. Mediolaterally, it reaches up to the deltoid ligament and the anterior talofibular ligament. Inferiorly, it is delimited by the neck of the talus ( Fig. 1 ). As anatomical variants of the IPFP are well described, differences in anatomy of the ATFP may also exist. 10 We hypothesize that the characteristics of the ATFP such as volume and signal intensity change after ankle trauma and that it mediates OA onset by initiating post-traumatic inflammation in the tibiotalar joint.
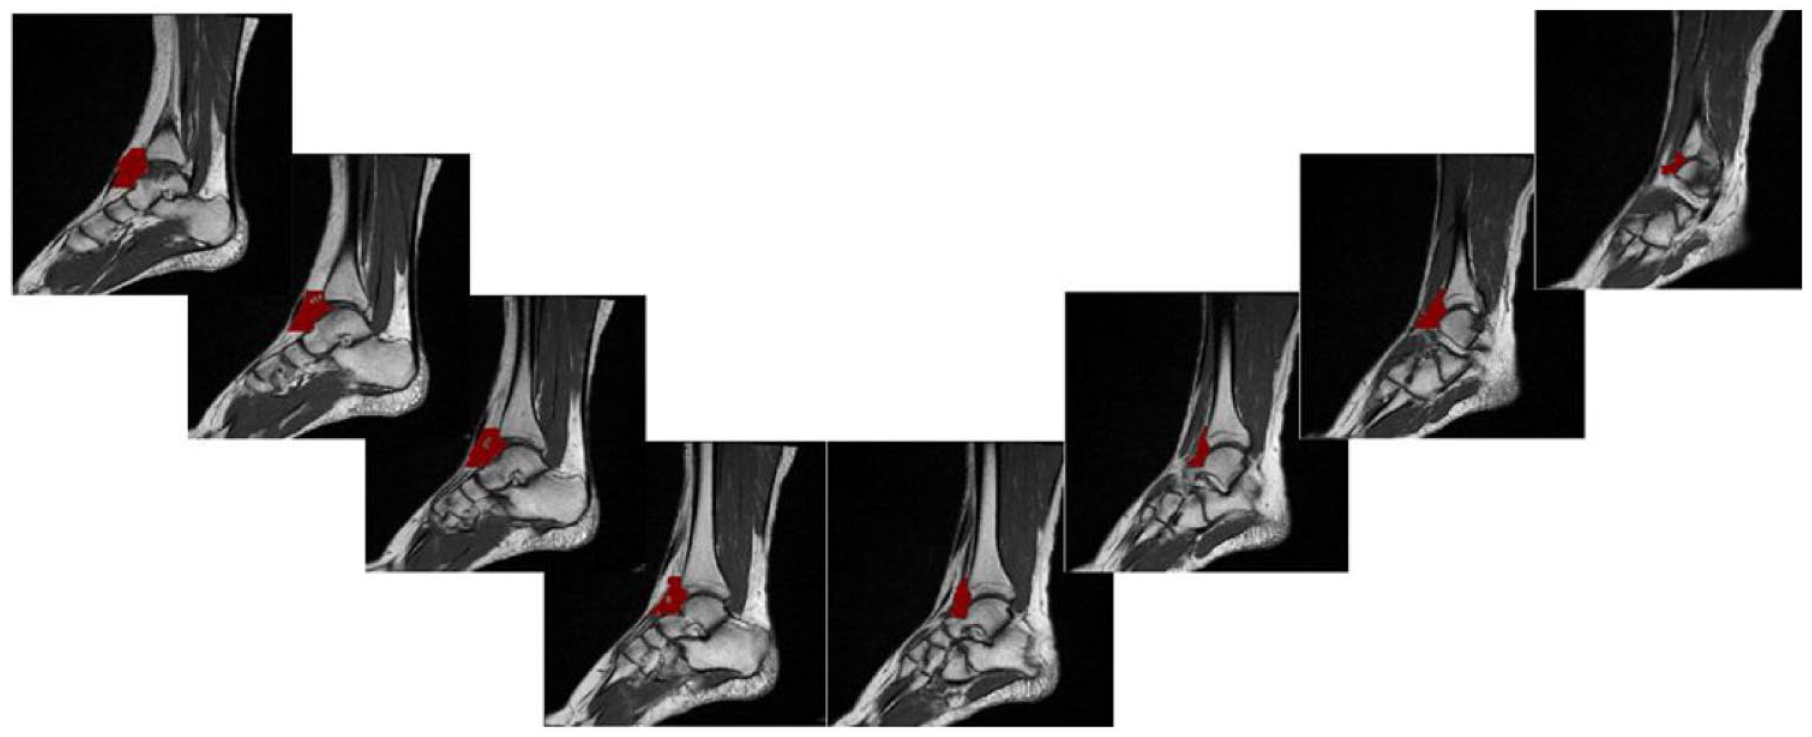
ATFP (red) segmentation from medial (left) to lateral (right) on sagittal MRI T1 slices. ATFP = anterior tibiotalar fat pad.
Ankle sprains are the most frequent form of trauma in the ankle. 11 Despite a rapid decrease in pain within the first 2 weeks after an ankle sprain, up to 33% and 20% of patients experience persistent pain after 1 and 5 years, respectively.12,13 OA development in the ankle is associated with trauma and ligament injuries in 70%-78% of cases.14,15
We tested our hypothesis in a prospective patient cohort that experienced an ankle sprain. Size and inflammatory status of this fat pad were evaluated by MRI, taken 6-12 months after ankle sprain, and were correlated with patient characteristics, functional scores, and structural MRI/radiographic findings at this time point.
Methods
Patients
This study is a secondary analysis of an observational case-control study by Van Ochten et al. 16 The original study included 206 patients identified through the medical records of 84 participating general practitioners (GPs) in the Netherlands using the diagnostic International Classification of Primary Care (ICPC) Code (L77) “ankle sprain” and with the search terms ankle, distortion, and sprain. Inclusion criteria were presentation to the GP 6-12 months before the start of the study with an inversion trauma and being aged 18-65 years. Patients were excluded if diagnosed with fractures, other osseous damages, history of previous surgery of the ankle, systemic diseases with impact on functioning of the musculoskeletal system (e.g., amyotrophic lateral sclerosis, multiple sclerosis, or rheumatoid arthritis), and if they had insufficient Dutch language skills. In all, 632 patients were approached and invited to participate in the study, 207 patients were interested, of which 206 were eligible. Ethical Committee approval was obtained (EC number 2010-026), and each participant gave a written informed consent.
Procedure
All included patients filled in an online questionnaire and were invited for a physical examination by a trained research assistant and imaging (radiograph and MRI) in Diagnostic Center Rotterdam (Vasteland), the Netherlands.
Measurements
We used the data that were registered and described in the study by Van Ochten et al. 16 : (1) patient characteristics (age, sex, and body mass index [BMI]); (2) anamnestic data on socioeconomic status, sports activity, leg dominance, and initial ankle sprain (side, history of previous injuries, activity that caused the sprain); (3) local symptoms such as swelling (place and severity), signs of instability after the sprain, current complaints including pain severity (Numeric Rating Scale [NRS-11]), recovery, and Ankle Function Score (AFS). 17 In this score, 0 represents the worst possible and 100 the best possible function.
The radiological examination consisted of a standard anterior-posterior and lateral (non-weightbearing) radiograph of the injured ankle, followed by a T1 MRI of the injured ankle performed as in daily clinical practice with a head-neck coil (1.5 Tesla, Magnetom Essenza; Siemens Healthcare, Erlangen, Germany). The ankle was placed in a neutral position. To delineate and analyze the ATFP, T1-weighted spin echo images without fat suppression were used. Those images have a sagittal orientation, TE of 16 ms, TR of 550 ms, slice thickness of 3 mm, matrix of 288 × 384 mm, and field of view of 384 mm. We did not use a contrast agent in this study. This acquisition protocol for the injured ankle was previously described by van Putte-Katier et al. 18
All radiographs and MRIs were evaluated by a musculoskeletal radiologist using a standardized scoring form. 16 A random subsample of 32 x-rays and MRIs was scored by a second musculoskeletal radiologist to determine the interobserver reliability. The interobserver reliability was calculated using Cohen’s kappa (range, 0.653-1.00) between the different items. The percentage agreement was 99.1% (1,681 of the 1,696 scored items) and 98.8% (5,883 of 5,952) for the radiography and MRI items, respectively. Both radiologists were blinded for the clinical scores. Radiographs were scored for fractures and calcifications. In addition, the talocrural, subtalar, and talonavicular joints were scored for joint effusion, loose bodies, osteophytes, subchondral cysts, and joint space narrowing. OA was scored using the 0- to 4-point Kellgren and Lawrence (KL) score (0 = absent, 4 = severe). MRIs were scored for signs of anterolateral impingement or pathology of the tendons, anterior/posterior tibiofibular and talofibular ligaments, calcaneofibular ligament, deltoid ligament, and plantar calcaneonavicular (spring) ligament. Tendons (peroneus longus and brevis tendon) and ligaments were scored as normal, thickened, partial tear, total tear, and split tendon (in the case of the peroneus brevis tendon). The talocrural, subtalar, and talonavicular joints were scored for signs of OA, including bone marrow edema, diffuse cartilage loss (0 = absent, 4 = severe), and KL score according to the article by Van Ochten et al. 16 ( Table 1 ).
Patient Characteristics.
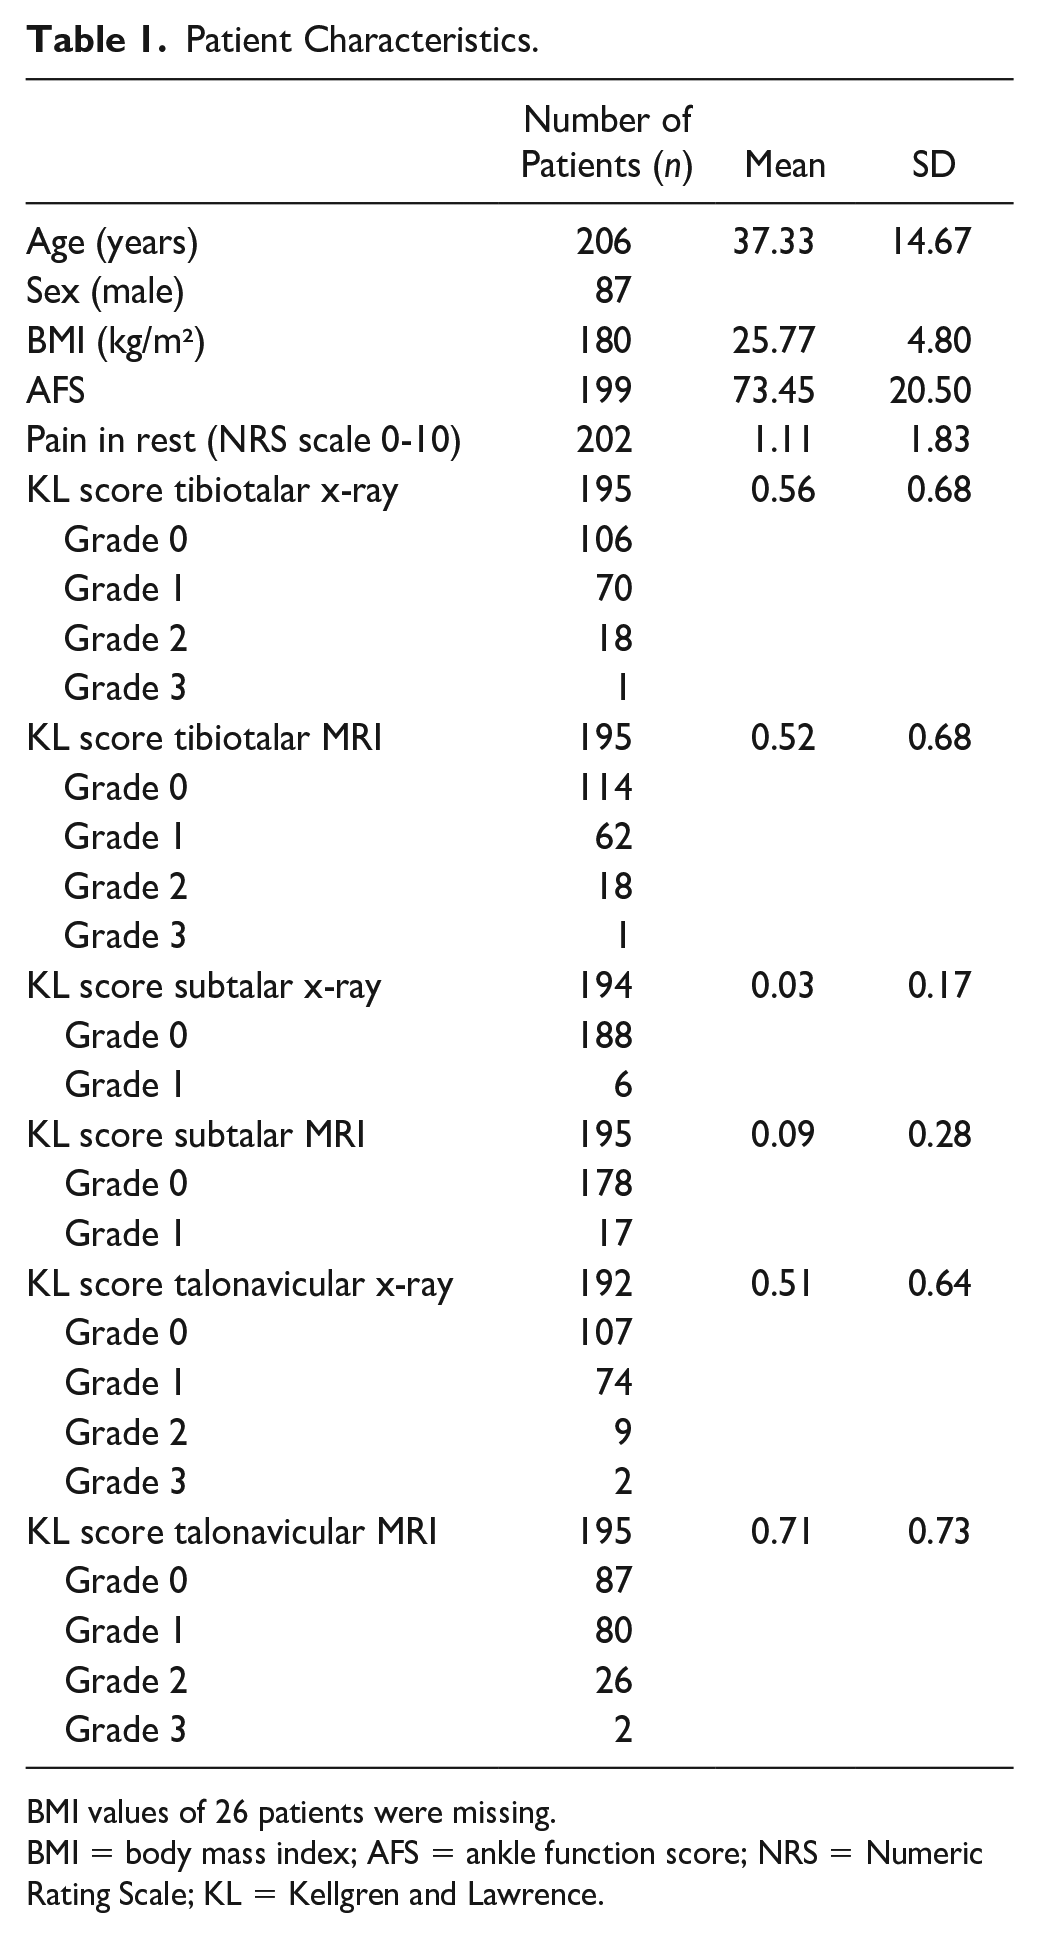
BMI values of 26 patients were missing.
BMI = body mass index; AFS = ankle function score; NRS = Numeric Rating Scale; KL = Kellgren and Lawrence.
To investigate the signal intensity of the ATFP on the T1-weighted sequence, the ATFP was manually segmented in a standardized way ( Fig. 1 ). Segmentation of the fat pad was performed using dedicated image processing software (Mimics 18.0; Materialize, Leuven, Belgium) by an assessor blinded for patient characteristics, variables, function scores, and KL scores. A standardized segmentation procedure was developed: all sagittal T1-weighted slices were analyzed from the tip of the medial malleolus up to the slice on which the medial cortex of the fibula appeared. All fat pads were proximally delimited 1 cm above the tibiotalar joint and distally at the transition of body to neck of the talus. Finally, MATLAB v2018b was used to calculate values for mean signal intensity and area of the ATFP across the measured slices. Area was defined as mean area across the slices between the above-mentioned anatomical borders. Area was then corrected for body length in the analyses.
Statistical Analysis
BMI values were missing at random and were replaced by multiple imputation.
Linear regression analysis was used to examine the association between both local and systemic factors and the ATFP. Variables with a P value <0.2 were entered in 5 stepwise multivariate models: (1) age-sex-BMI; (2) anamnesis; (3) physical examination; (4) radiographic findings; and (5) MRI findings. Predictors with a P value <0.2 in these separate models were entered, in 5 steps, in the final model. Step 1: baseline characteristics; Step 2: anamnesis variables; Step 3: physical examination variables; Step 4: radiographic findings; Step 5: MRI findings were added. Possible associated factors were presented as a beta coefficient with 95% confidence interval (CI). All data were analyzed using SPSS (version 24.0).
Results
Patient Characteristics
Our study population consisted of 206 patients, of which 87 (42.2%) were men and 119 women (58.8%). The mean age was 37.33 (SD 14.67) years. Most ankle sprains occurred at the right side (55.8%). Mean BMI was 25.77 (SD 4.80) kg/m².
ATFP Intensity Was Associated With Age, BMI, and Sex
Mean ATFP intensity was 976 (SD 106) and mean ATFP area was 294 (SD 64) mm² in the study population. ATFP intensity and ATFP area were significantly correlated (P = 0.04; B = 0.15).
Multivariate regression for patient characteristics ( Table 2 ) showed significant positive associations between T1 signal intensity and BMI, age, and female sex. T1 intensity correlated significantly with NRS in rest in the multivariate analysis for anamnesis. The final multivariate model showed a significant positive association between age, BMI, and sex with T1 intensity ( Table 3 ).
Multivariate Linear Regression Models for T1 Intensity and T1 Area Corrected for Length.
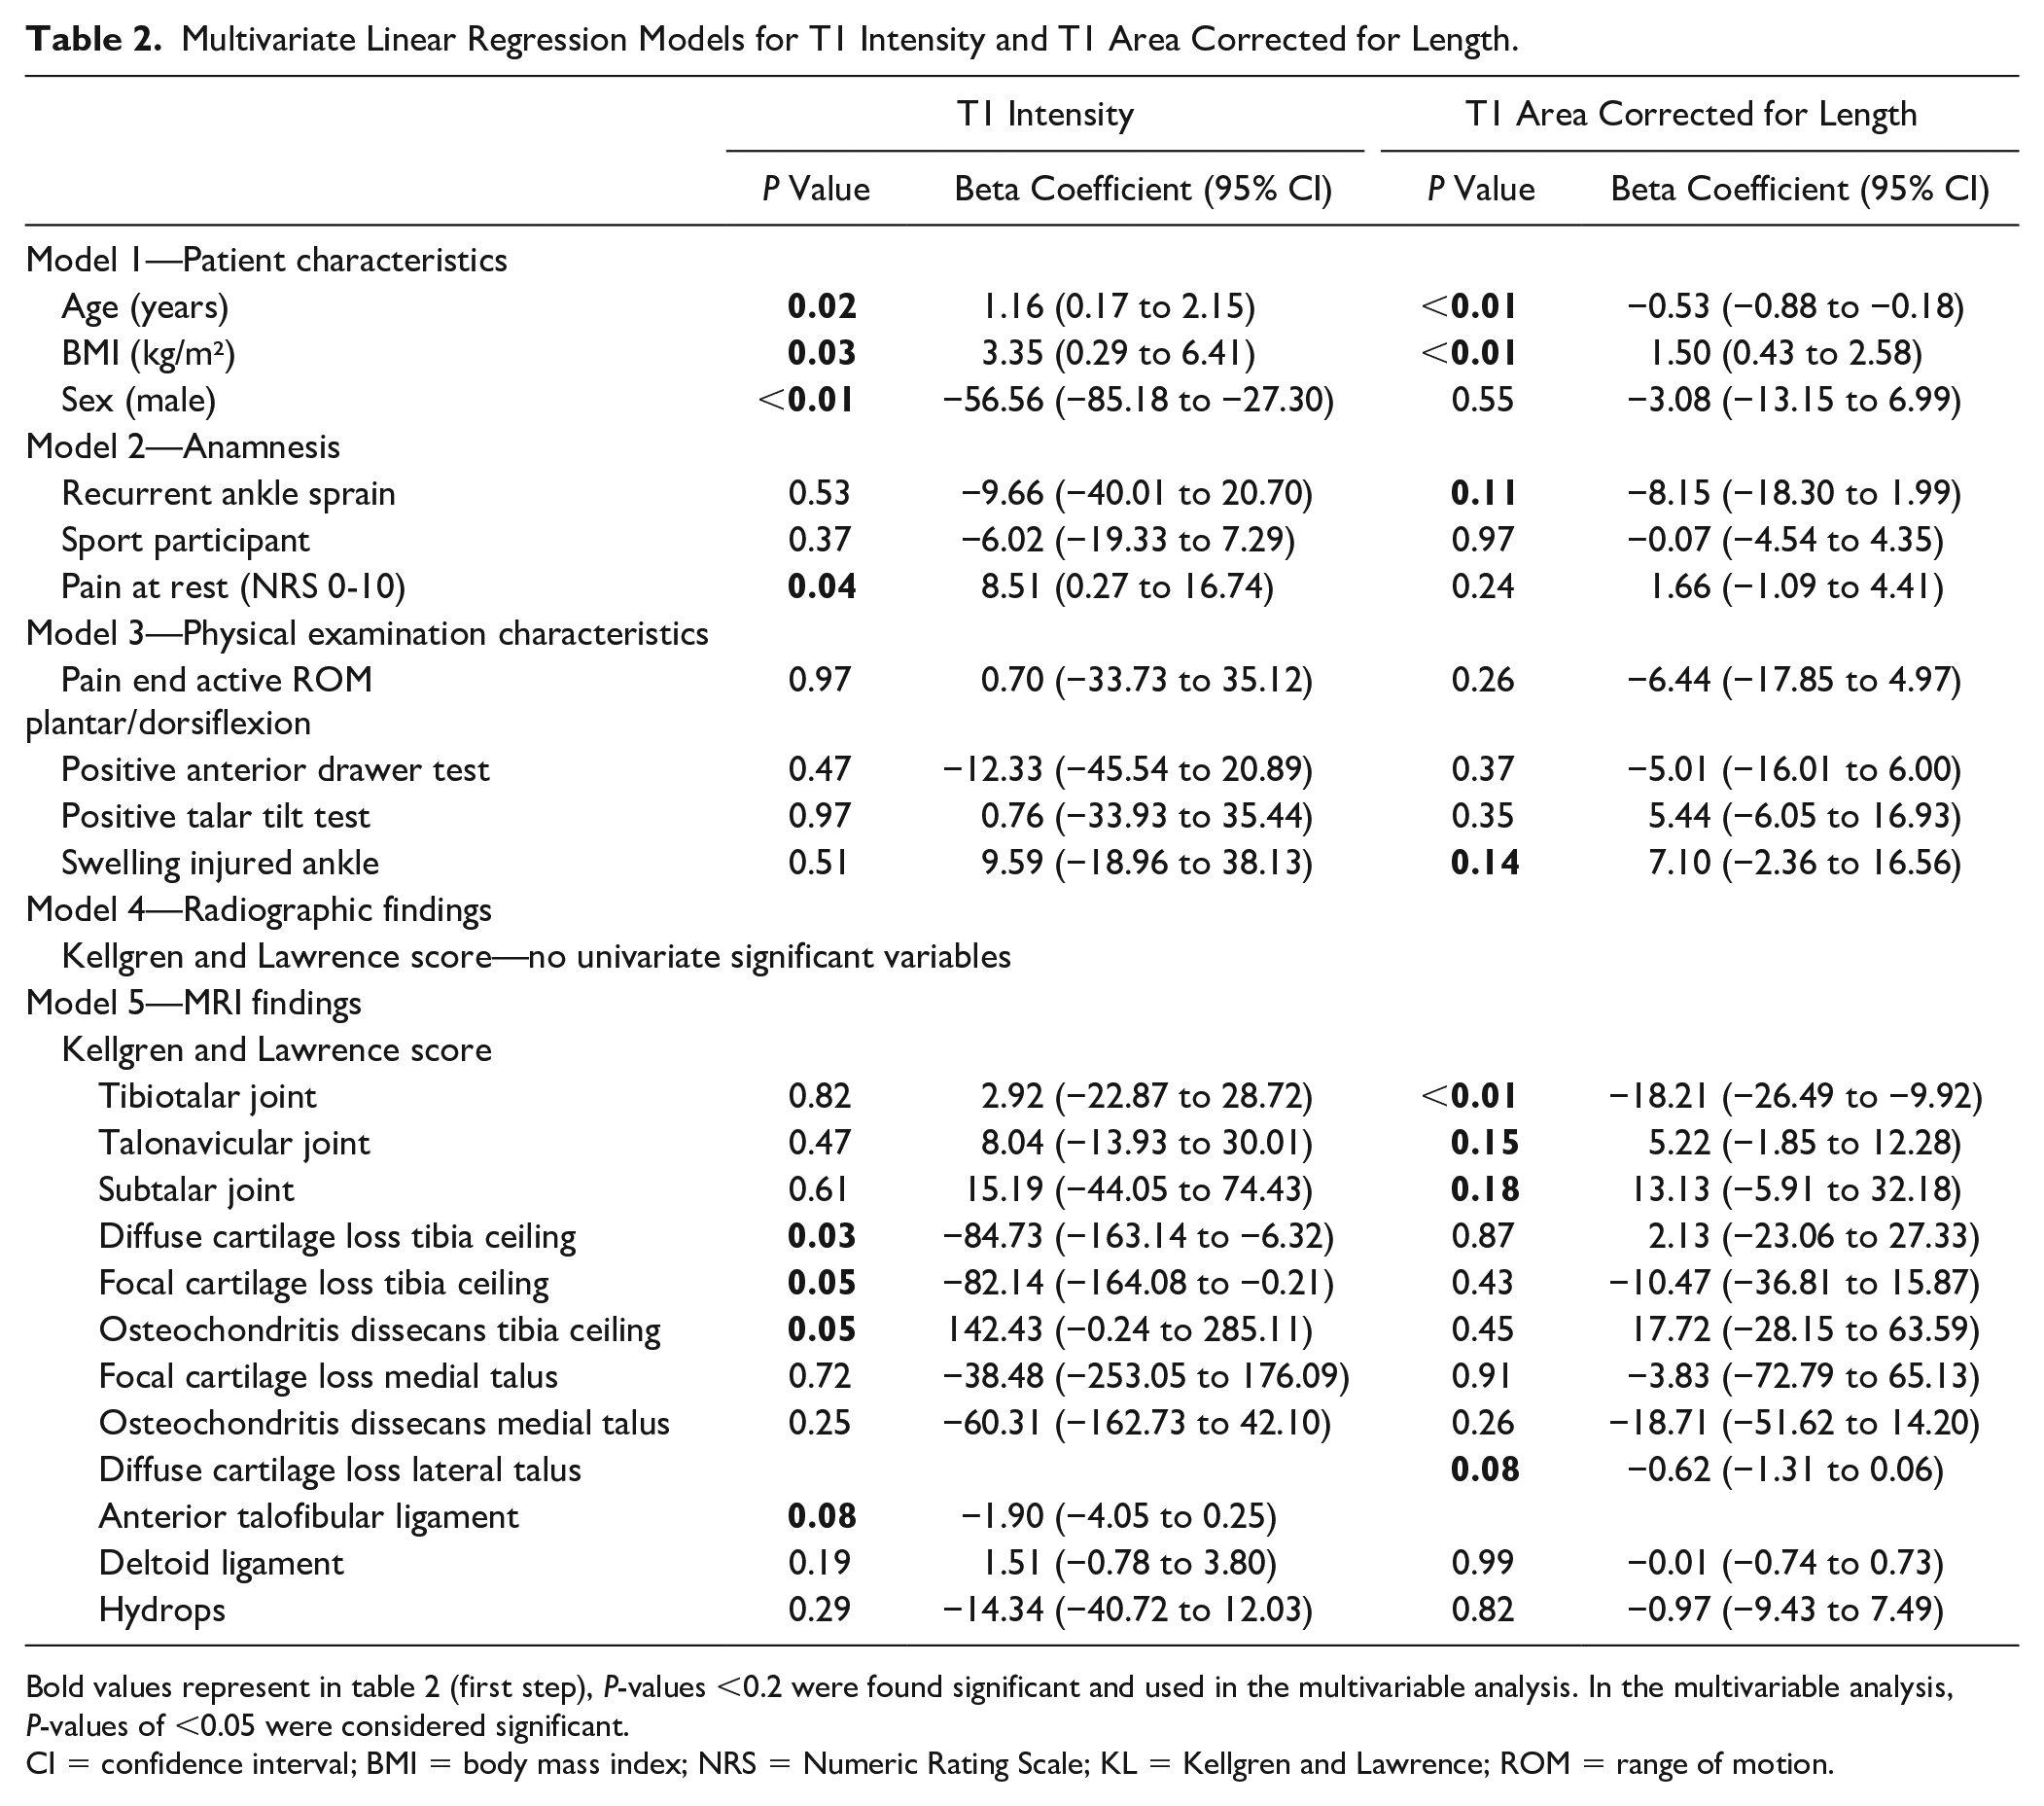
Bold values represent in table 2 (first step), P-values <0.2 were found significant and used in the multivariable analysis. In the multivariable analysis, P-values of <0.05 were considered significant.
CI = confidence interval; BMI = body mass index; NRS = Numeric Rating Scale; KL = Kellgren and Lawrence; ROM = range of motion.
Final Multivariate Linear Regression Model for T1 Intensity and T1 Area Corrected for Length.
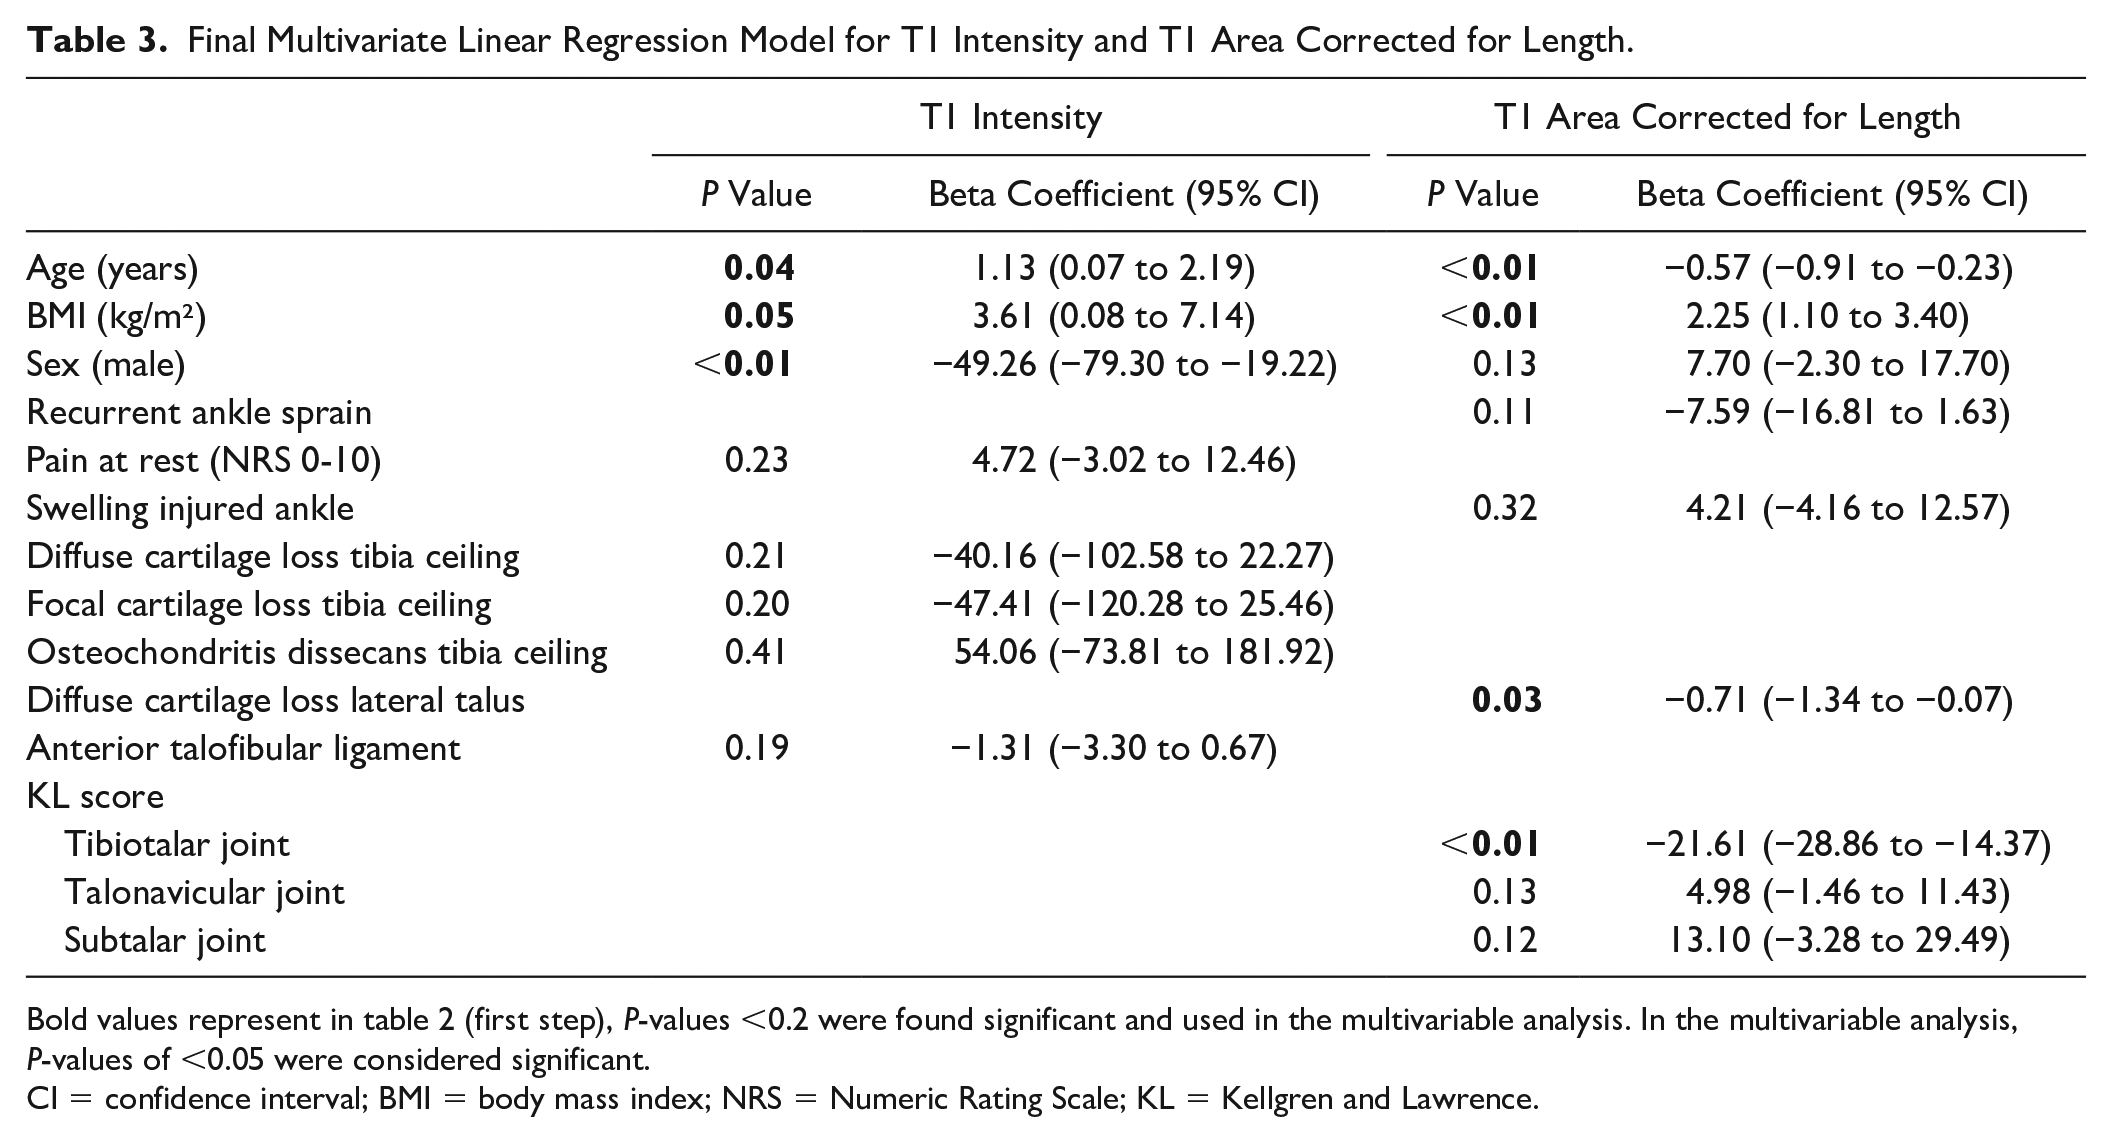
Bold values represent in table 2 (first step), P-values <0.2 were found significant and used in the multivariable analysis. In the multivariable analysis, P-values of <0.05 were considered significant.
CI = confidence interval; BMI = body mass index; NRS = Numeric Rating Scale; KL = Kellgren and Lawrence.
ATFP Area Was Associated With Sex and KL Score in the Tibiotalar Joint
Multivariate regression ( Table 2 ) for baseline characteristics showed significant positive association with BMI and negative association with age. KL score in the tibiotalar joint on MRI was also significant negatively associated with ATFP area.
The final multivariate model showed a significant negative association between age, diffuse cartilage loss in the lateral talus, and KL score in the tibiotalar joint and ATFP area. A positive association was found between BMI and ATFP area ( Table 3 ).
Discussion
The ATFP is situated anteriorly in the ankle joint and is closely located to the anterior part of the joint. This is the first study that relates the ATFP T1 signal intensity and area to patient characteristics and OA signs in a large study population with patients 6 months to 1 year after visiting their GP with ankle sprain. The results show that a higher BMI, female sex, and higher age are associated with higher ATFP signal intensity on T1-weighted MRI images. Smaller ATFP area was associated with higher age, lower BMI, higher frequency of diffuse cartilage loss in the lateral talus, and a higher grade of OA in the tibiotalar joint.
Comparing these results with existing literature is difficult as it is the first study investigating the ATFP in the ankle. In the knee, similar studies were performed examining signal intensity changes in the IPFP, although T2-weighted MRI scans were used instead of T1-weighted images. In our study, T1-weighted images were used because of the practical unfeasibility of delineating the fat pad on other sequences using dedicated image processing software. In 2015, Han et al. 19 described the association between IPFP signal intensity alteration at baseline and knee pain in bed, radiographic knee OA, and cartilage defects. In our study, increased ATFP signal intensity on T1-weighted MRI scans was also associated with a higher NRS pain score in rest, which can be considered the equivalent of pain in bed. The method to assess the IPFP in the study by Han et al. was not automated, with an observer grading T2-weighted signal intensity alteration from 0 to 3. In this study, a more objective measure of signal intensity was used by considering the signal intensity of all voxels belonging to the ATFP. In the study by Wang et al., 20 they concluded that high signal intensity alteration in the IPFP was significantly associated with the need for knee replacement. In our study, T1 signal intensity was correlated with higher age, higher BMI, and female sex, which are 3 major risk factors for OA.
The observed ATFP signal intensity alterations may be explained by an increased infiltration of proinflammatory mediators such as macrophages or mast cells in the ATFP. Indeed, obesity has been linked with the initiation of a systemic low-grade inflammatory response that originates from the infiltration of macrophages or other immune cells in adipose tissue. 21 Previous studies indicate that the number and type of immune cells in IPFP are correlated with the type of pathology that is present in the knee joint. 8 In 2015, Solbak et al. 22 examined the IPFP in 16 sheep knees after anterior cruciate ligament (ACL) reconstruction. In their study, an altered cellularity and fibrosis were seen 2 and 20 weeks after surgery. Another study by Yoon et al. 23 showed an association between T1 signal intensity of the IPFP on MRI and worse cartilage degeneration in the patellofemoral joint in 107 patients, 26 months after ACL reconstruction. Our results may indicate similar findings in the ATFP and ankle in the multivariate models, not in the final multivariate model including age, BMI, sex. However, these findings need to be investigated by further histological analysis.
We also investigated the area of the ATFP on T1 images. Smaller areas were seen in older people and in those with a lower BMI. A higher KL score in the tibiotalar joint on MRI was significantly correlated with a smaller T1 area. These results are coherent with the findings of Cai et al. 24 in the knee joint, who showed a significant association between larger IPFP volume and less structural abnormalities, suggesting a protective role of the healthy IPFP. Also, a recent study showed higher serum interleukin-17 and resistin concentrations in knee joints with reduced IPFP volume and/or increased abnormal signal intensity alteration. 25 It should be noted that these results only indicate associations, and that no causal links can be made at this stage.
Critical Considerations
The diurnal variation of T1 signal intensity was a potential limitation of our study, but it was assumed negligible because of the size of the population.
In this study, many variables were tested, which increases the chance of false-positive findings (type I error). As this study was based on a previous cohort, a power analysis was not performed. Larger observational MRI studies are needed to further validate these findings. In addition, histological and flow cytometric analysis of the ATFP should be performed to investigate underlying etiopathogenesis of a potential role of the ATFP in ankle OA development.
Conclusion
This study demonstrates a correlation between the area and signal intensity of the ATFP and both systemic factors and local pathology in the ankle joint.
Footnotes
Author Contributions
SA, RL, MVM, and SC were responsible for conception and design of the article. SA, PB, SVR, RL, and SC were involved in the analysis of data. All authors were involved in interpreting the data and drafting the article. All authors commented and approved the final version.
Acknowledgments and Funding
The author(s) received no financial support for the research, authorship, and/or publication of this article.
Declaration of Conflicting Interests
The author(s) declared no potential conflicts of interest with respect to the research, authorship, and/or publication of this article.
Ethical Approval
Ethical Committee approval was obtained (EC number 2010-026), and each participant gave a written informed consent.