
Abstract
Objective
Joint injuries may lead to degeneration of cartilage tissue and initiate development of posttraumatic osteoarthritis. Arthroscopic surgeries can be used to treat joint injuries, but arthroscopic evaluation of articular cartilage quality is subjective. Fourier transform infrared spectroscopy combined with fiber optics and attenuated total reflectance crystal could be used for the assessment of tissue quality during arthroscopy. We hypothesize that fiber-optic mid-infrared spectroscopy can detect enzymatically and mechanically induced damage similar to changes occurring during progression of osteoarthritis.
Design
Bovine patellar cartilage plugs were extracted and degraded enzymatically and mechanically. Adjacent untreated samples were utilized as controls. Enzymatic degradation was done using collagenase and trypsin enzymes. Mechanical damage was induced by (1) dropping a weight impactor on the cartilage plugs and (2) abrading the cartilage surface with a rotating sandpaper. Fiber-optic mid-infrared spectroscopic measurements were conducted before and after treatments, and spectral changes were assessed with random forest, partial least squares discriminant analysis, and support vector machine classifiers.
Results
All models had excellent classification performance for detecting the different enzymatic and mechanical damage on cartilage matrix. Random forest models achieved accuracies between 90.3% and 77.8%, while partial least squares model accuracies ranged from 95.8% to 84.7%, and support vector machine accuracies from 91.7% to 80.6%.
Conclusions
The results suggest that fiber-optic Fourier transform infrared spectroscopy attenuated total reflectance spectroscopy is a viable way to detect minor and major degeneration of articular cartilage. Objective measures provided by fiber-optic spectroscopic methods could improve arthroscopic evaluation of cartilage damage.
Introduction
Articular cartilage (AC) is a soft connective tissue that covers the ends of articulating bones. AC consists of extracellular matrix (ECM), chondrocytes, and interstitial fluid. Main molecular components of ECM are collagens and proteoglycans along with lower amounts of glycoproteins and noncollagenous proteins. 1 The function of AC is to provide a low-friction surface for smooth articulation of joints and redistribute the loads applied to the ends of bones. Osteoarthritis (OA), the most common musculoskeletal disease in the world, degenerates AC within synovial joints. OA is most common in knee, hip, and hand joints. Since OA is the leading cause of disability among elderly people, affecting 250 million people worldwide, its impact on health care costs is significant. 2
Cartilage degeneration and changes in chondrocyte function are the most evident signs of progression of the disease. 3 In the early stages of the disease, the loss of proteoglycans, tissue fibrillation, and degradation are seen at the superficial layer of AC. Excessive proliferation or hypertrophy of chondrocytes and cell death also occur due to OA. Furthermore, as OA progresses, chondron organization starts to disintegrate, and formation of vertical fissures is observed, making the AC surface discontinuous. In the latter stages of OA, the cartilage matrix erodes, and the bone is exposed. Thereafter, bone deformation and remodeling start to occur. 3 The etiology of OA is not completely known. The current understanding is that OA is a whole organ disease, which involves tissues within the joints, such as ligaments, synovium along with bone and cartilage. 4 Often OA is idiopathic, that is, it is not possible to identify a specific cause for the disease. One exception is posttraumatic OA, which is initiated by a trauma to the joint, for example, a sports injury or an accident. Early stage diagnostics in these cases is important, since successful intervention in the early stages of the disease can significantly postpone the progression of the disease. 5
Arthroscopic surgeries are used to treat various knee OA symptoms, but the benefits of current methods are shown to be limited. 6 The current arthroscopic classification of cartilage damage, which is based on manual mechanical probing of cartilage combined with visual inspection, is subjective. Experts have stated a need for improvement in differentiation of tissue damage. 7 This subjective assessment may limit the outcomes of the arthroscopic operations due to misclassification of tissue health, and thus, there is a need for objective tools to assess tissue quality in order to guide surgical repair of joint injuries and reveal incipient posttraumatic OA.8,9 Several methods are currently under investigation for providing objective measures for surgeons. Intraarticular ultrasound 10 and optical coherence tomography 11 may be used to visualize the tissue structure to reveal, for example, the lesion depth. In addition to structural information, near-infrared (NIR) spectroscopy 12 can be used to assess the molecular composition of AC by studying the overtone frequencies of molecular vibrations. NIR light can penetrate through the whole cartilage tissue, 13 but the overtone vibrations are seen as broad features in NIR spectra, and the molecular sensitivity of NIR spectroscopy is limited. 14
Mid-infrared (MIR) spectroscopy provides better molecular selectivity than NIR spectroscopy as it excites the fundamental molecular vibrations. MIR frequencies can only penetrate a few micrometers through the sample surface, 15 but the increased molecular selectivity of the MIR range may be advantageous especially when evaluating early OA changes. MIR region is routinely used in Fourier transform infrared (FTIR) microscopy to measure ECM molecule distributions in histological cartilage sections.16,17 Furthermore, an FTIR spectrometer, combined with fiber optics and an attenuated total reflection (ATR) crystal, allows also flexible measurements of cartilage without any sample processing.18,19 In principle, these measurements could be done in vivo to provide objective information about the tissue properties, for example, during arthroscopic surgery. A tool providing objective information about cartilage health during arthroscopic surgeries, for example, after joint injuries, would help surgeons make better informed decisions and potentially improve the outcomes of the surgeries.
We hypothesize that fiber-optic FTIR-ATR spectroscopy can detect degenerative changes in AC associated with early OA. To test the hypothesis, we used fiber-optic FTIR-ATR spectroscopy to differentiate mechanically and enzymatically damaged bovine cartilage from intact bovine cartilage. In enzymatic damage models, the collagenase treatment modeled superficial collagenase network damage, while trypsin treatment modeled proteoglycan depletion seen in the early stages of OA. Additionally, a longer collagenase treatment was used to induce major collagen network degradation occurring in the later stages of OA. In mechanical damage models, impact damage modeled tissue damage associated with high-impact injuries, and surface abrasion simulated fibrillation seen on the surface of AC. FTIR-ATR spectra between intact and damaged tissue were compared to reveal the spectroscopic changes related to tissue damage. Furthermore, binary random forest (RF), partial least squares discriminant analysis (PLS-DA), and support vector machine (SVM) classifiers were trained to separate degenerated and untreated tissues based on their FTIR-ATR spectra.
Methods
Sample Preparation Protocol
Patellae (N = 12) from young adult bovines (N = 10, age 14-22 months), obtained from a local slaughterhouse, were used in this study. Cylindrical (d = 7 mm) osteochondral samples were prepared from 6 different anatomical locations of each patella. The samples were divided into enzymatically degraded groups (n = 36) and mechanically degraded groups (n = 24). Control samples (n = 60) were prepared from locations adjacent to damage group samples as shown in Fig. 1 . Samples were extracted from same anatomical area for each group to diminish the effects of possible location specific spectral differences.
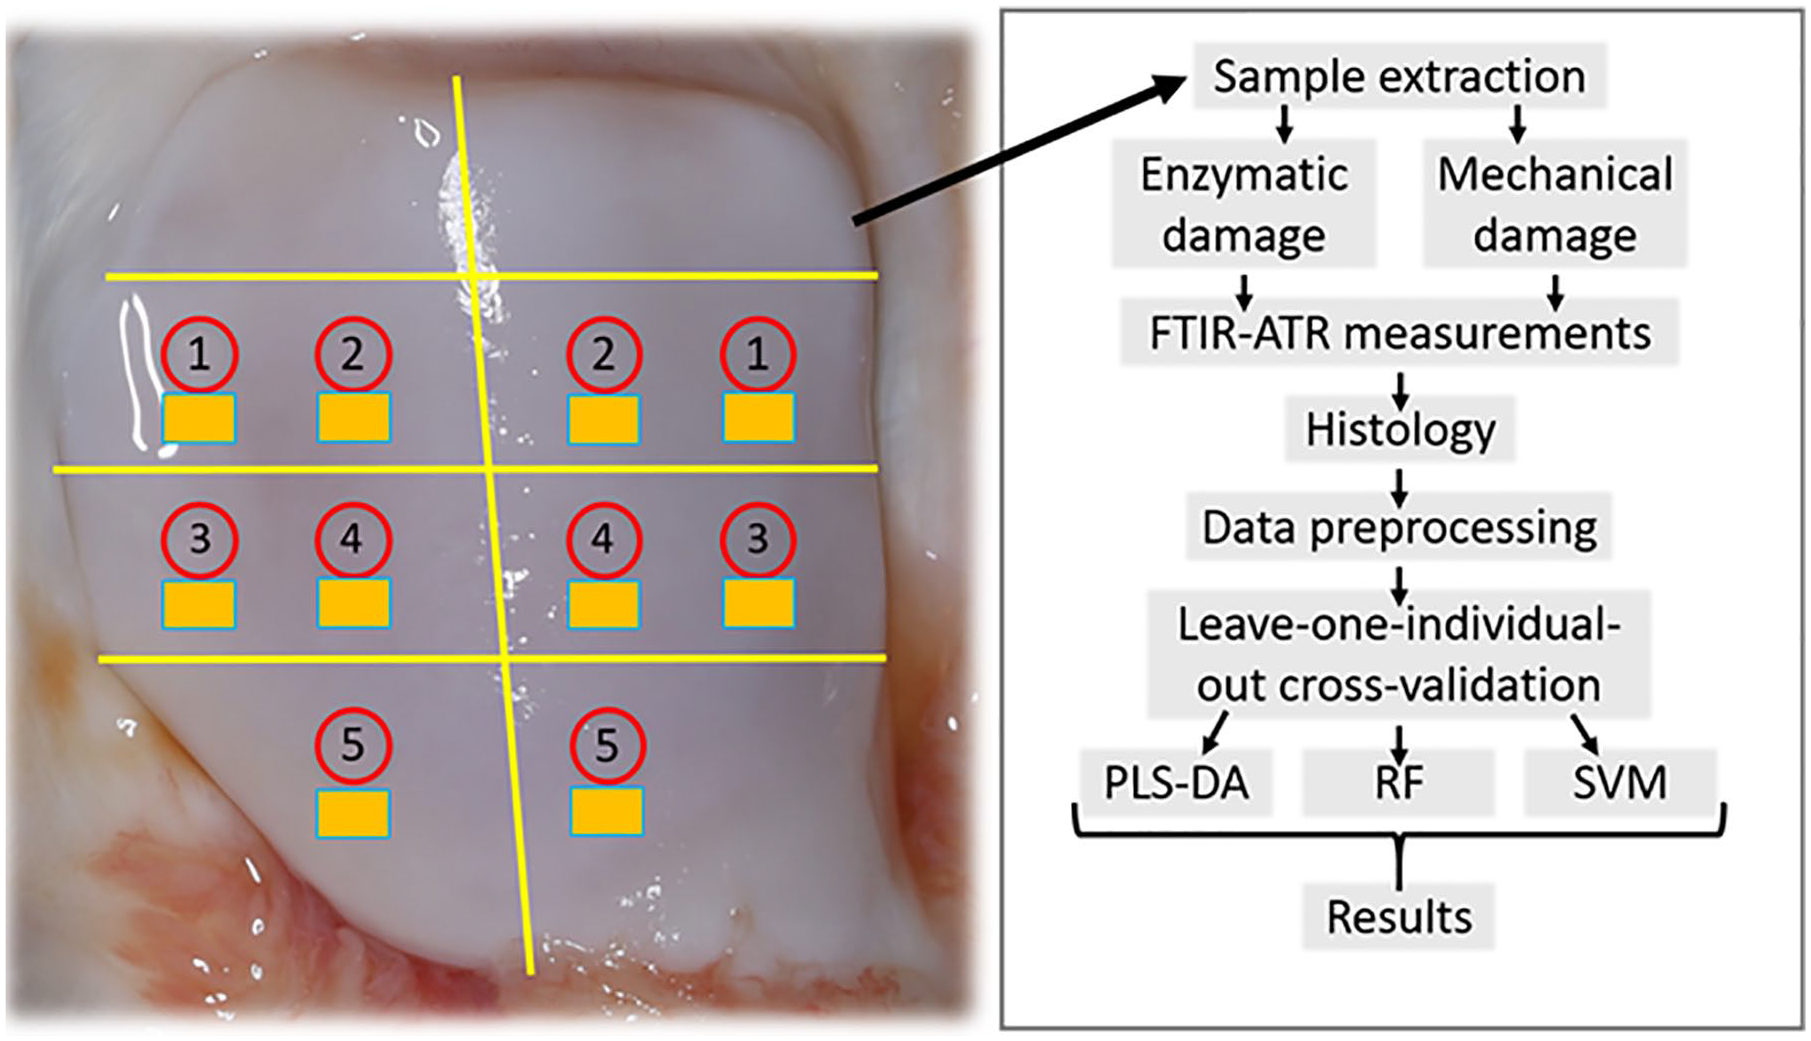
Sample extraction locations and complete flow diagram of the measurement protocol. Sample preparation locations of fresh bovine osteochondral plugs (d = 7 mm) are indicated in numbered red circles, and adjacent control samples for each group are indicated with yellow rectangles. Numbers indicate following groups: 1—Collagenase 24 hours; 2—Collagenase 30 minutes; 3—Trypsin 30 minutes; 4—Surface abrasion; 5—Impact loading.
Enzymatic degradation was targeted to the two main components of cartilage ECM: collagen network with collagenase D (0.29 U/mg, Sigma Aldrich) and proteoglycans with trypsin (T 4174, Sigma Aldrich). The samples were divided into 24-hour collagenase (n = 12), 90-minute collagenase (n = 12), and 30-minute trypsin (n = 12) treated groups. Each sample was incubated at 37 °C and 5% CO2 while submerged in a well-plate within phosphate buffered saline solution (PBS) containing the specified enzymes (0.1 mg/mL for collagenase D, and 0.5 mg/mL for trypsin) with added penicillin-streptomycin-amphotericin B (100 units/mL penicillin, 100 µg/mL streptomycin, and 0.25 µg/mL amphotericin B, stabilized, Sigma-Aldrich). To prevent lateral penetration of the enzymes, enzymatic treatments were performed on larger rectangular pieces of tissue (10-15 mm per side), and afterwards cylindrical plugs (d = 7mm) were extracted from the selected locations.
Two types of mechanically induced damage were applied in this study: impact loading (n = 12) and abrasion (n = 12). Impact loading was conducted using a stainless-steel impactor (m = 200 g) with a polished steel ball (d = 1 cm) acting as the impact surface. The impactor was dropped from a height of 7.5 cm. This height was chosen based on preliminary testing to create cracks on the surface of AC. Surface abrasion was induced using a custom-made tool enabling 180° rotation of a metal plate with P80 sandpaper (particle size 200 µm) attached to the surface of the plate. A constant stress of 4 kPa was applied to the cartilage surface during two 180° rotations.
All samples were measured within 10 hours of extraction from the knee joint, with the exception of collagenase 24-hour group samples, which were measured after during the next day. In between treatments and measurements, the samples were stored in PBS solution with protease inhibitors to minimize the effects of natural degradation of fresh tissue. After the mechanical and enzymatic treatments, all samples were allowed to recover in PBS for a duration of 60 minutes to facilitate the diffusion of damaged tissue components. All samples were kept in 4 °C to reduce natural degradation of the tissue until measurements for the specific sample plug occurred.
Sample Measurement Protocols
FTIR spectroscopic measurements were conducted utilizing a custom ATR probe (Art Photonics GmbH, Germany) that was connected to a Thermo Nicolet iS50 FTIR spectrometer (Thermo Nicolet Corporation, Madison, WI), equipped with a Globar MIR source and a liquid nitrogen-cooled mercury cadmium telluride (MCT) detector. The samples were measured 3 times, with a new probe contact established for each measurement, resulting in 3 technical replicates for each sample. Measurements were done with 2 cm−1 spectral resolution, digital spacing of 0.2411 cm−1, and averaging 64 scans over the range from 4000 cm−1 to 400 cm−1. The background spectrum was measured for each sample separately. Measurements were controlled by OMNIC software (Thermo Nicolet Corporation, Madison, WI).
Histology
After the experiments, the sample plugs were fixed in formalin, decalcified in ethylenediaminetetraacetic acid, and embedded in paraffin. Subsequently, 3-µm-thick histological sections were cut and stained using Safranin-O for qualitative evaluation of the cartilage damage.
Data Analysis
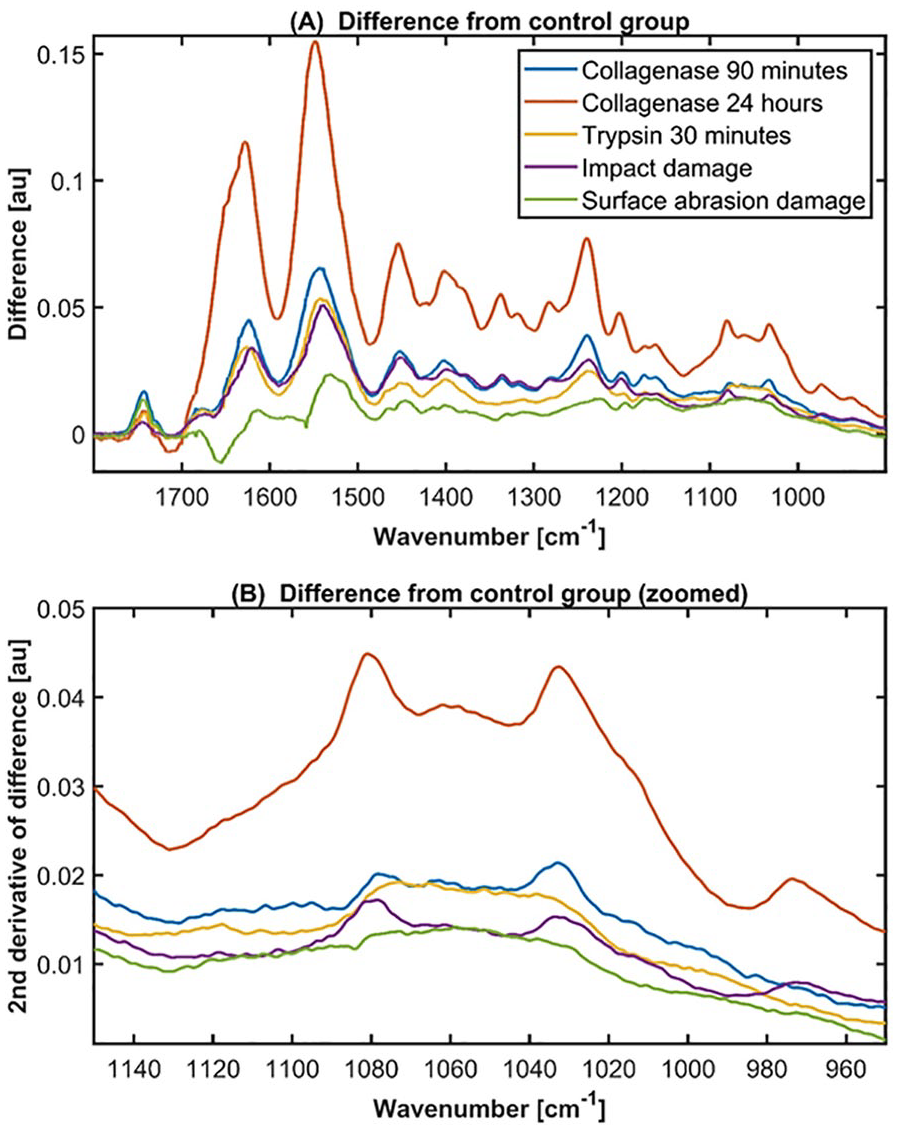
Preprocessing by multiplicative signal correction (MSC) 20 was applied, and spectral range was truncated to 1700 cm−1 to 900 cm−1. To compare the spectra of treated and control groups, mean spectra of each damage and control group were calculated. Difference spectra were calculated by subtracting the mean damage group spectrum from the mean control spectrum of each group ( Fig. 3A ).
RF, PLS-DA, SVM classifiers were used for classifying the spectra into treated and untreated groups. Binary models for each damage group against its own adjacent control group were built by utilizing the 3 separate technical replicates (sample locations are illustrated in Fig. 1 ). The models were built utilizing only the spectra from one specific damage group and the associated control spectra for each of the 5 damage treatment groups (72 spectra in each model of which 36 spectra were from 12 damage treatment samples and 36 spectra from 12 control samples). In addition, 3 binary models were created to classify all damaged samples against control samples (360 spectra in total, 180 damage treatment spectra from 60 samples and 180 control spectra from 60 samples), all enzymatically damaged samples against their associated controls (216 spectra, 108 damage treatment spectra from 36 samples and 108 control spectra from 36 samples), and all mechanically damaged samples against their associated controls (144 spectra, 72 damage treatment spectra from 24 samples and 72 control spectra from 24 samples).
RFs utilize multiple individual decision trees and combine the outputs into a final prediction using majority vote. 21 The main advantage of RF classifier is that it is robust to noise and overfitting, and it is well suited for data with large number of features, such as spectroscopic data. The number of RF trees was set to 100, otherwise default parameters were used in MATLAB RF algorithm. In PLS-DA, independent (i.e., spectra) and dependent (i.e., sample groups) variables are used to calculate latent variables so that the covariance between the 2 variable sets is maximized, thus reducing the multicollinearity problem. To avoid overfitting of the models, the number of PLS components was selected by checking the minimum classification error of models built using 1 to 7 PLS components and selecting the smallest number of components where the error is within 5% of the true minimum. The number of PLS components chosen for each model is shown in the Table 2 . SVMs utilize mapping of training data into a new hyperspace with the help of a kernel function, after which it constructs an optimal hyperplane that fits the data best. 22 SVMs perform well in fitting nonlinear data. For SVM classifiers, Bayesian optimization was used to find the optimal gamma and C values for the radial basis function kernel.
Spectral data processing and data analyses were performed using algorithms developed in house in the environment of MATLAB, R2018a (The Mathworks Inc., Natick, MA).
Statistical Analysis
Leave-one-individual-out cross-validation was used to estimate the performance of the established models. Cross-validation error is usually an overoptimistic performance estimation of a model. Calculating the error of prediction by taking out all the spectra of one individual (with all replicates) at each step of the cross-validation ensures that no samples of that individual were used in establishing the model. This type of cross-validation is the closest to real external validation and should be used when no external test set validation is possible due to limited sample size.
Results
Representative Safranin-O-stained sections along with the mean spectrum of damage and control samples for each group are shown in Fig. 2 . As expected, the largest absolute change occurred in collagenase 24-hour group, where most of the surface layer is missing completely due to major collagen network disintegration. The collagen network disruption in both collagenase groups led also to significant proteoglycan depletion at the superficial layer of AC. In contrast, trypsin induced a significant proteoglycan loss while keeping the collagen network visibly intact. In mechanically induced damage groups, surface abrasion led to fibrillation of cartilage surface along with minor proteoglycan depletion, whereas impact damage resulted in deeper fissures with proteoglycan loss adjacent to the damaged area.
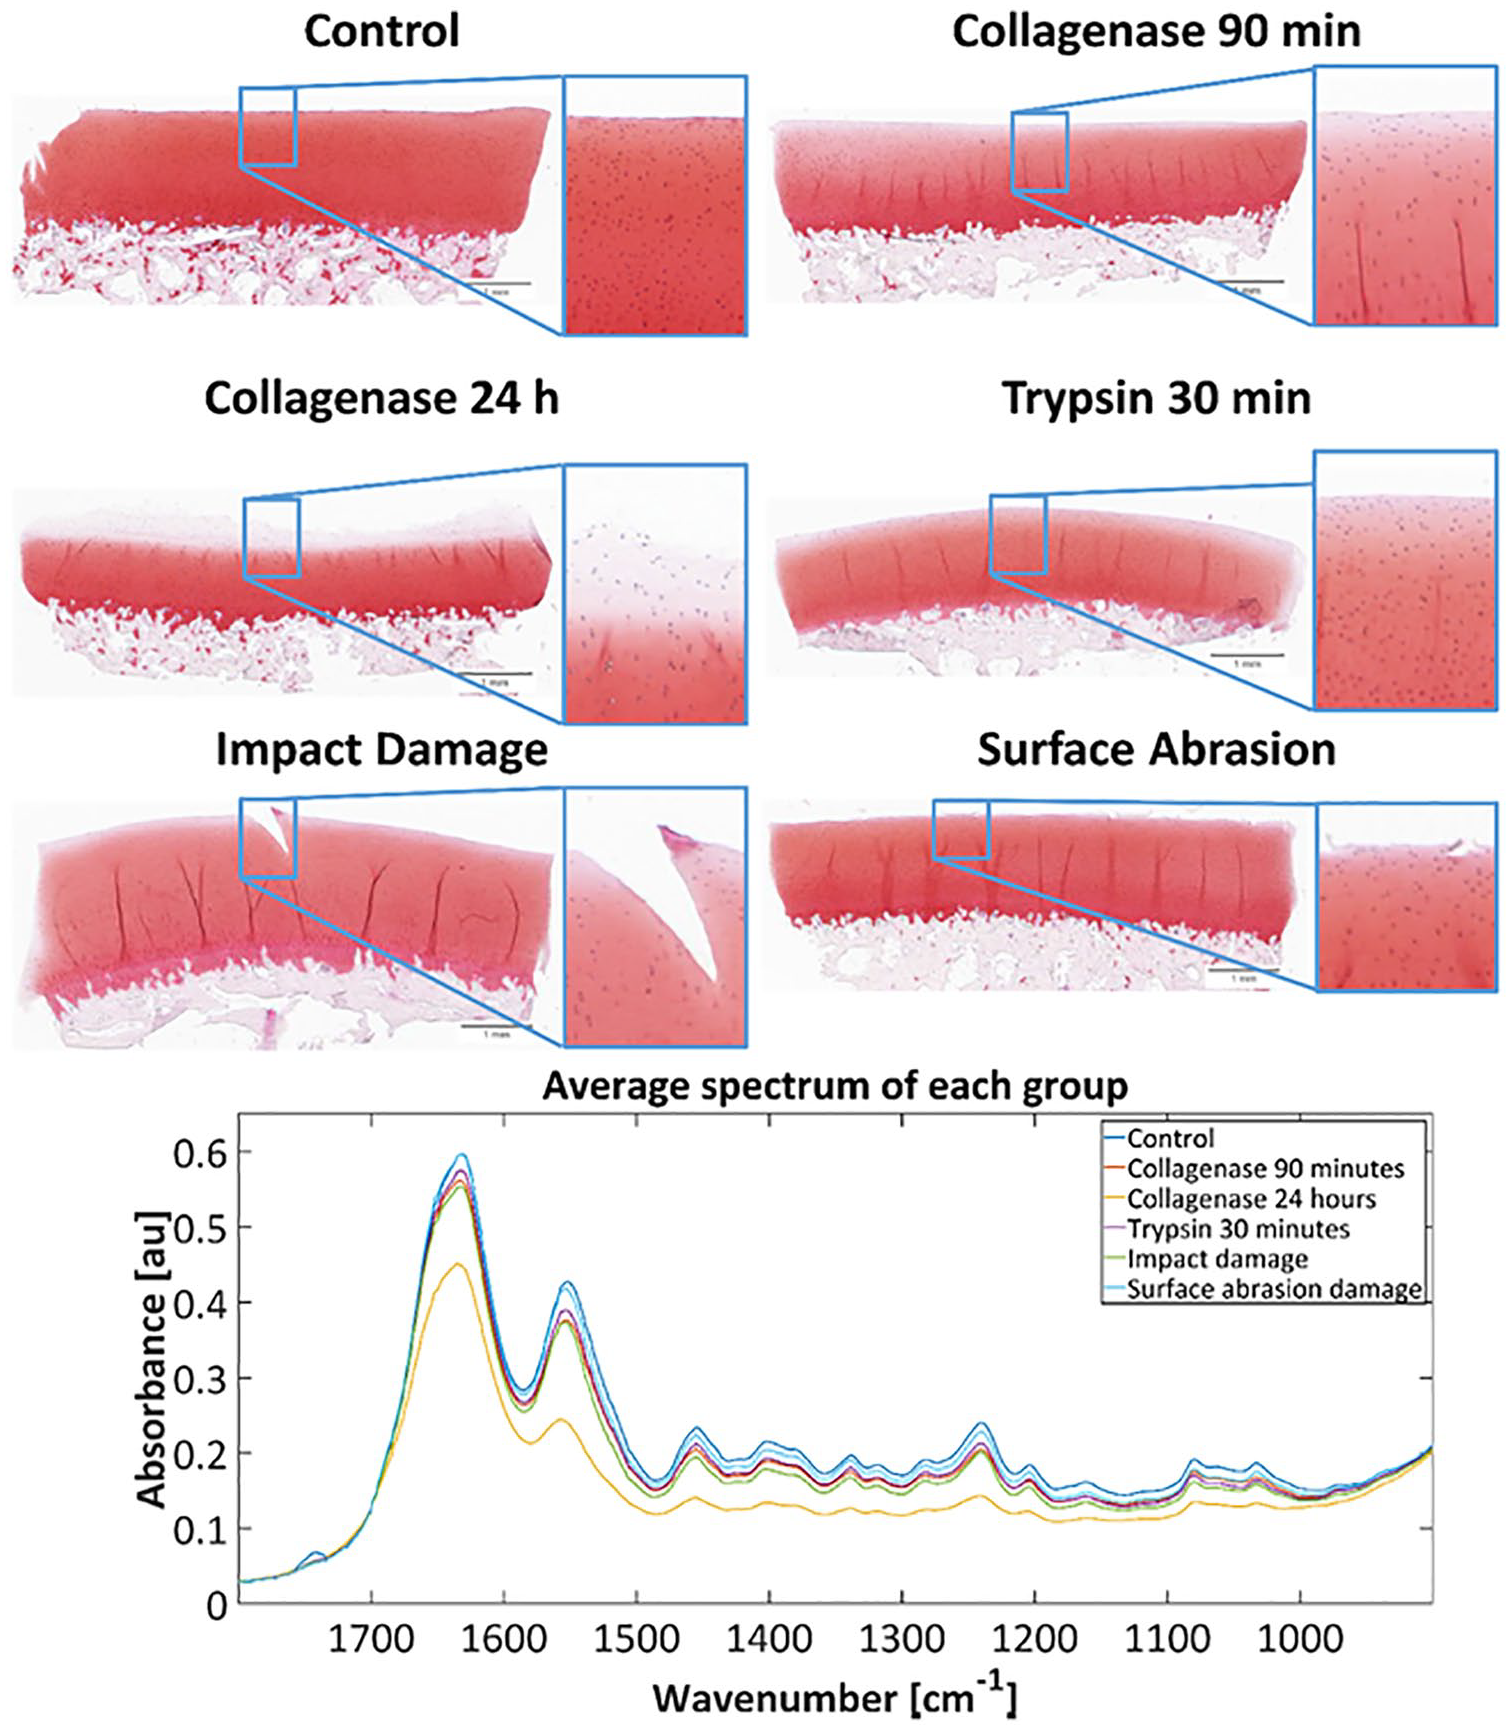
Safranin-O-stained histological sections visualizing the damage induced by different treatments (top); mean spectra of the damage groups and the control group (bottom).
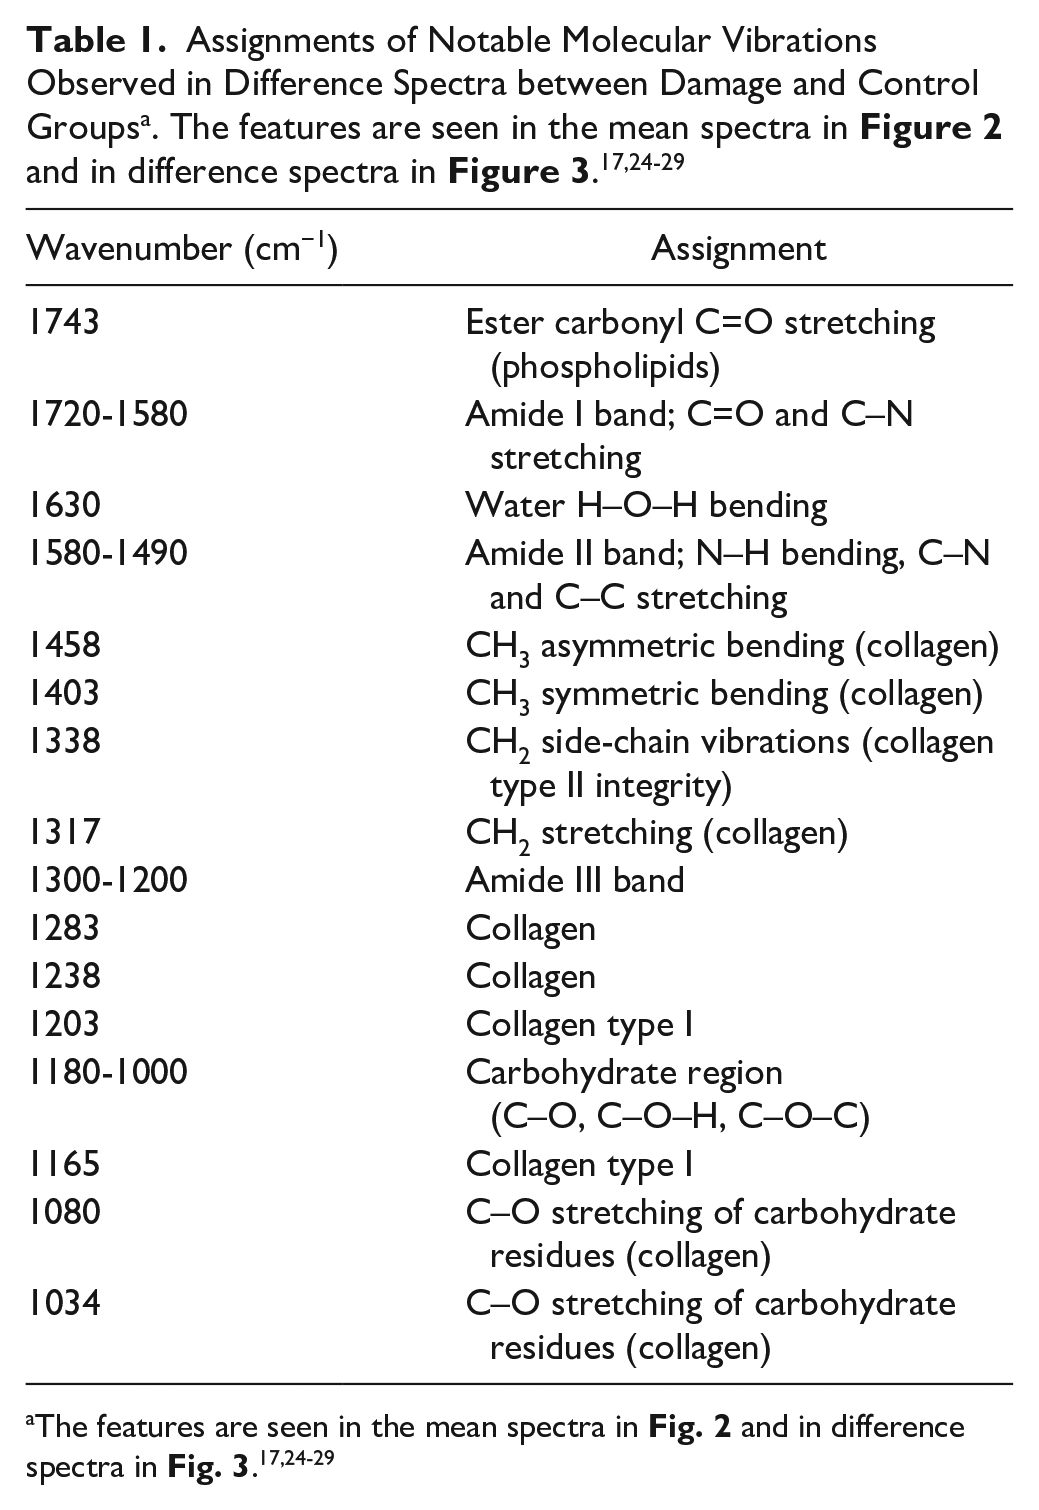
The most notable differences between the damage and control groups in the FTIR-ATR spectral data were observed in Amide I, II, and III regions ( Table 1 ). Spectra of damaged cartilage showed decreased absorbance compared to controls in all cases. The greatest difference between the control and damage groups was seen in the 24-hour collagenase group. In contrast, the surface abrasion group was observed to be the least different from the control. The differences between the damage and control groups can be seen from the difference spectra ( Fig. 3A ).
(
Multiple collagen peaks, for example, at 1458 cm−1, 1403 cm−1, 1338 cm−1, 1317 cm−1, 1238 cm−1, 1203 cm−1, 1165 cm−1, and 1080 cm−1 (Table 1), can be identified from the difference spectra ( Fig. 3A ). The peak at 1338 cm−1 corresponds to CH2 side-chain vibration of collagen and it is more specifically related to the integrity of type II collagen. 23 The peak at 1317 cm−1, originating from CH2 stretching, has also been shown to be associated with collagen. 24 These peaks were clearly seen in the difference spectra of both collagenase groups and impact damage group ( Fig. 3A ), while trypsin and surface abrasion damage groups did not show such changes. Similarly, the collagen C–O stretching peaks at 1080 cm−1 and 1034 cm−1 were only seen in the difference spectra of collagenase and impact damage groups ( Fig. 3B ).
Binary classification models performed very well in discriminating treatment group against control group in each studied case. PLS-DA accuracies ranged from 95.8% to 84.7%, while SVM models had accuracies between 91.7% and 80.6%, and RF between 90.3% and 77.8%. Sensitivity (TPR) for SVM classifiers ranged from 91.7% to 75.0%, RF classifiers from 91.7% to 75.0%, and PLS-DA from 91.7% to 69.4%. Specificity (TNR) for PLS-DA ranged from 100% to 80.6%, RF from 91.7% to 80.6%, and SVM from 91.7% to 80.6% ( Table 2 ). Thus, we can summarize that for accuracy, PLS-DA performed best, followed by SVM and RF. For sensitivity, SVM and RF were slightly better than PLS-DA. Specificity performance was best in PLS-DA, followed by SVM and RF, which performed equally well.
Performance of RF, PLS-DA, and SVM Binary Classifier Models a .
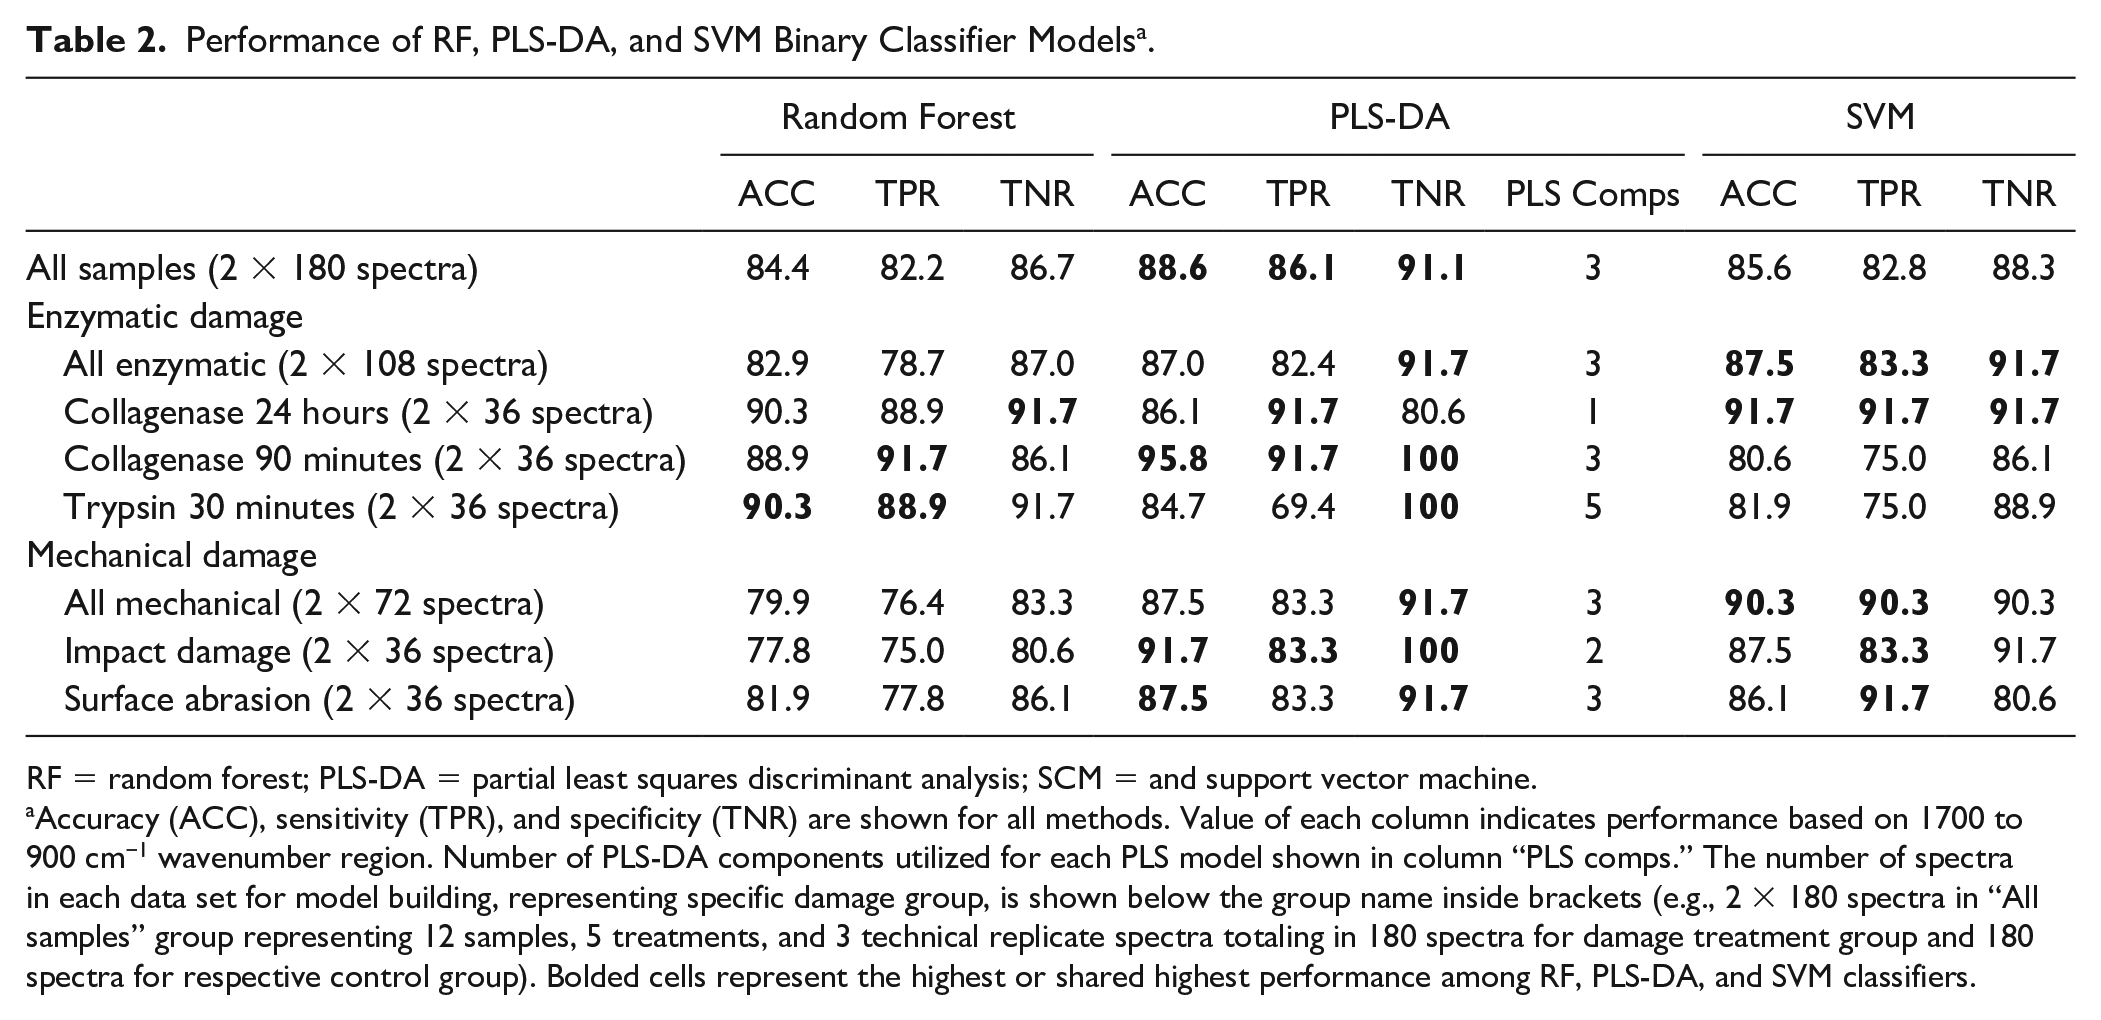
RF = random forest; PLS-DA = partial least squares discriminant analysis; SCM = and support vector machine.
Accuracy (ACC), sensitivity (TPR), and specificity (TNR) are shown for all methods. Value of each column indicates performance based on 1700 to 900 cm−1 wavenumber region. Number of PLS-DA components utilized for each PLS model shown in column “PLS comps.” The number of spectra in each data set for model building, representing specific damage group, is shown below the group name inside brackets (e.g., 2 × 180 spectra in “All samples” group representing 12 samples, 5 treatments, and 3 technical replicate spectra totaling in 180 spectra for damage treatment group and 180 spectra for respective control group). Bolded cells represent the highest or shared highest performance among RF, PLS-DA, and SVM classifiers.
Discussion
In this study, we hypothesized that fiber-optic FTIR-ATR spectroscopy can detect degenerative changes in AC associated with early OA. Bovine AC specimen were damaged either mechanically or enzymatically to simulate early stage (collagenase 90-minutes and trypsin 30-minutes), posttraumatic (impact damage and surface abrasion), and late stage (collagenase 24-hour) OA. The results of this study show that FTIR-ATR spectroscopy combined with multivariate classification methods, such as RF, PLS-DA, and SVM, can distinguish degenerated AC from intact normal tissue with good classification accuracy, sensitivity, and specificity. The enzymatic and mechanical damage models were observed to create degenerative changes similar to those occurring in OA. The findings encourage further investigation of more complex OA models accounting for other tissue level changes occurring during the development and progression of OA.
FTIR spectroscopic imaging has been previously reported to be well suited for cartilage tissue measurements, 16 and it has also been used to measure enzymatically degraded cartilage.30-32 However, to our knowledge, this is the first time when enzymatically and mechanically damaged fresh bovine cartilage has been studied with a FTIR fiber-optic probe. While the patellar samples are not from a highly weight-bearing area, bovine patellar cartilage has been shown to be suitable models of early human OA since it closely resembles human cartilage in thickness, morphometry, and zonality. 33 The use of fresh cartilage allowed a controlled spectroscopic comparison of intact and degenerated tissues, and the results suggest that fiber-optic FTIR-ATR spectroscopy could also be suitable for in vivo cartilage measurements. In earlier ex vivo studies, fiber-optic FTIR-ATR spectra have been shown to correlate to histopathological OA grade in human and rabbit cartilage.34,35 We wanted to clarify whether FTIR-ATR spectroscopy is sensitive to minor degradation by comparing the cartilage spectra before and after artificially created damage. The results of this study show that FTIR-ATR spectroscopy can also detect small degenerative changes, suggesting it may be useful for evaluating the presence of incipient posttraumatic OA, for example, after joint injuries.
Safranin-O staining is a sensitive histological method for analyzing the extent of proteoglycan loss in AC. 36 Based on Safranin-O staining, the trypsin treatment showed degradation of proteoglycans in superficial layer. Even though trypsin is often used to deplete cartilage proteoglycans, it has been shown that it is not completely specific to proteoglycans, since it also has a minor degradative effect on already cleaved collagen. 37 Ninety-minute collagenase treatment showed depletion of proteoglycans as a result of collagen network disruption, while the surface layer structure was fully disintegrated in the 24-hour collagenase treatment group. Impact damage group samples had large cracks extending to mid or deep zone. The compression from the impact damage most likely caused depletion of proteoglycans due to collagen network disintegration. Slight proteoglycan loss can be seen on the histological Safranin-O-stained sections close to the edges of the cracks. Surface abrasion group shows fibrillation of the surface layer, while having limited effect on Safranin-O staining intensity, indicating the damage to the tissue is not extending beyond the surface.
FTIR-ATR gathers signal only from the first few micrometers of the tissue, so it is very well suited for detecting superficial changes. Most of the damage shown in histological images is indeed very superficial and only barely visible in the histological images (except collagenase 24-hour group samples). Due to the limited penetration depth of FTIR-ATR, the spectra consisted of collagen bands and no visible proteoglycans bands were identified. However, the difference spectra of trypsin and surface abrasion groups displayed features that we associated with proteoglycans, suggesting a loss of superficial proteoglycans in these groups. Thus, although the FTIR-ATR spectra are dominated by the collagen features, we believe that the spectra still contain a small contribution of proteoglycans as well. Nevertheless, we are not certain whether the machine learning models detect the proteoglycan loss directly or are they based on other associated changes. Furthermore, we observed a change in the lipid region (1720-1740 cm−1) in all groups. However, since we were not sure whether the changes were due to residual fat on the tissue surface, the lipid peak region was excluded from machine learning models.
Spectral changes are in line with the results observed in histology. Collagenase enzyme group had reduced intensity in the collagen peaks. Ninety-minute treatment showed moderate and 24-hour treatment showed major changes. Somewhat similar spectral changes were observed in trypsin treatment group compared to collagenase degradation groups. One distinct difference, however, is that the changes to collagen peaks at 1337 cm−1, 1080 cm−1, and 1034 cm−1 28 are not as pronounced in the trypsin or surface abrasion groups when compared to other damage groups. Surface abrasion and trypsin groups showed slight spectral changes attributed to the loss of proteoglycans seen as a decreased absorption in 1040 to 1080 cm−1 without the distinct collagen peaks at 1080 cm−1 or 1034 cm−1 ( Fig. 3A ). On the other hand, the impact damage group showed collagen network disorganization, causing spectral changes which were more similar to collagenase treatment groups.
The classifiers selected for this study (RF, PLS-DA, and SVM) have been used in similar tasks before.19,38-41 The models established using these classifiers provided excellent classification on our dataset. PLS-DA achieved best accuracy for models including all samples, collagenase 90-minute, impact damage and surface abrasion, while SVM achieved best accuracy for enzymatic, collagenase 24-hour and mechanical treatment groups, and RF achieved best accuracy for trypsin group. Overall, all classifiers were able to differentiate the treated cartilage from untreated cartilage. PLS-DA showed slightly more consistent performance when compared to RF and SVM. Furthermore, the PLS-DA models were relatively simple as they had only 1 to 3 PLS components. Therefore, it could be argued that the linear PLS-DA should be preferred over the nonlinear models. However, nonlinear models established by RF and SVM may prove to be efficient for more heterogeneous data, for example, when osteoarthritic human cartilage is studied.
One limitation of this study is the small number of samples, which is due to the sample measurement protocol. It is known that freezing cartilage tissue may change its biochemical and biomechanical properties, 42 and therefore, the use of fresh cartilage is important especially when evaluating the suitability of the method for in vivo measurements. Not being able to freeze the samples limited the number of samples which could be prepared and measured in a reasonable time. For this reason, an external test set could not be used to estimate classification model performance. However, leave-one-individual-out cross-validation is a good estimate of model’s accuracy in such case. A larger dataset is needed to establish more reliable and robust models and validate the obtained results.
Fiber-optic FTIR-ATR spectroscopy offers a viable way to detect mechanical and enzymatic degeneration of fresh AC. These degenerative changes simulate the pathological changes occurring during the progression of OA. PLS-DA, RF, and SVM classifiers combined with FTIR-ATR spectroscopy can offer additional tools for objective assessment of AC health during arthroscopy in the future. Current clinical arthroscopic evaluation is subjective, and its reproducibility has been shown to be weak. 7 Furthermore, current arthroscopic methods are not sensitive to minor degradative changes in cartilage tissue. The proposed fiber-optic spectroscopic methods could increase the sensitivity of arthroscopy to early degradative changes to enable, for example, accurate detection of incipient posttraumatic OA.
Methods that are able to assess degeneration of cartilage, especially during early stages of OA, are actively developed. While the potential of fiber-optic FTIR-ATR spectroscopy for assessing OA grade of human cartilage has been demonstrated earlier, in this study, we demonstrated that fiber-optic FTIR-ATR spectroscopy is also sensitive to minor cartilage damage, which could be useful, for example, in knee arthroscopy after an injury. Objective measures of cartilage quality provided by fiber-optic FTIR-ATR spectroscopy could improve the arthroscopic evaluation of cartilage damage, and potentially also improve the outcome of repair surgeries by providing accurate objective information of the extent of damaged tissue.
Footnotes
Animal Welfare
Guidelines for humane animal treatment did not apply to the present study because only slaughterhouse waste products were used.
Acknowledgments and Funding
The author(s) disclosed receipt of the following financial support for the research, authorship, and/or publication of this article: This work was supported by the Europe Union’s Horizon 2020 Research and Innovation Programme (H2020-ICT-2016-2017) project MIRACLE (Grant Agreement Number 780598), and the Academy of Finland (Project Numbers 310466 and 315820).
Ethical Approval
Ethical approval was not sought for the present study because experiments were performed on bovine patellae obtained from the slaughterhouse after animal sacrifice.
Declaration of Conflicting Interests
The author(s) declared no potential conflicts of interest with respect to the research, authorship, and/or publication of this article.