
Abstract
Objective
To investigate acetabular cartilage thickness among (1) 8 measurement locations on the lunate surface and (2) different types of femoroacetabular impingement (FAI).
Design
Prospective descriptive study comparing in vivo measured acetabular cartilage thickness using a validated ultrasonic device during surgical hip dislocation in 50 hips. Measurement locations included the anterior/posterior horn and 3 locations on each peripheral and central aspect of the acetabulum. The clock system was used for orientation. Thickness was compared among cam (11 hips), pincer (8 hips), and mixed-type (31 hips) of FAI. Mean age was 31 ± 8 (range, 18-49) years. Hips with no degenerative changes were included (Tönnis stage = 0).
Results
Acetabular cartilage thickness ranged from 1.7 mm to 2.7 mm and differed among the 8 locations (P < 0.001). Thicker cartilage was found on the peripheral aspect at 11 and 1 o’clock positions (mean of 2.4 mm and 2.7 mm, respectively). At 5 out of 8 locations of measurement (anterior and posterior horn, 1 o’clock peripheral, 12 and 2 o’clock central), cartilage thickness was thinner in hips with pincer impingement compared to cam and/or mixed-type of FAI (P ranging from <0.001 to 0.031). No difference in thickness existed between cam and mixed-type of impingement (P = 0.751).
Conclusion
Acetabular cartilage thickness varied topographically and among FAI types. This study provides first baseline information about topographical cartilage thickness in FAI measured in vivo. Thinner cartilage thickness in pincer deformities could be misinterpreted as joint degeneration and could therefore have an impact on indication for hip preserving surgery.
Introduction
The main characteristic in a hip joint with early development of osteoarthritis is cartilage degeneration with thinning. Minimal joint space width has been proposed as a threshold for indication of joint preserving surgery. 1 Cartilage thickness in hips without joint degeneration might differ among hip pathomorphologies, for example, thicker cartilage has been reported for dysplastic hips.2,3 Despite high-resolution magnetic resonance imaging (MRI), separate acetabular and femoral cartilage thickness measurements are only feasible with traction MRI.3,4 In the hip, the acetabular and femoral cartilage layers are, in contrast to other joints like the knee, directly opposed to each other and congruent. This fact together with the suction-seal effect of the labrum prevent an accumulation of contrast agent between the cartilage layers and makes separate acetabular and femoral cartilage thickness measurements even with MRI arthrogram evaluation difficult. 5 Alternatively, acetabular and femoral cartilage thickness can be measured in a cadaveric setting.6-10 Due to these difficulties, information about acetabular and femoral cartilage thickness among hips with femoroacetabular impingement (FAI) is unknown. From clinical experience with the treatment of FAI, the authors of the present study had the impression that not all hips with impingement have a comparable cartilage thickness despite missing joint degeneration.
The surgical hip dislocation for the treatment of FAI gives full access to the entire hip joint and cartilage of the femoral head and acetabulum.11,12 Ultrasonic cartilage thickness measurement could be shown to be accurate and reliable. 13 During surgical hip dislocation cartilage thickness could be determined using a hand-held ultrasonic device. Since early cartilage damage typically affects the acetabulum in hips with FAI, the goal of the current study was to determine topographic cartilage thickness of the acetabulum in hips with FAI. Using in vivo and ultrasonic measurement of cartilage thickness during surgical hip dislocation, the following questions were asked: (1) How does topographical cartilage thickness of the acetabulum vary in hips with FAI? (2) Do differences in cartilage thickness among hips with pincer, cam, and mixed-type of FAI exist?
Methods
Between March 2007 and July 2011, 220 patients (235 hips) aged more than 16 years were prospectively enrolled at the authors’ institution that underwent surgical hip dislocation for the treatment of FAI. All patients presented with hip pain and showed radiographic signs of a cam deformity, a pincer morphology, or both. A total of 119 patients (129 hips) with radiographic signs of joint degeneration on the anteroposterior (AP) pelvic radiograph (classified Tönnis stage ≥1), 27 patients (27 hips) with previous hip surgery, and 7 patients (7 hips) with a more complex form of FAI due to Legg-Calvé-Perthes disease were excluded from the present study. Since all intraoperative ultrasonic cartilage thickness measurements were performed by one of the authors (KAS) only, 20 patients (22 hips) with FAI that were operated by other surgeons during this period of time were excluded. This left 47 patients (50 hips) with FAI for evaluation of cartilage thickness ( Table 1 ). All patients underwent surgical hip dislocation with isolated offset correction in 4 hips and combined offset correction and acetabular rim trimming in 46 hips. The mean age at surgery was 31 ± 8 (range, 18-49) years. The series included a majority of 29 male patients (62%; Table 1 ). Cartilage thickness was compared among 3 study groups including hips with cam-type impingement (11 hips), pincer-type impingement (8 hips), or a mixed-type of FAI (31 hips). The allocation to each group was based on the following criteria on the conventional AP pelvic radiograph and axial radiograph (cross-table axial view). A cam-type deformity was defined as an alpha angle exceeding 50° 14 on the AP or axial radiograph. A pincer-type deformity was defined by an excessive lateral coverage (lateral center edge [LCE] angle exceeding 38° 15 ), protrusio actabuli, or acetabular retroversion. Protrusio acetabuli was defined by a femoral head touching or crossing the ilioischial line. Acetabular retroversion was considered positive if a positive crossover sign 16 with a minimal retroversion index 17 of 10% existed. If both cam and pincer deformities was present the hip was classified as mixed type of FAI. The study was approved by the local institutional review board.
Demographic and Radiographic Data of the 3 Study Groups a .
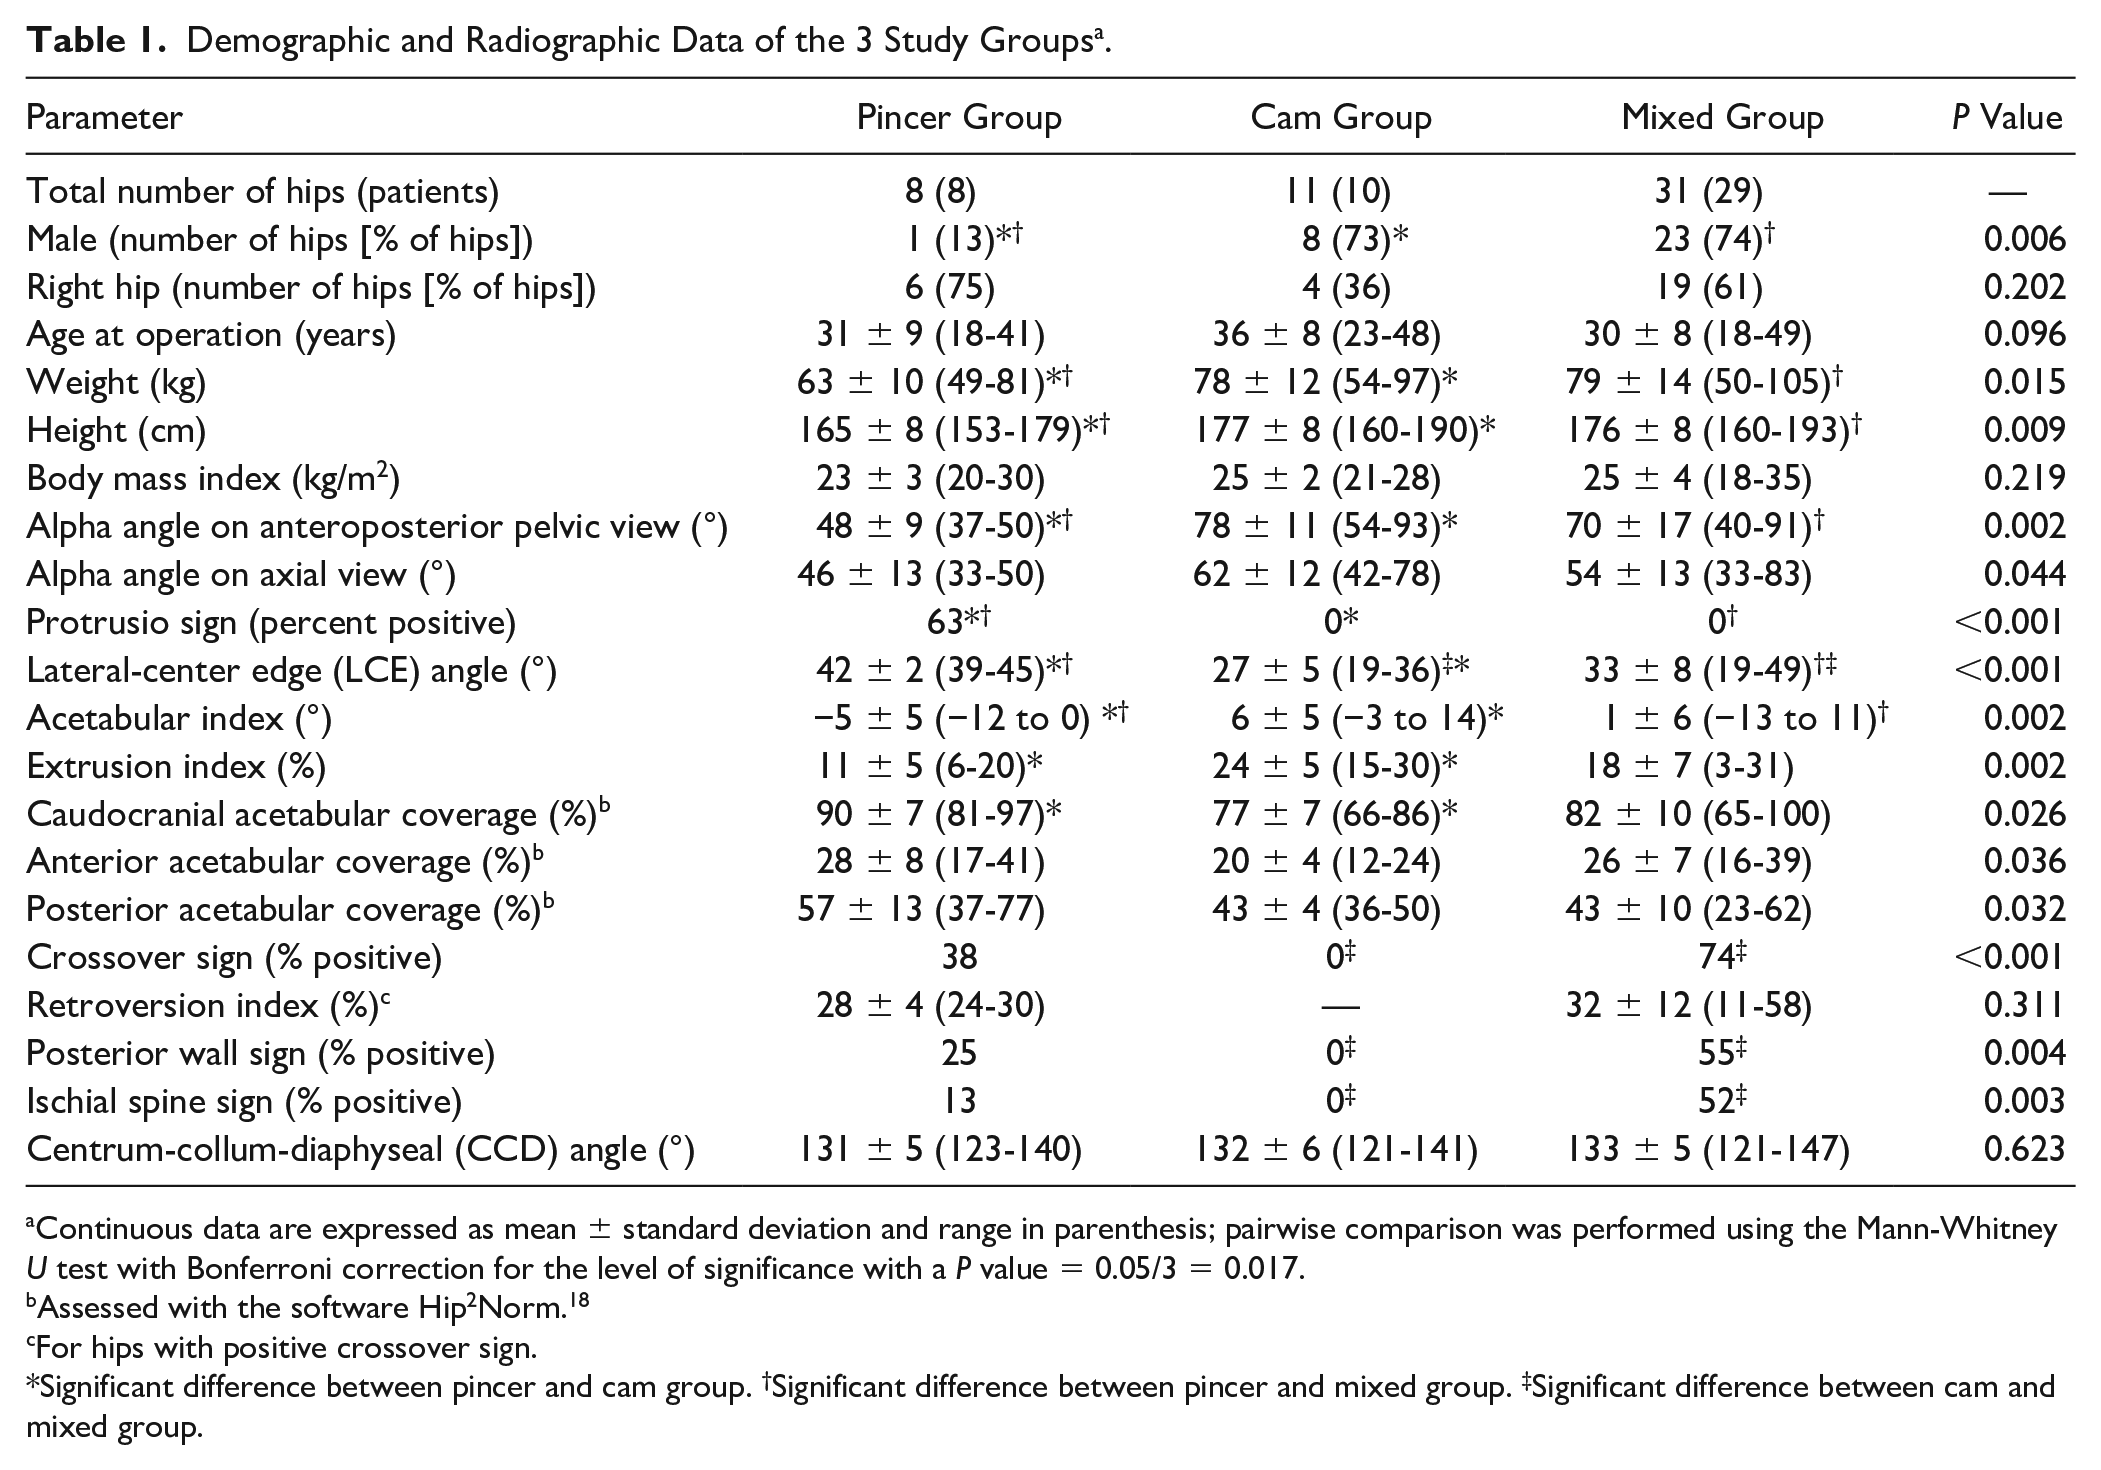
Continuous data are expressed as mean ± standard deviation and range in parenthesis; pairwise comparison was performed using the Mann-Whitney U test with Bonferroni correction for the level of significance with a P value = 0.05/3 = 0.017.
Assessed with the software Hip2Norm. 18
For hips with positive crossover sign.
Significant difference between pincer and cam group. †Significant difference between pincer and mixed group. ‡Significant difference between cam and mixed group.
All patients presented with a symptomatic FAI at the outpatient clinic of the authors’ institution. They all presented with hip pain and positive anterior impingement test. Typically, inguinal pain can be triggered in deep flexion or combined flexion and internal rotation of the hip. All patients had a preoperative AP pelvic radiograph performed with the patient placed in supine position, the leg rotated internally by 20° with a film-focus distance of 1.2 m. The central beam was directed to the center between the symphysis and a line connecting the anteriorsuperior iliac spines. An additional cross-table axial view was performed with the patient supine, the contralateral hip flexed, and the ipsilateral leg rotated internally by 20°. The central beam was parallel to the table, tilted by 45° and directed to the center of the femoral neck. In 38 patients (38 hips), a preoperative arthro-MRI of the hip with radial slices was available for evaluation of chondrolabral damage or the cam-type deformity circumferentially around the femoral neck. The morphology of the acetabulum and the proximal femur was assessed on the conventional radiographs by one of the authors (MKM) with the help of specific software Hip2Norm.18-20 In addition, one of the authors (MKM) measured joint space width on the conventional radiographs and on the arthro-MRI. On the AP pelvic radiograph, joint space width was measured on the medial, central, and lateral aspect in the weight-bearing zone. On the axial radiograph, the anterior and posterior joint space width was measured. In the arthro-MRI, the joint space width was measured on the radial slices at 8 corresponding locations in the joint which were used for the in vivo measurements of acetabular cartilage thickness ( Fig. 1 ; see definitions of locations of cartilage thickness measurement below).
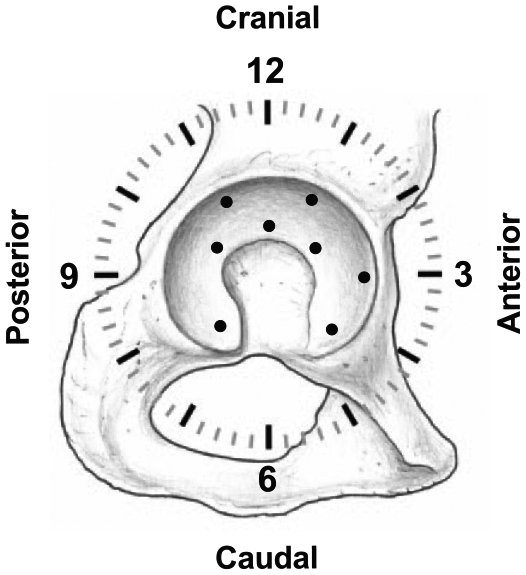
For orientation on the acetabulum the clock system was used with 6 o’clock defined as the acetabular notch, 12 o’clock on the opposite position, and 3 o’clock anterior (for both right and left hips). Ultrasonic cartilage thickness measurements of the acetabulum were performed on 8 locations on the acetabulum: 11, 1, and 3 o’clock on the peripheral acetabular sector, 10, 12, and 2 o’clock on the central acetabular sector, as well as anterior and posterior horn.
The surgical hip dislocation11,12 was performed with the patient in the lateral decubitus position. The skin incision was performed centered over the greater trochanter, the iliotibial band was split, and the Gibson interval between the gluteus maximus and medius was developed. The deep interval was developed between the piriformis and the gluteus minimus muscle. The osteotomy of the trochanter was performed in a stepped fashion to improve reduction and bony healing. After capsulotomy the range of motion and impingement mechanism was tested during surgery. After transection of the femoral head ligament and dislocation of the joint, the cartilage of the acetabulum and femoral head was inspected and documented. On the acetabulum, cartilage thickness was measured with an ultrasonic probe on 8 locations ( Fig. 1 ). For anatomic orientation the clock system was used with 6 o’clock defined at the location of the acetabular notch ( Fig. 1 ). Twelve o’clock was defined on the opposite location of the acetabular notch. Three o’clock was anterior for both right and left hips. Cartilage thickness was measured on the anterior and posterior horn of the lunate surface. In addition, measurements were performed at the 10, 12, and 2 o’clock positions of the facies lunata on the central aspect closer to acetabular notch ( Fig. 1 ). At the 11, 1, and 3 o’clock positions, cartilage thickness was measured on the peripheral aspect of the lunate surface ( Fig. 1 ). These locations for cartilage thickness measurements were chosen since FAI and early joint degeneration typically occur in the anterosuperior aspect and the acetabulum.21,22 The in vivo cartilage thickness measurements were performed with a validated ultrasonic device. 13 Specifically, an A-mode 20-MHz hand-held ultrasonic probe with a speed of sound of 1580 m/s was used. Validation was performed for this device with comparison to iodine contrast-enhanced micro-CT (computed tomography) and showed a mean accuracy of 0.074 ± 0.061 (range, 0.002-0.256) mm. 13 In addition, no systematical error in the Bland-Altman analysis 23 and a very high linear correlation 24 between the ultrasonic and mirco-CT measurements (r = 0.973; P < 0.001) was found. 13 Furthermore, a moderate to good reproducibility (test-retest error or intraobserver reliability) with a root mean square coefficient of variation of 2.71% or an intraclass correlation coefficient (ICC) 25 of 0.992 and 0.994 was found. 13 The interobserver reliability was reported with an ICC of 0.993 (95% confidence interval of 0.990-0.995). 13 The true cartilage thickness is measured with orthogonal insonation. A deviation of the angle of insonation by 10° or 20° would result in an increase of thickness measurement by 1.5% and 6.4%, respectively. 13 During surgical hip dislocation, the angle of insonation was controlled by tilting the ultrasonic device and repeated thickness measurements were performed. The smallest value was recorded as the true cartilage thickness.
A mixed effects model with Tukey adjustment for multiple comparison was used to assess the association between type of FAI (cam, pincer, mixed) and the location of in vivo cartilage thickness or joint space width (radiograph or MRI) measurements. This statistical model was chosen to account for both within-person variability (repeated measurements of cartilage thickness/joint space width in one hip joint) and across-person variability (type of FAI). Demographic and radiographic characteristics of the patients were compared among the 3 study groups using the Kruskall-Wallis test and the Mann-Whitney U test with Bonferroni correction for pairwise comparison. All statistical analysis was performed using GraphPad Prism (Version 9.0, GraphPad Software, San Diego, CA).
This prospective comparative study was approved by the ethical committee of the local state medical council Bern (Approval No. KEK 130/06). All participants gave written informed consent.
Results
Topographical cartilage thickness differed among the 8 locations of measurement on the acetabulum (P < 0.001; Table 2 ). The mean acetabular cartilage thickness ranged from 1.7 mm to 2.7 mm ( Table 2 ). The thickest cartilage of the acetabulum was found at the 1 and 11 o’clock locations on the peripheral aspect of the lunate surface with 2.7 ± 0.7 (range, 1.6-4.6) mm and 2.4 ± 0.7 (1.1-4.0) mm, respectively ( Fig. 2 ). Cartilage thickness at these 2 locations was thicker compared to all other 6 locations (P < 0.001 for all comparisons; Table 3 ).
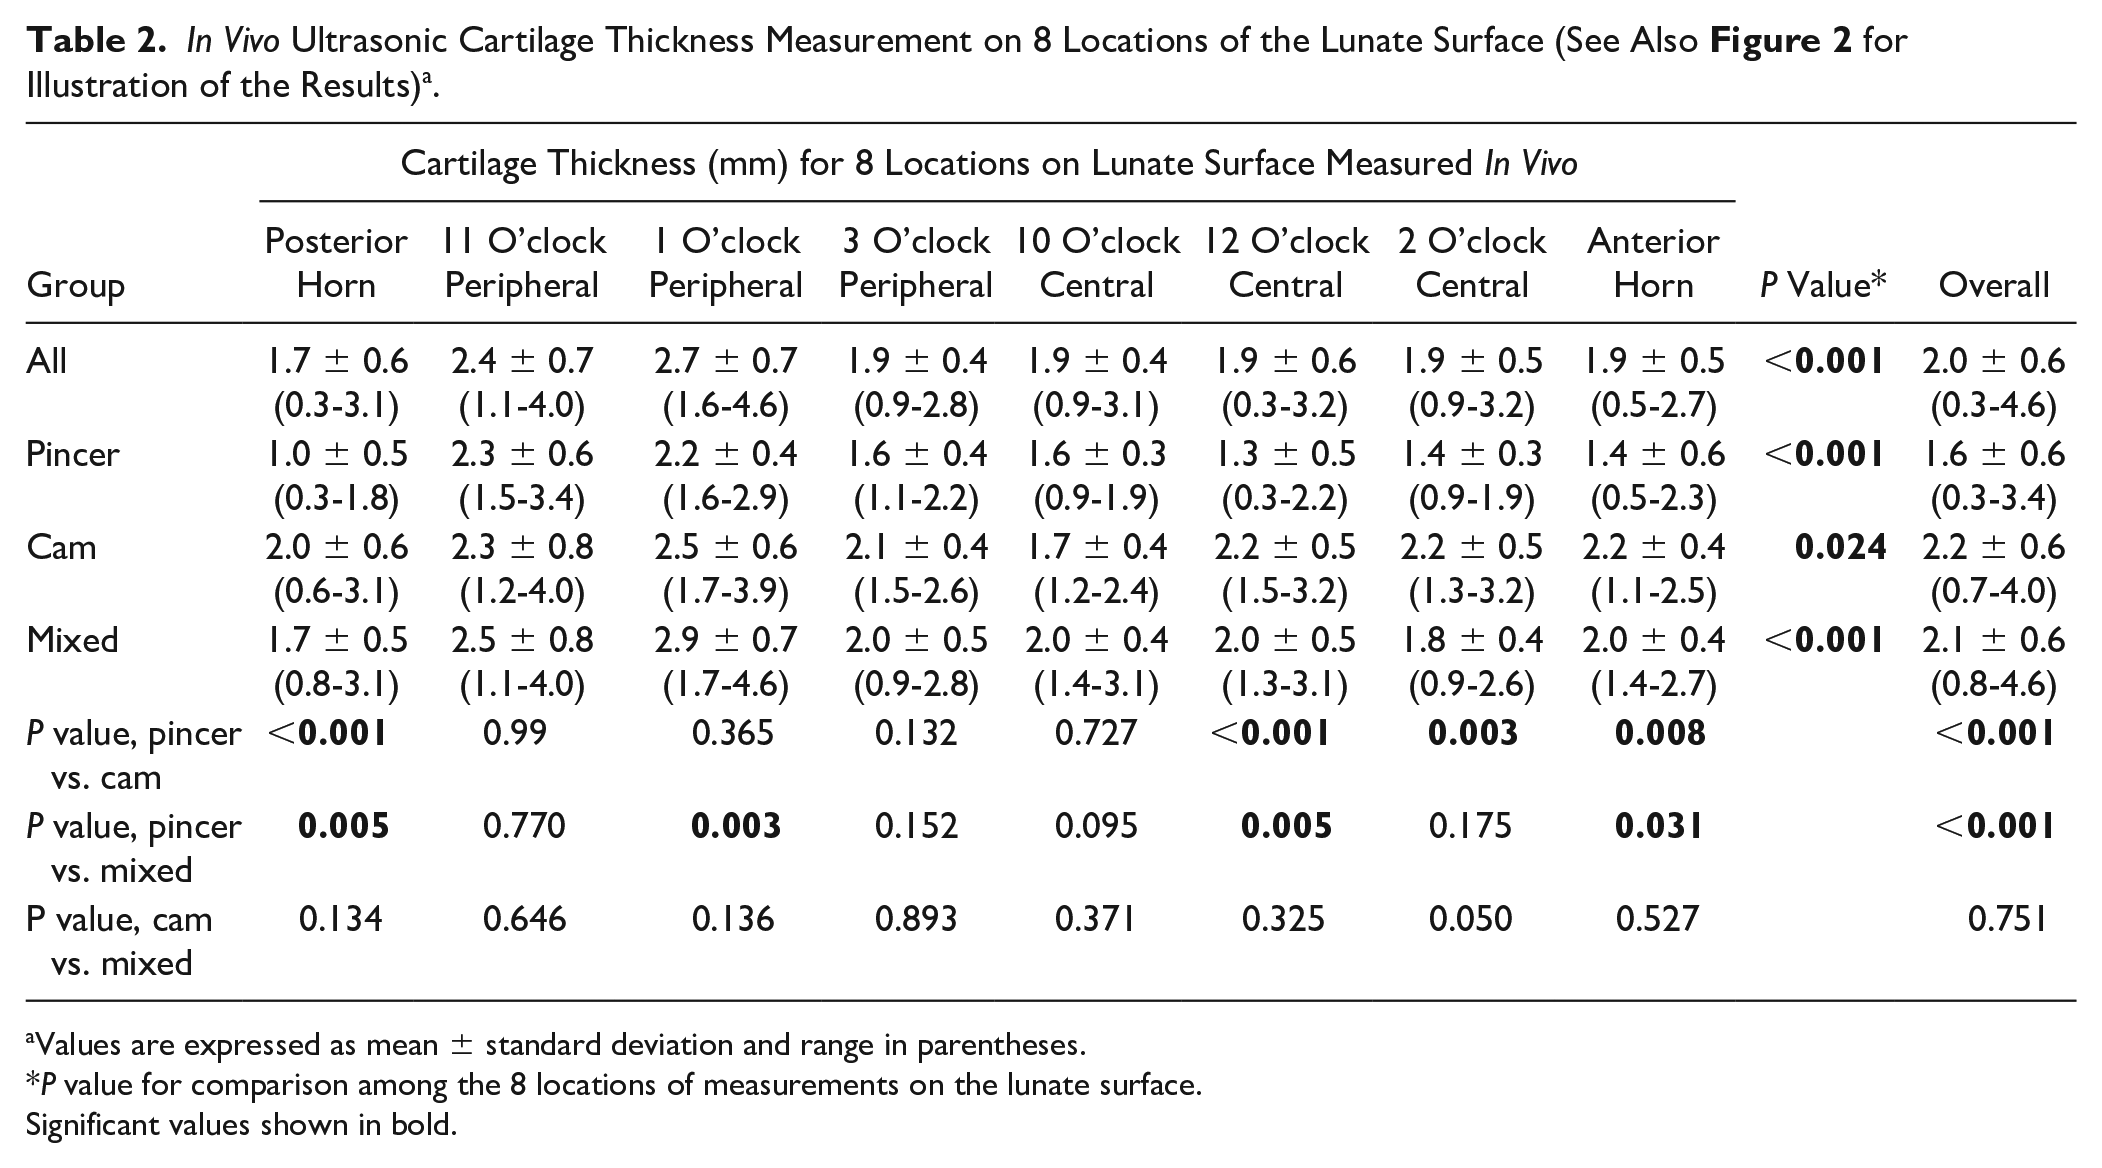
Values are expressed as mean ± standard deviation and range in parentheses.
P value for comparison among the 8 locations of measurements on the lunate surface.
Significant values shown in bold.
Mean Difference (mm) in Cartilage Thickness (Upper Right Hand Corner) and Corresponding Significance (Lower Left Hand Corner) between 2 of the 8 Locations of Measurement on the Acetabulum (n = 50 Hips) a .
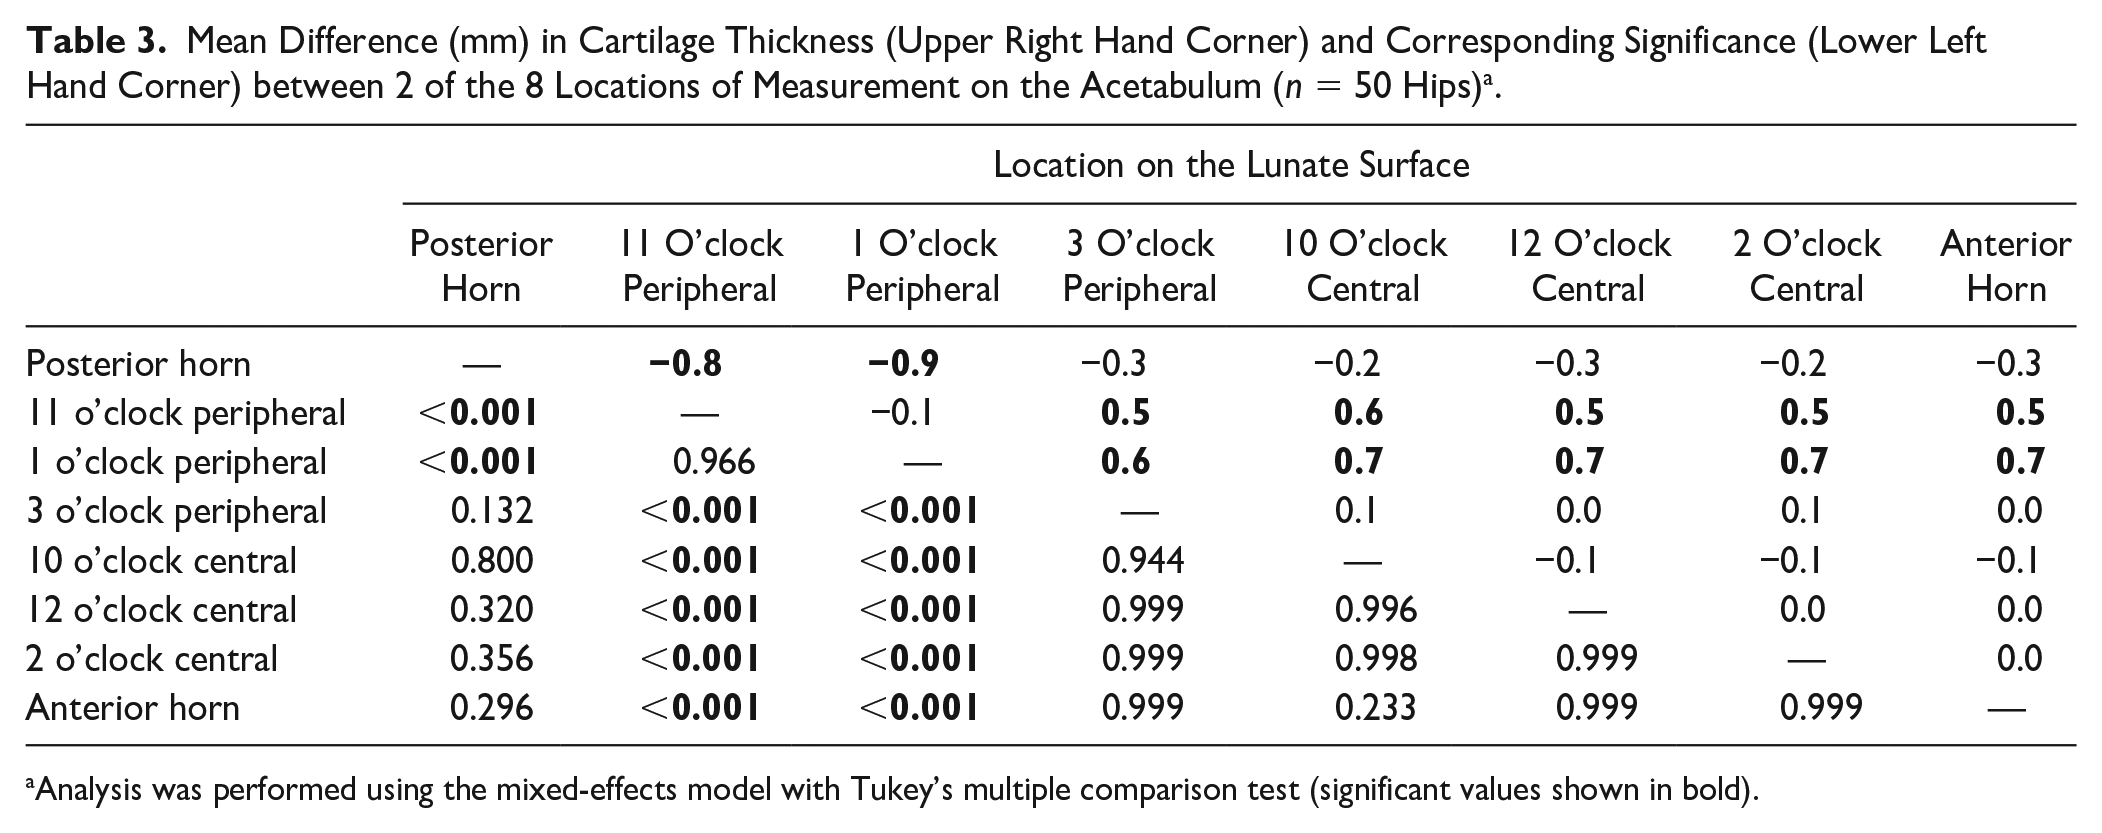
Analysis was performed using the mixed-effects model with Tukey’s multiple comparison test (significant values shown in bold).
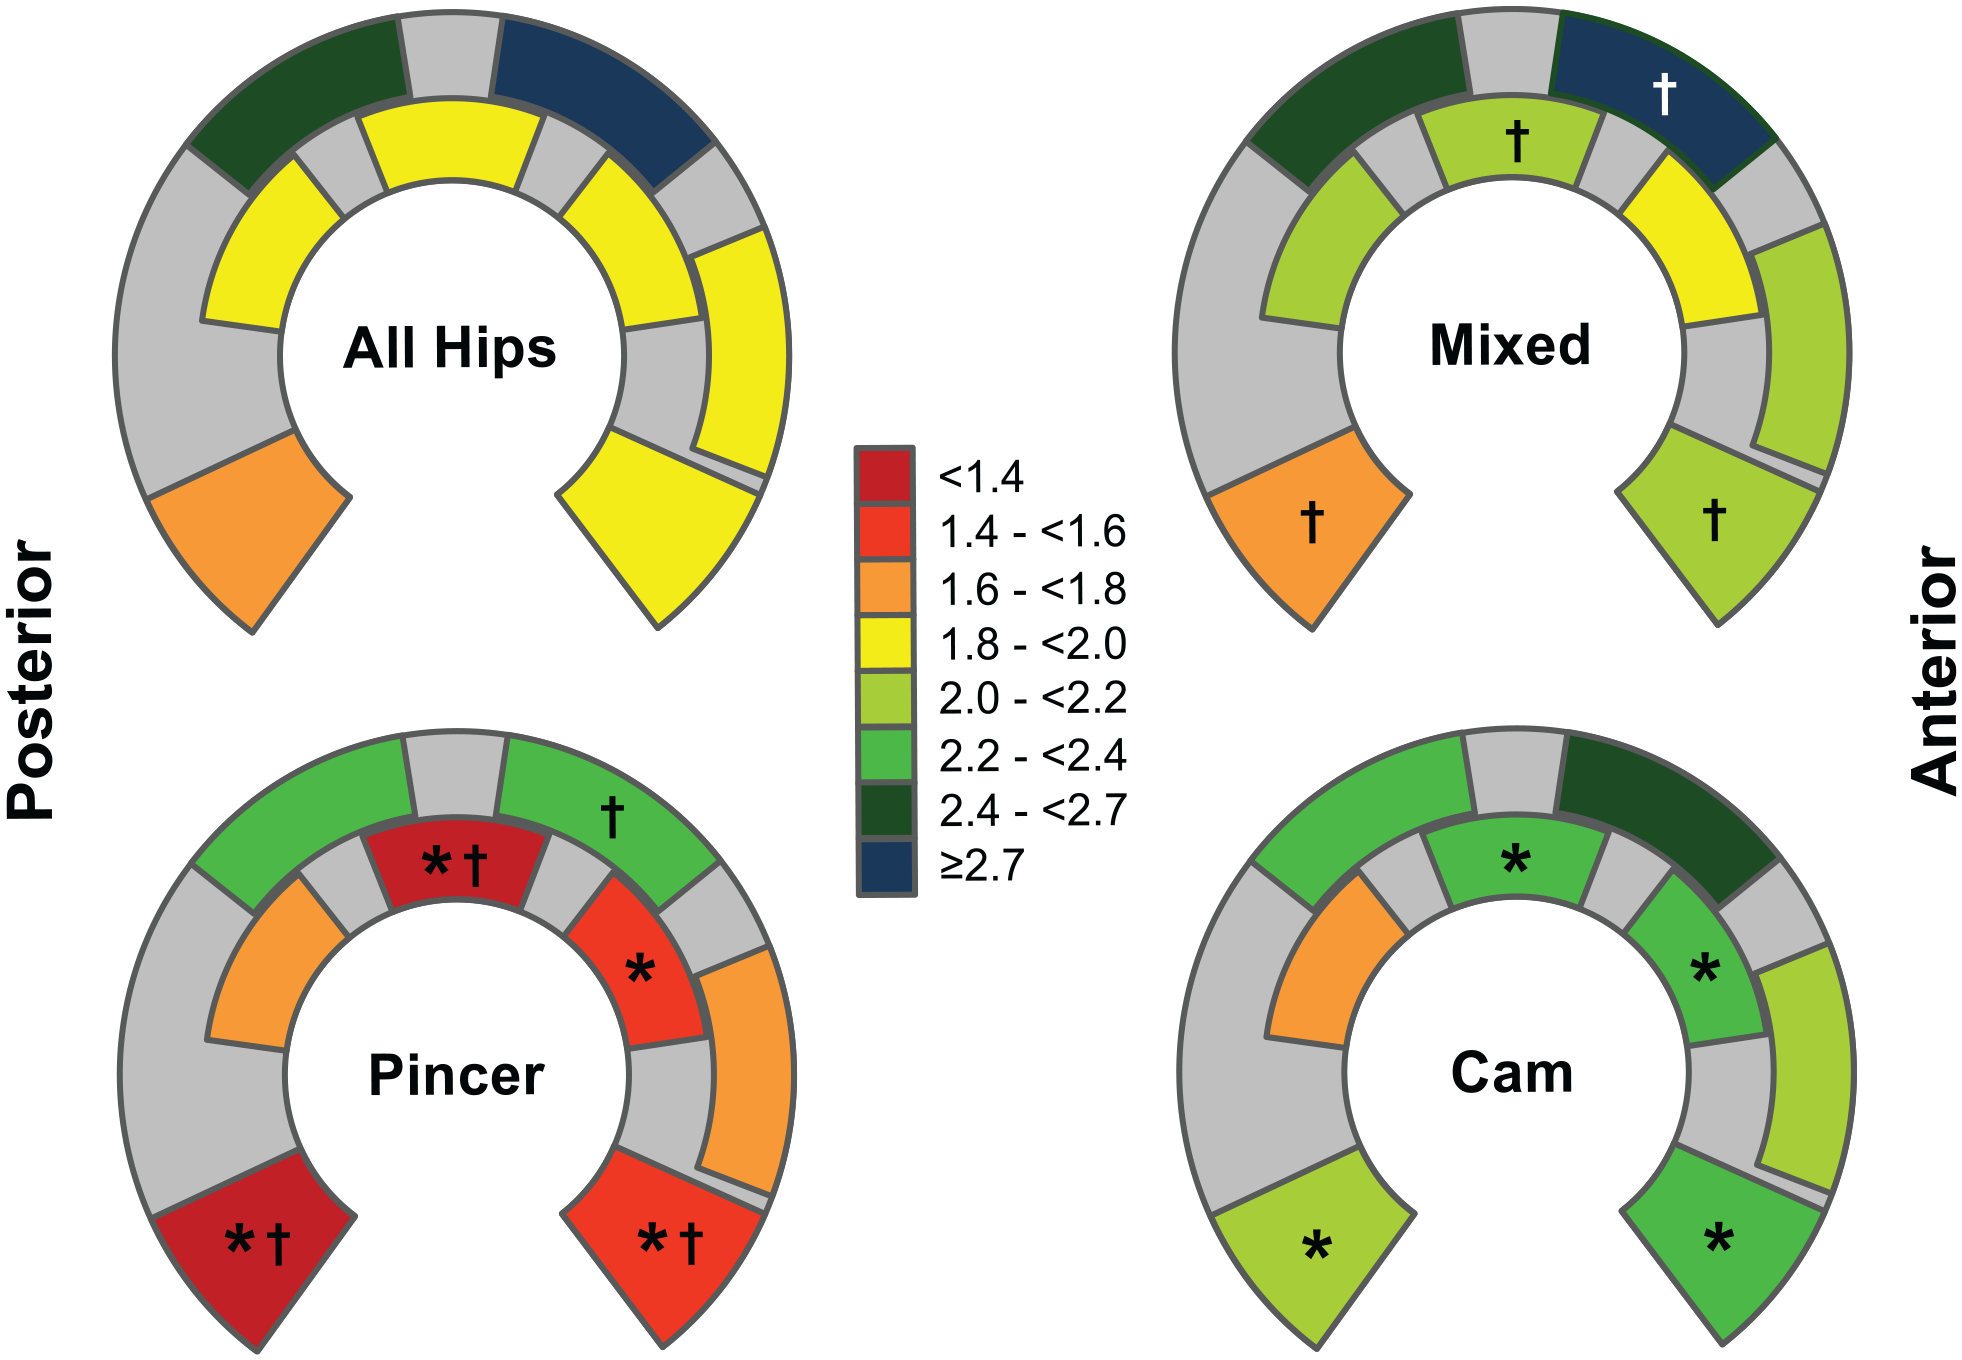
In vivo acetabular cartilage thickness differed among the 8 locations of measurement (P < 0.001; Table 2 ). The thickest cartilage was found at the 1 and 11 o’clock locations on the peripheral sector. The thinnest cartilage was found at the posterior horn ( Table 3 ). Among the 3 study groups with different types of impingement cartilage thickness was thinner at 5 out of 8 locations of measurement (anterior and posterior horn, 1 o’clock peripheral, 12 and 2 o’clock central) in hips with pincer impingement compared to cam and/or mixed-type of FAI (P ranging from <0.001 to 0.031; Table 2 ).
Cartilage thickness of the acetabulum differed among the 3 study groups with different types of FAI ( Fig. 2 ). Hips with a pincer type of FAI showed a thinner cartilage compared to hips with a cam or mixed type of FAI (P < 0.001; Table 2 ). No significant difference in cartilage thickness existed between hips with cam and mixed type of FAI (P = 0.751; Table 2 ). At 5 out of 8 locations of measurement (anterior and posterior horn, 1 o’clock peripheral, 12 and 2 o’clock central), cartilage thickness was thinner in hips with pincer type of FAI compared to cam and/or mixed type of FAI (P ranging from <0.001 to 0.031; Fig. 2 ). At those locations of measurement, cartilage thickness in hips with pincer type of FAI ranged from 1.0 to 2.2 mm compared to a range 1.7 to 2.9 mm in hips with either cam or mixed type of FAI ( Table 2 ).
Discussion
Topographical acetabular cartilage thickness differed among the 8 locations for measurement ( Fig. 2 ). Thickest cartilage was found in the superior and peripheral aspect of the acetabulum at the 11 and 1 o’clock locations representing the main weight-bearing zone ( Table 2 ). It has been shown that increased subchondral mineralization and increased cartilage thickness is due to functional adaption and mechanical stress acting on the elbow joint. 26 The results of the present study would support these findings with thicker cartilage in the superior aspect of the hip joint where the main mechanical stress is applied. The results of the present study are in accordance with previously reported findings from cadaveric or MRI settings ( Table 4 ): Thicker cartilage has been reported for the anterosuperior part of the acetabulum3,5,6,8,9 and for the peripheral aspect of the lunate surface.7,9,27 The thinnest acetabular cartilage has been reported for the posterior horn.5,6 In the current study, the thinnest cartilage thickness was also found for the posterior horn, however, without significant differences ( Fig. 2 ; Table 3 ). The in vivo results of acetabular cartilage thickness were compared to the joint space width (cumulative cartilage thickness of acetabulum and femoral head) on conventional radiographs and arthro-MRI of the same patients. In both imaging modalities, a maximal joint space width was found in the superior and peripheral aspect of the joint (11 and 1 o’clock positions in MRI or superior and lateral aspect of the AP pelvic radiograph; Fig. 3 and Supplementary Tables 1, 2, and 3). In addition, the minimal joint space width was found on the posterior horn for both imaging modalities ( Fig. 3 and Supplementary Tables 1, 2, and 3). These results for the joint space width are in accordance with the in vivo measured acetabular cartilage thickness. A comparable topographical cartilage thickness or joint space width distribution was found with a maximum in the superior and lateral aspect of the joint (1 and 11 o’clock position) and a minimum on the posterior horn ( Figs. 2 and 3 ). Surprisingly, joint space width showed comparable maximum and minimum despite the missing in vivo information regarding cartilage thickness of the femoral head. Reported topographical thickness of the femoral cartilage differs with its maximum cartilage thickness on the medial part of the head (close to the fovea) and thinner cartilage on the lateral part of the head.4,9
Selected Literature on Cartilage Thickness of the Hip Measured in Cadavers, MRI and In Vivo.
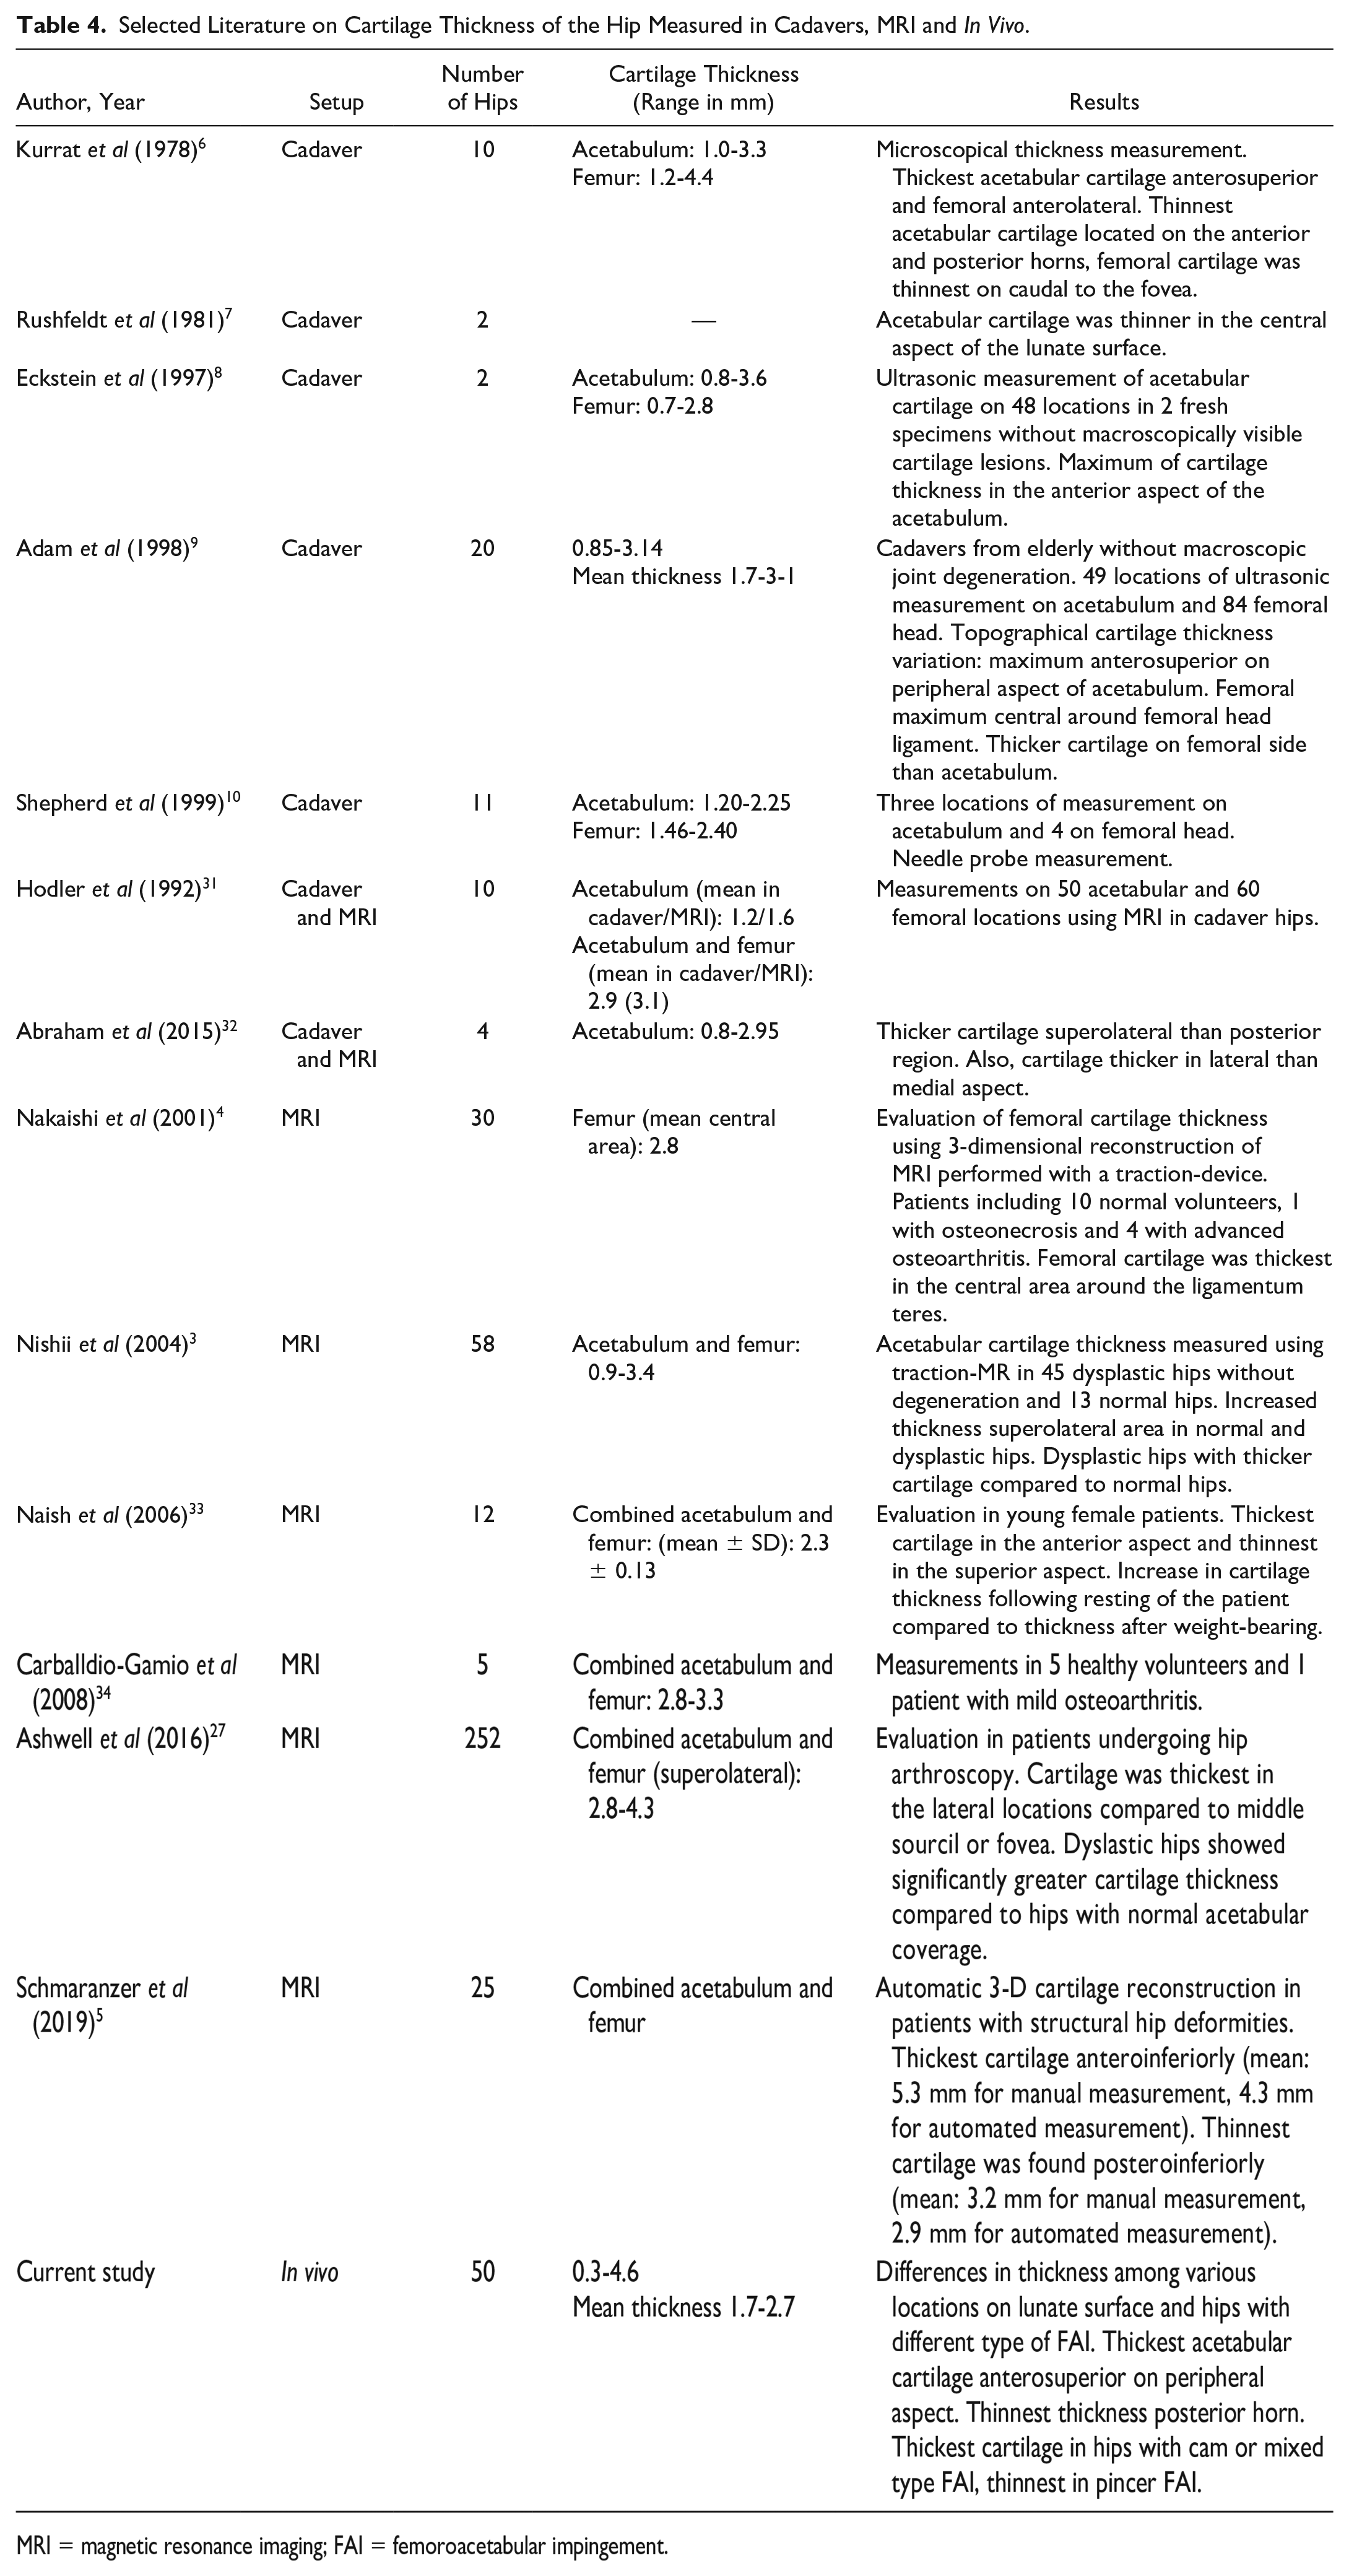
MRI = magnetic resonance imaging; FAI = femoroacetabular impingement.
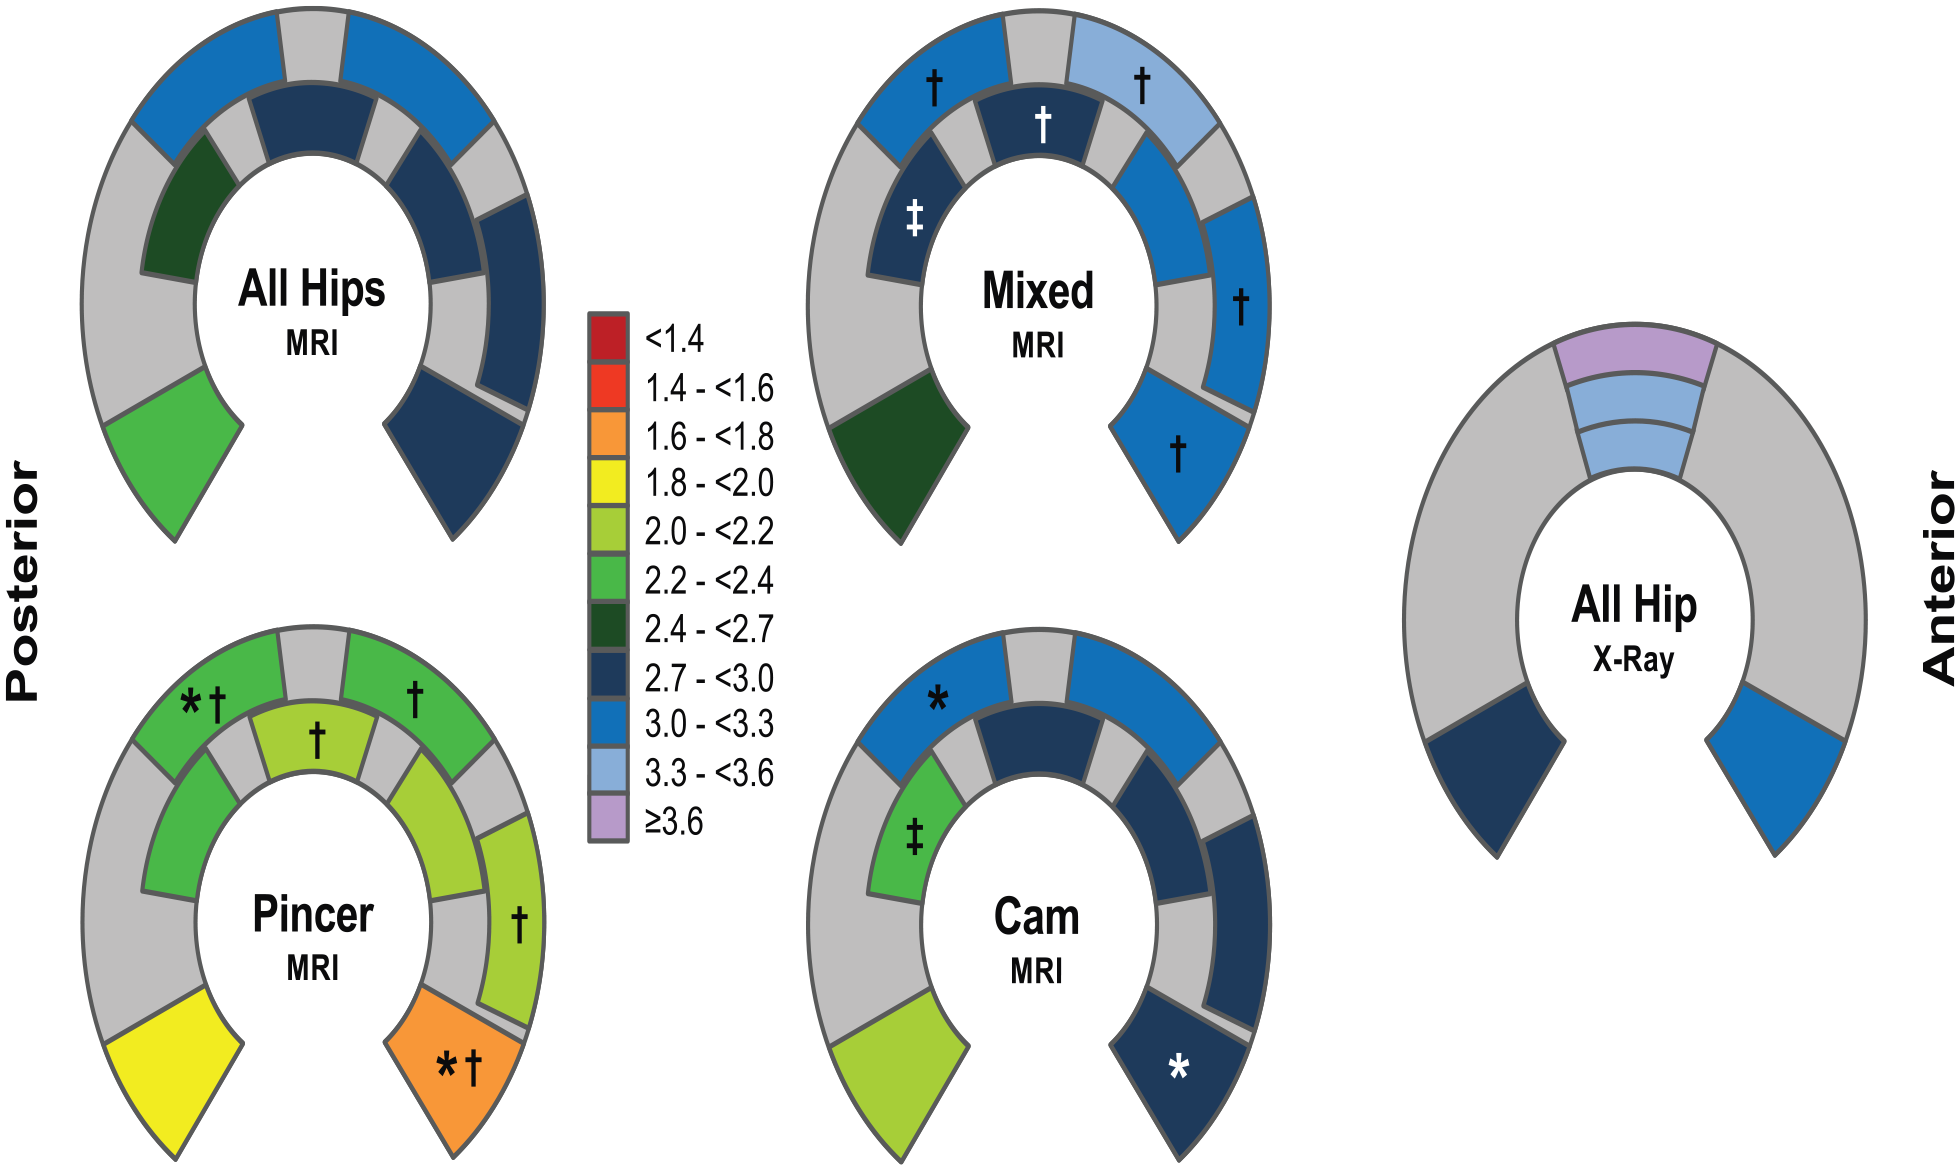
Joint space width (combined femoral and acetabular cartilage thickness) was evaluated using arthro-MRI (n = 38 hips) and anteroposterior and axial radiographs (n = 43). Joint space width differed among the 8 locations on the MRI (same locations as in vivo measurements) and the 5 locations on the radiographs (both P < 0.001; Supplementary Table 1). Comparable to the in vivo results, maximal joint space width was found at the 1 and 11 o’clock locations on the peripheral sector in the MRI and the superior and lateral sector in the radiograph (Supplementary Tables 2 and 3). The thinnest cartilage was found at the posterior horn in both imaging modalities.
Among the study groups with cam, pincer, and mixed types of FAI cartilage thickness differed for 5 out of the 8 locations for measurement ( Table 2 and Fig. 2 ). Hips with pincer type of FAI showed thinner cartilage compared to hips with cam or mixed type of FAI. The total joint space width in the arthro-MRI measurements of the same patients showed comparable results (Supplementary Table 1): again pincer hips had a thinner joint space width compared to hips with cam and/or mixed type of FAI in 5 out of 8 locations (11, 1, and 3 o’clock on peripheral aspect, 12 o’clock on central aspect and anterior horn; Fig. 3 ). No differences were found in the conventional imaging except in one location at the superior and medial aspect with a decreased joint space width in pincer hips compared to mixed type of FAI (P = 0.039; Supplementary Table 1). No previous results about cartilage thickness distribution depending on the type of impingement has been published. However, for hip dysplasia thicker acetabular cartilage has been reported compared to non-dysplastic hips.2,3,27 This would support the previously reported thesis 26 that functional adaption and mechanical stress results in increased cartilage thickness. In dysplastic hips with a decreased size of the lunate surface and a steeper orientation of it, the increased mechanical stress would result in increased cartilage thickness.
This study has several limitations. First, cartilage thickness was only measured on the acetabular side and not on the femoral side. The acetabular side was chosen since thinning of cartilage in hips with FAI and early joint degeneration typically occurs on the acetabular side. 28 Second, the patients’ series comprises a limited number of 50 hips. Subdivision in study groups with different types of FAI resulted in groups with 8 and 11 hips for pincer and cam impingement, respectively ( Table 1 ). This limits the statistical comparability and renders further subdivision, for example, according to gender, age, height or weight of the patient, or statistical adjustment for these factors, difficult. To the best of the authors’ knowledge, the current study is the only study with in vivo cartilage thickness evaluation in hips and the available measurements are the maximum measurements available to date. Third, the study groups differed in terms of gender (P = 0.006), weight (P = 0.015), and height (P = 0.009; Table 1 ). There was no difference for body mass index (P = 0.219; Table 1 ). The differences in gender are due to the fact that pincer FAI generally is more frequent in female 29 and cam impingement more frequent in males. 30 The thinner cartilage in hips with pincer impingement could potentially be due to the fact that more female patients were included ( Table 1 ). In contrast, the group with cam-type FAI and thicker cartilage included more male patients ( Table 1 ). However, it is unknown whether cartilage is generally thinner in female hips. In addition, in dysplastic hips, a typically female hip pathology, thicker cartilage has been reported compared to normal hips.2,3 Therefore, cartilage thickness may be associated with different hip pathologies rather than gender. Last, the ultrasonic measurements are associated with some degree of error. The ultrasonic device has been validated extensively and was proven to be accurate and reliable. 13 The angle of insonation (deviation of the perfect perpendicular insonation) results in overestimation of cartilage thickness. In the present study, repeated measurements were performed for each location and the minimal thickness measured was recorded. Tilting the device by 10° or 20° would result in overestimation of cartilage thickness by 1.5% and 6.4%, respectively. 13 However, these differences are less than the found differences among the locations for measurement or study groups with different types of impingement ( Table 3 ).
This study provides baseline information about topographical cartilage thickness in FAI measured in vivo. The thickest cartilage of the acetabulum is located in the weight-bearing area on the peripheral aspect of the lunate surface (11 and 1 o’clock locations on peripheral aspect; Fig. 2 ). In addition, differences in thickness depending on the type of FAI could be shown. In hips with pincer type of impingement, cartilage was thinner on 5 out of 8 locations on the lunate surface. This has some potential clinical impact since absolute values of cartilage thickness have been reported to be predictive for outcome following joint preserving surgery. 1 Thinner cartilage thickness or joint space width in hips with pincer impingement could be misinterpreted as joint degeneration and have an impact on indication for surgery.
Supplemental Material
sj-pdf-1-car-10.1177_1947603521990879 – Supplemental material for Acetabular Cartilage Thickness Differs Among Cam, Pincer, or Mixed-Type Femoroacetabular Impingement: A Descriptive Study Using In Vivo Ultrasonic Measurements During Surgical Hip Dislocation
Supplemental material, sj-pdf-1-car-10.1177_1947603521990879 for Acetabular Cartilage Thickness Differs Among Cam, Pincer, or Mixed-Type Femoroacetabular Impingement: A Descriptive Study Using In Vivo Ultrasonic Measurements During Surgical Hip Dislocation by Simon Damian Steppacher, Malin Kristin Meier, Christoph Emanuel Albers, Moritz Tannast and Klaus Arno Siebenrock in CARTILAGE
Footnotes
Authors’ Note
Work was performed at the Department of Orthopaedic Surgery and Traumatology, Inselspital, Bern University Hospital, University of Bern, Switzerland.
Acknowledgments and Funding
We thank Dr. Pascale Anderle, School Deputy Head and Program Coordinator at sitem Center for Translational Medicine and Biomedical Entrepreneurship for statistical consulting. SDS and KAS have received funding from the Deutsche Arthrose-Hilfe e.V. (Project Number: P186-A163-Siebenrock-EP2-step1-hüfte-op-II-66k-2008-10) and MT from the Swiss National Science Foundation (SNSF; Project Number: 144856).
Declaration of Conflicting Interests
The author(s) declared no potential conflicts of interest with respect to the research, authorship, and/or publication of this article.
Ethical Approval
This prospective comparative study was approved by the ethical committee of the local state medical council Bern (Approval No. KEK 130/06).
Informed Consent
All participants gave written informed consent.
References
Supplementary Material
Please find the following supplemental material available below.
For Open Access articles published under a Creative Commons License, all supplemental material carries the same license as the article it is associated with.
For non-Open Access articles published, all supplemental material carries a non-exclusive license, and permission requests for re-use of supplemental material or any part of supplemental material shall be sent directly to the copyright owner as specified in the copyright notice associated with the article.