
Abstract
Objective
To compare CA4+-enhanced micro–computed tomography (microCT) of bovine articular, meniscal, nasal, and auricular cartilage, each of which possesses a different extracellular matrix (ECM) composition and structure.
Design
The diffusion kinetics of CA4+ in different native cartilage types were assessed over 20 hours. The feasibility of CA4+-enhanced microCT to visualize and quantify glycosaminoglycans (GAGs) in these different tissues was tested using safranin-O staining and 1,9-dimethylmethylene blue assay.
Results
The diffusion kinetics of CA4+ in auricular cartilage are significantly slower compared with all other cartilage types. Total GAG content per volume correlates to microCT attenuation with an R2 value of 0.79 for all cartilage types. Three-dimensional contrast-enhanced microCT images of spatial GAG distribution reflect safranin-O staining and highlight the differences in ECM structure, with heterogeneous regions with higher GAG concentrations highlighted by the contrast agent.
Conclusions
CA4+-enhanced microCT enables assessment of 3-dimensiona distribution and GAG content in different types of cartilage and has promise as an ex vivo diagnostic technique to monitor matrix development in different tissues over time as well as tissue-engineered constructs.
Introduction
Cartilage tissue is known for its limited intrinsic repair capacities. The extracellular matrix (ECM) of cartilage is mainly composed of collagen, proteoglycans (PGs), water, and elastin in different ratios depending on the cartilage type.1-4 It, however, lacks blood, nerve, and lymphatic supplies, leading to slow remodeling and low self-healing capabilities.5,6 Tissue engineering is a therapeutic approach, which involves combining cells from different sources, biomaterial scaffolds, and/or bioreactive factors. 7 The ultimate goal of tissue engineering is to produce cartilaginous-like tissue of different origin, for example, articular cartilage or auricular cartilage, to replace native tissue. Chondrogenesis of these constructs is assessed by matrix production and development over time.
Contrast-enhanced micro–computed tomography (CECT) is an emerging nondestructive technique for 3-dimensional (3D) imaging and longitudinal assessment of glycosaminoglycan (GAG) production and distribution in cartilage tissue and tissue-engineered constructs.8,9 This method relies on the principle of ionic contrast agents to bind or repulse negatively charged GAGs. CECT with the cationic contrast agent CA4+ quantitatively assesses GAG content in tissue-engineered constructs of articular chondrocytes as well as ex vivo meniscus, articular cartilage, and intervertebral discs.8,10-12 CECT overcomes drawbacks of traditional techniques such as colorimetric assays and histology. These methods are destructive as they either require digestion or fixation of the tissue, and therefore do not allow for longitudinal assessment of the same specimens. Furthermore, neither method provides a 3D map of the spatial GAG distribution in the tissue—a advantage of CECT.
However, different cartilage types possess different ratios of ECM components, and this endows the tissues with their characteristic functional properties. Previous studies investigated articular and meniscal cartilage ex vivo and in vitro. CECT has not yet been used to evaluate nasal septal cartilage or auricular cartilage. Nasal septal cartilage is a subtype of hyaline cartilage, like articular cartilage, and exhibits a similar ECM. Auricular cartilage present in the outer parts of the ears is compositionally different. Being elastic cartilage, it contains more elastin than hyaline cartilage. 1 It is known that the molecular diffusion in tissues varies depending on the ECM composition and density, and this will likely influence the diffusion and distribution of CA4+.13-15 Furthermore, tissue density varies with different ECM composition and structure. 16 While the total GAG content of cartilage is routinely normalized to the weight of the sample, CECT as an imaging method analyzes attenuation per volume rather than weight. It is not known how different ECM compositions affect CECT or whether CECT is a feasible method for all different cartilage types or tissue-engineered constructs replicating these types.
Herein, we compare the diffusion kinetics of CA4+ in different native cartilage types and test the feasibility of CA4+-enhanced microCT to visualize and quantify GAGs in these different tissues. The CA4+- enhanced microCT diffusion kinetics and attenuation profiles depend on cartilage type, namely, articular, meniscal, nasal, and auricular cartilage, with auricular cartilage possessing the largest time constant. Similarly, the CECT attenuation with CA4+ significantly correlates with the GAG content and provides 3D spatial information on GAG presence and distribution within these cartilage tissues.
Materials and Methods
Sample Preparation
Cartilage plugs (ø5 mm, 1-2 mm high) were cored from tibial plateaus, medial zones of the menisci, nasal septum cartilage, and inner region of ears from 6 calves (aged 6 months) each from a local abattoir. Ethical permission was not required as the animals were slaughtered for food purposes. Samples were frozen at −80 °C until further use.
Contrast Agent Preparation
Solid CA4+ was dissolved in deionized water to reach a desired concentration of 12 mgI/ml. The pH of the solution was adjusted to 7.4 using 4 N NaOH, and the osmolarity was measured (Model 3320 Osmometer; Advanced Instruments) and adjusted to 400 ± 30 mOsm/l using NaCl and deionized water, respectively. CA4+ was then stored at 4 °C until further use.
Diffusion Profiles
To assess diffusion kinetics of CA4+ in different cartilage types, samples (n = 1 per type from each of 6 animals, total 6 samples per cartilage type) were immersed in 1 ml of 12 mgI/ml CA4+ each at room temperature. Samples were removed from contrast agent and scanned at 1, 3, 5, 15, and 20 hours. The time spent scanning was not included in incubation times. Before scanning, samples were blotted to remove excess contrast agent and placed in custom holder. All samples were scanned in air using microCT (μCT50; Scanco Medical, Brüttisellen, Switzerland). A small amount of phosphate-buffered saline (PBS) was added to the base of the scanning tube to prevent dehydration, and high humidity inside the tube was achieved using a custom humidifier creating water vapor, 17 prior to sealing the tubes with parafilm for scanning. Scanning was performed at 70 kVp and 57 µA, with a 0.5-mm Al filter, and 300 ms integration time to achieve a 4-μm isotropic voxel size. Scans took 27.9 minutes per sample.
Resulting image data were processed using the manufacturer’s software. Slices were contoured to only include cartilage samples. A Gaussian filter was applied (σ = 0.8, s = 1), attenuation histograms were generated, and the mean and SD of the attenuation coefficient (cm−1) were calculated for each sample. Each sample was plotted against the incubation time in CA4+. The data were fit to a nonlinear regression curve of the form A [1−exp (−t/τ)], where A = maximum attenuation coefficient, t = diffusion time, and τ = time required to reach 63.2% of the maximum attenuation. The time needed to reach diffusion equilibrium was calculated as 5 × τ. 18
Determination of GAG Content
To determine the correlation between microCT attenuation and total GAG content in cartilage, samples (n = 2-3 per type from each of 6 animals, total 15 samples per cartilage type) from each cartilage type were cut into half. One half was assessed for total GAG content with the 1,9-dimethylmethylene blue (DMMB) colorimetric assay. To determine the volume of the sample, the height of each sample was measured using a micrometer. Samples were then freeze-dried and weighed to obtain the dry weight. The dried samples were digested in 1 mg/ml papain from papaya latex (Sigma, 221465) dissolved in a 20 M sodium phosphate solution, containing 5 M EDTA and 2 M DTT (Sigma, D0632) at pH 6.8 at 60 °C overnight. After adding DMMB (pH 3.0), the absorbance was immediately read at 520 nm (Multiscan FC 357; Thermo Fisher Scientific). Shark chondroitin sulfate (Sigma, C4384) was used as standard, and GAG content was normalized to sample dry mass and volume, respectively.
Contrast-Enhanced MicroCT Imaging
The other half of each sample not used for DMMB assays was scanned using microCT to avoid interference of CA4+ with the DMMB assay. The samples were incubated in 1 ml of 12 mgI/ml CA4+ for 8 hours and scanned as described above. The resulting image data were processed using the manufacturer’s software and pre-processed as described above to determine the attenuation histogram (cm−1). A scan of a completely GAG-depleted sample was used to determine the background attenuation from passive diffusion of CA4+, and an upper threshold was defined at 1.49 cm−1. This threshold was then used to segment GAGs in the scans for all cartilage types. Voxels with an attenuation below the threshold were set to zero to aid visualization.
Enzymatic GAG Depletion
To deplete GAGs from tissue, samples were cut into half and incubated at 37 °C on a mechanical shaker at 850 rpm for 24 hours in a 1:1 mixture of phosphate buffer (300 mM sodium phosphate, pH 5.35) and hyaluronidase (4000 U/ml hyaluronidase, H3884, 20 mM sodium phosphate, 77 mM sodium chloride, 0.01% [w/v] bovine serum albumin, pH 7.0), yielding a 2000 U/ml hyaluronidase concentration with pH 5.35. After 24 hours of incubation, samples were rinsed for 24 hours at 4 °C in deionized water and equilibrated in PBS for 24 hours at 4 °C. One half of the sample was scanned as described above, and the other half was used to determine the GAG content as described above.
Histology
To assess GAG distribution with safranin-O histology, cartilage sections were fixed in neutral buffered formalin (AMBER Scientific, NBF-5L) for 24 hours, washed in PBS, and transferred into 70% ethanol. Samples were processed overnight using an automated tissue processor and embedded in paraffin and sectioned at 4 μm. The tissue sections were rehydrated and incubated in Wiegert’s iron hematoxylin working solution for 10 minutes and washed in running tap water for 10 minutes. Sections were stained with 0.05% Fast Green solution for 5 minutes, rinsed in 1% acetic acid solution for 10-15 seconds, and stained with 0.1% safranin-O solution for 5 min. Sections were dehydrated and mounted.
Statistical Analysis
To compare diffusion kinetics, differences between time constant τ in different cartilage types were assessed using one-way analysis of variance (ANOVA) and Tukey’s multiple comparison test. All results of GAG content and attenuation profiles were compared with the respective results of articular cartilage using one-way ANOVA and Dunnett’s multiple comparison tests. Different samples from the same animal were treated as technical replicates and were averaged. All differences between groups were considered significant at P < 0.05. To assess the correlation between mean attenuation and GAG content, simple linear regression was applied for all samples. R2 was determined to assess the strength of the correlations and significance was determined as 2-tailed P value (<0.05). Statistical analysis was performed with GraphPad Prism 9.0.0 (GraphPad Software, San Diego, CA).
Results
Diffusion Profiles and Kinetics of CA4+ in Different Cartilage Types
The diffusion profiles of CA4+ in different cartilage types were assessed over 20 hours of incubation in CA4+ (
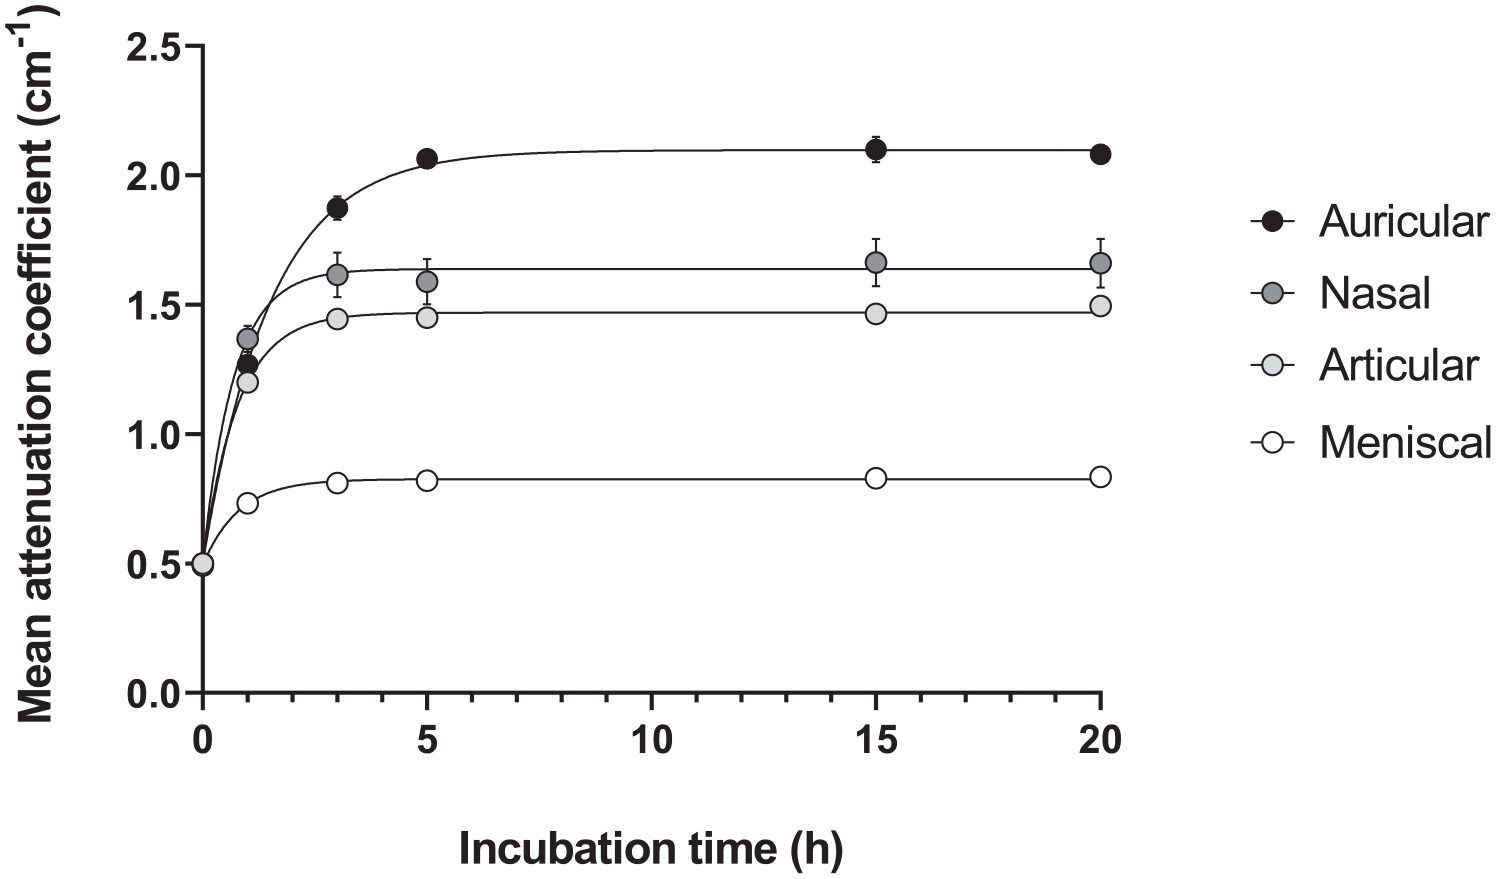
Diffusion profiles and kinetics of 12 mgI/ml CA4+ in different bovine cartilage types (n = 6 each) over 20 hours. The attenuation coefficient (cm−1) is plotted against incubation time (h). Data are represented as mean ± SEM.
Diffusion Kinetics of Different Cartilage Types.
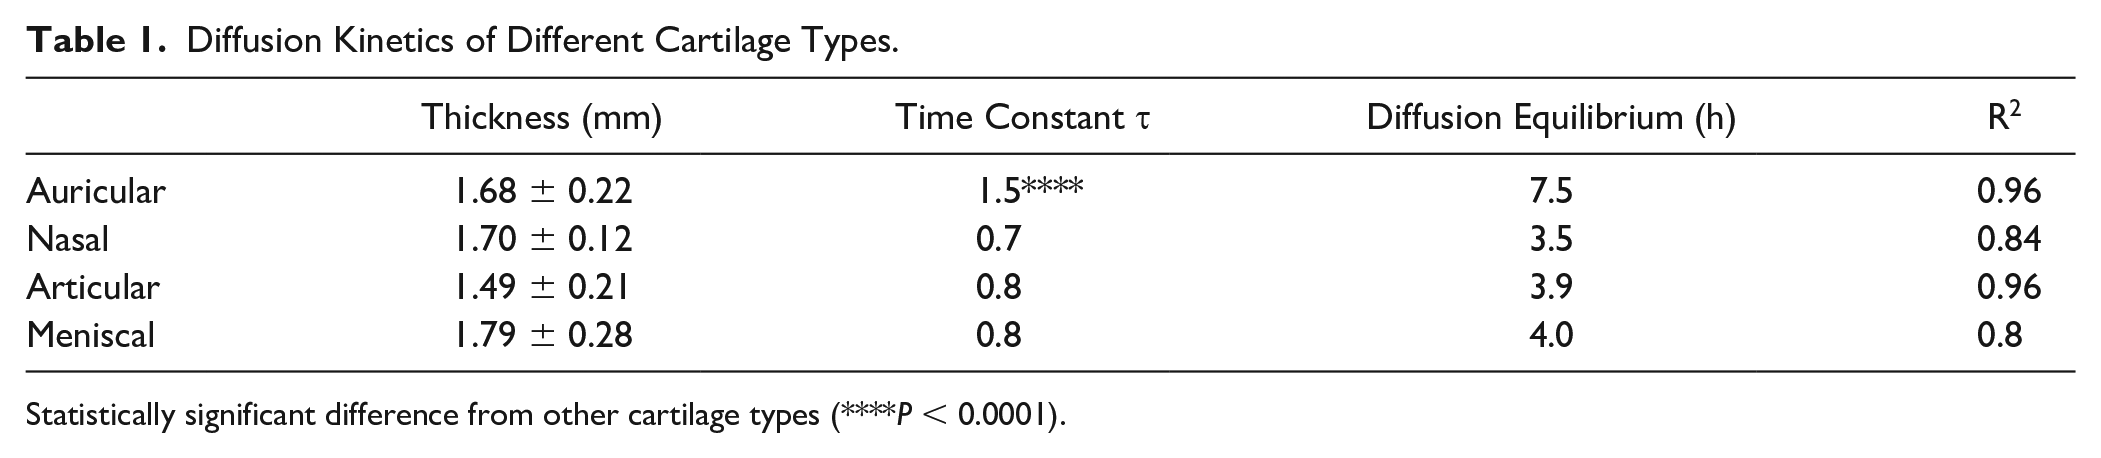
Statistically significant difference from other cartilage types (****P < 0.0001).
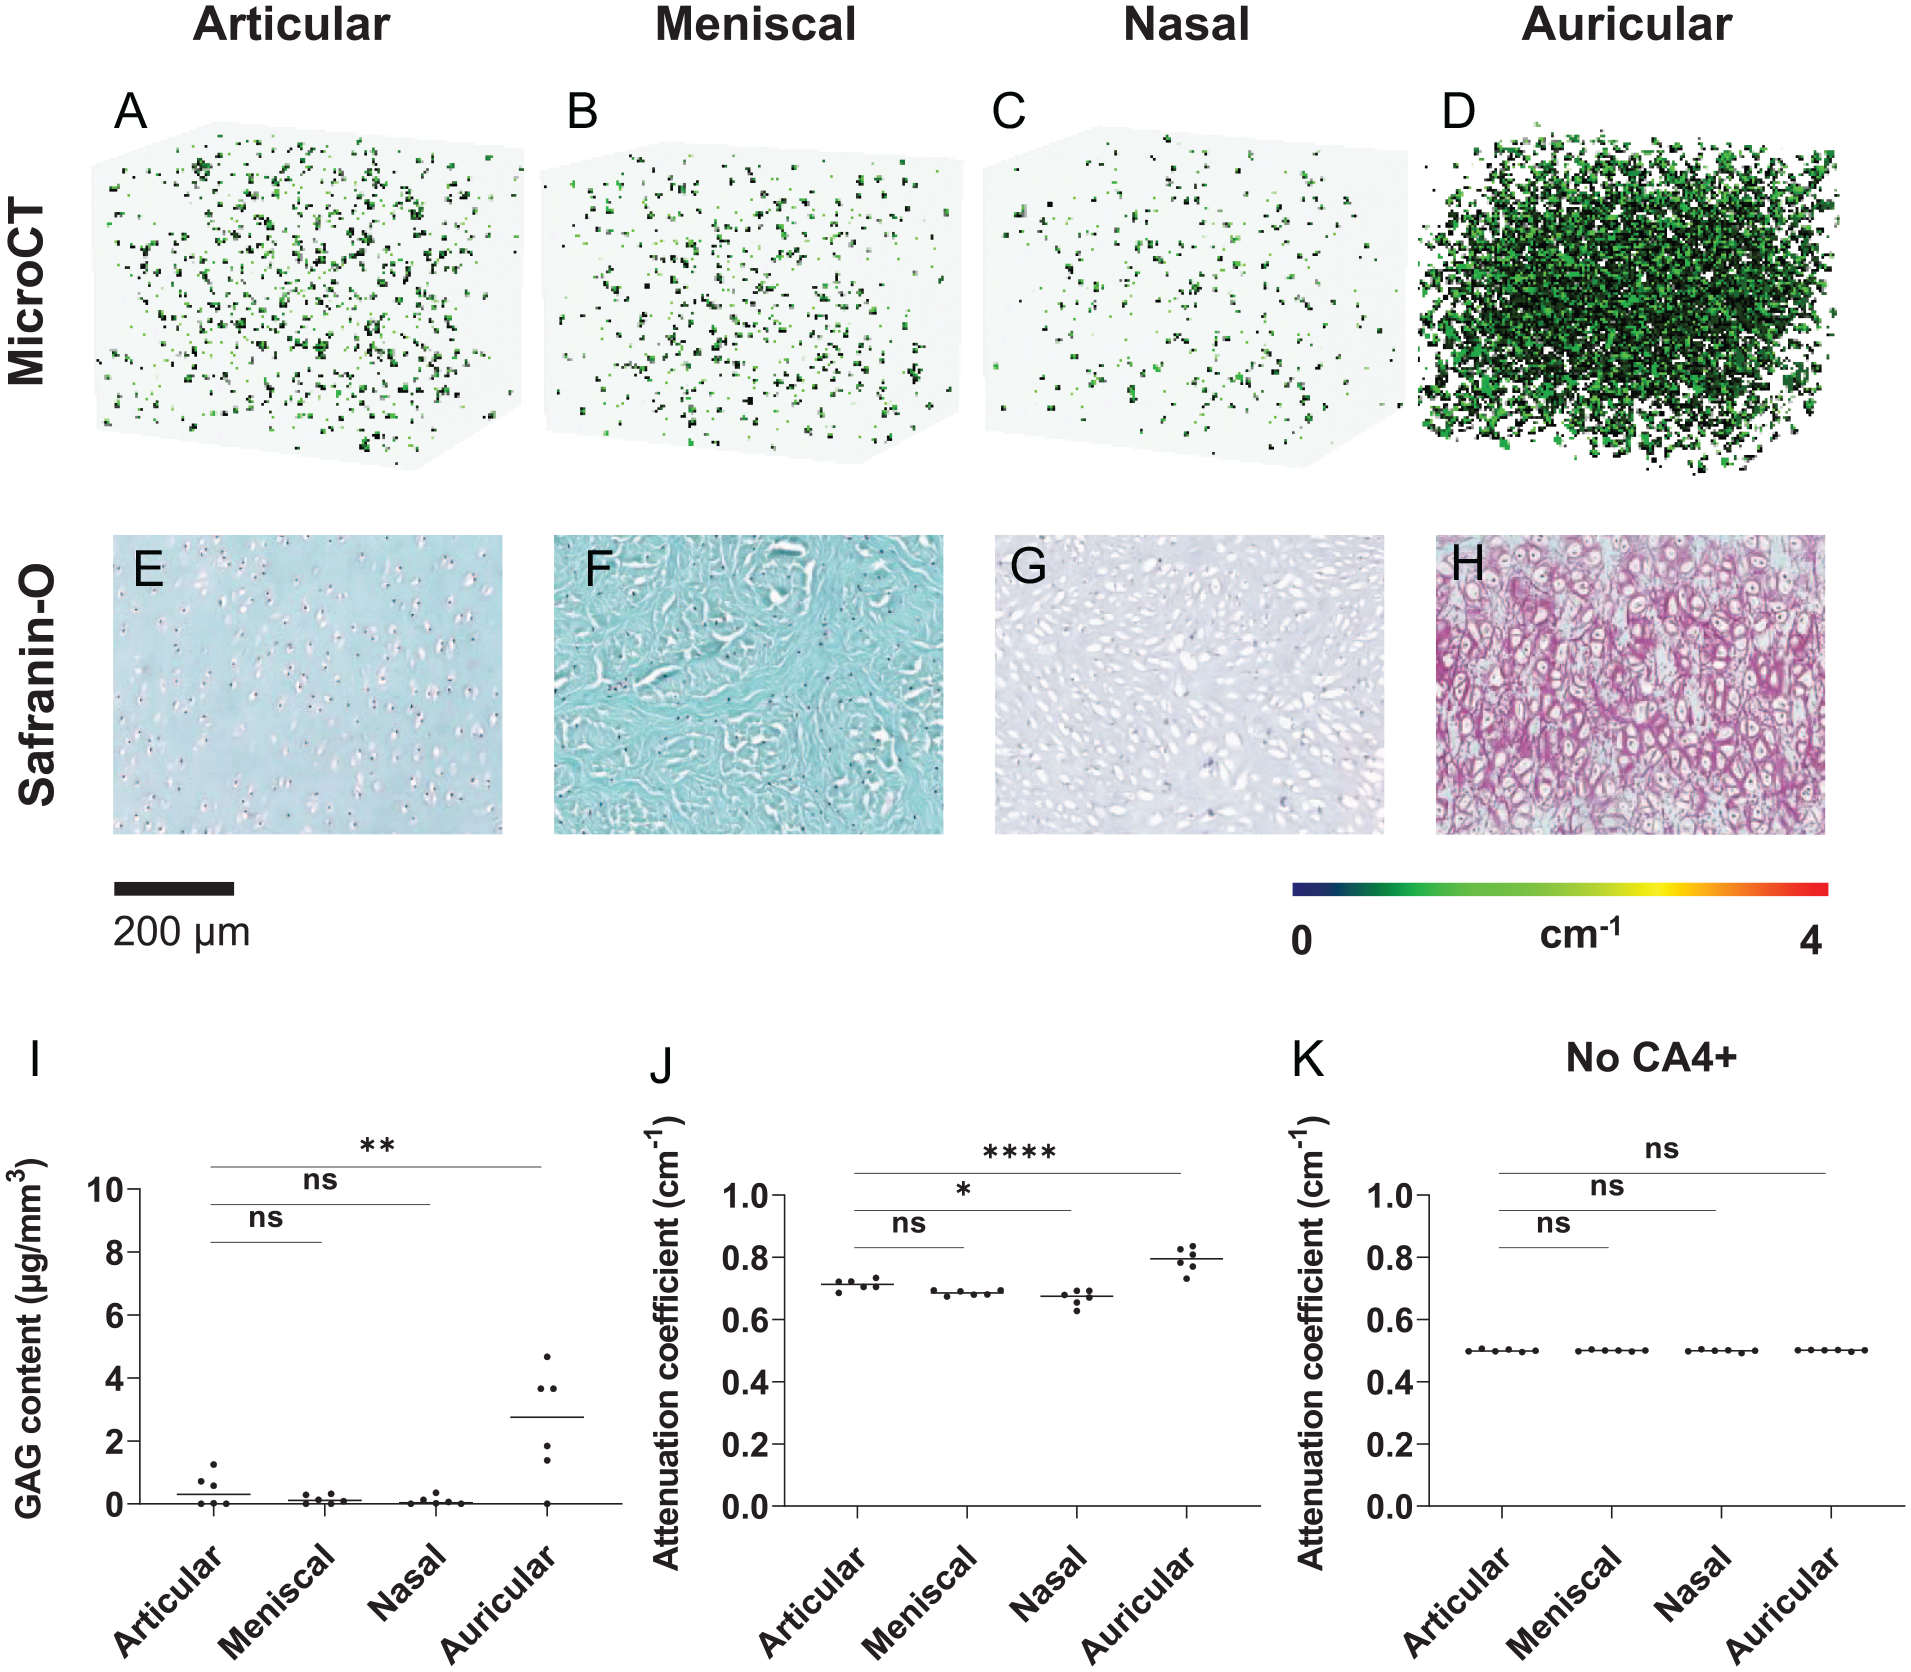
Spatial Distribution of GAGs and CA4+ in Different Cartilage Types
After immersing the samples in 12 mgI/ml CA4+ for 8 hours, color maps of all cartilage types corresponded with the mean attenuation coefficients and safranin-O staining (
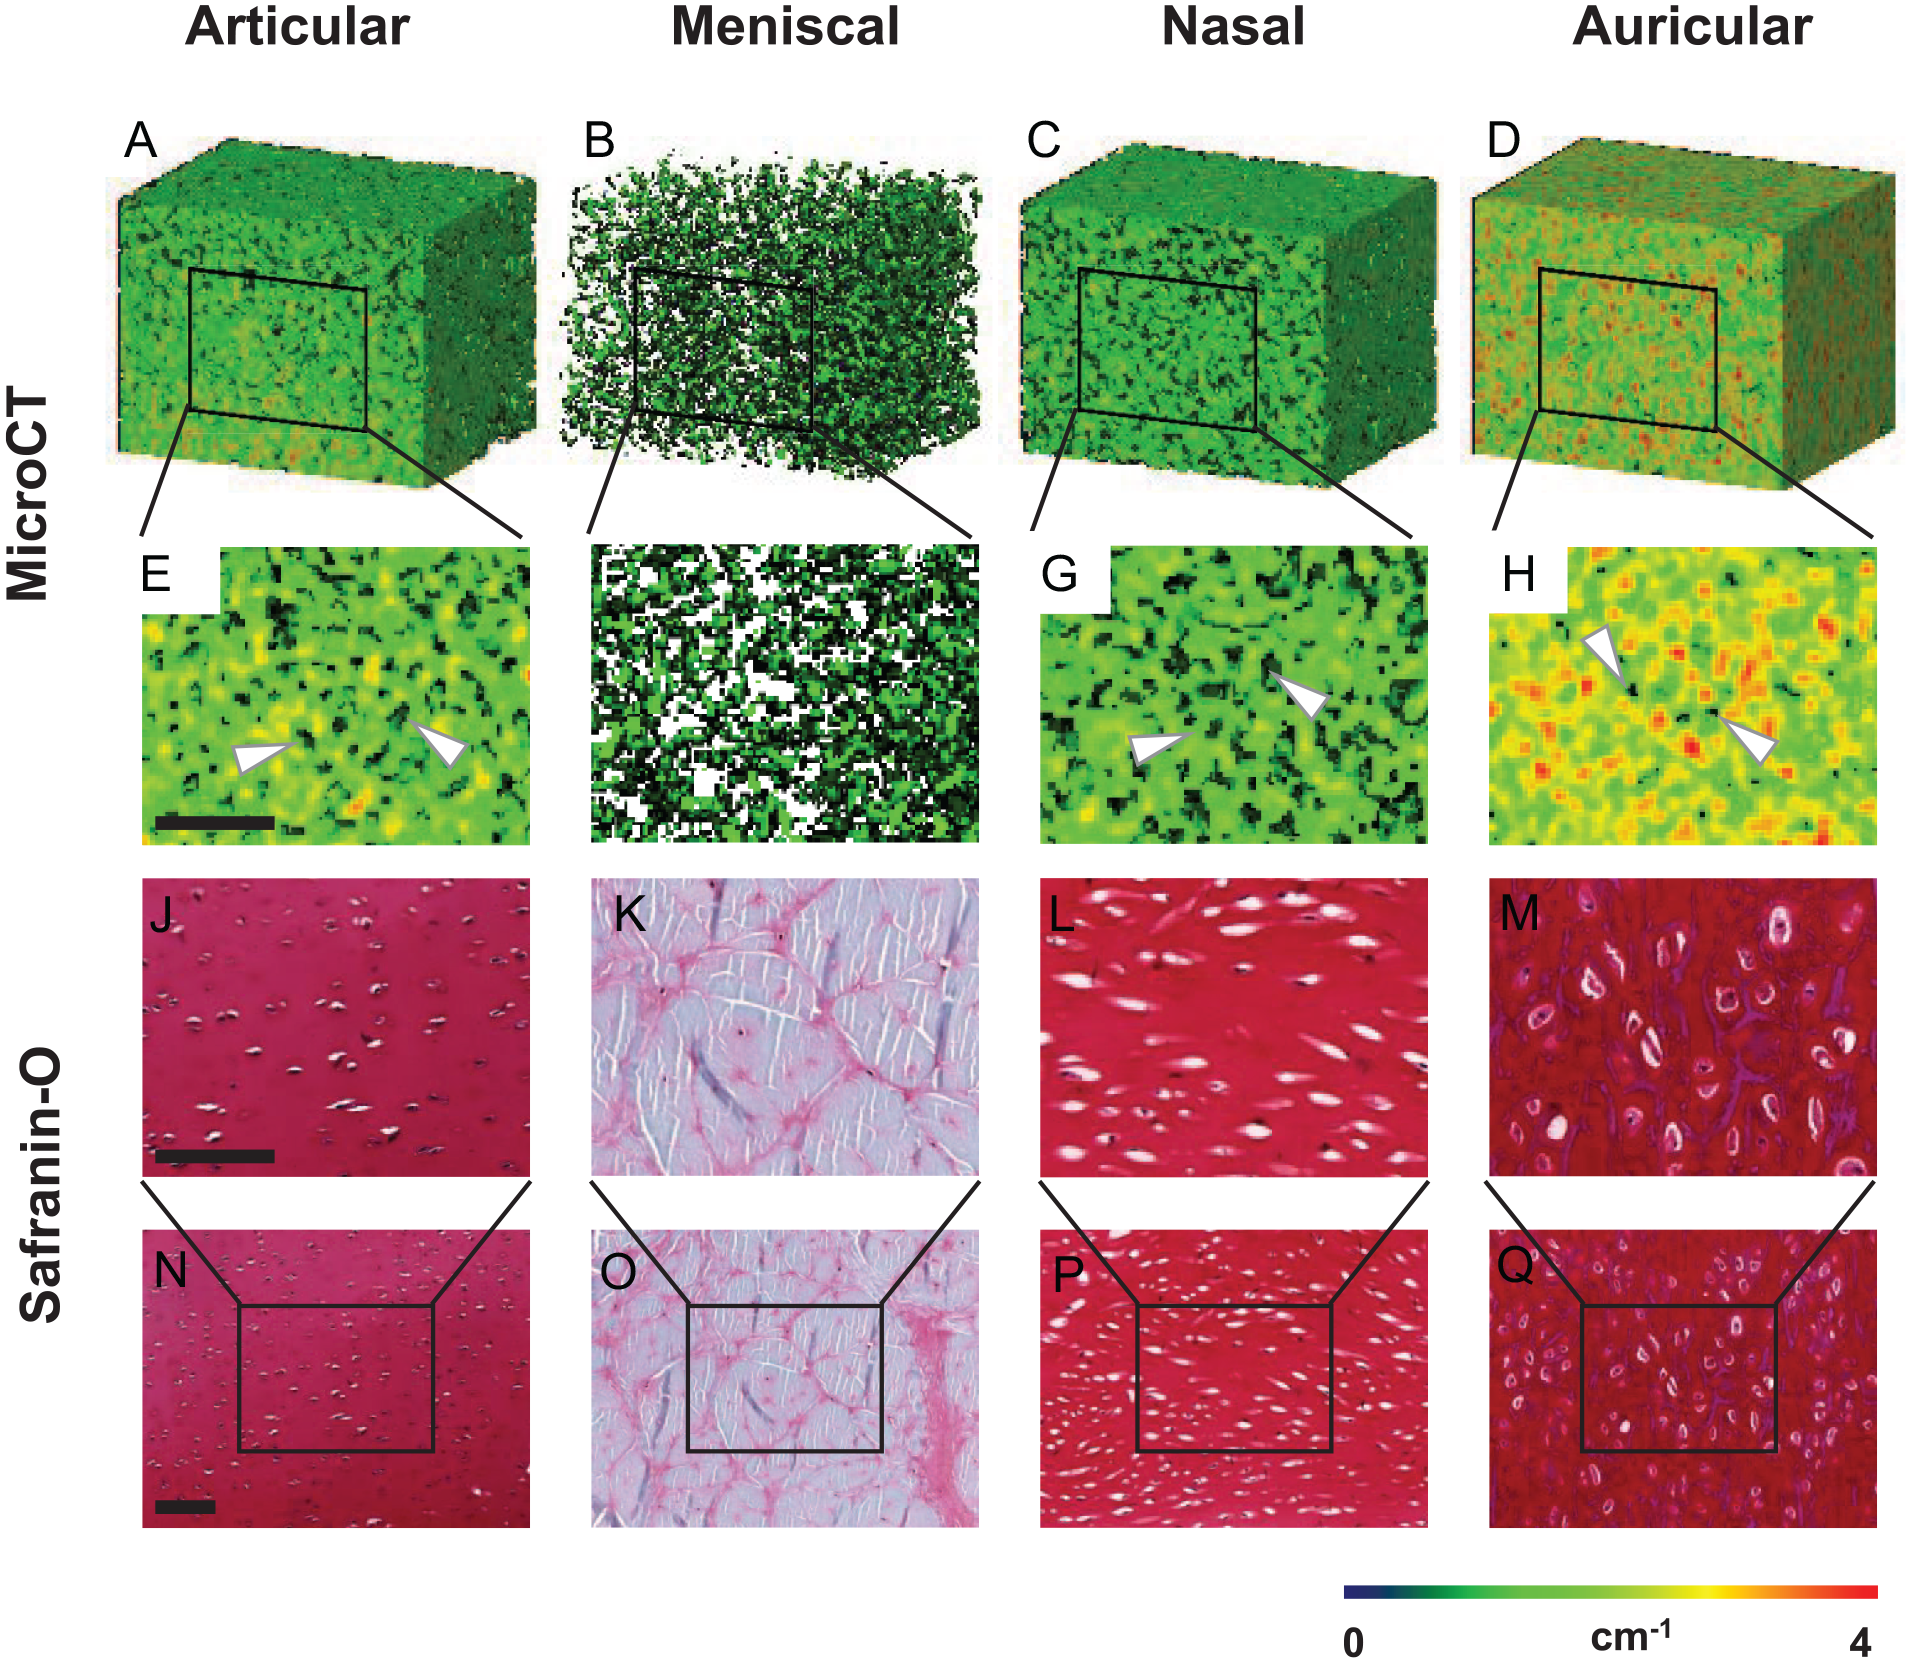
Spatial distribution of GAGs and CA4+ in different cartilage types. MicroCT images of (
Relationship between CECT Attenuation and GAG Content
The total GAG content and CA4+-enhanced microCT attenuation were determined for all cartilage types (
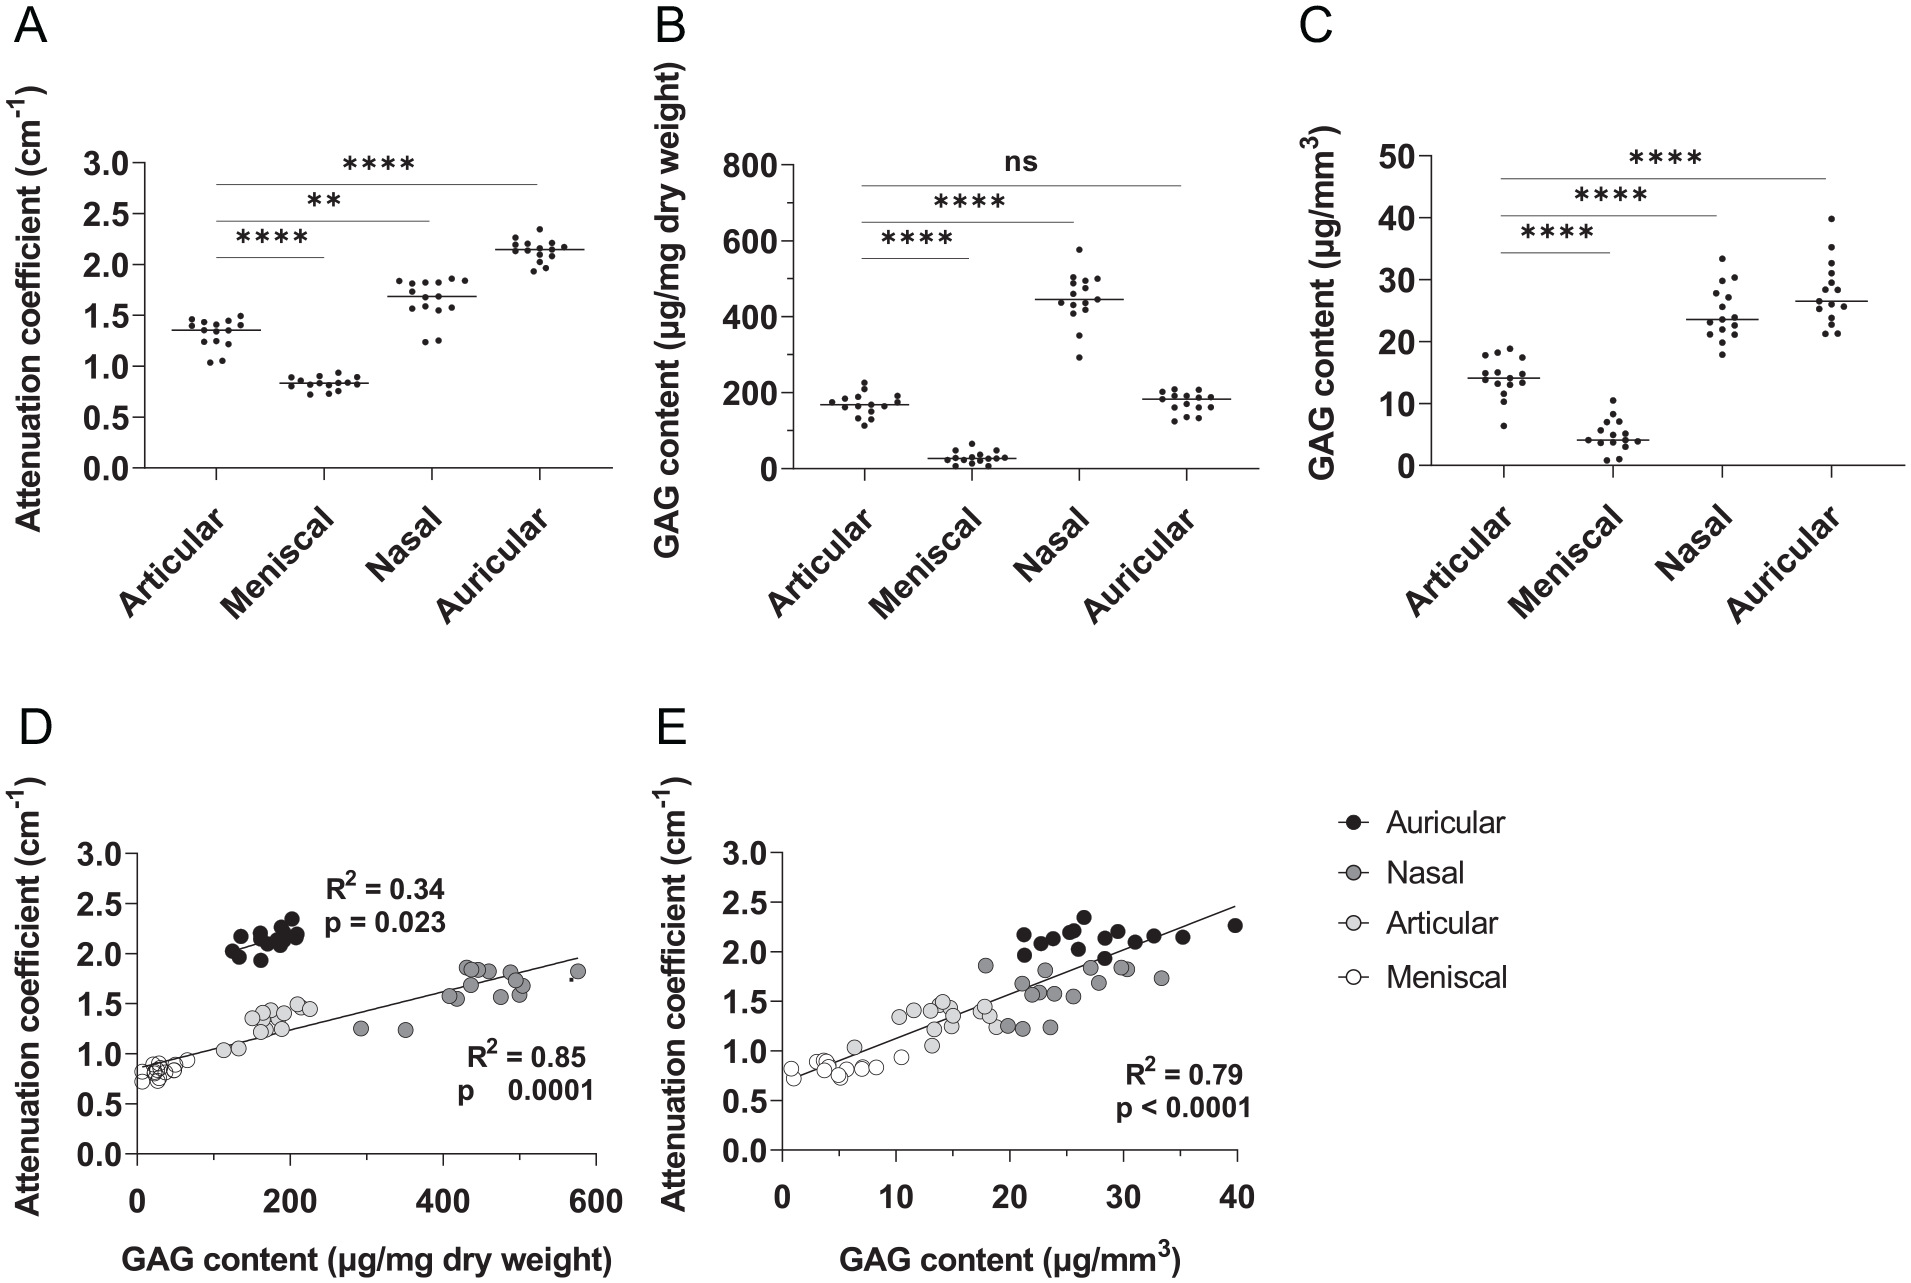
Total GAG content and attenuation of articular, meniscal, nasal, and auricular cartilage (n = 15 each). (
Attenuation profiles of GAG-depleted samples match the GAG content per volume measured by DMMB (
Total GAG content and distribution, and attenuation of GAG-depleted cartilage (n = 6 each). MicroCT images of (
Discussion
Diffusion Profiles and Kinetics of CA4+ in Different Cartilage Types
The results from the diffusion experiments show that the diffusion time of CA4+ differs between different cartilage types with different ECM constituents. The diffusion time of CA4+ in meniscal cartilage is reported to be 20 times longer than articular cartilage. 10 However, the samples used in those studies were slices of a whole meniscus and therefore much larger than the articular samples used herein. In this study, all samples of different cartilage types had a diameter of 5 mm. These results show that if tissue size is similar, the diffusion time of CA4+ into meniscal and articular cartilage is similar. The diffusion of CA4+ into auricular cartilage, however, is significantly slower and required almost twice as long to reach equilibrium. The diffusion kinetics of CA4+ into elastic cartilage are not previously reported. However, the presence of elastin in agarose gels greatly reduces the diffusion time of drugs. 13 Therefore, the differences in diffusion times of CA4+ are likely due to the high amount of elastin fibers present in auricular cartilage. Upon reaching equilibrium in auricular cartilage, the attenuation of CA4+ is consistent up to 20 hours as seen in other cartilage types. These different diffusion kinetics are likely to be observed in tissue-engineered constructs depositing elastin as well. Furthermore, diffusion times are known to increase over time in developing tissue-engineered cartilage. 26 Thus, the results indicate that incubation time needs to be considered for the sample size and tissue type or deposited matrix to obtain comparable and consistent results.
Spatial Distribution and Visualization of GAGs and CA4+ in Different Cartilage Types
CECT allows for 3D imaging of cartilage samples. These CECT images have previously been compared with standard safranin-O histology of articular and meniscal cartilage.10,18,27 Safranin-O staining relies on the same principle as CECT where cationic molecules bind to negatively charged GAGs to visualize them. 28 In this study, the CA4+-enhanced microCT images match safranin-O images of all different cartilage types, demonstrating that it is a reliable method for quantitating and visualizing GAGs in 3D in all cartilage tissues. The GAGs in these tissues show a heterogeneous spatial distribution. 19 Thus, obtaining 3D images of samples and tissue-engineered constructs can advance our knowledge of how these develop and deposit matrix over time.
MicroCT images of articular cartilage show a tissue-specific gradient of GAGs, with more GAGs in deeper zones, which matches the gradient in native tissue described in the literature. 19 Meniscal cartilage exhibits the lowest amount of GAGs of all cartilage types.10,24,25 In the histology images, areas with localized GAGs are interspersed with fibrous unstained regions. In the microCT images, these fiber-rich regions correspond to areas with no color/attenuation. Nasal cartilage is a subtype of hyaline cartilage, like articular cartilage; however, it possesses a more uniform GAG distribution, which is seen in the histology and microCT images. Similar to articular cartilage, the lacunae likely indicate the location of the chondrocytes. In auricular cartilage, most GAGs are located around the chondrocytes within the elastic fibers, creating a tight network.24,29 The areas with higher attenuation, indicated in orange and red in the microCT areas, support this observation. The areas where background voxels are removed likely show the location of chondrocytes as seen in articular and nasal cartilage.
Slight discrepancies in size between the microCT images and histology are likely due to different processing techniques involved in preparing the tissue. Samples for histology are fixed and processed, which can lead to tissue shrinkage. 28 CECT is nondestructive and does not require tissue processing, and as such is a suitable method to evaluate tissue development longitudinally. However, one should be cautious when comparing images as tissues have been prepared differently.
Histological analysis of cartilage tissue routinely uses counterstains to visualize structures that are not stained by safranin-O, such as fibers and other tissue structures as well as cell nuclei. CECT uses contrast agents to visualize GAGs. Other structures in cartilage, however, do not attract the contrast agent and therefore cannot be visualized using this method. While CECT clearly visualizes GAG distribution in 3D, if detailed structures of fibers and the morphology of cells need to be assessed, different stains or immunohistochemistry should be used.
Relationship between CA4+-Enhanced Attenuation and GAG Content/Quantification
CECT attenuation correlates to the amount of GAGs per dry weight, which is the standard in displaying GAG content.10,30 However, in this study, when comparing different tissue types, the attenuation did not correlate to the GAG content per dry weight for all types. The varying ECMs of the different cartilage types lead to a different tissue density, which in turn gives a different dry weight for samples of the same volume. Therefore, when GAG content was correlated to the volume of the tissue rather than weight, it correlates well with the attenuation for all cartilage types. When comparing different tissues or tissue-engineered constructs where different matrices are being explored, this difference may need to be considered. However, if only 1 tissue type is analyzed, correlation to GAGs per weight will suffice.
When tissues are depleted of GAGs, almost all contrast is lost in the microCT images, indicating sole contribution to attenuation. Attenuation values measured match the 3D images where nasal cartilage exhibits the lowest attenuation and auricular cartilage the highest. The significantly higher amount of CA4+ shown in auricular cartilage is therefore likely due to residual GAGs. It has previously been shown that GAGs in auricular cartilage cannot be fully degraded enzymatically due to their binding with the elastin network.24,29 These findings are supported by the safranin-O staining where no positive staining was detected in articular, meniscal, and nasal cartilage. Only auricular cartilage shows a slight red staining for safranin-O because of the GAGs still present in the tissue. 24 The measured GAG content by DMMB supports these findings. The amount of GAG remaining in auricular cartilage is significantly higher compared with articular cartilage.
Small discrepancies between histology and DMMB results for GAG content can be explained by the lack of sensitivity of safranin-O when staining GAG-depleted cartilage samples.28,31 DMMB assays, however, can detect GAGs to concentrations as low as 10 ng/ml. 32 Therefore, there are still some low GAG concentrations measured in all cartilage types while there is no visible safranin-O staining.
Samples scanned without contrast agent exhibit similar attenuation. This result shows that any increase in attenuation results from the addition of CA4+. In GAG-depleted tissue, this resembles passive diffusion of the contrast agent into the tissue. Hyaluronidase was used as the enzyme to degrade GAGs, as it can deplete almost all GAGs while keeping the collagen and elastin networks intact. 33 Therefore, it is unlikely that ECM molecules other than GAGs contribute to attenuation. This reinforces the use of CECT as a method to visualize and quantify GAGs in cartilage.
Conclusion
In conclusion, CA4+-enhanced microCT is a suitable method to assess 3D distribution and content of GAGs in all cartilage tissues. As such, it is a promising technique for longitudinal monitoring of matrix development in different tissues and tissue-engineered constructs replicating those tissues. Although diffusion kinetics vary depending on cartilage type, the attenuation does not change upon CA4+ reaching equilibrium. Therefore, if incubation times are adapted for the tissue under investigation, the obtained results can be compared between different cartilage types. However, if attenuation is being compared with DMMB results, care must be taken to normalize results for different tissue densities. Based on these results, the next steps include the comparison of cartilage types of human origin, identification of species-specific differences, and the investigation of tissue engineering constructs.
Footnotes
Authors’ Note
This work was carried out in Department of Biomedical Engineering, University of Melbourne, Parkville, Australia.
Acknowledgments and Funding
We thank Benjamin Lakin and Jonathan Freedman for the CA4+ and discussions. The author(s) disclosed receipt of the following financial support for the research, authorship, and/or publication of this article: This work was supported by the Victorian Government‘s Operational Infrastructure Support Program and The University of Melbourne.
Declaration of Conflicting Interests
The author(s) declared no potential conflicts of interest with respect to the research, authorship, and/or publication of this article.