
Abstract
Objective
The goal of the present study was to observe the effect of autophagy in tibial plateau chondrocytes on apoptosis in spontaneous knee osteoarthritis (OA) in guinea pigs.
Design
Fifty 2-month-old female Hartley guinea pigs were divided into a normal group (10 animals, all euthanized after 7 months) and an OA group (40 animals, 10 of which were euthanized after 10 months). Immunohistochemistry, RT-qPCR and Western blotting were used to evaluate autophagy levels, intracellular glycogen accumulation and apoptosis in tibial plateau chondrocytes in vivo and in vitro. The remaining 30 guinea pigs in the OA group were divided into 3 groups: a rapamycin group, a normal saline group, and a 3-methyladenine (3-MA) group. Intracellular glycogen accumulation and chondrocyte apoptosis were assessed by altering the level of autophagy in chondrocytes in vivo.
Results
When spontaneous OA occurred in guinea pigs, autophagy levels in tibial plateau chondrocytes decreased, while intracellular glycogen accumulation and the rate of chondrocyte apoptosis increased. After enhancing the level of autophagy in tibial plateau chondrocytes in guinea pigs with OA, intracellular glycogen accumulation and the rate of chondrocyte apoptosis decreased, while inhibiting autophagy had the opposite effects.
Conclusion
The results indicate that the function of autophagy in chondrocytes may at least partly involve the catabolism of glycogen. In guinea pigs with OA, the level of autophagy in tibial plateau chondrocytes decreased, and chondrocytes were unable to degrade intracellular glycogen into glucose, leading to less energy for chondrocytes and increased apoptosis.
Introduction
Knee osteoarthritis (OA) is a highly prevalent degenerative disease that severely reduces the physical and mental health of middle-aged and elderly individuals and has a substantial socioeconomic impact.1-5 The primary manifestation of this disease is the degeneration of cartilage in the knee joint.6-9 Cartilage primarily comprises chondrocytes and the cartilage matrix secreted by chondrocytes.3,10 Therefore, the physiological state of chondrocytes determines the degree of cartilage degeneration.
Autophagy is a self-regulatory process of cells that occurs in response to harmful external stimuli.11-15 Autophagy primarily produces autolysosomes that degrade intracellular metabolites or redundant organelles, allowing cells to adapt to changes in the external environment and maintain homeostasis. The process of autophagy is divided into 3 steps: initiation and elongation, phagocytosis, fusion, and degradation. 16 Initially, autophagic vacuoles are gradually isolated from the rough endoplasmic reticulum, after which they encapsulate intracytoplasmic substances and then merge with lysosomes to form autolysosomes. The hydrolytic enzymes harbored by lysosomes can degrade substances in autolysosomes. Previous studies showed that autophagy primarily promotes the degradation of metabolites and damaged organelles.17,18 However, autophagic vacuoles have also been shown to further degrade nutrients in the cytoplasm, including amino acids, fats, and glycogen granules.19-24 Chondrocytes exhibit a high level of autophagy because cartilage tissue is a nutrient-poor medium, 25 where key proteins involved in chondrocyte autophagy include beclin-1, autophagy-related protein-5 (ATG-5), ATG-7, and light chain-3 (LC-3).26-28 Studies have shown that when OA occurs, the level of autophagy in articular chondrocytes significantly decreases.29-31 Moreover, when the level of autophagy was reduced, the occurrence and development of knee OA were also more rapid.32-34 Targeted deletion of Atg-5 in chondrocytes promotes age-related OA. Notably, because chondrocytes exist in nutrient-poor medium, energy intake is essential for their survival. Glucose is the most direct energy source for chondrocytes, and a lack of glucose for an extended time will lead to apoptosis of chondrocytes. Most intracellular glucose is stored in chondrocytes in the form of glycogen, which is degraded into glucose for chondrocyte use. Interestingly, recent studies have shown that autophagy is involved in chondrocyte energy metabolism, and autolysosomes can degrade intracellular glycogen into glucose.35-37
The goal of our present study was to detect changes in the level of chondrocyte autophagy, intracellular glycogen accumulation and apoptosis in tibial plateau chondrocytes during spontaneous knee OA to further investigate the relationship between autophagy and glycogen metabolism.
Materials and Methods
Animal Handling
This study was approved by the Ethics Committee of Shanxi Provincial People’s Hospital (approval number: 2019018). Fifty 2-month-old female specific pathogen-free (SPF)-grade Dunkin Hartley (DH) albino guinea pigs (Animal Experiment Center of Shanxi Provincial People’s Hospital, China) were housed in pairs and allowed 2 weeks to acclimate to the housing facility. Environmental conditions included a temperature of 24 ± 1 °C, humidity 53% ± 15%, and a 12:12 light:dark cycle with lights on at 07:00 hours and off at 19:00 hours. The guinea pigs were provided access to a sterilized diet and water and were divided into 2 groups: a normal group (10 animals, which were euthanized after 7 months), and an OA group (40 animals, 10 of which were euthanized after 10 months). All the guinea pigs were sacrificed by using intraperitoneal anesthesia with 1% sodium pentobarbital at 300 mg/kg. Following euthanasia, the death of the guinea pig was confirmed by continuous nonbreathing for 2 to 3 minutes, no heartbeat, and no blink reflex. Previous studies have shown that changes in knee OA occur early in the life cycle of guinea pigs. Therefore, we did not perform any surgical intervention on any guinea pig to observe the degree of spontaneous knee joint degeneration at different ages, which could better simulate the pathogenesis of degenerative OA. In this part of the experiment, 6 knee joints of 3 guinea pigs in each group were made histological sections. The cartilage tissue of tibial plateau was scraped from 6 knee joints of 3 guinea pigs in each group for polymerase chain reaction (PCR) and Western blot analysis. Chondrocytes were scraped from 8 knee joints of 4 guinea pigs in each group and cultured in vitro. The same group of chondrocytes were mixed and cultured, and 10 chondrocyte fields were taken from each group for observation and scoring.
The remaining 30 guinea pigs were divided into 3 groups: a rapamycin group, a normal saline (NS) group, and a 3-methyladenine (3-MA) group, with solutions prepared according to the manufacturer’s instructions. All the guinea pigs were anesthetized by using intraperitoneal anesthesia with 1% sodium pentobarbital at 40 mg/kg, and the corresponding drugs were taken intra-articular injection. Guinea pigs in the rapamycin, NS, and 3-MA groups were executed with 6 mg/kg/d of rapamycin, an equal volume of NS or 5 mg/kg/d of 3-MA for 30 days, respectively. After 30 days of intra-articular injections, all guinea pigs were sacrificed, and bilateral knee joint specimens were collected. In this part of the experiment, 10 knee joints of 5 guinea pigs in each group were made histological sections. Chondrocytes were extracted from 10 knee joints of 5 guinea pigs in each group and cultured in vitro. The same group of chondrocytes were mixed and cultured, and 10 chondrocyte fields were taken from each group for observation and scoring. No animals died during the experiment. All experiments were performed in accordance with the Public Health Service Policy and the Guide for the Care and Use of Laboratory Animals.
Guinea Pig Tibial Plateau Chondrocytes
A sterile scalpel was used to cut the corresponding layers of cartilage, and chondrocytes were obtained after tissue clipping and collagenase type II digestion. Then, the isolated chondrocytes were cultured in Dulbecco’s modified Eagle’s medium (DMEM) supplemented with 10% fetal calf serum (FCS) at 37 °C under a humidified atmosphere of 95% air and 5% CO2. Chondrocytes were cultured to the third generation (P3) for experiments.
Evaluation of Knee Degeneration
Safranin O staining, India ink staining, and fluorescence molecular tomography (FMT) were used to evaluate knee joint degeneration by observing the degeneration degree of cartilage tissue in the medial platform (n = 10). Routine histological sections were generated, and the degree of degeneration in tibial plateau cartilage tissue of the knee joint was assessed after safranin O staining and compared between groups using the Osteoarthritis Research Society International (OARSI) scoring system. After the knee joints were opened and disarticulated, the gross morphological lesions were visualized by India ink staining, while FMT (ViSen, Waltham, MA, USA) was performed to assess the expression of matrix metalloproteinases (MMPs) in the articular cartilage tissue.
Immunohistochemistry
Immunohistochemistry (IHC) staining was performed to detect aggrecan (1:100, PAB908Ra02, Cloud-Clone Corp., Houston, TX, USA), MMP-13 (1:100, PAA099Ra01, Cloud-Clone Corp., USA), beclin-1 (2 μg/mL, ab62557, Abcam, Waltham, MA, USA), gycogenin-1 (1:100, sc-271109, Santa Cruz Biotechnology, Santa Cruz, CA, USA), caspase-3 (1:200, PAA626Ra01, Cloud-Clone Corp., USA), and proliferating cell nuclear antigen (PCNA) (1:10000, ab29, Abcam, USA) in cartilage tissue. We quantitatively scored the IHC results based on the percentage of positive chondrocytes and the staining intensity as previously described. 38 We rated the intensity of staining on a scale of 0 to 3 (0, negative; 1, weak; 2, moderate; and 3, strong) and assigned the following proportional scores: 0, if 0% of the chondrocytes showed positive staining; 1, if up to 1% of the chondrocytes were stained; 2, if 2% to 10% were stained; 3, if 11% to 30% were stained; 4, if 31% to 70% were stained; and 5, if 71% to 100% were stained. We then combined the proportion and intensity scores to obtain a total score (range: 0-8) as previously described. The results were assessed by 2 experienced pathologists in a blinded manner.
Quantitative Reverse Transcription Polymerase Chain Reaction
Total RNA was extracted from cartilage tissue and chondrocytes using TRIzol reagent (Thermo Fisher Scientific). The quality and quantity of total RNA samples were tested using a NanoDrop 2000C spectrophotometer (Thermo Fisher Scientific, Waltham, MA, USA), and only samples with an A260/A280 ratio of 1.8 to 2.0 were used for mRNA expression analysis. RNA (1 μg per sample) was reverse transcribed into cDNA using a PrimeScript RT Master Mix kit (Takara, Shiga, Japan) according to the manufacturer’s instructions. The relative mRNA expression levels of target genes to the control 18S rRNA gene were determined by quantitative reverse transcription polymerase chain reaction (RT-qPCR) using SYBR Premix Ex TaqTM (Takara) and specific primers with a IQ5 Multicolor real-time PCR detection system (Bio-Rad Laboratories, Hercules, CA, USA). Samples were amplified with an initial activation step at 95 °C for 10 minutes, followed by 40 cycles of denaturation at 95 °C for 10 seconds and annealing at 60 °C for 1 minute. The comparative gene expression was calculated using the 2−ΔΔCt approach. The sequences of the primers used for RT-qPCR were as follows: aggrecan, forward (5′-AGCCCTTGTCTGAATGGAGC-3′) and reverse (5′-GGTAGCAGTGGCCTTGGAAT-3′); MMP-13, forward (5′-CAGGAATTGGTGATAAAGTAGAT-3′) and reverse (5′-CTGTATTCAAACTGTATGGGTC-3′); Beclin-1, forward (5′-CAGCAATGGTCCAGGAGGAA-3′) and reverse (5′-GGAATGAACCTGCGGGAGAC-3′); glycogenin-1, forward (5′-GCGTGAAGAGTGAGTCCCAT-3′) and reverse (5′-GCCACAAGAGAAAGCCAGTGT-3′); and caspase-3, forward (5′-TTGCACTGAGGTACCTGAACTT-3′) and reverse (5′-CCTTCTTCATCCTCGATCTTG-3′).
Western Blotting
The cartilage tissue and chondrocyte samples were lysed in RIPA lysis buffer containing PMSF (phenylmethanesulfonyl fluoride), protease and phosphatase inhibitors (Keygen). Then, a portion of each protein sample was mixed with the loading buffer, boiled for 10 minutes and subjected to sodium dodecyl sulfate–polyacrylamide gel electrophoresis (SDS-PAGE) (12%) followed by transfer to PVDF membranes. After being blocked with 5% fat-free dry milk in TBST (Tris-buffered saline with 0.1% Tween 20 detergent), the blots were probed with primary antibodies. The expression level of the target protein relative to the control β-actin was determined by western blot analysis. The bound antibodies were detected with horseradish peroxidase (HRP)-conjugated secondary antibodies and visualized using enhanced chemiluminescence reagent. Subsequently, the data were analyzed by densitometric analysis using ImageJ.
Statistical Analysis
The data are expressed at the means ± SD and statistically analyzed by using SPSS software (version 20.0; IBM Corporation) and Graph Prism Software (version 8.0; Graph Prism Software, Inc.). The comparisons of 2 groups of samples were analyzed by two‑way analysis of variance followed by Tukey’s test. One-way analysis of variance was used for comparison among the 3 groups. A P value ≤0.05 was considered to indicate a statistically significant difference.
Results
Changes in Chondrocyte Autophagy and Glycogen Accumulation in OA Cartilage Tissue
To observe the degree of degeneration of knee tibial plateau articular cartilage tissue, we compared the OARSI scores of the 2 groups after safranin O staining. The results showed that the score of normal group was significantly lower than that of OA group (P = 0.000). The figures displayed that the surface of the normal cartilage tissue was intact, without damage, and with deep safranin O staining. In the OA group, the surface of the cartilage tissue was broken, the longitudinal fissure was as deep as the middle zone, the number of superficial chondrocytes was significantly reduced, and the safranin O staining was very shallow in the damaged area ( Fig. 1A ).
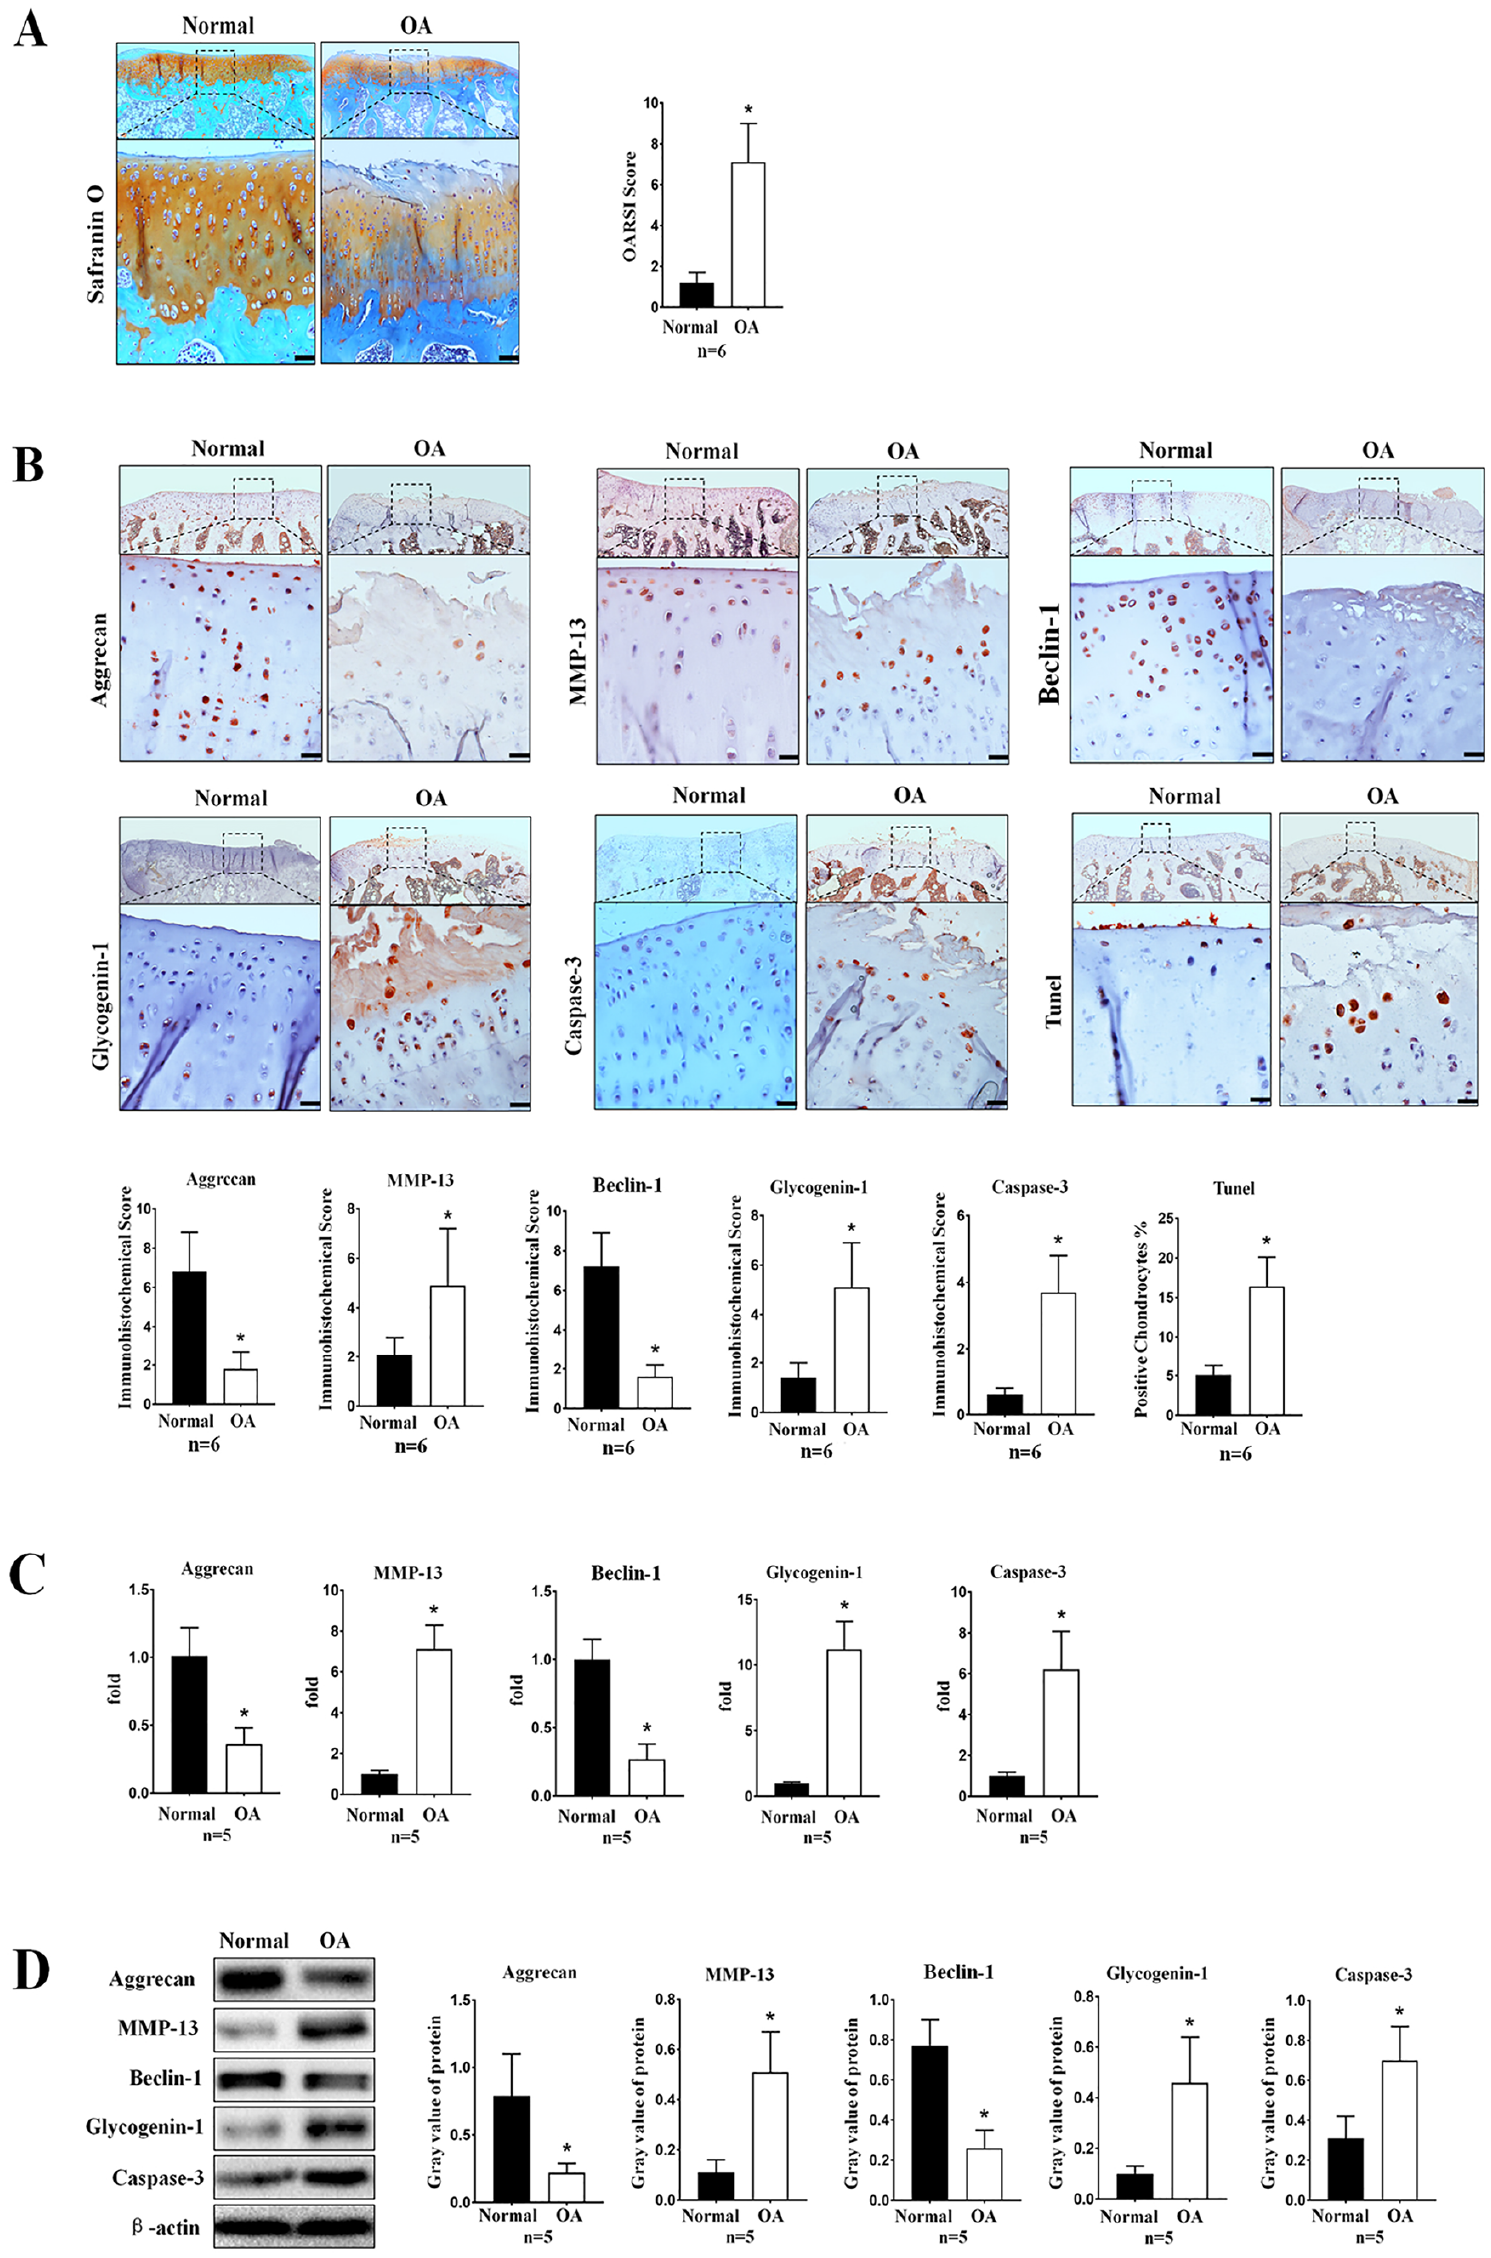
Comparison of autophagy levels and glycogen accumulation between normal and osteoarthritis (OA) chondrocytes in vivo. (
To further quantify the changes in chondrocyte autophagy and glycogen accumulation in OA cartilage tissue, IHC staining was performed to assess the levels of beclin-1 and glycogenin-1, biomarkers of chondrocyte autophagy and glycogen accumulation, respectively. We also examined the levels of a number of indicators associated with cartilage degeneration, such as aggrecan, MMP-13, and caspase-3. The results showed that the protein levels of beclin-1 (P = 0.000) and aggrecan (P = 0.000) decreased, while those of glycogenin-1 (P = 0.000), MMP-13 (P = 0.015), and caspase-3 (P = 0.007) increased in the cartilage tissue of the OA group compared with the normal group. TUNEL staining was performed to evaluate the articular cartilage tissue of the 2 groups, and the results showed that the rate of apoptosis of chondrocytes in the damaged area of the OA group was higher than that observed in the normal group (P = 0.001) ( Fig. 1B ).
After scraping the tibial plateau cartilage tissue of gerbils in the 2 groups, RT-qPCR was used to assess the levels of beclin-1, glycogenin-1, aggrecan, MMP-13, and caspase-3 mRNA, while Western blot analysis was used to evaluate the corresponding protein levels. The RT-qPCR results showed that the levels of beclin-1 (p = 0.017) and aggrecan (P = 0.030) mRNA decreased, while those of glycogenin-1 (P = 0.001), MMP-13 (P = 0.000), and caspase-3 (P = 0.000) mRNA increased in the OA group compared with the normal group. The Western blot results showed that the levels of beclin-1 (P = 0.036) and aggrecan (P = 0.002) decreased, while those of glycogenin-1 (P = 0.000), MMP-13 (P = 0.000), and caspase-3 (P = 0.028) increased in the OA group compared with the normal group ( Fig. 1C and D ).
Changes in Chondrocyte Autophagy and Glycogen Accumulation in OA Chondrocytes In Vitro
IHC staining was performed to assess the protein expression of beclin-1, glycogenin-1, aggrecan, MMP-13, and caspase-3 in chondrocytes. The results showed that the levels of the beclin-1 (P = 0.012) protein and the aggrecan (P = 0.021) protein decreased, while those of glycogenin-1 (P = 0.000), MMP-13 (P = 0.000), and caspase-3 (P = 0.001) proteins increased in the chondrocytes of the OA group compared with the normal group ( Fig. 2A ). TUNEL staining was performed to evaluate the articular cartilage tissue of the 2 groups, and the results showed that the rate of apoptosis of chondrocytes in the OA group was higher than that observed in the normal group (P = 0.003) ( Fig. 2B ).
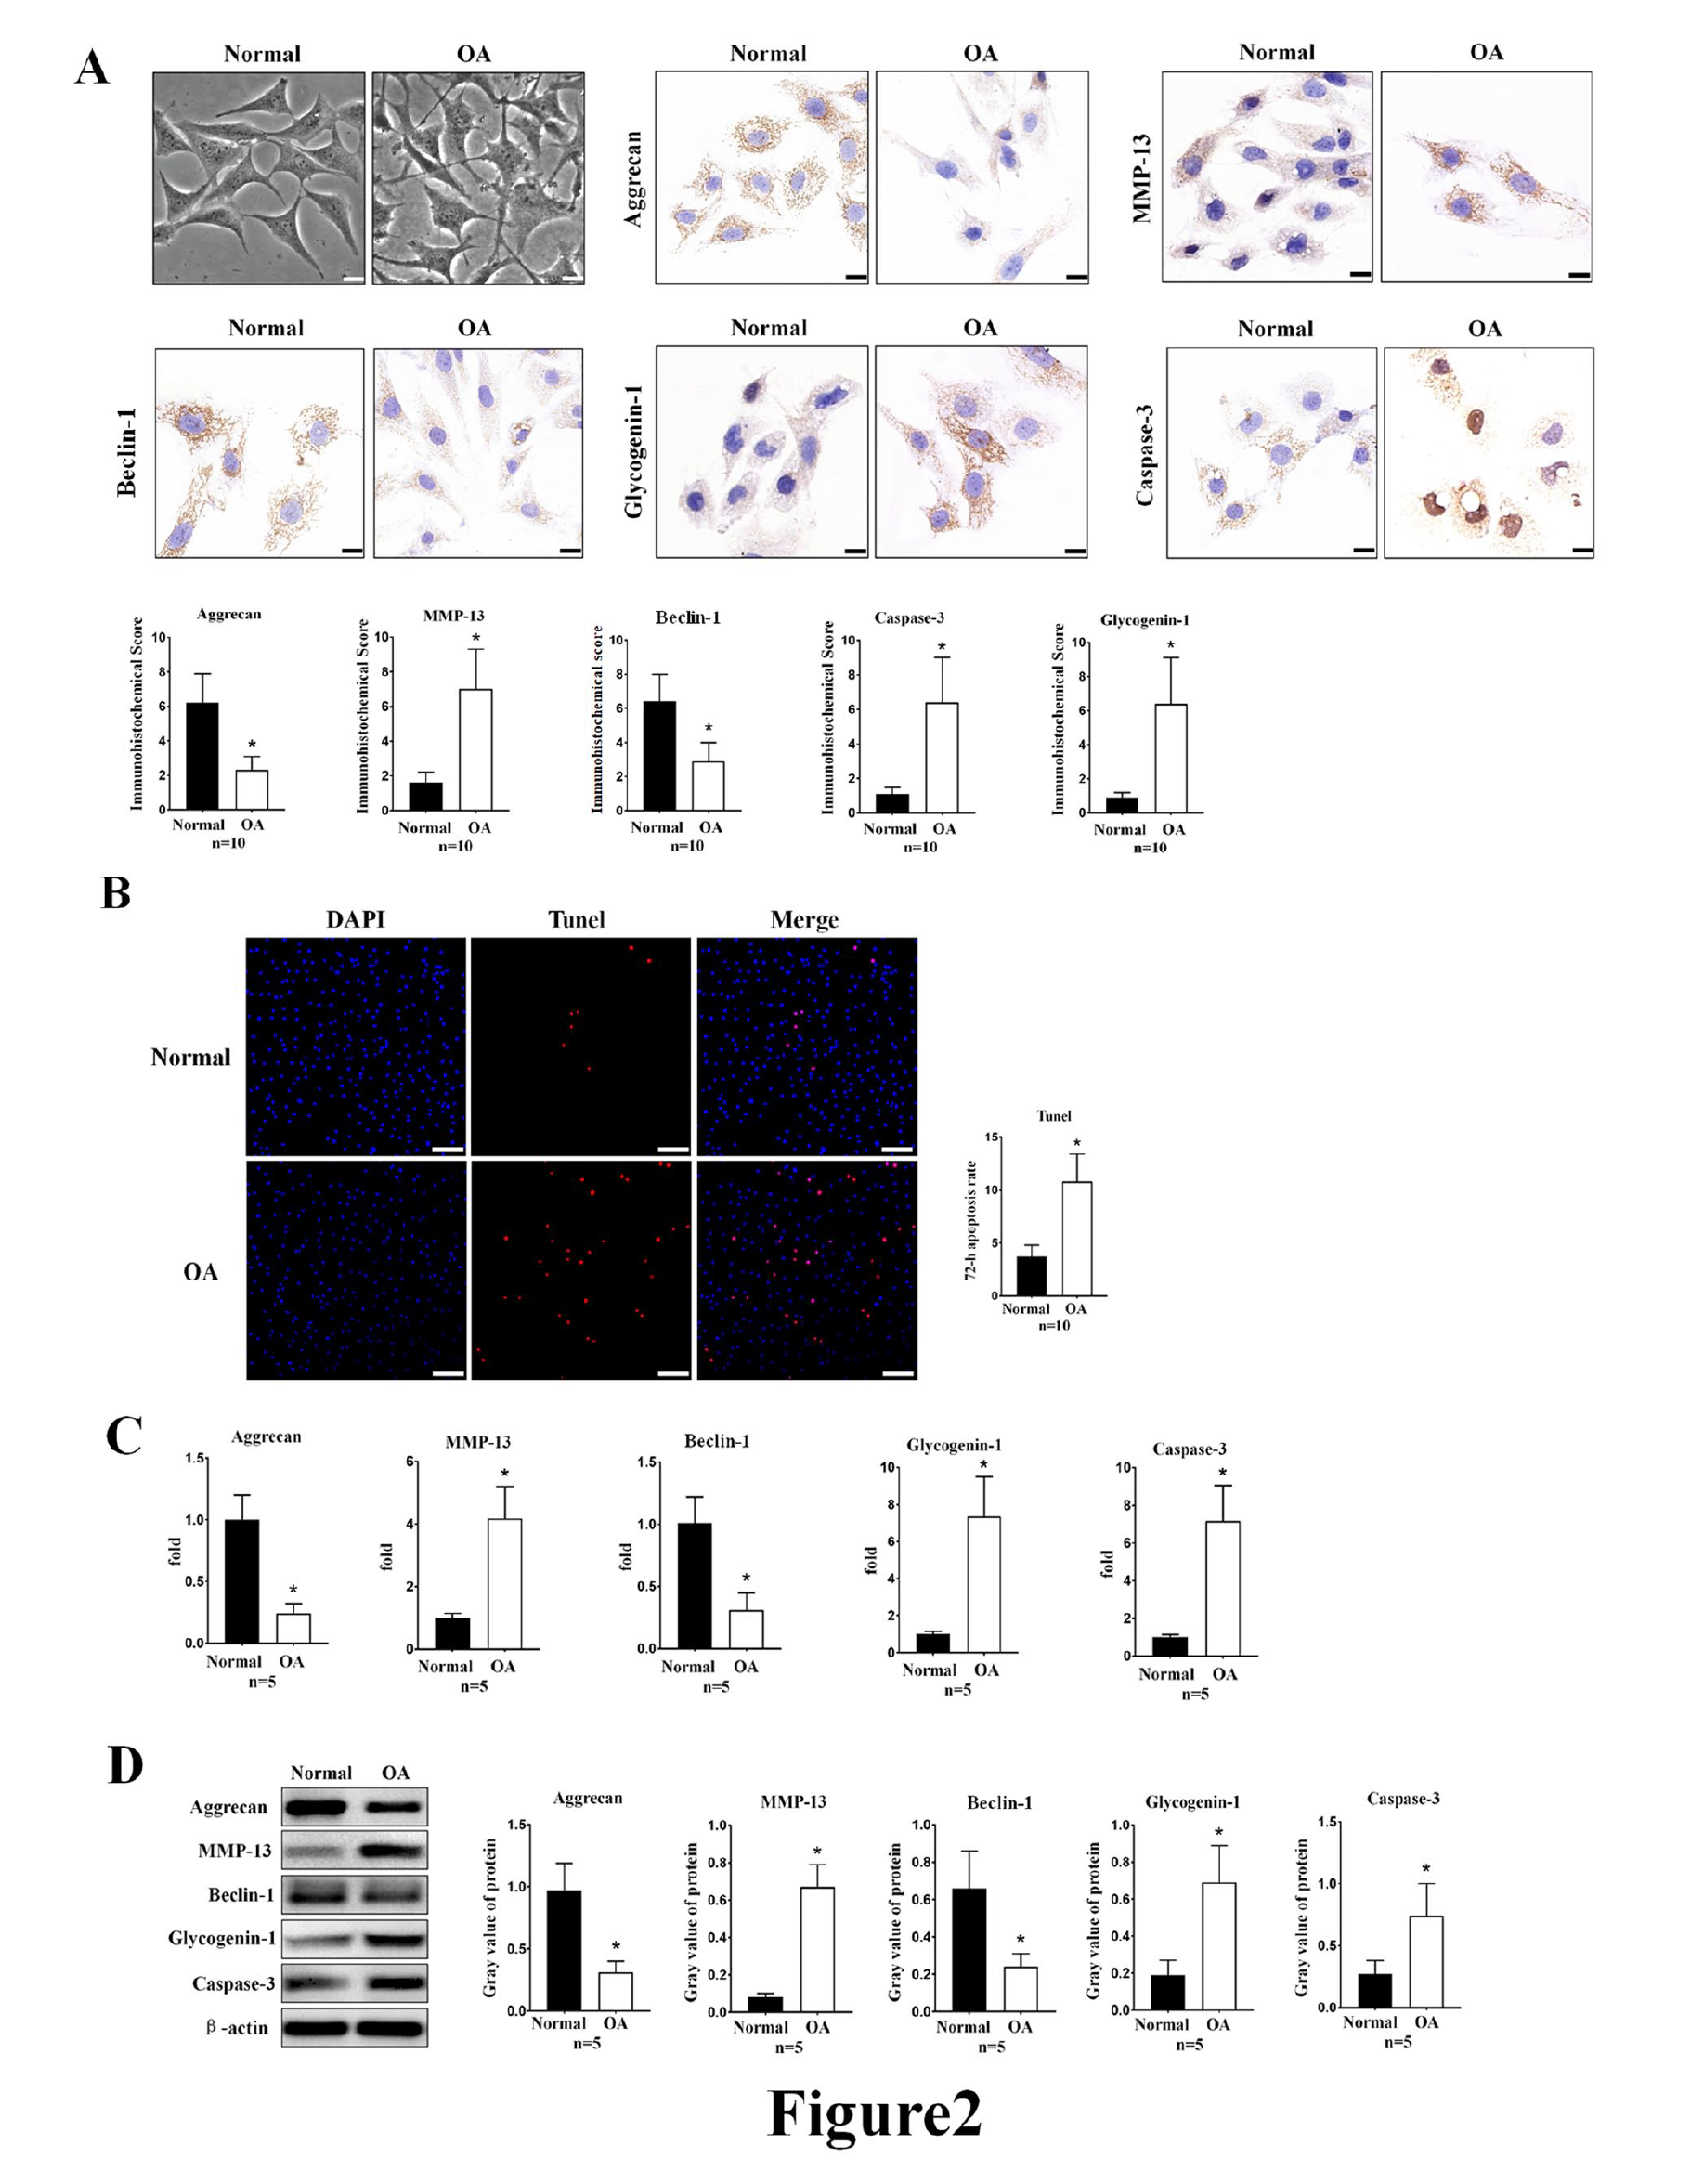
Comparison of autophagy levels and glycogen accumulation between normal and osteoarthritis (OA) chondrocytes in vitro. (
mRNA and proteins were extracted from lysed chondrocytes were used for RT-qPCR and Western blot analyses. The RT-qPCR results showed that the levels of beclin-1 (P = 0.022) and aggrecan (P = 0.001) mRNA decreased, while those of glycogenin-1 (P = 0.000), MMP-13 (P = 0.016), and caspase-3 (P = 0.000) increased in the OA group compared with the normal group. The Western blot results showed that the protein levels of beclin-1 (P = 0.009) and aggrecan (P = 0.017) decreased, while those of glycogenin-1 (P = 0.000), MMP-13 (P = 0.007), and caspase-3 (P = 0.000) increased in the OA group compared with the normal group ( Fig. 2C and D ).
Effects of Autophagy Levels on Glycogen Accumulation in the Presence of OA In Vivo and In Vitro
To observe the effect of chondrocyte autophagy levels on glycogen accumulation, we administered OA guinea pigs continuous intra-articular injections of the autophagy activator rapamycin and the autophagy inhibitor 3-MA. The results showed that after 30 days of continuous intra-articular injection, the OARSI score of the rapamycin group was the lowest, of the NS group was moderate, and of the 3-MA group was the highest (P = 0.000). And the results showed that, in the rapamycin group, the level of autophagy in tibial plateau chondrocytes in guinea pigs was significantly increased, as indicated by the observed protein level of the autophagy biomarker beclin-1. A slight accumulation of glycogen was noted in chondrocytes of the rapamycin group, as indicated by the observed protein level of the glycogen accumulation biomarker glycogenin-1. However, after 30 days of 3-MA intra-articular injection, the level of autophagy in tibial plateau chondrocytes in guinea pigs significantly decreased ( Fig. 3B ). In addition, the results showed that the rapamycin treatment attenuated the degeneration of tibial plateau cartilage tissue, as indicated by the safranin O staining, India ink staining, and FMT results ( Fig. 3A ), while the 3-MA treatment promoted the degeneration of cartilage tissue. These results were consistent with the findings of previous studies. Furthermore, IHC staining was performed to assess the expression levels of related proteins in guinea pig knee chondrocytes in vitro, and the same results were obtained (all Ps = 0.000) ( Figs. 4 and 5 ).
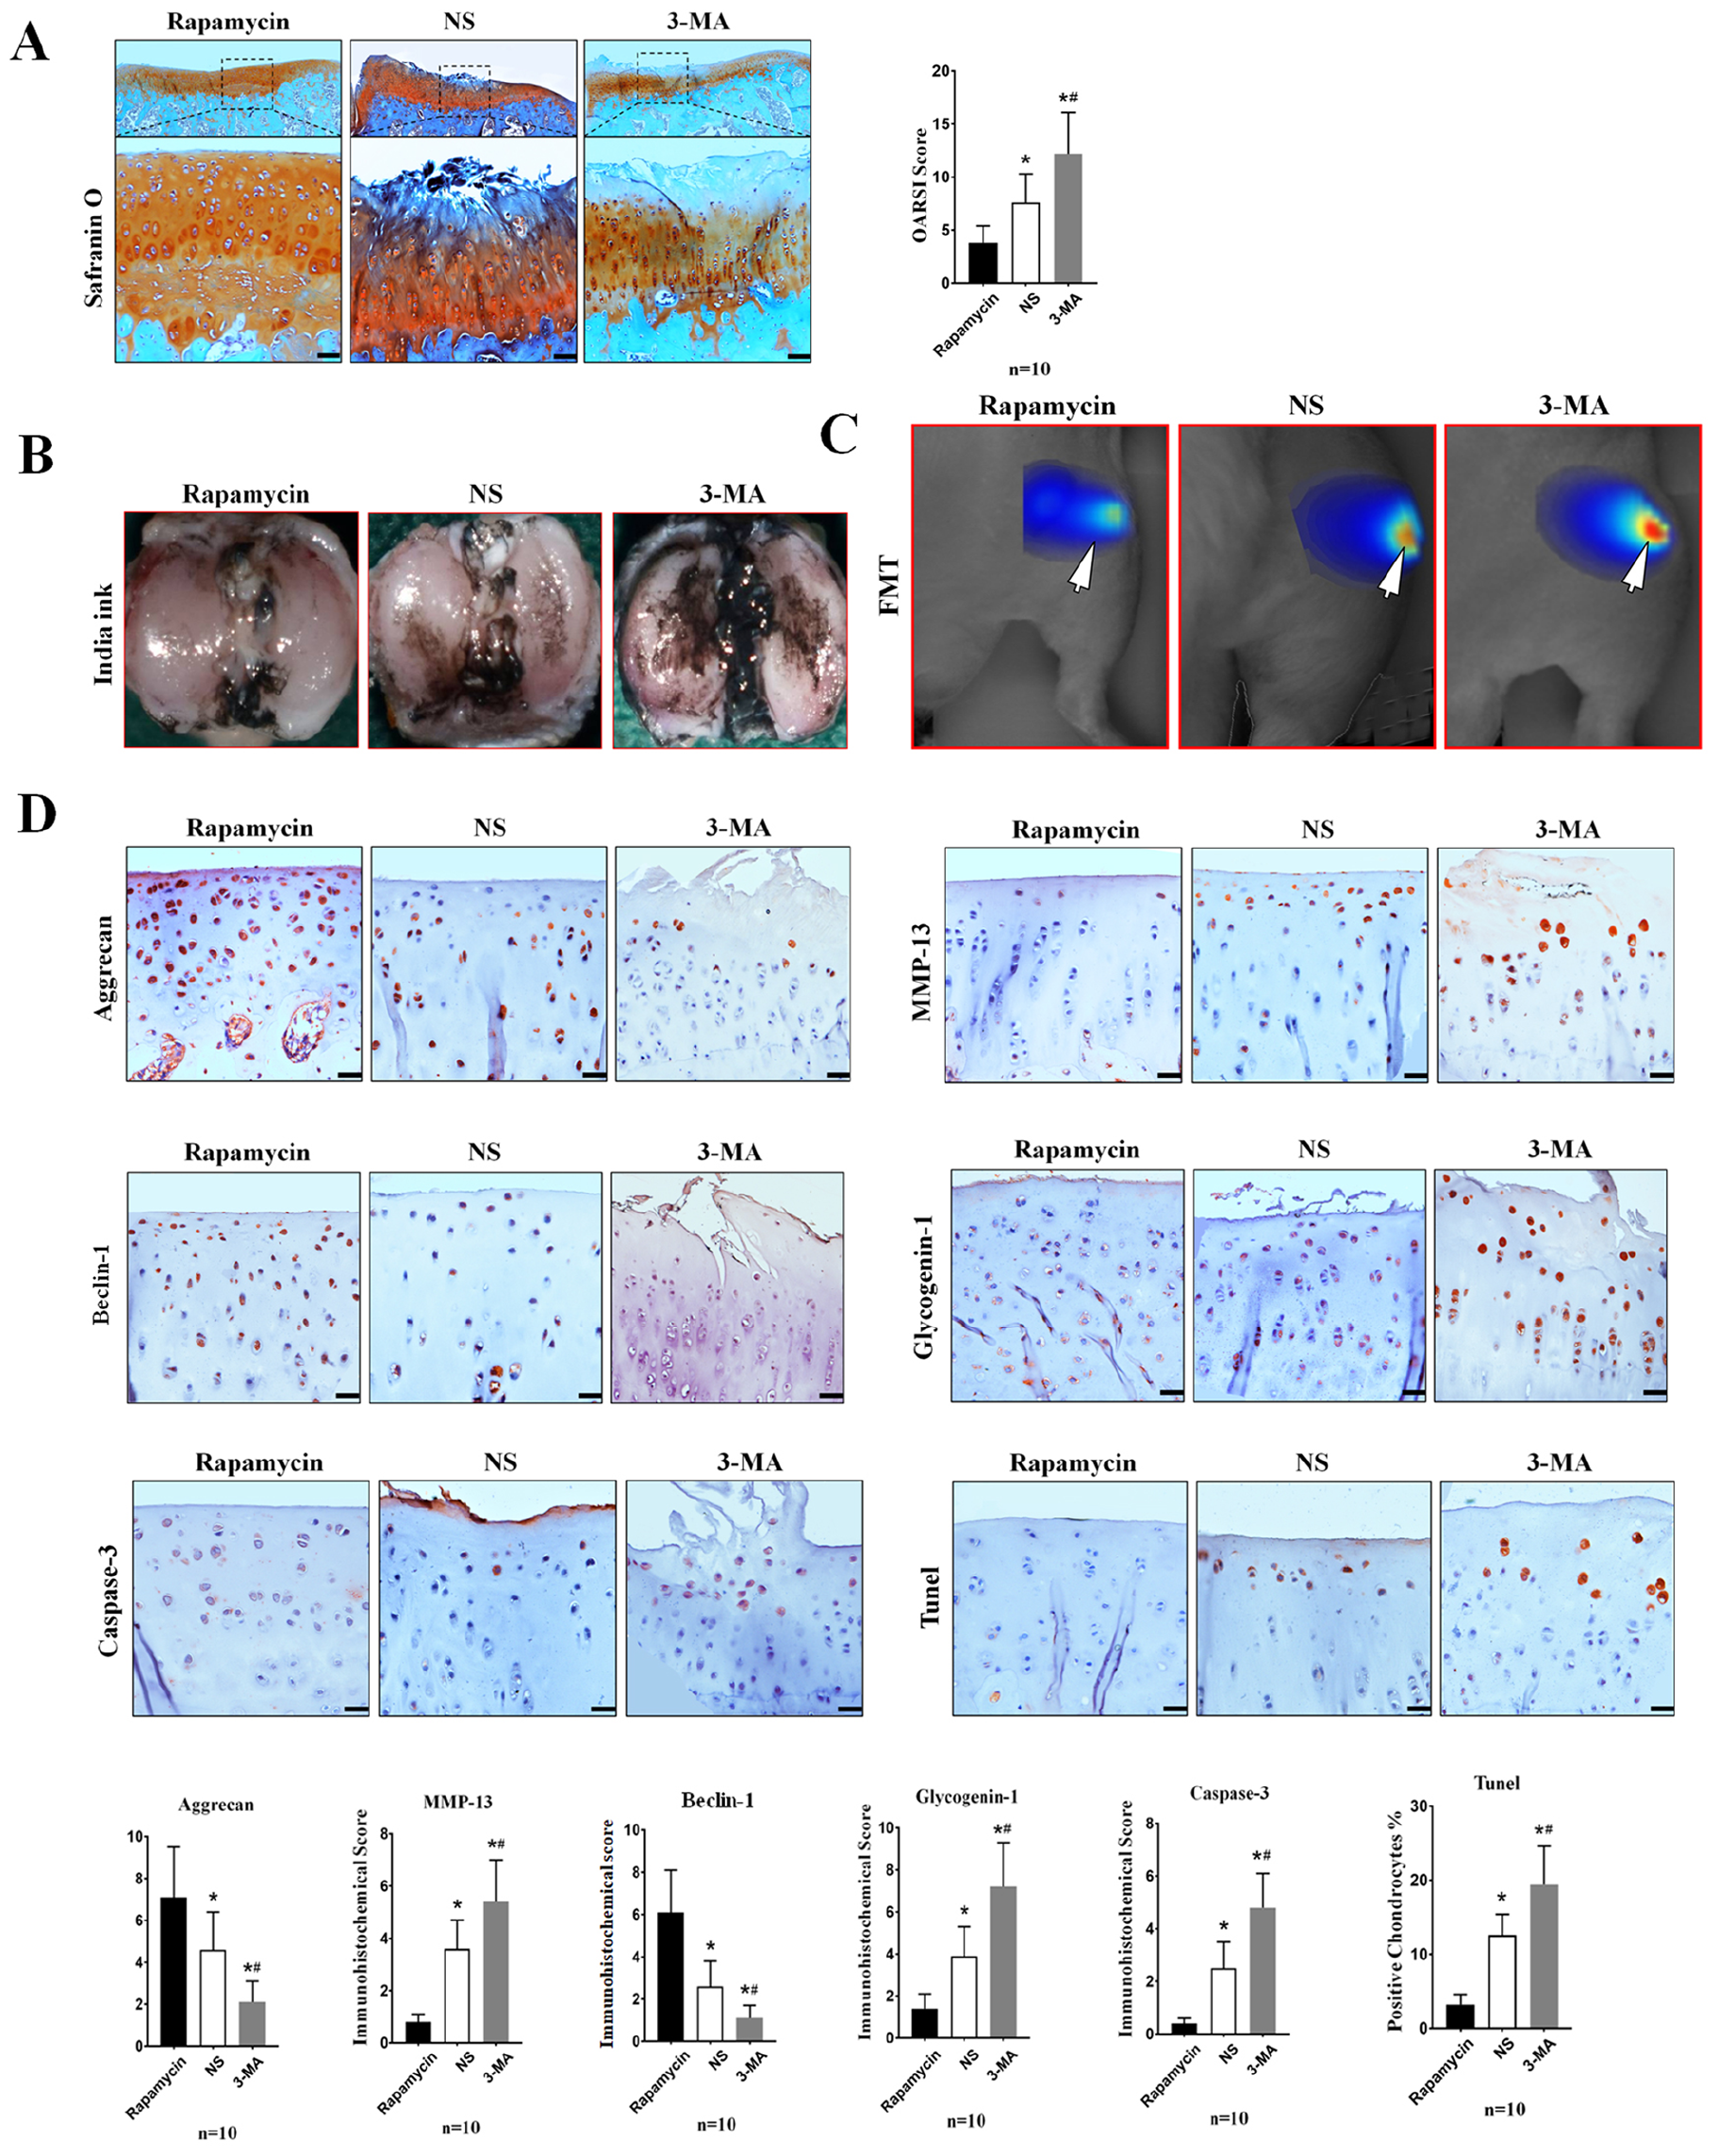
Effect of changes in chondrocyte autophagy levels on articular cartilage. (
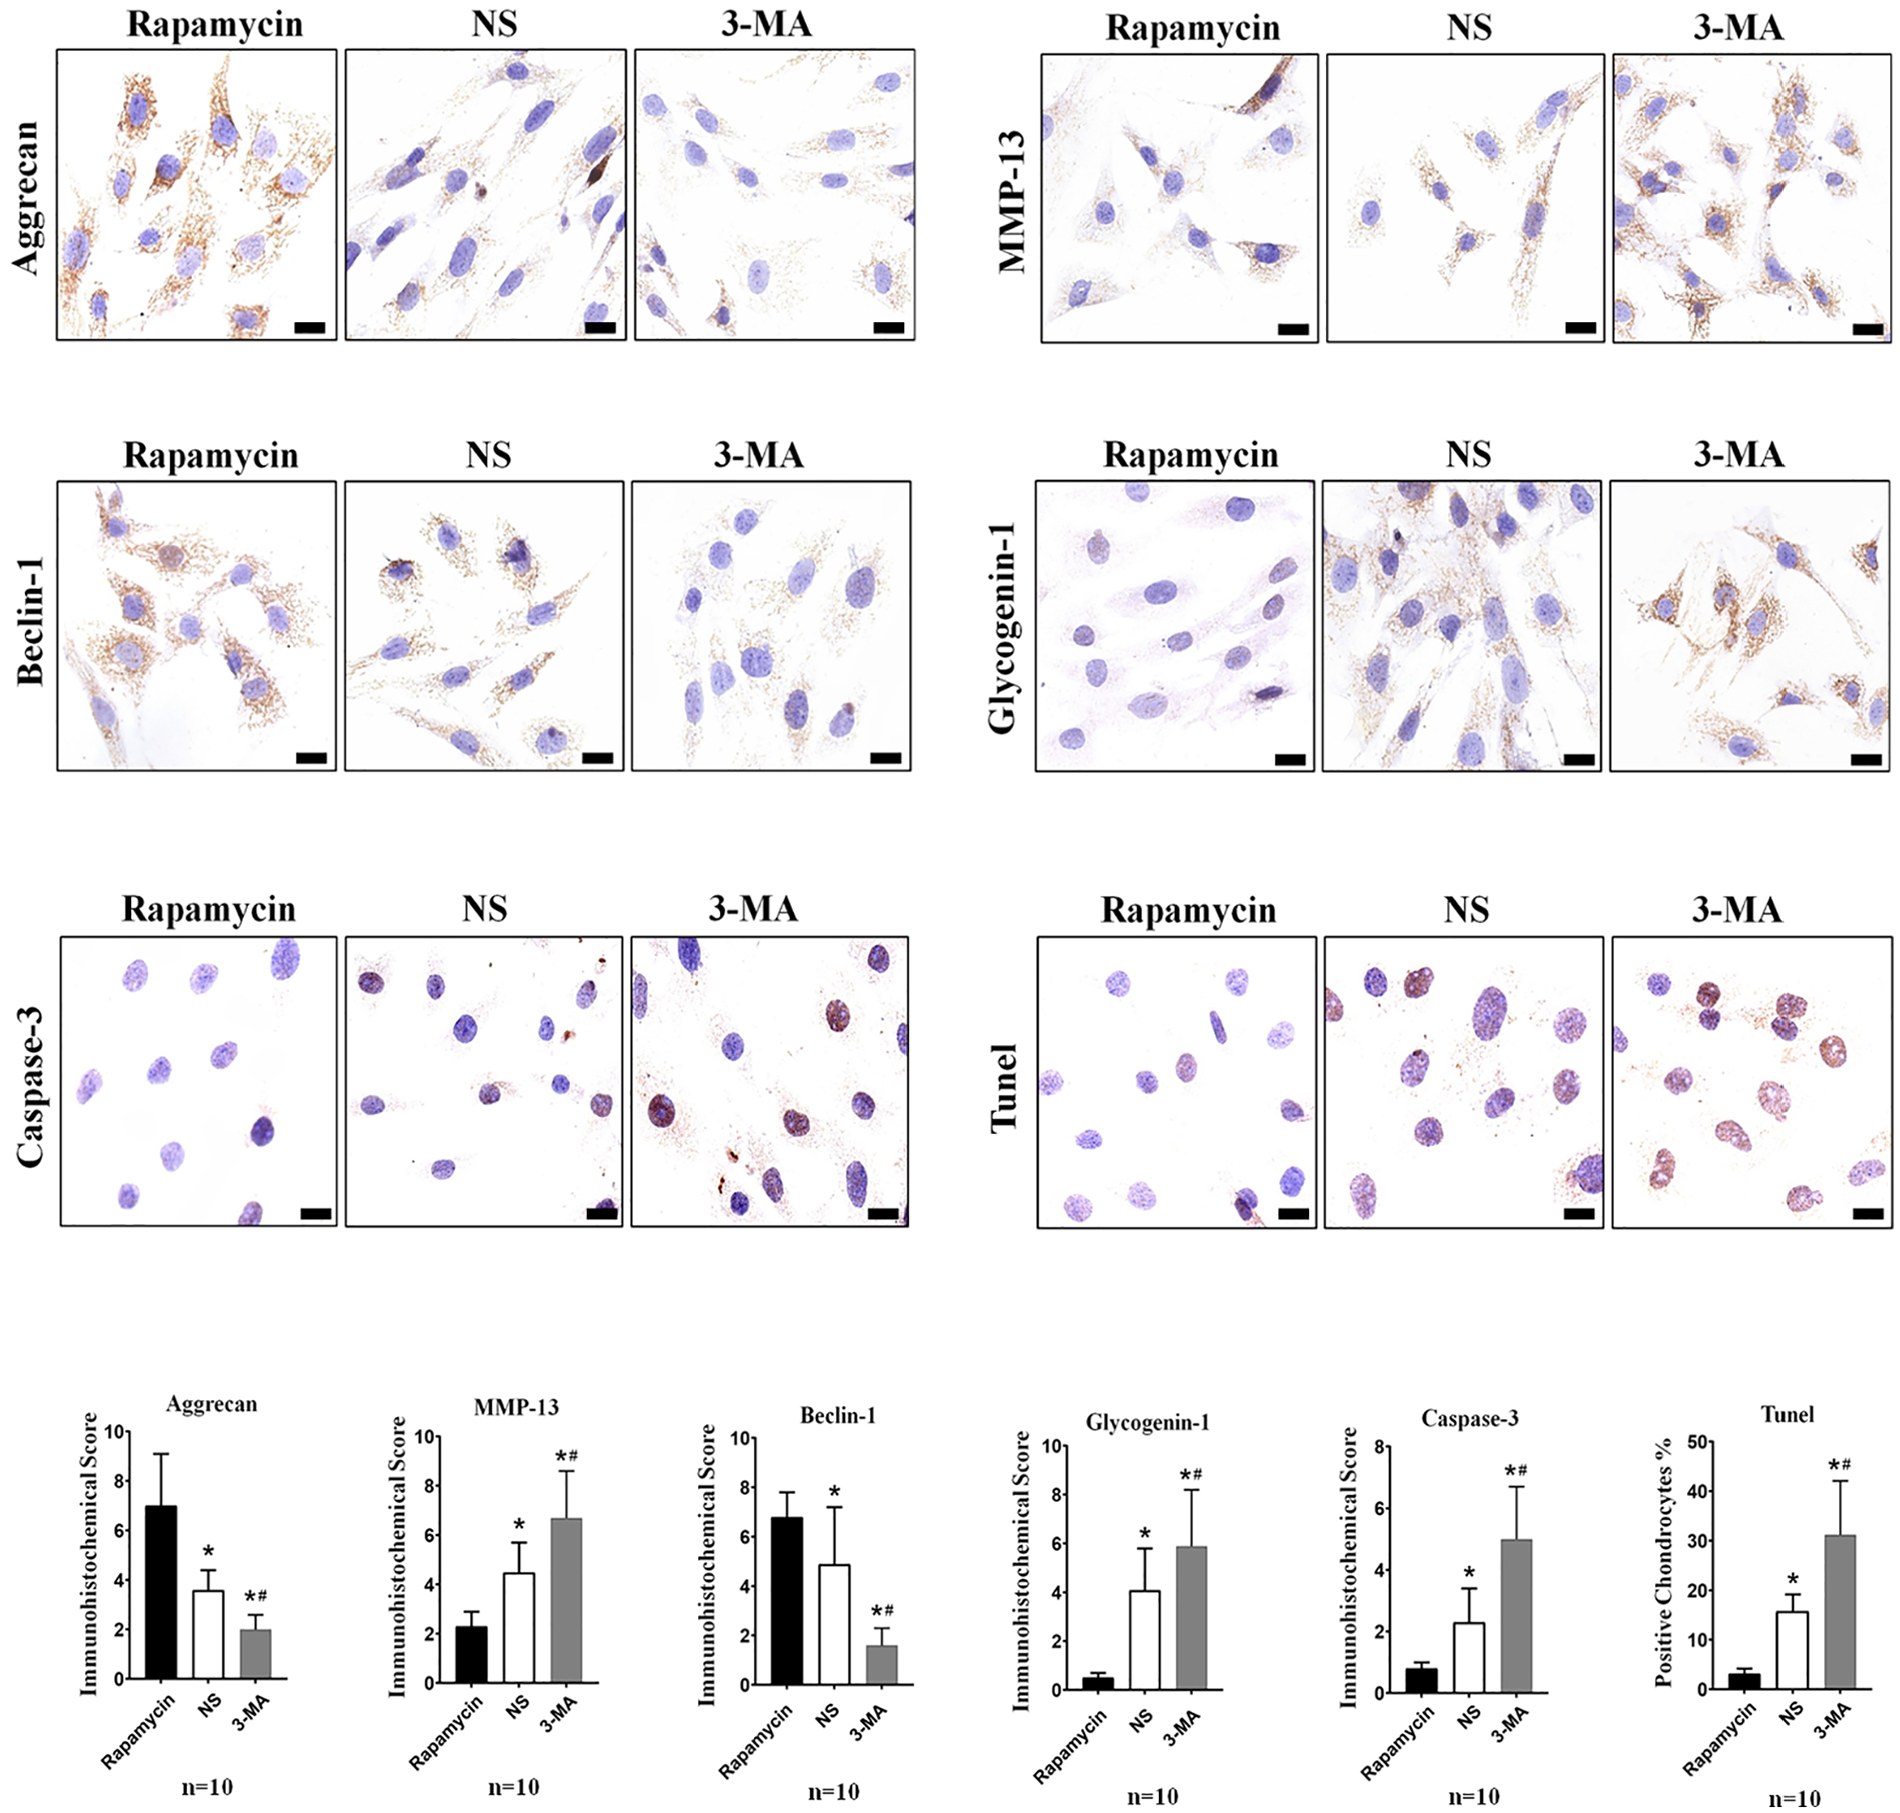
Immunohistochemical results for the proteins aggrecan, matrix metalloproteinase-13 (MMP-13), beclin-1, glycogenin-1, and caspase-3 and comparisons of tissue immunohistochemical scores. TUNEL staining results for chondrocytes and statistical analysis (scale = 10 μm). Statistical significance is shown for a 2-tailed t test. Bars represent the mean ± SEM, *P < 0.05 compared with the rapamycin group; #P < 0.05 compared with the normal saline (NS) group.
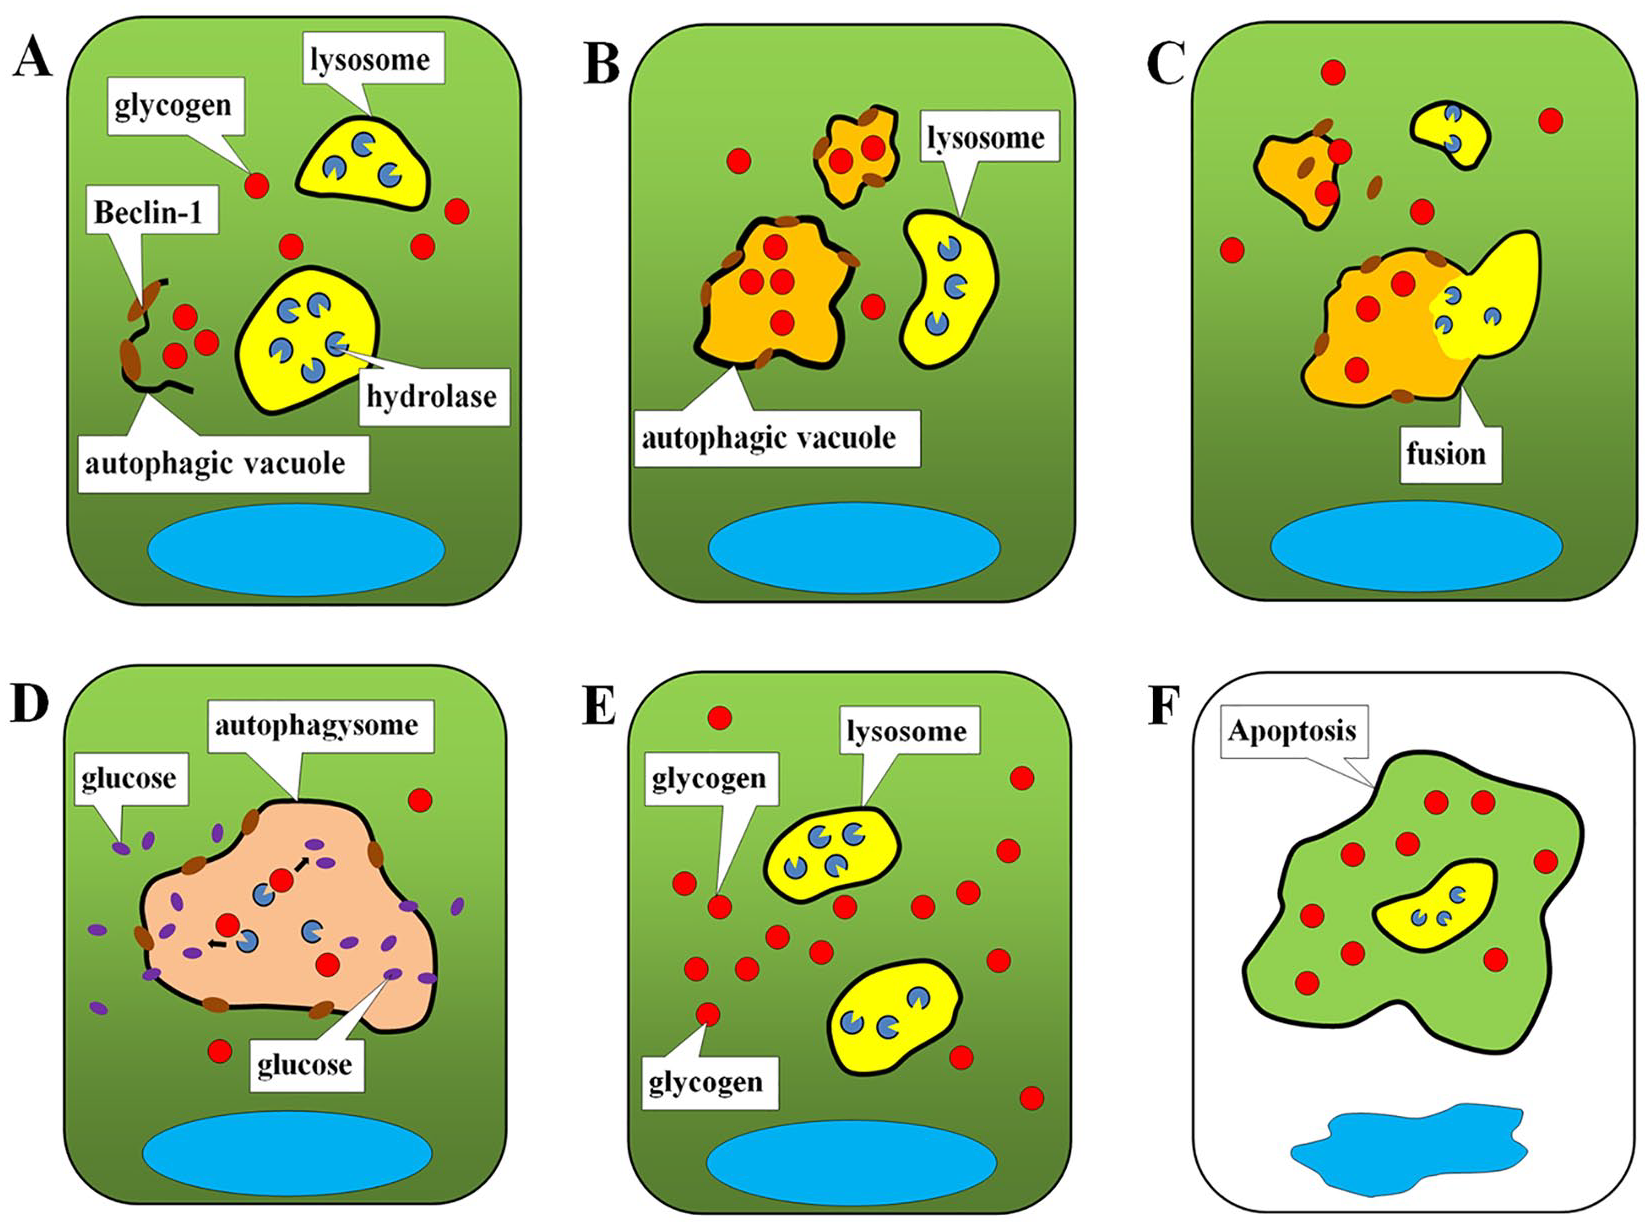
Proposed model for the role of chondrocyte autophagy on intracellular glycogen degradation. (
Discussion
In the present study, we showed that autophagy of tibial plateau chondrocytes is at least partially involved in intracellular glycogen degradation and energy supply. Autophagic vacuoles can engulf intracellular glycogen granules and then bind to lysosomes to form autolysosomes, where hydrolase can degrade the glycogen granules into glucose for use by chondrocytes. When knee OA occurs, the level of autophagy in tibial plateau chondrocytes decreases, and sufficient autophagic vacuoles cannot be formed in chondrocytes to consume glycogen granules. As a result, there is insufficient glucose in these chondrocytes, leading to their apoptosis due to insufficient energy. The apoptosis of OA tibial plateau chondrocytes as a result of the decrease in autophagy may be associated with the failure of glycogen degradation in these cells.
Knee tibial plateau cartilage is primarily composed of chondrocytes and extracellular matrix secreted by chondrocytes; therefore, chondrocytes determine the physiological state of cartilage.3,10,39,40 The study of chondrocytes is a hot spot in the field of knee OA research.8,11-13,17,29,30,33 To date, many experimental models have been developed to simulate human knee OA, including the surgical induction of traumatic OA, drug injection (such as papain) into the joint to produce knee OA, and external fixators to break the knee joint and cause OA.41-44 However, these are all exogenous interventions, and the ideal approach to study the occurrence and development of knee OA is to identify an animal model that can simulate the natural degeneration process of the human knee joint. The guinea pig is a typical animal model used in OA-related studies that spontaneously exhibits degeneration, degradation, and loss of knee cartilage with increased age.45-47
Two-month-old guinea pigs were obtained and sacrificed after 7 months. Knee joint specimens were collected to generate histological sections and stained with safranin O. No obvious change in OA was detected in the articular cartilage. However, after 10 months, significant changes were observed in the cartilage of the tibial plateau of the guinea pigs’ knee OA. This spontaneous cartilage tissue degeneration model in guinea pigs can better simulate the development of human knee OA. As OA progresses slowly, the guinea pig model allows markers for early- and middle-stage chronic inflammatory proteins associated with OA to be gradually expressed. The results showed that when spontaneous OA occurred, the ability of chondrocytes to synthesize aggrecan decreased, whereas MMP-13 protein levels increased in the area of damaged cartilage tissue. This result is consistent with the pathological changes observed in cartilage tissue in knee OA reported in the literature.
Autophagy is an important process that allows chondrocytes to maintain homeostasis. Many studies have confirmed that some drugs can change the autophagy level of cells. 3-MA mainly affects the formation of autophagy by inhibiting the initial process of autophagy. 3-MA is widely considered an autophagy inhibitor due to its inhibition in class III PI3K (NOT class I PI3K,which is an antagonist of autophagy). 48 And class III PI3K has been proved to be an agonist of autophagy. 49 As a common inhibitor of autophagy, 3-MA has been widely used in experiments.49-51 Autophagosomes can be produced to degrade intracellular metabolites, and excess organelles can be degraded when there is external malnutrition to reduce the energy consumption of chondrocytes. Cartilage tissue is an avascular structure, suggesting that chondrocytes experience malnutrition and hypoxia. Importantly, chondrocytes continuously maintain a high level of autophagy under normal conditions.13,14,17 Under normal circumstances, autophagy maintains cellular homeostasis by degrading metabolites and redundant organelles. However, recent studies have shown that autophagy is closely involved in the energy metabolism of cells, particularly sugar metabolism. Glycogen is a polysaccharide composed of glucose that can be metabolized to supply necessary energy to cells when energy is lacking. Glycogenin-1 plays an important role in the initial stage of glycogen synthesis, and its level in chondrocytes can reflect the glycogen accumulation status in these cells. 52 The data showed that glycogen levels were high in liver and muscle cells. Interestingly, the results of a previous study revealed the presence of glycogen in chondrocytes. 11 Glycogen exists in chondrocytes as free glycogen in the cytoplasm or within autophagic vacuoles. Free glycogen in the cytoplasm is phosphorylated and degraded by catabolic enzymes, whereas autophagic vacuole-associated glycogen is directly degraded to glucose by hydrolase without phosphorylation after the merger of this organelle with lysosomes to form autophagosomes. The production of glucose without the phosphorylation of glycogen has been shown to be a more direct process and is important to the energy supply of chondrocytes.11,37 We used IHC staining to assess the protein levels of beclin-1, a biomarker of autophagy, and observed that most chondrocytes expressed this protein, whereas the expression of this protein in chondrocytes from the OA group was significantly decreased. In addition, glycogen accumulation in chondrocytes was also evaluated. The results showed that the level of glycogenin-1, a marker of glycogen accumulation, was significantly higher in the OA group than in the normal group, which was notably low, demonstrating that chondrocytes from the OA guinea pigs had decreased autophagy levels and glycogen accumulation compared with those from the normal group. By evaluating the protein level of caspase-3, a biomarker of apoptosis, a significantly greater number of chondrocytes expressing caspase-3 was observed in the OA group than in the normal group. Furthermore, TUNEL staining was performed to evaluate the apoptosis rate of tibial plateau chondrocytes in the 2 groups, which also proved that the apoptosis rate of chondrocytes in the OA group was higher than that in the normal group in vivo and in vitro. In addition, it should be noted that adenosine monophosphate (AMP)-activated protein kinase (AMPK) pathway is a key mechanism to regulate cell energy metabolism, which is activated when intracellular adenosine triphosphate (ATP) levels lower. 53 When cells are short of energy, in response, AMPK promotes catabolic pathways to generate more ATP, and inhibits anabolic pathways. At present, many studies have confirmed that AMPK signaling pathway can regulate the autophagy process at cell upstream. Under glucose starvation, AMPK promotes autophagy by directly activating Ulk1 through phosphorylation of Ser 317 and Ser 777. Under nutrient sufficiency, high mTOR activity prevents Ulk1 activation by phosphorylating Ulk1 Ser 757 and disrupting the interaction between Ulk1 and AMPK. ULK1 is the homologue of autophagy key protein ATG1, which can start autophagy process.54,55
Why is the suppression of autophagy accompanied by increased apoptosis? Based on these results, we speculate that there is a specific level of glycogen stored in chondrocytes, as shown in Figure 4 . When autophagy functions normally, autophagic vacuoles consume glycogen granules and then merge with lysosomes to form autolysosomes, where hydrolase degrades glycogen to glucose for chondrocyte use.
Our study has some limitations. We showed that when OA occurs, the level of autophagy in chondrocytes decreases, which leads to the failure of glycogen granules in chondrocytes to be degraded into glucose for chondrocyte use and eventually leads to a lack of energy and apoptosis. However, as many factors can cause chondrocyte apoptosis when OA occurs, we do not know what proportion of apoptosis is caused by decreased autophagy in chondrocytes. Since chondrocytes exist in a hypoxic environment, and anaerobic glycolysis should be the primary form of nutrient metabolism, it is unclear what proportion of this glycogen metabolism is mediated by autophagy. These issues will require additional research in future studies.
Conclusion
In summary, the results of the present study show that when the level of autophagy and the number of autophagic vacuoles in OA chondrocytes decreases, glycogen cannot be consumed and degraded, leading to its accumulation in chondrocytes. Subsequently, the inability of chondrocytes to obtain the necessary glucose eventually leads to a reduced energy supply and apoptosis.
Footnotes
Acknowledgments and Funding
The authors would like to thank Fang Liu for her work on the literature search as well as Gang Zheng and Hong Bi for their work on pathology. The author(s) disclosed receipt of the following financial support for the research, authorship, and/or publication of this article: This work was supported by grants from the China Postdoctoral Science Foundation (2020M680910), Fund Program for the Scientific Activities of Selected Returned Overseas Professionals in Shanxi Province (no.20210019),the Natural Science Foundation of Shanxi Province of China (no. 201701D121161) and the Key Research and Development Projects of Shanxi Province (no. 201803D31160, 201703D321027-4).
Author Contributions
XJ Wang: study design, data acquisition, data analysis, manuscript writing. W Tian,WW Xu and LJ Li: data analysis, discussion of results. X Lu and F Chang: data acquisition, histochemistry and western blotting analysis. XJ Wang: statistical analyses. YM Zhang and XJ Wang: study design, manuscript editing. All authors have approved the submitted manuscript.
Declaration of Conflicting Interests
The author(s) declared no potential conflicts of interest with respect to the research, authorship, and/or publication of this article.
Ethical Approval
This study was approved by the Ethics Committee of Shanxi Provincial People’s Hospital (Approval Number: 20190018) (Tai Yuan, China).