
Abstract
Objective
To investigate the effects of low nutrition and trichothecenes-2 toxin (T-2) on human chondrocytes cell line C28/I2 and the gene expression levels of some chondroitin sulfate (CS)–modifying sulfotransferases.
Methods
The chondrocytes were divided into 4 intervention groups: (a) control group (Dulbecco’s modified Eagle’s medium/Nutrient Mixture F-12 [DMEM/F-12] with fetal bovine serum [FBS]), (b) low-nutrition group (DMEM/F-12 without FBS), (c) T-2 group (DMEM/F-12 with FBS plus 20 ng/mL T-2), and (d) combined group (DMEM/F-12 without FBS plus 20 ng/mL T-2). Twenty-four hours postintervention, ultrastructural changes in the chondrocytes were observed by transmission electron microscopy (TEM). Live cell staining and methyl thiazolyl tetrazolium (MTT) assay were performed to observe cell viability. The expression of CS-modifying sulfotransferases, including carbohydrate sulfotransferase 3, 12, 13, 15 (CHST-3, CHST-12, CHST-13, and CHST-15, respectively), and uronyl 2-O-sulfotransferase (UST) were examined by quantitative real-time polymerase chain reaction (RT-qPCR) analysis.
Results
The cells in the T-2 group and combined group had significantly lower live cell counts and relative survival rates than the control group. TEM pictures revealed decreased electron density of mitochondria in the low-nutrition group. The T-2 group and combined group both caused mitochondrial swelling, damage, and reduction in mitochondrial number. RT-qPCR showed a trend of altered expression of CHST and increased expression of UST genes under low-nutrition, T-2 toxin and combined interventions.
Conclusions
These results show early-stage Kashin-Beck disease chondrocyte pathophysiology, consisting of chondrocyte cell damage and compensatory upregulation of CHST and UST genes.
Introduction
Kashin-Beck disease (KBD) is a form of chronic osteoarthropathy characterized by joint deformity, arthritis, and dwarfism, 1 resulting from cartilage necrosis and secondary remodeling and repair of the cartilage. 2 It is endemic to parts of western, northeastern, and central China, Tibet, and Siberia. 3 While the etiology of KBD remains unclear, years of study have resulted in a multifactorial model that mainly consists of food-related causes,4,5 including selenium deficiency and mycotoxin ingestion. It can be observed that people in areas where KBD is endemic not only have lower selenium levels in the soil 6 but also suffer from iodine deficiency. 7 These deficiencies in the diets of people from KBD-endemic areas are clearly part of the KBD causation, as can be seen by the fact that various food-related interventions and supplements, including selenium and iodine, have been shown to be effective in combating KBD.8-10 The effectiveness of these interventions indicates that the role that nutrition plays in KBD etiology is significant, and needs further exploration.
Trichothecenes-2 (T-2) toxin is a type of mycotoxin that is found to be in high concentrations in endemic grain like wheat and maize. 11 This finding, accompanied with its known cytotoxic effects, and the fact that exposure to T-2 toxin alters the physiology of chondrocytes and induces their apoptosis and necrosis, 12 has made T-2 toxin a key part of multiple KBD studies. While previous studies have shown that T-2 toxin alone has a significantly adverse effect on chondrocytes, such as the aforementioned necrosis, there are fewer studies on the joint intervention of multiple factors, and considering the multifactorial KBD etiology hypothesis, these studies are necessary, because the combination of factors might lead to more harmful effects.
In this study, interventions were performed involving low nutrition, T-2 toxin, and T-2 toxin and low nutrition combined on chondrocytes. The effects were observed, along with any changes in the expression of certain carbohydrate sulfotransferase (CHST) genes and the uronyl 2-sulfotransferase (UST) gene, all responsible for coding sulfotransferase enzymes that are important in the structure of cartilage. 13 This 3-part study was all to observe the direct, short-term effect of T-2 toxin and low nutrition on chondrocytes from a genetic, morphologic, and cell viability perspective.
Materials and Methods
Live Cell Line Culture and Intervention
In this experiment, chondrocytes of the C28/I2 cell line were cultured at a density of 5 × 10⁵ cells/25 cm2 flask or 5 × 10⁴ cells/well of a 6-well culture plate with cell culture medium in CO2 incubator at 37 °C. Cell culture medium includes Dulbecco’s modified Eagle’s medium/Nutrient Mixture F-12 (DMEM/F12, HyClone, Thermo Scientific, Logan, UT, USA), 10% fetal bovine serum (FBS, Gibco, Grand Island, NY, USA), and 1% penicillin-streptomycin solution (HyClone, Thermo Scientific, Logan, UT, USA). When the chondrocyte reached 90% confluence, the chondrocytes were divided into 4 groups following the intervention for 24 hours: (a) control group (DMEM/F-12 with FBS), (b) low-nutrition group (DMEM/F-12 without FBS), (c) T-2 toxin group (DMEM/F-12 with FBS plus 20 ng/mL T-2), and (d) combined group (DMEM/F-12 without FBS plus 20 ng/mL T-2). After 24-hour intervention, the live cell staining, methyl thiazolyl tetrazolium (MTT) assay, transmission electron microscopy (TEM) observation, and quantitative real-time polymerase chain reaction (qPCR) were used to analyze the chondrocytes.
Live Cell Staining
In order to observe the effect of the various interventions on the chondrocyte cultures, LIVE/DEAD Viability/Cytotoxicity Kit (Molecular Probes, Invitrogen, France) was used to identify viable chondrocytes. 6-well plates were used to separated chondrocytes, then washed with phosphate-buffered saline (PBS) 3times before adding 400 μL of PBS containing ethidium calcein-AM (2 μM) and homodimer-1 (4 μM). After incubation at 37 °C for 30 minutes, Olympus Fluorescence Microscopy (BX51) was used to image fluorescence stained cells from 4random fields of each sample, and the number of living chondrocytes was counted. The green-colored cells are the live cells.
Cell Viability Analysis
The cells from the 4intervention group cultures (cultured according to the live cell line culture and intervention method explained already in this article), along with a blank group (culture medium only) were cultured after intervention for 24 hours. After this, the culture mediums were discarded and 20 µL of 0.5% of MTT solution (Solarbio, China) was added to each well, and the groups were placed in a 37 °C incubator for 4 hours. After incubation, the liquid in the wells was discarded and 100 µL of dimethyl sulfoxide (DMSO; Sigma, USA) was added to each well. The optical density (OD) value of each well was measured at 570 nm with an enzyme-linked immunoassay instrument (Tecan, Switzerland). The survival rate of each group relative to the control group is calculated according to the following formula: the relative survival rate of cells = (the OD value of each group − the OD value of the blank group) / (the OD value of the control group − the OD value of the blank group). The relative survival rates have been presented in a bar chart for comparison.
TEM Observation
The ultrastructure of chondrocytes was observed by TEM (H-7650, Hitachi, Japan). The cells from the four different cultures were digested by 0.25% trypsin (Sigma, USA) respectively and then were put in the centrifuge at 1200 rpm for 10 minutes. The samples were then fixed in 2.5% glutaraldehyde solution, treated with 1% osmium tetroxide solution for 2 hours and propylene oxide for 10 minutes, after which they were embedded in epoxy resin. Finally, ultramicrotome (Sweden LKBV) was used to obtain 60 nm slices from each sample. After uranyl acetate and lead citrate staining, the slices from four groups were observed by TEM.
Gene Expression Analysis
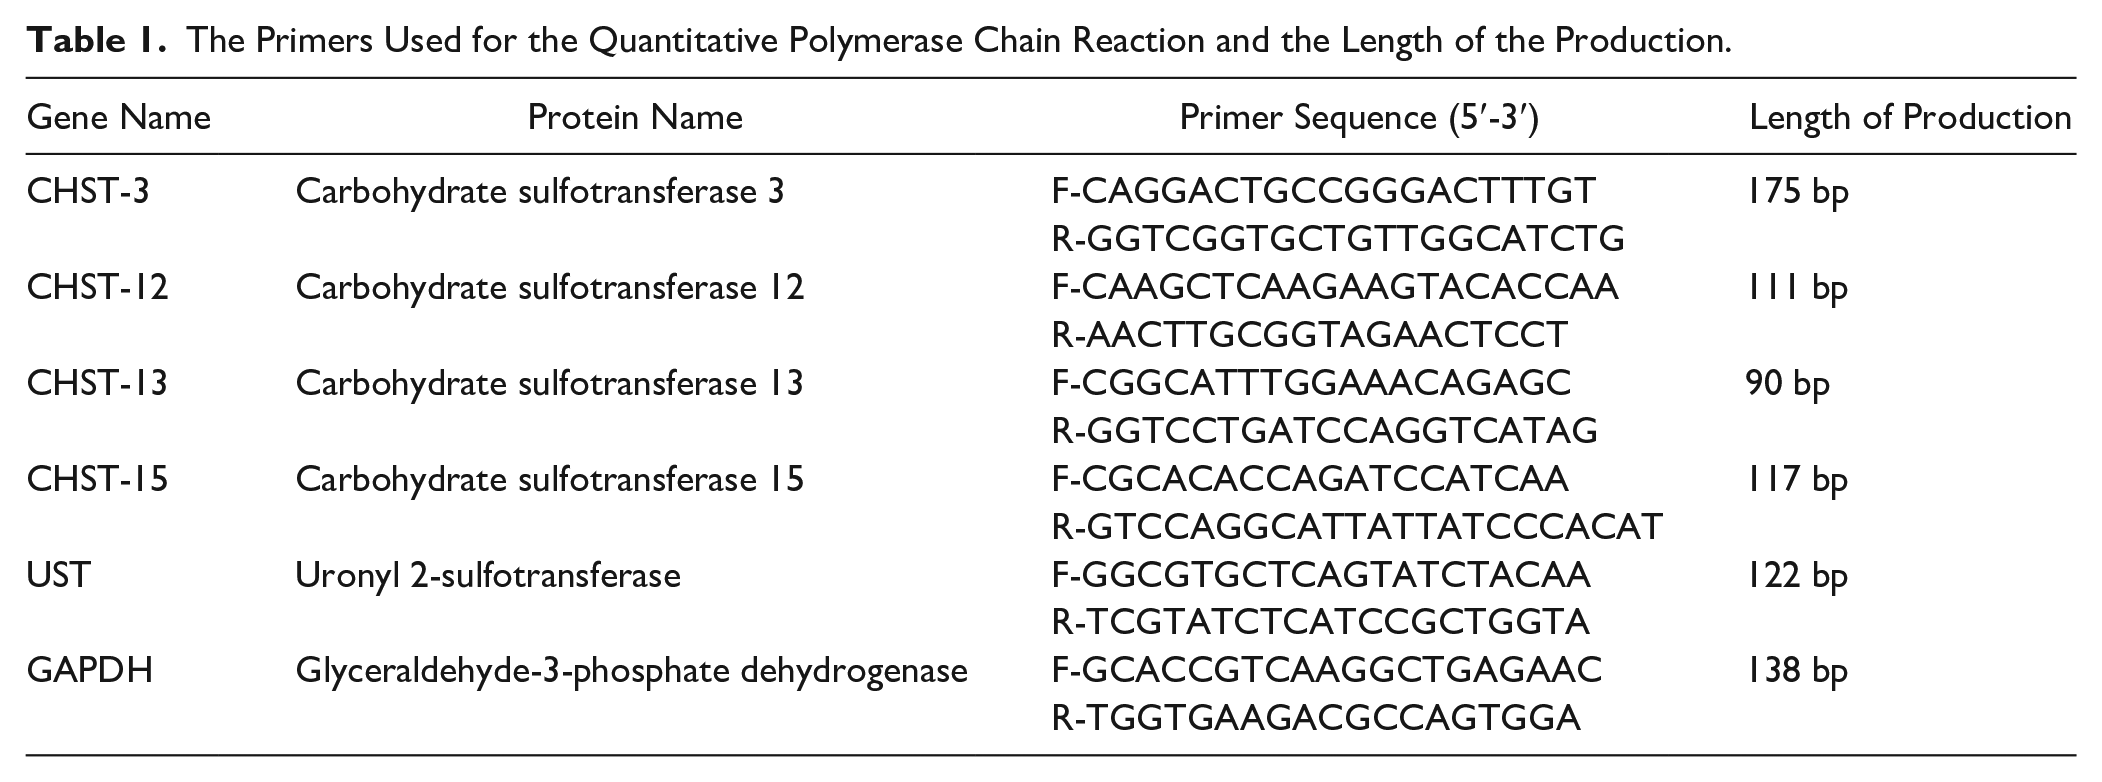
For analysis of gene expression, RNAfast200 Kit (Fastagen, Shanghai, China) was used to extract total RNAs from each group. A full wavelength microplate reader (Thermo Multiskan go, Thermo) was used to assay the quality and concentration of RNA. After the transcription of RNA using RevertAidTM First Strand cDNA Synthesis kit (Fermentas, MBI, Vilnius, Lithuania), the reverse transcription products were used for repeated quantitative real-time polymerase chain reaction (RT-qPCR) analysis performed with Mx3005P QPCR System (Agilent Technologies, Inc.). The cycling condition of RT-qPCR was as follows: 10 minutes at 95 °C, 40 cycles of 95 °C for 30 seconds, 60 °C for 30 seconds, and 72 °C for 30 seconds. The primers used in this study are listed in Table 1 . The ratios of the mRNA expression levels of the control group, low-nutrition group, T-2 group, combined group to the control group (normalized to GAPDH) were calculated. This analysis was performed 3 times with 3 different samples for each group.
The Primers Used for the Quantitative Polymerase Chain Reaction and the Length of the Production.
Statistical Analysis
The SPSS software version 18.0 (SPSS Inc., Chicago, IL, USA) was used for data analysis. All experiments were respectively repeated at least three times and all data were shown as mean ± standard deviation (SD). One-way analysis of variance (ANOVA) was used to analyze differences among groups. P values of less than 0.05 were regarded as significant.
Results
Live Staining Results of Chondrocytes
The cell counts (
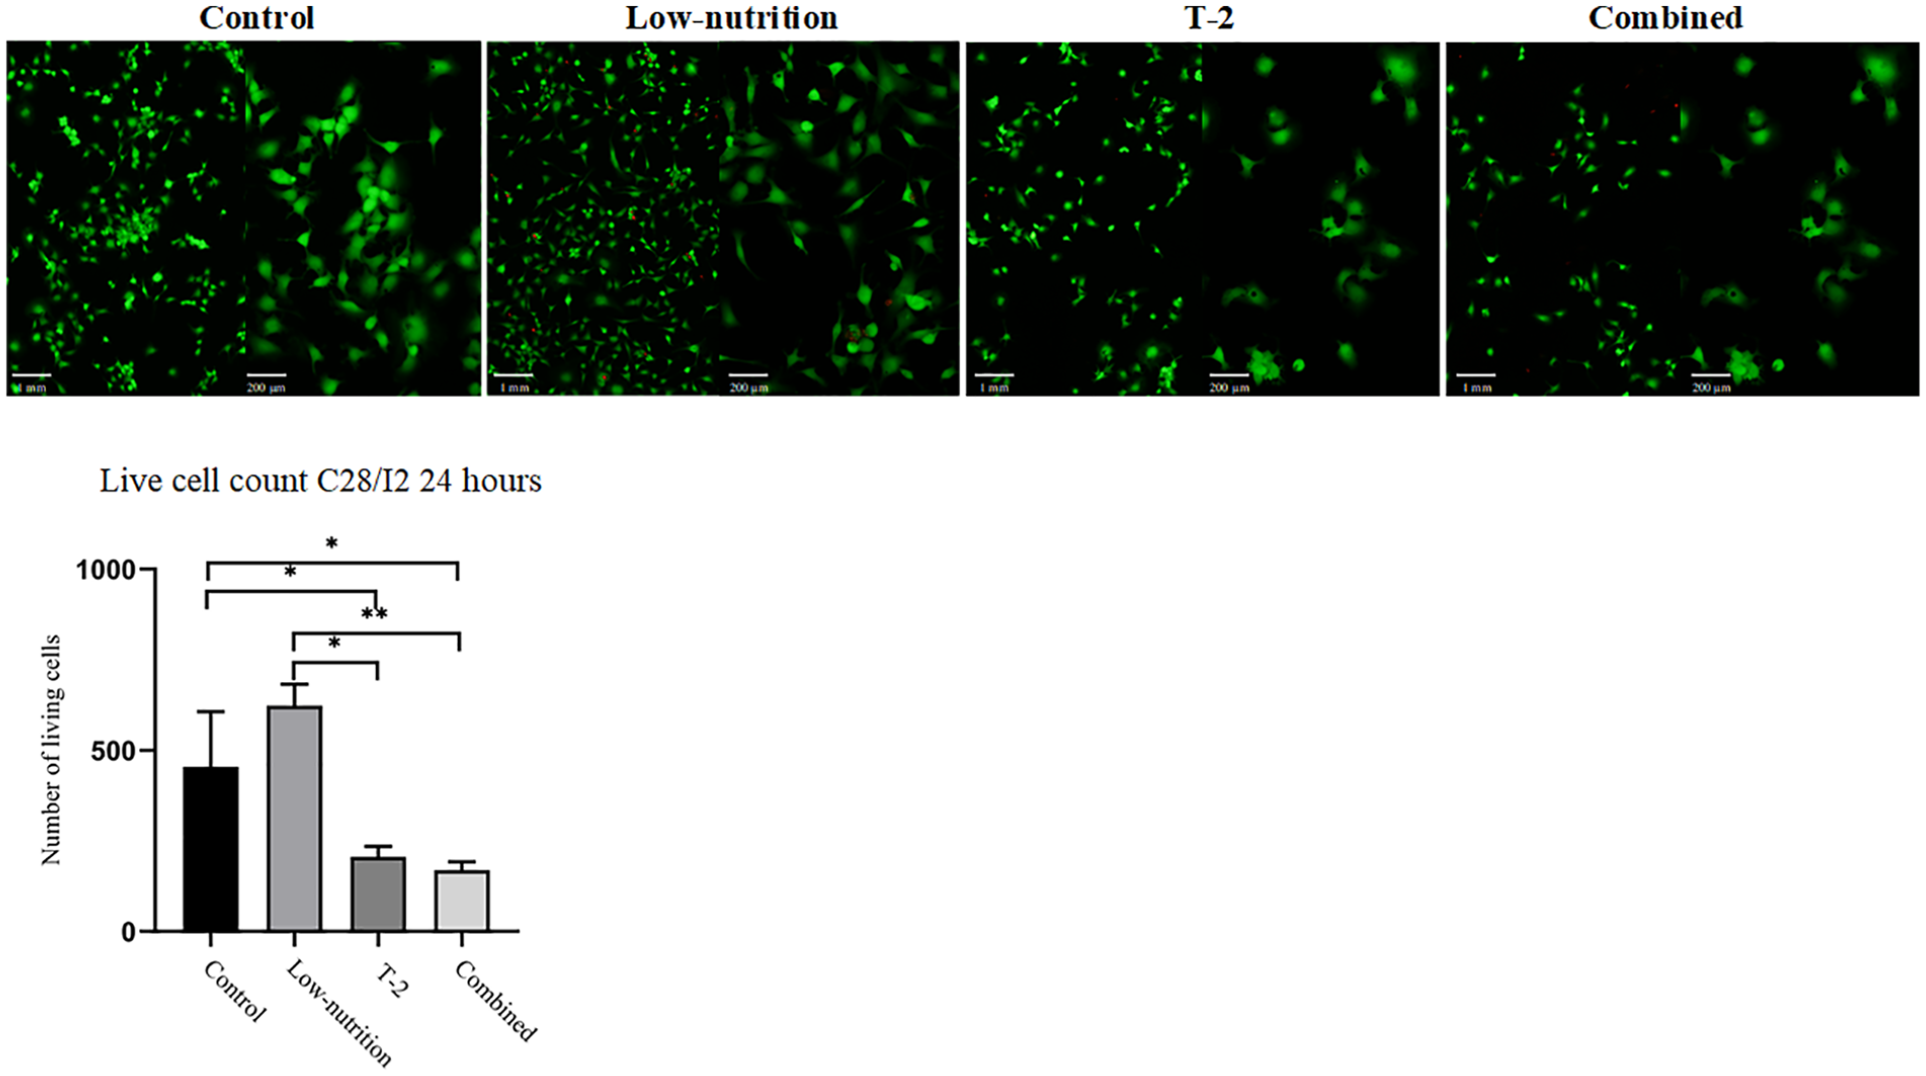
Live cell count of control group, low-nutrition group, T-2 group, and combined group. The living chondrocytes were stained in green color. In the T-2 group, the number of living chondrocytes decreased compared with the control group. In the combined group the number of chondrocytes relatively decreased compared with the T-2 group. Scale bar: 200 μm, 1 mm. *P < 0.05, **P < 0.01.
Cell Viability Analysis
The MTT assay (
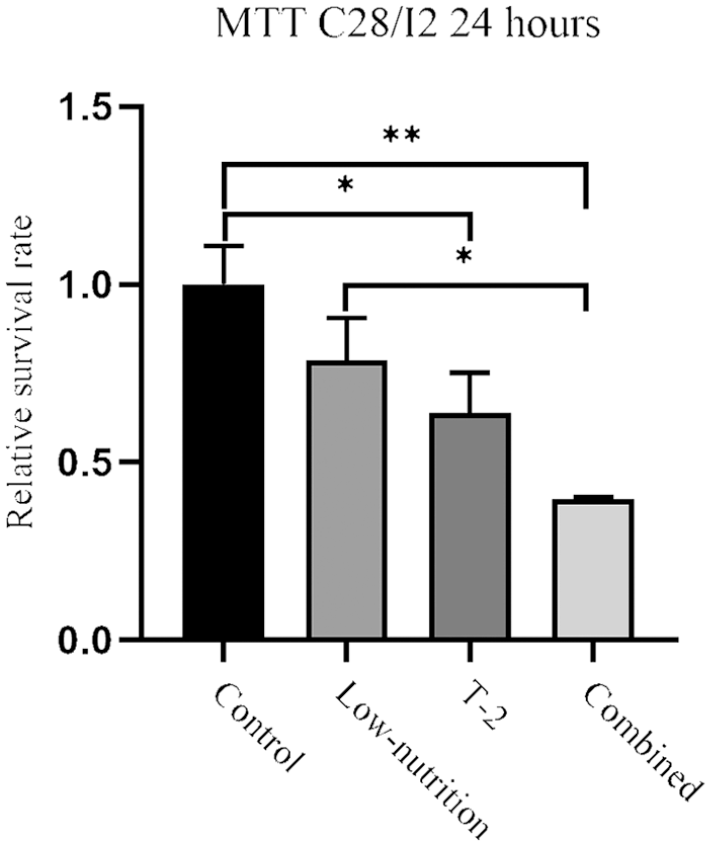
Cell viability analysis of control group, low-nutrition group, T-2 toxin group, and combined group. Results of methyl thiazolyl tetrazolium (MTT) assay are displayed in the bar chart to compare relative cell survival rates. *P < 0.05, **P < 0.01.
TEM Observation Results of Ultrastructural Changes in C28/I2 Chondrocytes
The low-nutrition cultured cells showed decreased electron density of the mitochondria, which is suggestive of mitochondrial dysfunction or damage. The cells exposed to T-2 toxin alone showed cell membrane damage, a decrease in the number of mitochondria, along with mitochondrial damage and swelling. The cells in the combined intervention had the worst effects, with a decrease in the number of mitochondria, chromatin condensation in the margin and cell membrane damage (
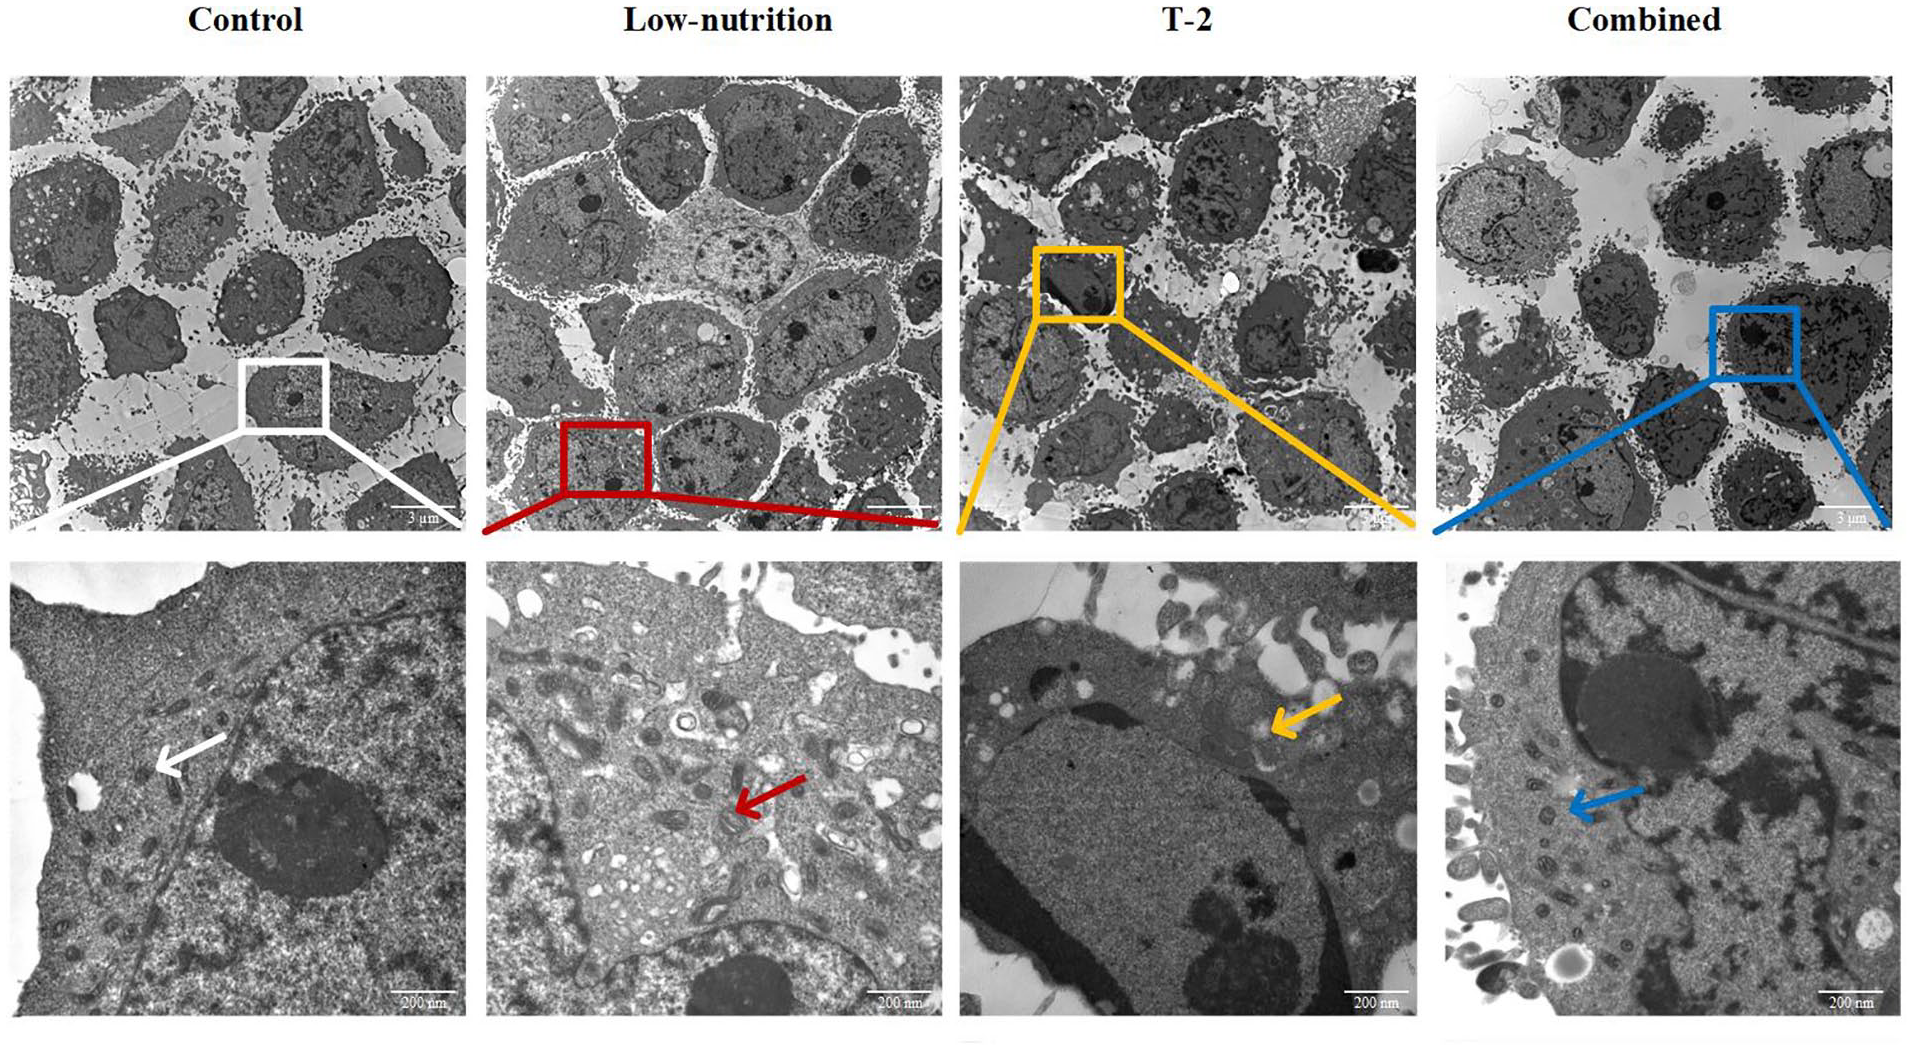
Transmission electron microscopy observations of ultrastructural changes in C28/I2 chondrocytes treated with low nutrition, T-2, and combined intervention. The white arrow shows the normal mitochondrial morphology of the control group. The red arrow shows the mitochondrial morphology in low nutrition group, the blue arrow shows the mitochondrial morphology in combined group, and the yellow arrow shows the mitochondrial morphology in T-2 group. The images in the top row are magnified 3000×, while the images in the bottom row are magnified 20000×.
RT-qPCR Results of CHST-3, CHST-12, CHST-13, CHST-15, and UST
In these results (
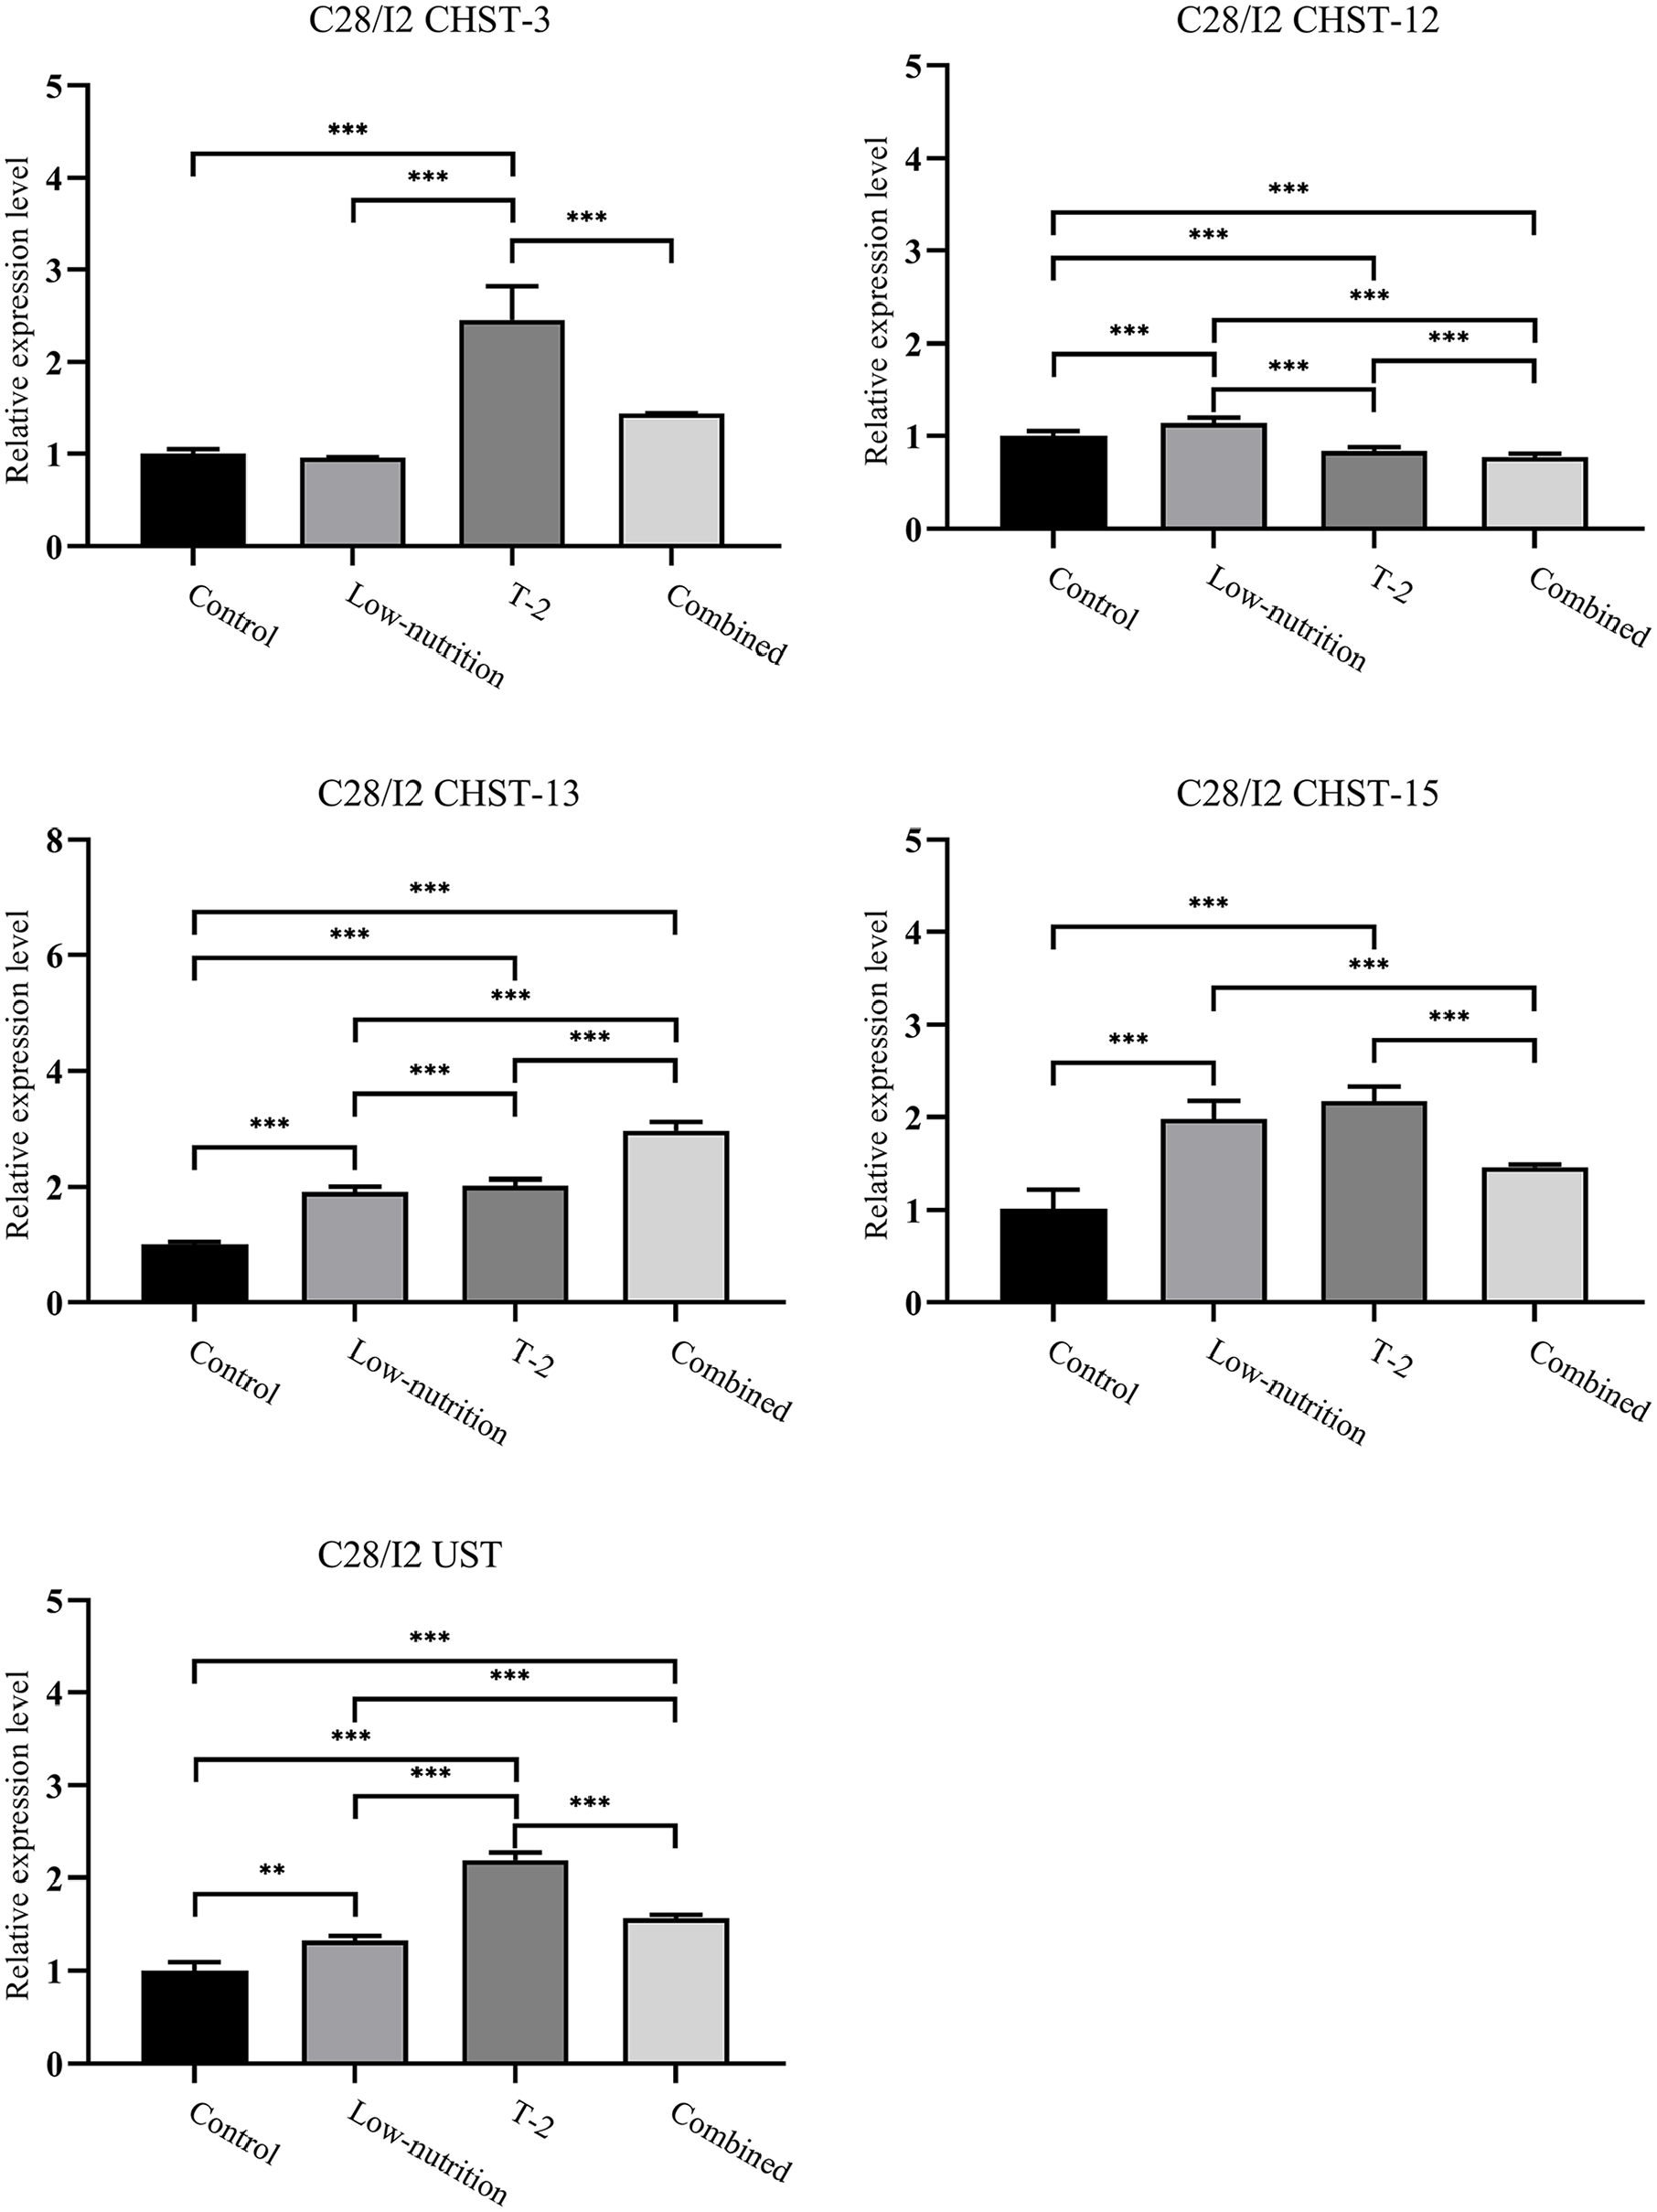
Gene expressions of CHST-3, CHST-12, CHST-13, CHST-15, and UST in KBD (Kashin-Beck disease) chondrocytes after the cells were treated with low nutrition, T-2, and combined interventions. The whole process was performed 3 times, with different samples each time. **P < 0.01, ***P < 0.001.
For the CHST-15 gene, both the low-nutrition culture and the T-2 toxin ones showed increased expression compared with the control and with the combined cultured chondrocytes. UST gene expression was significantly higher under the T-2 toxin intervention, with the combined intervention being higher than the control and low-nutrition samples.
Discussion
Nutrition is a cardinal factor in the development of KBD, as KBD has been linked to varied food deficiency and contamination causes.14,15 Even the act of bringing in food supplies from nonendemic areas has been shown to have a marked effect. 10 Thus, it was interesting to note that low-nutrition live cell count result from day 1showed a slight increase in the cell count when compared with the control. This slight increase was not statistically significant, however, and there was still a negative effect on the chondrocytes in the low-nutrition culture, as the MTT assay and TEM pictures revealed. The low nutrition group in the MTT assay had a lower relative survival rate than the control, while the reduced electron density of the mitochondria indicates a subtle pathological change in the cells, showing that within the 24 hours of the study, there are already small negative alterations in the cells of the low-nutrition group. It is possible that the reason for the lack of an obvious necrotic effect is be due to the short time span of this experiment, perhaps a longer run than 1 day may have produced a clearer difference between the control and the low nutrition intervention. That said, it is clear to see from both the MTT and live cell count results that the combination of low nutrition and T-2 toxin is significantly more harmful than low nutrition or T-2 toxin alone, which shows that while the low nutrition on its own appears to have a weak effect, it definitely has its role to play, as when it works in concert with T-2 toxin, the effects of both factors appear to be amplified.
T-2 toxin, a factor that is also strongly associated with KBD,16,17 showed comparatively dramatic changes in the cell count, MTT assay and the TEM cell morphology. As has been pointed outearlier, the T-2 toxin combined with low nutrition had an even stronger effect, which is not unprecedented. A study on the effect of T-2 toxin combined with low nutrition diet on rat epiphyseal plate growth and development found that while T-2 toxin alone is capable of inducing chondrocyte necrosis, this effect was greater when the T-2 toxin is combined with low nutrition. 18 This indicates that T-2 toxin may be the more potent factor in KBD etiology compared with the varied nutritional factors. Overall, however, these results are in line with the multifactorial KBD etiology hypothesis, because it can be observed that the strongest effect in this study came from the intervention group in which more than one factor was introduced.
Carbohydrate sulfotransferase (CHST) and UST genes encode some of the proteins that are responsible for sulfation of the glycosaminoglycans (GAGs) that comprise chondroitin sulfate (CS). 19 Aggrecan, the major proteoglycan in cartilage, is responsible for its compressibility and it is formed by the binding of CS and a core protein. 20 In this study, the CHST-13, CHST-15, and UST all showed increased gene expression under the T-2 toxin, low-nutrition and combined interventions when compared with the control, and CHST-3 also showed increased expression in the T-2 toxin group compared with the control. Overall, apart from CHST-12, the genes show a trend of being upregulated by the interventions. Similar upregulation of CS-modifying genes has been observed before in children with KBD21,22 and was hypothesized to be a protective compensatory effect in the early stage of KBD. This compensatory effect may be part of why a higher risk of clinically diagnosable KBD has been associated with age, 23 even among children, 24 indicating that it may take some time after disease onset for the compensatory mechanism to be overcome and the disease to advance to a clinical stage. Without this compensatory mechanism, it is easy to speculate that there would be more immediate disease symptoms due to the importance of an unhindered sulfation process, as was found in an animal study where altered sulfation adversely affected chondrocytes and bone growth. 25 In contrast, this protective mechanism is absent in adult patients with KBD 26 or even in an animal model experiment, 27 where downregulation of CS-modifying sulfotransferases is observed. One obvious difference between this study and the contrasting studies is the stage of KBD: the results of this study reflect the effects of 24 hours of intervention and can be classified as short-term or early-stage, and thus are similar to the results observed in studies of children with KBD. Meanwhile, the contrasting studies concern the effects of later stage or more long-term KBD. It is therefore likely that the chondrocyte necrosis and compensatory upregulation of sulfotransferases observed in this study are an important part of early-stage KBD pathophysiology.
There are some limitations in this study that must be acknowledged. First, the omission of FBS from the low-nutrition culture does not perfectly simulate the malnutrition that people in KBD endemic areas suffer. Second, this study is in vitro, and thus the results may differ from in vivo conditions. It must also be noted that this study does not include a direct analysis of the sulfation degree of chondroitin sulfate in KBD cartilage, and that such a study is necessary to do in the future, for a clearer understanding of CS in KBD. Last, this study covers a short period of time, and so the effects observed can only be those that appeared within the first day.
In summary, this study found that T-2 toxin and low nutrition, either alone or in combination, have an adverse effect on chondrocytes. This is in keeping with related studies that have found a similar result. The combined intervention of T-2 toxin and low-nutrition led to both cell necrosis and overall increased expression of CS-modifying sulfotransferases, a phenomenon that has been observed before in pediatric KBD patients. The results of this study support the hypothesis that compensatory upregulation of CS-modifying sulfotransferases and cell necrosis are part of the early pathophysiology of KBD.
Footnotes
Author contributions
All authors participated in drafting the article and critically modifying the important content of knowledge, with all authors endorsing the final version, Deng, Chilufya, Liu had full access to all the data in the study and takes responsibility for the integrity of the data and accuracy of the data analysis. Study conception and design: Han. Acquisition of data: Chilufya, Liu, Deng, Qiao, Xiao, Zhao, Guo, Lv. Analysis and interpretation of data: Deng, Chilufya, Liu, Qiao, Wang, Zhang. Drafting the article or revising it critically for important intellectual content: Deng, Chilufya, Liu, Han. Final approval of the version of the article to be published: Deng, Chilufya, Liu, Qiao, Xiao, Zhao, Guo, Lv, Wang, Zhang, Han.
Acknowledgments and Funding
The author(s) disclosed receipt of the following financial support for the research, authorship, and/or publication of this article: This study was supported by National Natural Science Foundation of China (81872567) and China Postdoctoral Science Funding (2018M633530). The study sponsors were not involved in the study design, data collection, analysis or interpretation, or in the writing of the manuscript, neither did they affect the decision to submit the manuscript for publication.
Declaration of Conflicting Interests
The author(s) declared no potential conflicts of interest with respect to the research, authorship, and/or publication of this article.
Ethical Approval
This study was approved by the Human Ethics Committee of the Xi’an Jiaotong University.