
Abstract
Objective
Hypertonic dextrose (HD) injections (prolotherapy) for osteoarthritis are reported to reduce pain. Cartilage regeneration is hypothesized as a mechanism. This in vitro study identifies an HD concentration that stimulates chondrogenic cells to increase metabolic activity and assesses whether this concentration affects collagen deposition and proliferation.
Design
ATDC5 chondrogenic cells were cultured in normoglycemic DMEM/F12 medium, treated with concentrations of HD (4-400 mM), and assessed with PrestoBlue. Advanced light microscopy was used to conduct live imaging of collagen deposition through second harmonic generation microscopy (SHG) and proliferation via 2-photon excitation microscopy. Proliferation was additionally assessed with hemocytometer counts.
Results
A linear regression model found that, relative to the 4 mM baseline control, cells treated with 200 mM had a higher mean absorbance (P = 0.023) and cells treated with 250 mM were trending toward a higher mean absorbance (P = 0.076). Polynomial regression interpolated 240 mM as producing the highest average absorbance. Hemocytometer counts validated 250 mM as stimulating proliferation compared with the 4 mM control (P < 0.01). A concentration of 250 mM HD led to an increase in collagen deposition compared with that observed in control (P < 0.05). This HD concentration also led to increases in proliferation of ATDC5 cells relative to that of control (P < 0.001).
Conclusions
A 250 mM HD solution appears to be associated with increased metabolic activity of chondrocytes, increased collagen deposition, and increased chondrocyte proliferation. These results support clinical prolotherapy research suggesting that intra-articular HD joint injections reduce knee pain. Further study of HD and cellular processes is warranted.
Introduction
Osteoarthritis (OA) affects millions of Americans, often causing pain and loss of function and is associated with the degradation of articular cartilage. 1 Articular cartilage contains only a single cell type: chondrocytes. 2 Accounting for less than 10% of the cartilage volume, 3 chondrocytes synthesize, turn over, and maintain the surrounding extracellular matrix (ECM), which is composed of collagen, proteoglycans, and other extracellular proteins.4,5 In adults with healthy articular cartilage, chondrocytes, which proliferate very slowly, maintain collagen and other ECM molecules. 6 Collagen proteins, which represent one of the main ECM macromolecules, increase the tensile strength of cartilage. 7 Under metabolically pathological conditions, chondrocytes are sometimes transiently activated to engage in low-level proliferation and increase their synthesis of ECM molecules.5,8,9 In osteoarthritic joints, collagen deposition and chondrocyte proliferation are reduced, 6 which has spurred the development of therapies to regenerate cartilage. 8
To treat pain and potentially limit disease progression with OA, a growing number of physicians treat OA by injecting small volumes of hypertonic dextrose (HD) into painful osteoarthritic joints with the goal of limiting pain and regenerating cartilage. 10 HD injections are a core element of a commonly practiced form of regenerative medicine known as prolotherapy.11,12 A meta-analysis of four randomized controlled trials with 258 participants concluded that prolotherapy relieves knee pain due to OA. 13 Based on his narrative review of several research reports, Hauser 14 asserted that HD injections act by stimulating joints to regenerate cartilage. In a study of 6 OA patients, Topol et al. 15 reported that HD may stimulate regrowth of cartilage in knee joints, based on a comparison of pretreatment and posttreatment arthroscopic observation and histological staining. Thus, there is evidence of a correlation between HD treatment and cartilage growth in vivo and decreased pain.
Current in vitro research on the mechanism of action by which HD may regenerate cartilage posits that HD acts as an osmotic irritant. More than 25 years ago, Banks 16 proposed that HD osmotically kills a small number of cells local to the injection site, which in turn release proteins that initiate a wound healing cascade. As part of the process in which this wound healing cascade regenerates cartilage, chondrocytes deposit collagen and other ECM molecules. 5 Under normal conditions, collagen is synthesized in small amounts. 8 In the only published research article that utilized an in vitro model to study HD exposure, Ekwueme et al. 17 reported that HD causes a population of tenocytes to reduce mRNA expression of type I and III collagen at 6 hours; however, the team did not investigate the amount of collagen produced at later time points. In addition, exposure to HD led a population of tenocytes to reduce their overall metabolic activity 6 and 12 hours after treatment administration. However, the aggregate metabolic activity of these cells returned to baseline control levels by hour 24. Ekwueme et al. 17 interpreted their results as supporting Banks’ proposal that HD kills a small number of cells local to the injection and that these dying cells release proteins that initiate a wound healing cascade leading to cartilage regeneration. Other studies of the effect of hypertonic solutions on chondrocytes in the literature have yielded mixed results. For example, a study of a hypertonic solution commonly used in magnetic resonance imaging suggests the solution could lead to cell death in situations associated with impact. 18 In contrast, a study of tissue engineered cartilage cultured in high glucose conditions indicated that these solutions activate chondrocytes to proliferate and increase ECM synthesis. 19
The objectives of this in vitro study were twofold: to identify an HD concentration that stimulates chondrogenic cells to increase metabolic activity and to determine if this concentration induces chondrogenic cells to deposit more collagen and increase proliferation. Our first set of experiments identified a concentration of HD that stimulates greater chondrogenic cell metabolic activity. To facilitate a comparison of in vitro research to clinical reports and thereby increase translational potential, we standardized both in vitro and clinical concentrations using a molarity scale. Our second set of experiments involved live microscopic imaging of HD-stimulated chondrogenic cells to collect information on cellular outcomes of greater clinical relevance. The primary outcome was the amount of collagen deposited by chondrogenic cells, and the secondary outcome was the degree of chondrogenic cell proliferation. These microscopic imaging experiments utilized phosphate-buffered saline (PBS) as a negative control, which is similar to the use of a saline control in clinical studies. Additionally, we included a mannitol control arm to more clearly understand the mechanism of action by which HD stimulates collagen deposition and cell proliferation. Mannitol, like dextrose, is an osmotic agent; however, mannitol cannot be used as an energy source by chondrogenic cells. We found that HD treatment increased metabolic activity, collagen deposition, and proliferation while decreasing cell size. Based on these results, we developed a novel hypothesis for the mechanism of action through which HD injections induce cartilage regeneration. Specifically, we hypothesize that HD creates a hypertonic environment that initially moves water out of cells osmotically, temporarily decreasing their metabolism, followed by cellular uptake and metabolism of dextrose to ultimately increase collagen deposition and increase cell proliferation to replenish cartilage.
Materials and Methods
Defining an Initial HD Concentration Scale for Empirical Testing
As the first step in identifying a concentration of HD that promotes the greatest metabolic activity in chondrogenic cells, an appropriate range of HD concentrations was selected based on the literature. All relevant basic science and clinical studies were identified through a systematic PubMed search.17,20 -27 Data from these published studies were used to develop a wide-ranging concentration scale. In addition to a baseline control (4 mM glucose with no extra dextrose added), the concentrations initially selected for testing were 25 mM, 50 mM, 100 mM, 200 mM, and 400 mM.
Optimizing an Assay for Assessing Metabolic Activity (PrestoBlue)
Ekwueme et al. 17 used a PrestoBlue assay (Life Technologies). 28 as a measure of metabolic activity in their in vitro study on HD injections. The Life Technologies protocol for optimizing the PrestoBlue assay was followed by replacing the culture medium with a solution composed of 10% PrestoBlue and 90% medium. Then, the samples were incubated for varying periods of time, and 20 minutes was established as the incubation time that led to the most linear correlation between cell number and absorbance (adjusted R2 = 0.9612). Then, a second experiment was conducted to determine a time period for posttreatment incubation. Following treatment, the experiment investigated varying incubation periods from the point of seeding to the point of measuring cell metabolic activity. Of the incubation periods tested, 4 hours was found to produce the greatest differences in cell metabolic activity across treatment concentrations.
HD Concentration Experiments to Identify an HD Concentration Stimulating Greater Chondrogenic Cell Metabolic Activity
Two HD concentration experiments were conducted, each with nearly the same multistep process. In the first of the 2 experiments, the first step was to seed 240,000 cells per well into a 6-well plate. After the cells adhered to the well surface, the second step was to treat each of the 6 wells with the 5 specific HD concentrations (listed above) and a control well with the baseline concentration of HD for 24 hours. According to the published literature,16,29 varying concentrations of HD induce different amounts of cell death. Therefore, 24 hours of treatment would lead to unequal cell counts in each well. This potential imbalance was addressed by the third step. Cells were extracted from each well of the 6-well plate and placed into a corresponding tube. From each of the 6 tubes, 4 aliquots of 9,600 cells each were removed. Each aliquot was seeded into a well of a 96-well plate (with normoglycemic 4 mM growth medium). In the first HD concentration experiment, 24 wells were seeded in total (6 different HD concentrations, 4 wells for each concentration). In the fourth step, all cells were incubated for 4 hours. In the fifth step, 20 µL of PrestoBlue was added to each well and the cells were incubated for 20 minutes. In the sixth step, a BioTek Synergy H4 Hybrid microplate reader was used to measure absorbance in each well 5 times. In the seventh step, the metabolic activity of each well was calculated by taking the average of the 5 readings. In the eighth and final step, metabolic activity was measured via the PrestoBlue assay as an indicator of proliferation.
There were 2 differences between the first and second HD concentration experiments. The second HD concentration experiment built on the finding of the first concentration experiment, which revealed that 200 mM led to greater cell metabolic activity than the other tested concentrations. To more thoroughly investigate concentrations near 200 mM, several concentrations were selected for further testing with the final set at 25 mM, 50 mM, 150 mM, 200 mM, 250 mM, 300 mM, and 350 mM. The second difference was that 28 wells were seeded in step 3 (7 different concentrations, 4 wells for each concentration).
Cellular Outcome Experiments to Assess Collagen Deposition, Cell Proliferation, and Cell Size
To study the effects of HD on chondrogenic cell outcomes, especially collagen deposition and proliferation, a series of live-imaging microscopy investigations were conducted. The 250 mM concentration was identified as producing the highest cell metabolic activity in the second HD concentration experiment. This was the focus for the live-imaging investigations conducted on treated cells versus controls during the 24-hour treatment period. In each well of an Ibidi 8-well µ-plate (cat # 80826), 25,000 cells (25% confluency) were seeded and treated for 24 hours. During microscopy, the cells were maintained at 37 °C with 5% CO2 using a TokaiHit incubator. Rather than standardizing conditions across all experiments, the principles of experimental design were utilized to sequentially enhance and calibrate the experimental process. Table 1 provides a brief description of imaging experiments 1 to 4, including such information as the treatment groups, outcomes, and number of observations.
Experimental Design. a
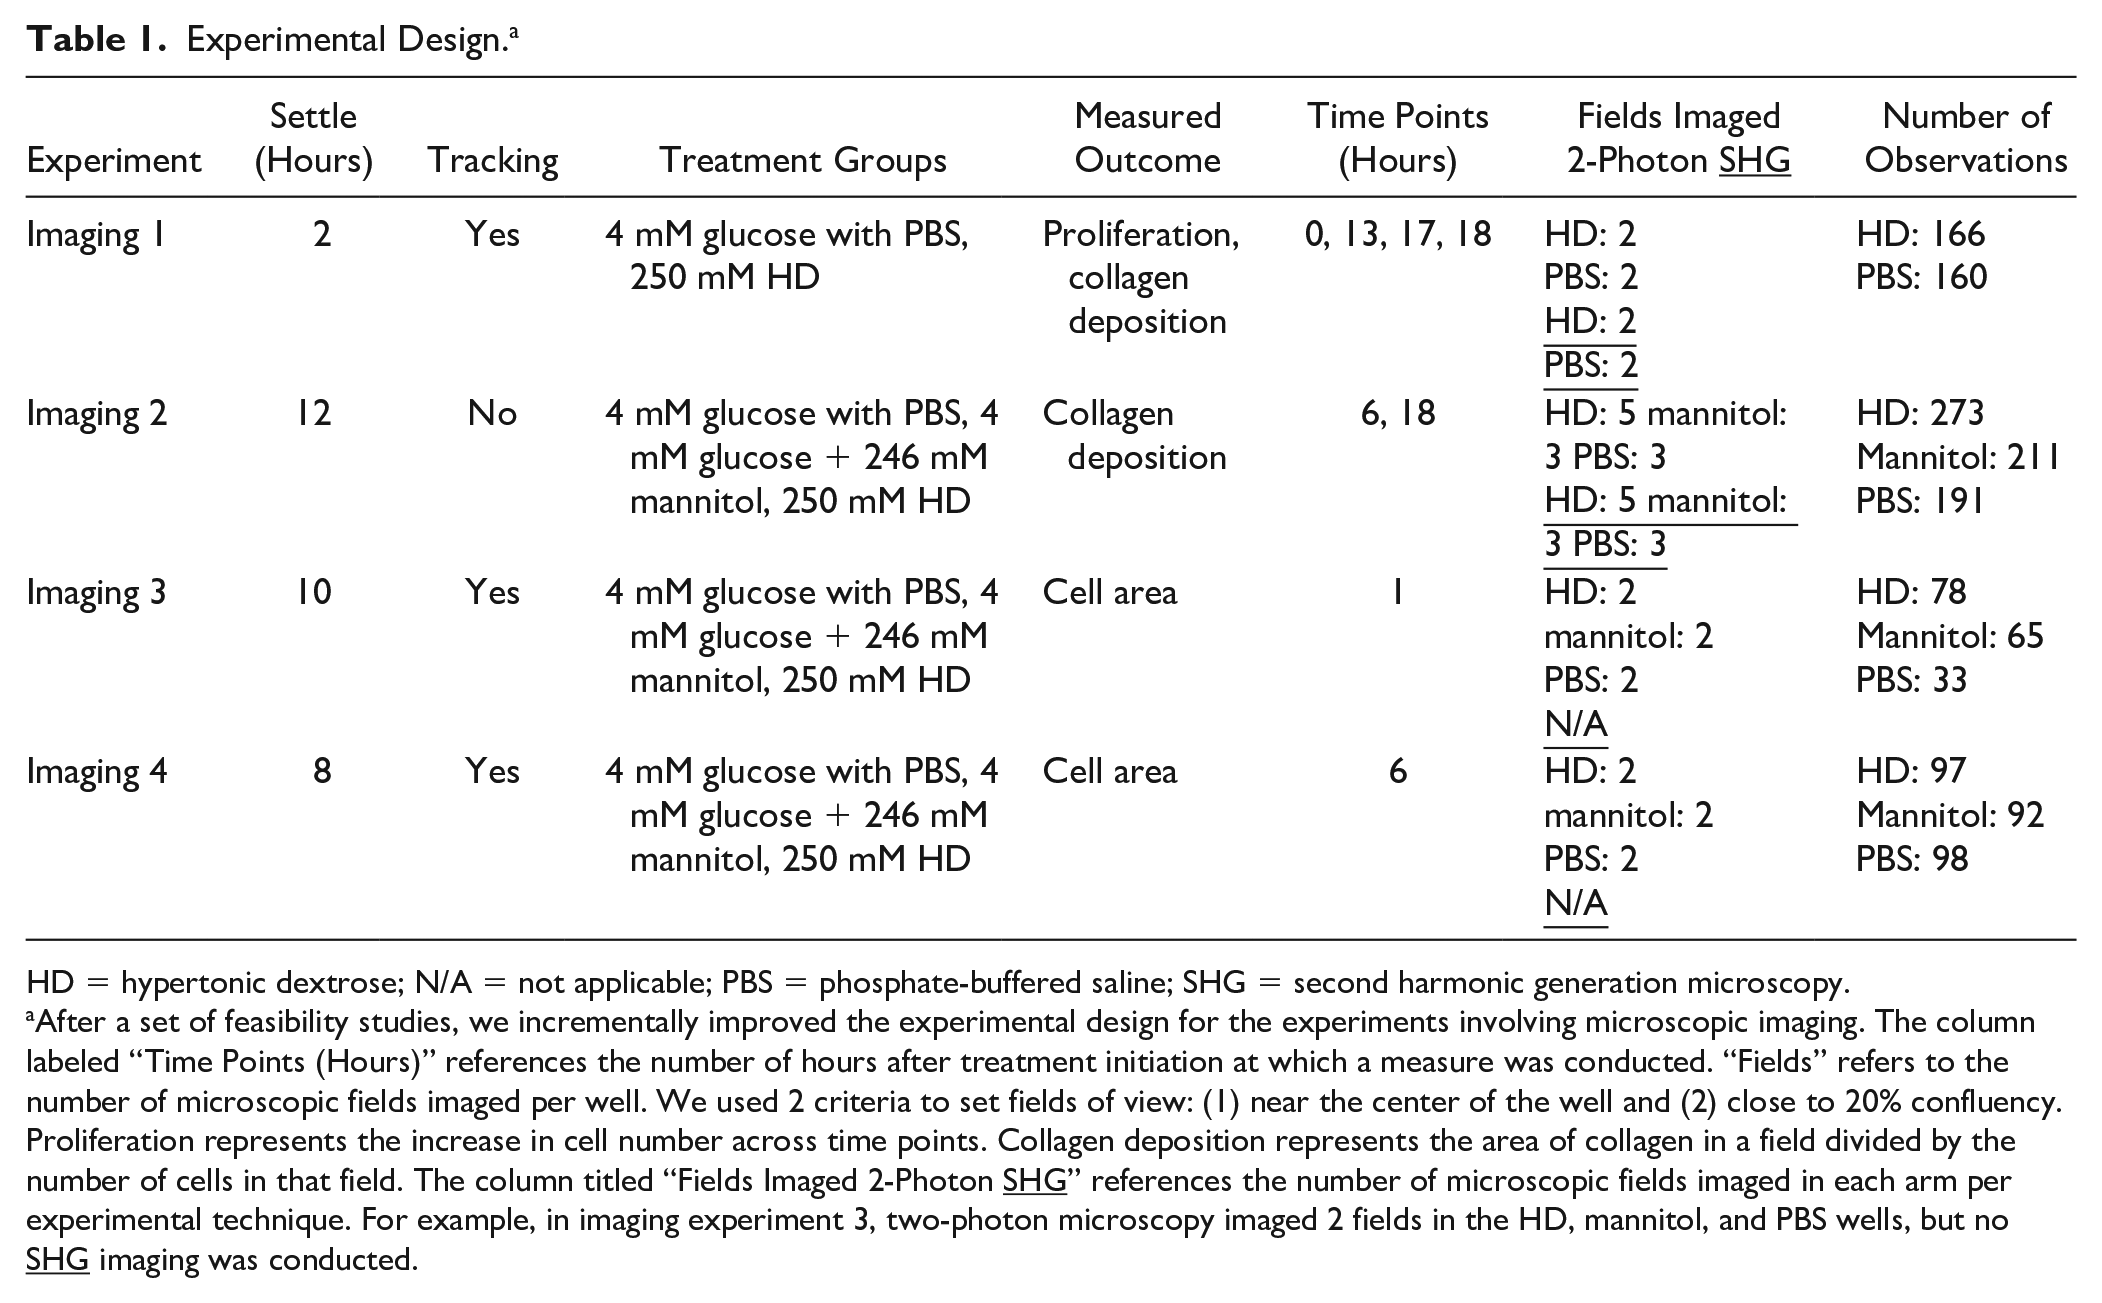
HD = hypertonic dextrose; N/A = not applicable; PBS = phosphate-buffered saline; SHG = second harmonic generation microscopy.
After a set of feasibility studies, we incrementally improved the experimental design for the experiments involving microscopic imaging. The column labeled “Time Points (Hours)” references the number of hours after treatment initiation at which a measure was conducted. “Fields” refers to the number of microscopic fields imaged per well. We used 2 criteria to set fields of view: (1) near the center of the well and (2) close to 20% confluency. Proliferation represents the increase in cell number across time points. Collagen deposition represents the area of collagen in a field divided by the number of cells in that field. The column titled “Fields Imaged 2-Photon SHG” references the number of microscopic fields imaged in each arm per experimental technique. For example, in imaging experiment 3, two-photon microscopy imaged 2 fields in the HD, mannitol, and PBS wells, but no
Live-Imaging Microscopy
A Leica SP8 Falcon multiphoton microscope for time-resolved photon counting was used to conduct the live-imaging microscopy investigations. Two-photon excitation of NADH was performed at 740 nm with a Spectra Physics Insight3X femtosecond pulsed IR laser and photon emission from excited NADH was collected from 425 to 475 nm for the purpose of visualizing cells. 30 SHG was used to visualize collagen deposition through excitation at 880 nm and detection at 436 to 445 nm to isolate the collagen autofluorescence signal. 31
FIJI software (v1.52p) was used to process and quantify images for analysis. The z-stack layers used for analysis were flattened using the sum Z-projection tool for subsequent quantification of collagen deposition, cell counts, and cell area. Average per-cell collagen deposition was calculated to develop a collagen measure that accounted for differences in cell density across microscopic fields. The polygon and freeform tools were used to manually quantify the total area of collagen deposited by cells within a field. These tools were also used to segment cells in the microscopic field to facilitate manual counting of the cells. Proliferation was measured by numerically labeling cells for single-cell quantification for area and cell counts. Mitotic events were tracked over experiment-specific time periods, as defined in Table 1. A mitotic event was counted after complete separation of the daughter cells. The cell area was also measured with the polygon and freeform tools. The cell area was directly proportional to cell volume due to the flat morphology of these cells. Therefore, cell area was treated as a surrogate measure of volume.
Treatment/Control
Treatment solutions were made using clinical grade 50% HD solution in water (m/v, D50, Hospira). In the HD concentration experiments, the effect of HD treatment on cells was compared with the effect of the vehicle (cell culture grade water in medium) control, which had a final glucose concentration of 4 mM. In the cellular outcome experiments, PBS was utilized as the vehicle control given its common usage as a chemically and osmotically neutral control in many in vitro experiments, and its similarity to saline controls in clinical studies. In the cellular outcome experiments, the PBS control wells had a final glucose concentration of 4 mM. A mannitol-treated group was also included in these experiments as a positive control for the effect of hypertonicity. Mannitol is similar to dextrose in structure and molar mass and is also an osmotic irritant that creates a hypertonic environment, similar to HD. Therefore, mannitol at an equivalent concentration was used to treat cells as a hypertonic control. The mannitol control arm had an osmolality identical to that of the 250 mM HD arm, namely, 562 mOsm/kg. In comparison, the PBS control had an osmolality of 318 mOsm/kg.
Cell Line
ATDC5, an immortalized chondrogenic mouse cell line derived from mouse teratocarcinoma, was utilized for in vitro modeling. ATDC5 cells have a doubling time of 16 hours in high-glucose (25 mM) culture conditions. 32 The ATDC5 cell line is commonly used to study cartilage growth. 33
Cell Culture Conditions
The normoglycemic range for mouse plasma is 3.4 to 7 mM. 34 Cells were cultured in Dulbecco’s modified Eagle’s medium (DMEM, cat #11966025)/F12 (with l-glutamine, glucose-free, cat #11765047), 5% fetal bovine serum (FBS), and 1% penicillin/streptomycin, and glucose was added to obtain a final concentration of 4 mM, which is within the normoglycemic range for mice and humans. Cells were maintained either in 100 mm plasma-treated tissue culture dishes or T25 plasma-treated tissue culture flasks. Cultures were incubated at 37 °C with 5% CO2. ATDC5 cells differentiate into nonproliferating chondrocytes at confluency when they completely cover the culture surface. 32 Therefore, to maintain their proliferative state, the ATDC5 cells were passaged prior to reaching 50% coverage of the tissue culture dishes/flasks.
Statistical Analysis
To identify the HD concentration that stimulated the highest amount of metabolic activity, statistical analyses were conducted on a data set that combined the 2 HD concentration experiments. After omitting the 2 lethal dose concentrations (350 and 400 mM), the final included concentrations were 4 mM, 25 mM, 50 mM, 100 mM, 150 mM 200 mM, 250 mM, and 300 mM glucose. As a first step toward combining the data, we utilized experiment-specific mean profile plots which indicated that the first experiment consistently had a higher mean absorbance. Accordingly, we fit a linear model with an indicator variable for experiment and indicator variables for the concentrations. We used the fitted linear model to adjust the absorbance values for the effect of the experiment. Each of the seeded wells in the 96-well plate was considered a unit of analysis. Multiple regression analysis with an indicator variable for each HD treatment level, with 4 mM as the omitted control, was used to identify the HD concentration associated with the highest chondrogenic cell metabolic activity. To further account for the curvilinear nature of the data, a computational biology technique was performed, namely, polynomial regression modeling. Model selection was based on the Akaike information criterion (AIC), Bayesian information criterion (BIC), adjusted R2 value, and significance tests. As a final step in polynomial regression modeling, the preferred polynomial regression model was utilized to compute an HD concentration with the maximum chondrogenic cell metabolic activity on the empirically generated concentration-response curve.
To assess collagen deposition by chondrogenic cells, multiple linear regression was conducted on both imaging experiment 1 and imaging experiment 2 to compare the average amount of collagen across the HD and PBS arms. Imaging experiment 2 additionally includes a mannitol treatment arm as described in Table 1. The regression results are presented in a fold-difference format to account for variation in settle period across experiments. To evaluate cell proliferation, logistic regression was used for comparing the effects of HD and PBS on cell proliferation from treatment initiation to 16 hours after treatment initiation (imaging experiment 1). Multiple linear regression was also used to compare differences in average cell size across the HD, mannitol, and PBS arms (imaging experiment 3 and imaging experiment 4). Individual cells or imaging fields within a well were considered the units of analysis.
Error bars represent 95% confidence intervals for means (multiple regression) and population proportions (logistic regression). In all cases, the level of significance (0.05) and P values refer to statistical tests with a 2-sided probability. Analyses were conducted with the statistical software R (version 4.0.2) and the Windows platform (10, version 1903). R was also used to generate graphics and Adobe Illustrator was used to layer in legends and notations of statistical significance.
Results
Solution of 200 mM HD Treatment Increased Cell Metabolic Activity
To identify an HD metabolic activity with the PrestoBlue assay. We then conducted an indicator variable-based linear model. We found that the highest mean absorbance occurred when chondrogenic cells were treated with 200 mM (adjusted absorbance = 0.0538), followed closely by 250 mM (adjusted absorbance = 0.0526) HD. The difference between the mean adjusted absorbance at 200 mM and 4 mM was statistically significant, suggesting that HD stimulates chondrogenic metabolic activity (P = 0.02; Supplemental Table S1). The difference between the mean adjusted absorbance at 250 mM and 4 mM trended toward statistical significance (P = 0.076). Polynomial regression modeling interpolates the concentration producing the highest average absorbance at approximately 240 mM (Fig. 1). Supplemental Table S2 provides model fit statistics. Supplemental Table S3 provides parameter information for the selected model. These results suggest that HD at a concentration in the range of 200 mM and 260 mM maximizes cell metabolic activity.
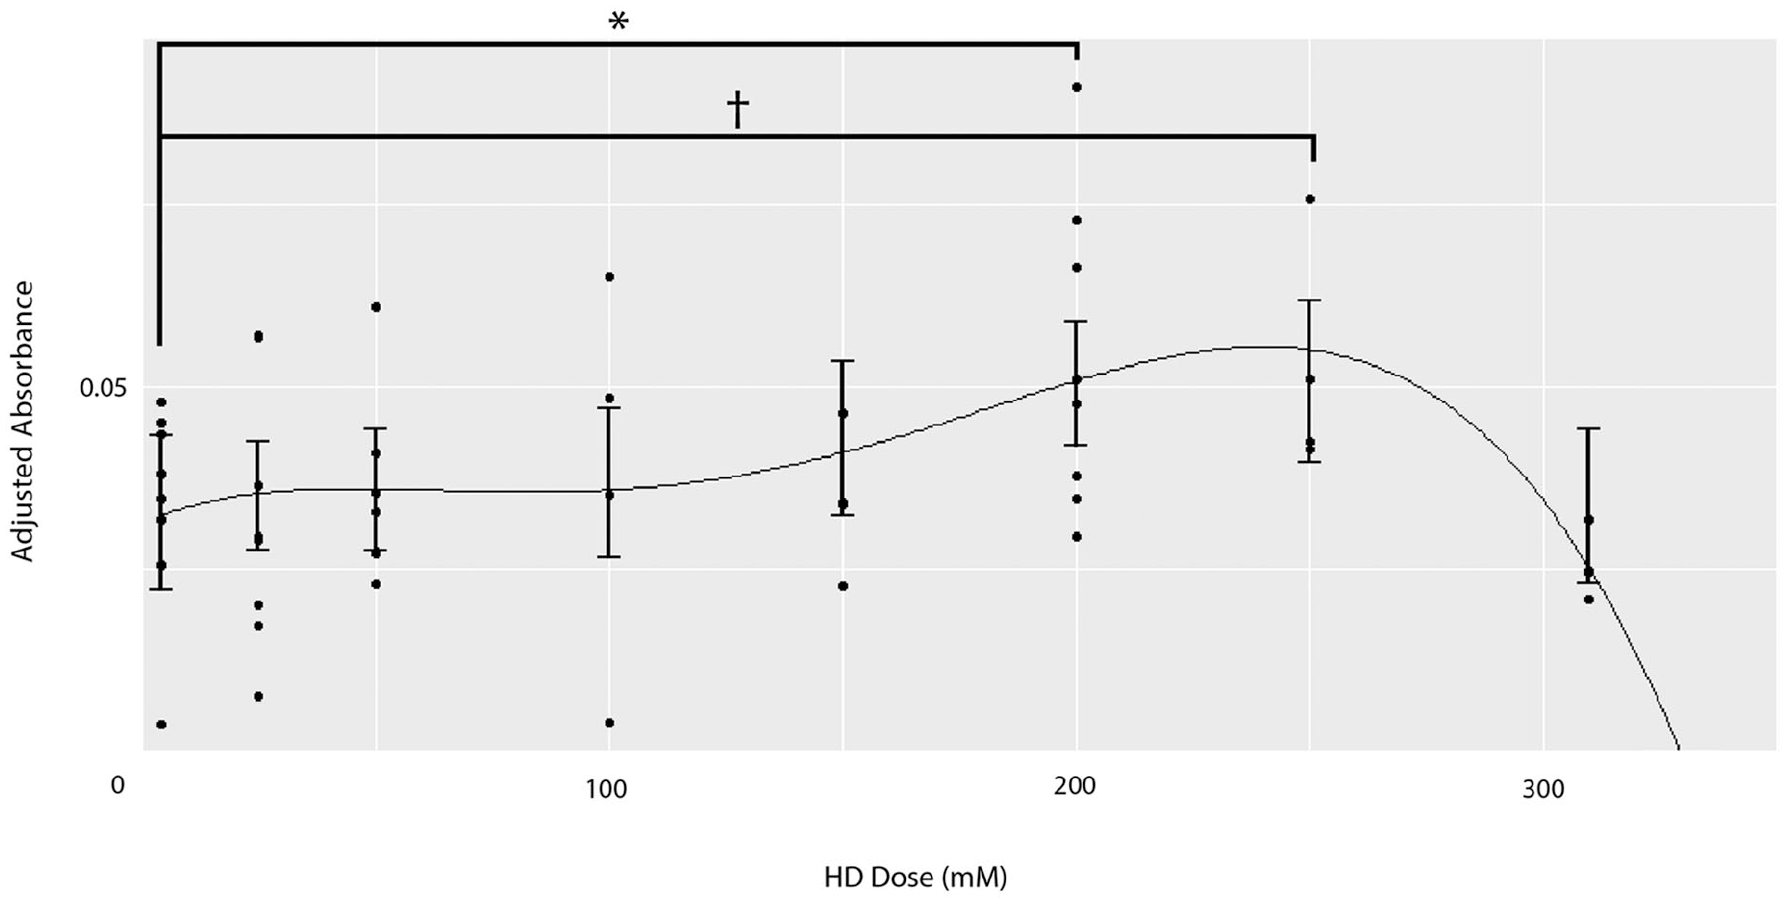
Metabolic activity results suggest that chondrogenic cells treated with 200 to 260 mM hypertonic dextrose (HD) proliferate more than the control (4 mM), as measured using the PrestoBlue metabolic activity assay. A fifth-order polynomial regression model was applied to a data set that combined concentration experiments 1 and 2. The model interpolates that the concentration with the greatest metabolic activity is approximately 240 mM. An indicator-based ordinary least squares regression finds that relative to a baseline control in which cells were treated with 4 mM HD, cells treated with 200 mM HD exhibit greater metabolic activity (P < 0.05), followed closely by 250 mM HD. The difference between the mean adjusted absorbance at 250 mM and 4 mM is trending toward statistical significance (P = 0.076). The biphasic dose-response curve has 2 maxima. The left side of the biphasic curve, centered at approximately 50 mM, encompasses concentrations from previously published in vitro studies. The right side of the biphasic curve, peaking at approximately 240 mM, includes the concentration utilized in the current in vitro study (250 mM) as well as several clinical study concentrations. The right side of the biphasic curve has much greater metabolic activity than the left. Approximate elevated metabolic activity range shaded in gray. NS (nonsignificant) P > 0.10, †P < 0.10, *P < 0.05, **P < 0.01, ***P < 0.001.
To validate the metabolic assay results, we compared the number of cells in the 250 mM HD concentration group to that in controls via hemocytometer counts. These counts indicated that the 250 mM concentration produced a 2.15-fold increase in proliferation compared with the 4 mM control (P < 0.01, Fig. 2). These cell proliferation counts validate, via a direct method, the metabolic assay results. Accordingly, we proceeded to investigate the effect of 250 mM HD on several cellular outcomes.
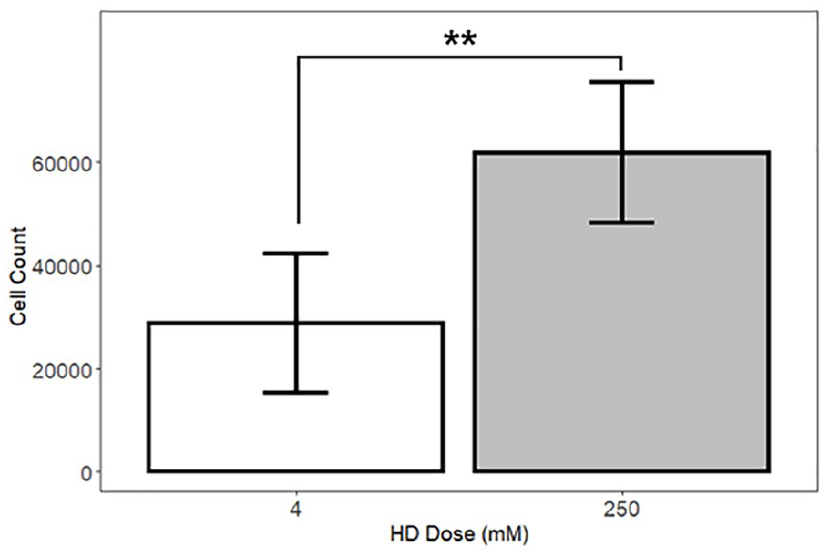
Hemocytometric results indicate that chondrogenic (ATDC5) cells treated with 250 mM hypertonic dextrose (HD) proliferate more than the control cells. A regression model of cell counts, with indicator variables for concentration, shows that wells treated with 250 mM HD had a larger number of cells than wells treated with 4 mM HD at 28 hours after treatment initiation (regression with indicator variables; adjusted R2 = 0.44). To conduct the hemocytometer counts, we collected one sample from each of 8 wells in the 4 mM and 250 mM groups (total n = 16). NS (nonsignificant) P > 0.05, *P < 0.05, **P < 0.01, ***P < 0.001.
To facilitate comparison of the preferred HD concentration in this study with doses utilized in published in vitro and clinical studies, we standardized all concentrations to an mM scale. The scale shows the published in vitro concentrations to be 100 mM or less whereas the published clinical study doses are 223 mM or more. The 250 mM concentration utilized in the present study is much greater than the in vitro concentration of 92 mM used by Ekwueme et al. 17 and is situated between the 223 mM clinical concentration used by Reeves et al. 27 and the 302 mM clinical concentration used by Dumais et al. 24 (Table 2). This standardized mM concentration scale suggests that the preferred HD concentration used in this study has translational relevance.
Current In Vitro Concentrations Are Consistently Smaller Than Clinical Study Doses.
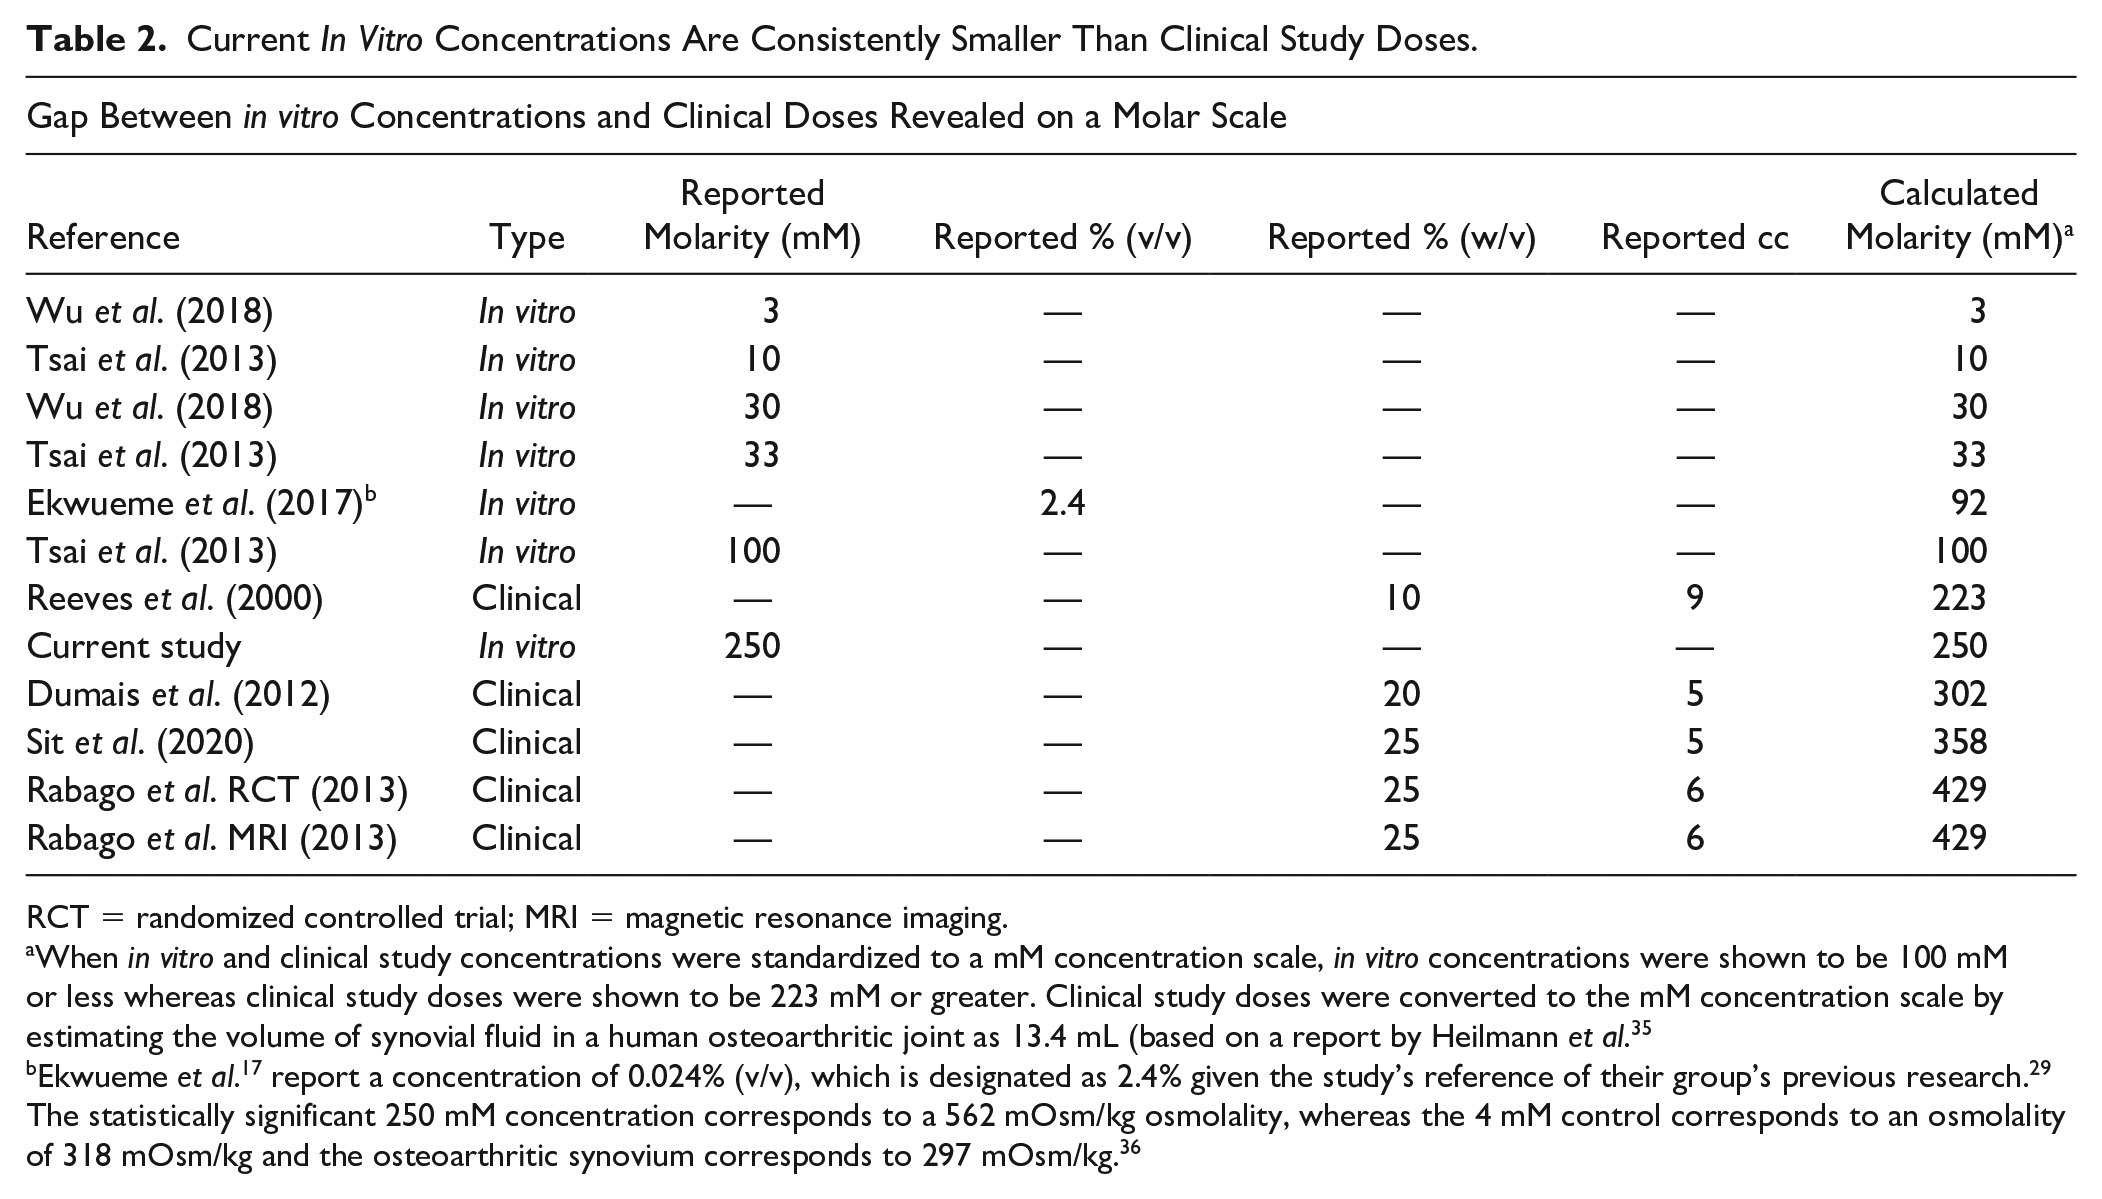
RCT = randomized controlled trial; MRI = magnetic resonance imaging.
When in vitro and clinical study concentrations were standardized to a mM concentration scale, in vitro concentrations were shown to be 100 mM or less whereas clinical study doses were shown to be 223 mM or greater. Clinical study doses were converted to the mM concentration scale by estimating the volume of synovial fluid in a human osteoarthritic joint as 13.4 mL (based on a report by Heilmann et al. 35
Ekwueme et al. 17 report a concentration of 0.024% (v/v), which is designated as 2.4% given the study’s reference of their group’s previous research. 29 The statistically significant 250 mM concentration corresponds to a 562 mOsm/kg osmolality, whereas the 4 mM control corresponds to an osmolality of 318 mOsm/kg and the osteoarthritic synovium corresponds to 297 mOsm/kg. 36
HD-Treated Cells Deposit More Collagen
To determine whether HD stimulates chondrogenic cells to deposit collagen, we analyzed data generated from live-imaging SHG experiments. Figure 3 provides an example of the resulting SHG and corresponding 2-photon excitation images (subsequently quantified and analyzed using FIJI). A multiple regression model of the data from imaging experiment 1 comparing mean collagen deposition across study arms found that, on average, HD-treated chondrogenic cells deposited more collagen than PBS-treated chondrogenic cells (5.17-fold increase, P = 0.03; data not shown). A multiple regression model of the data from imaging experiment 2 found that, on average, each HD-treated chondrogenic cell deposited more collagen than PBS-treated (3.20-fold increase; P < 0.05) or mannitol-treated (2.42-fold increase, P < 0.05) cells (Fig. 4A). The difference in collagen production between PBS-treated and mannitol-treated cells was not significant (P = 0.70). Both imaging experiment 1 and imaging experiment 2 analyses indicate that cells treated with HD deposit more collagen than cells treated with PBS.
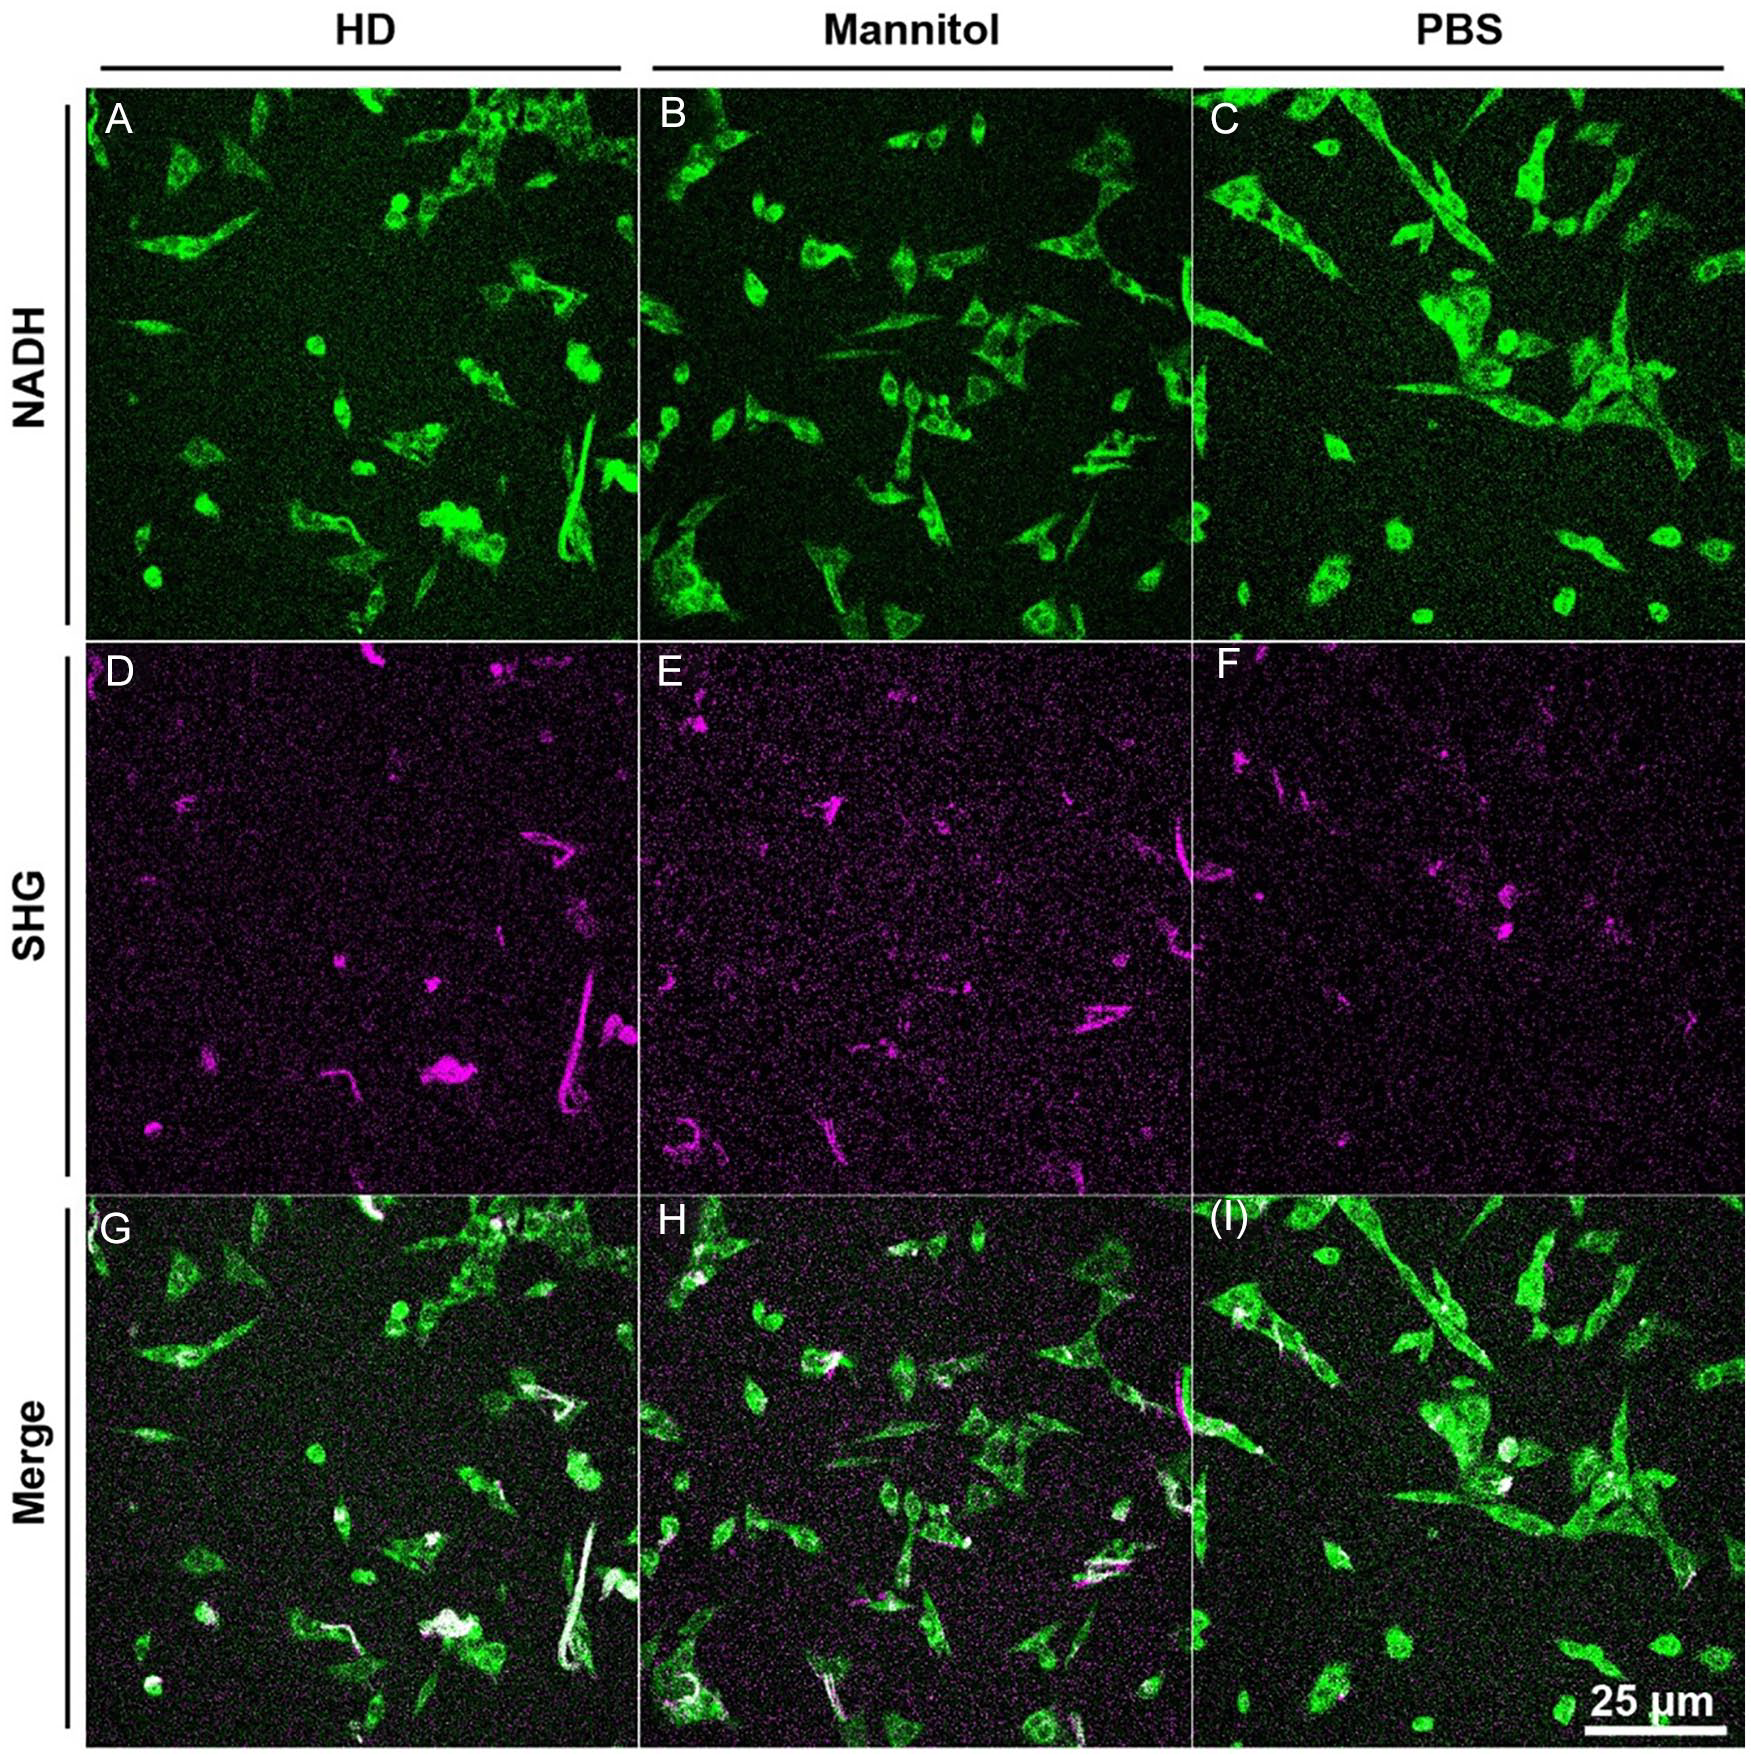
Second harmonic generation microscopy (SHG) and 2-photon excitation microscopy images of hypertonic dextrose (HD)-, mannitol-, and phosphate-buffered saline (PBS)-treated cells. Representative images from experiment 1 are presented in which collagen deposition was normalized to the number of cells in the imaging fields for HD, mannitol, and PBS arms. Results indicated that HD-treated cells deposited more collagen than mannitol- or PBS-treated cells. A-C provide examples of 2-photon excitation microscopy images measuring NADH to visualize cells within a given imaging field. D-F provide the corresponding SHG images to visualize collagen. G-I provide the merged SHG and 2-photon images.
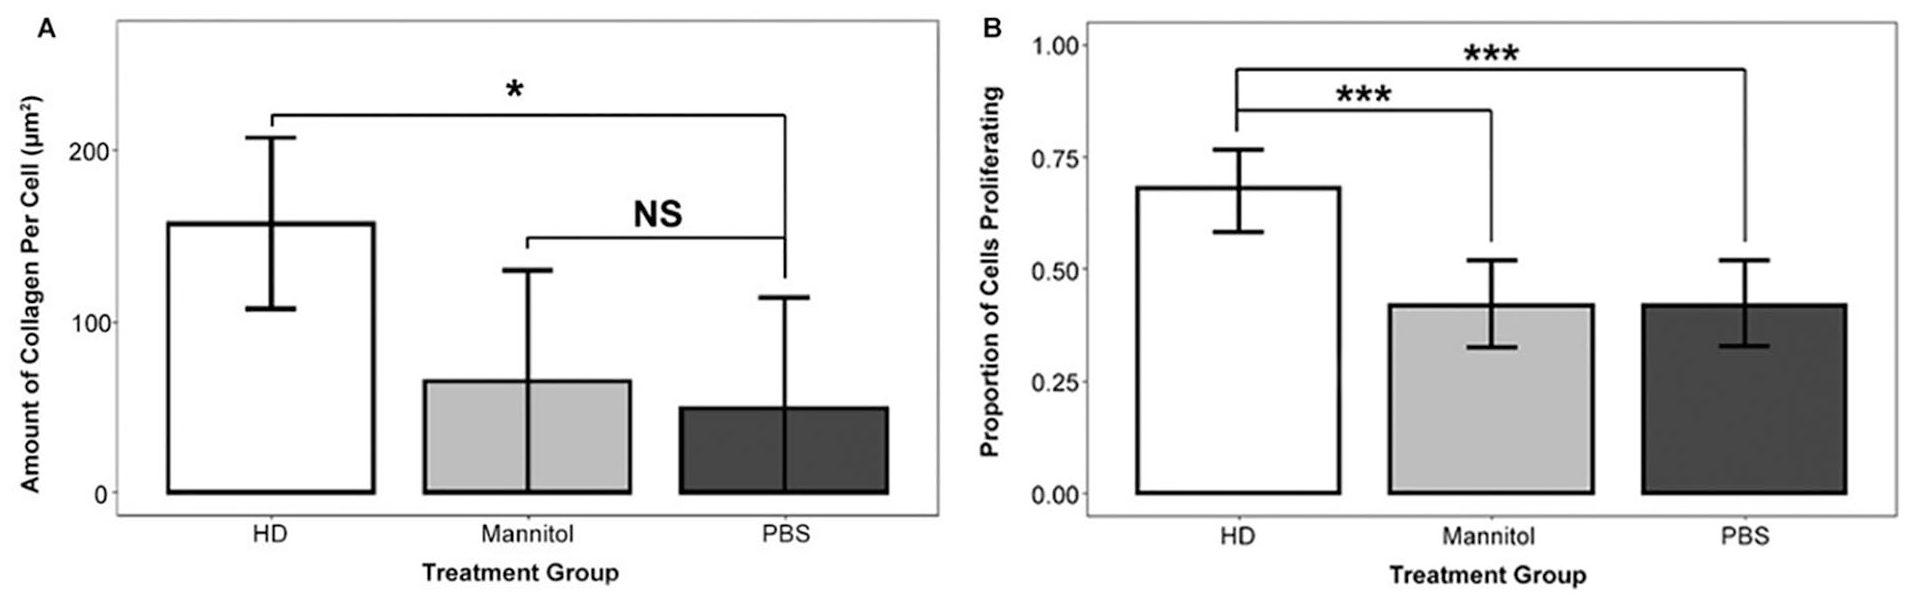
Chondrogenic (ATDC5) cells treated with 250 mM hypertonic dextrose (HD) exhibited increased collagen deposition and proliferation compared with cells in the control arms that were treated with mannitol or phosphate-buffered saline (PBS). (A) Chondrogenic (ATDC5) cells treated with HD deposited more collagen than PBS-treated chondrogenic (ATDC5) cells (adjusted R2 = 0.49). This result is based on a regression model that utilizes indicator variables for treatment type to analyze imaging experiment 1 data. The model’s dependent variable is average collagen deposition per cell in a microscopic field. To generate the raw data for collagen deposition, we used advanced light microscopy (second harmonic generation microscopy [SHG] and 2-photon excitation fluorescence). We manually quantified collagen and counted cells in individual microscopic fields of view at 18 hours after treatment initiation with FIJI image analysis software. The number of microscopic fields per arm was 5 (HD), 3 (mannitol), and 3 (PBS), yielding a total observation count of 11. (B) Chondrogenic (ATDC5) cells treated with HD were more likely to proliferate than chondrogenic (ATDC5) cells treated with mannitol or PBS (P < 0.001; P < 0.001). This result is based on a logistic regression model that utilizes indicator variables for treatment group to analyze imaging experiment 1 data. Figure columns represent the probability of proliferation and error bars represent logistic regression 95% confidence intervals. The number of observations per arm was: 97 (HD), 98 (mannitol), and 92 (PBS). We used FIJI to quantify mitotic events in chondrogenic (ATDC5) cells. NS (nonsignificant) P > 0.05, *P < 0.05, **P < 0.01, ***P < 0.001.
HD-Treated Cells Exhibit Increased Proliferation
To determine whether HD induces chondrogenic cell proliferation, we conducted a logistic regression analysis on data generated from a live-imaging 2-photon excitation microscopy experiment (imaging experiment 1). Figure 4B indicates a significantly greater proportion of HD-treated chondrogenic (ATDC5) cells proliferated (68%) compared with PBS-treated cells (42.4%; P < 0.001) and mannitol-treated cells (41.8%; P < 0.001). There was no significant difference in proliferation between PBS-treated cells and mannitol-treated cells (42.4% vs. 41.8%; P = 0.94).
HD-Treated Cells Exhibit Moderate Shrinkage
To further confirm the hypertonic effect of HD treatment, live-imaging 2-photon experiments were conducted to assess cell shrinkage. As soon as one hour after treatment initiation, cells exhibited shrinkage consistent with a hypertonic environment. An indicator-based ordinary least squares regression model of imaging experiment 3 data revealed that the 78 HD-treated cells had an average area of 0.18 µm2 compared with an average area of 0.21 µm2 among the 33 PBS-treated cells (P < 0.05, Fig. 5A). The HD-treated chondrogenic cells exhibited shrinkage of nearly 15% relative to PBS-treated cells (0.03/0.21). The same model found that the 65 mannitol-treated cells, with an average area of 0.17 µm2 (P < 0.05, Fig. 5A), exhibited shrinkage of nearly 20% compared with the PBS-treated cells (0.04/0.21). The above data show that both the HD- and mannitol-treated cells exhibit hypertonic shrinkage relative to PBS-treated cells.
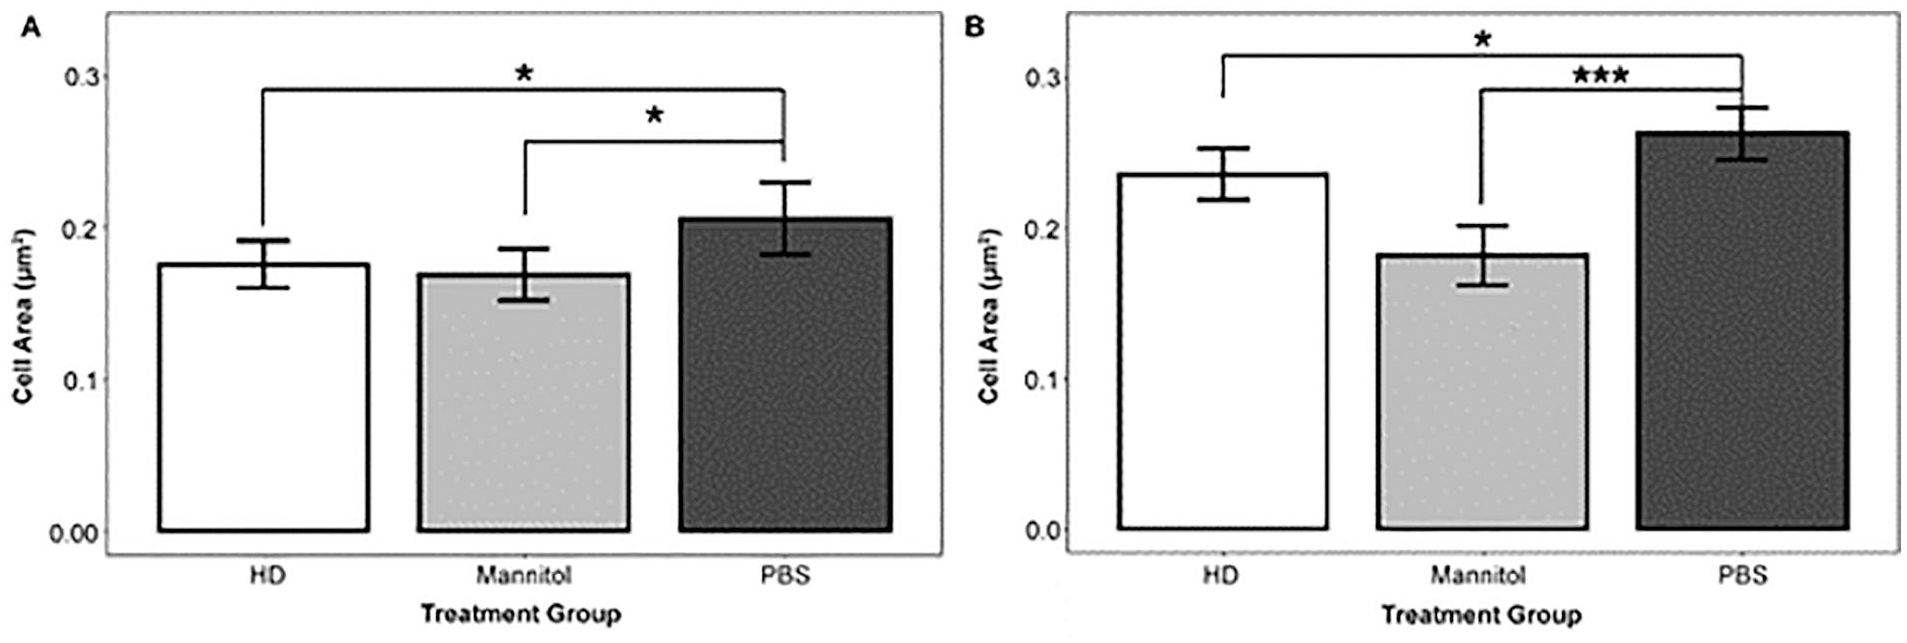
Cells treated with 250 mM hypertonic dextrose (HD) had a smaller area than phosphate-buffered saline (PBS)-treated cells. (A) On average, cells treated with HD were smaller than cells treated with PBS (adjusted R2 = 0.03). This result is based on a regression model with indicator variables for treatment group to analyze cell area from imaging experiment 3. The per-arm observation counts were 78 (HD), 65 (mannitol), and 33 (PBS). (B) HD-treated cells are smaller than PBStreated cells (adjusted R2 = 0.07). This result is based on a regression model that uses indicator variables for treatment group to analyze cell area from imaging experiment 4 data. To generate the raw data for cell area, we used advanced light microscopy (2-photon excitation fluorescence). We manually quantified the cell area using the freeform and polygon tool in FIJI. Images were generated 1 hour after treatment initiation and then 5 hours after treatment, and quantitative analysis was conducted. The per-arm observation counts were 166 (HD), 166 (mannitol), and 160 (PBS). NS (nonsignificant) P > 0.05, *P < 0.05, **P < 0.01, ***P < 0.001.
In a separate experiment (imaging experiment 4), the cell area was quantified 6 hours after treatment initiation. Linear regression showed that the 166 chondrogenic cells treated with HD had, on average, an area of 0.24 µm2, whereas the 160 chondrogenic cells treated with PBS had, on average, an area of 0.26 µm2 (P < 0.03, Fig. 5B, imaging experiment 3). These data indicate that HD-treated cells exhibit shrinkage, on average, of approximately 8% six hours after treatment initiation. The model also found that, on average, the 166 chondrogenic cells treated with mannitol had, on average, an area of 0.18 µm2 (Fig. 5B), indicating a shrinkage of nearly 31%. Taken together, these data indicated that chondrogenic cells exhibited hypertonic shrinkage of nearly 15% one hour after exposure to HD and that this shrinkage decreased to nearly 8% at 6 hours.
Discussion
This study provides the first direct in vitro evidence that HD stimulates chondrogenic cells to deposit collagen and proliferate. We established that, in our experimental conditions, an HD concentration ranging from about 200 mM to 260 mM induces greater metabolic activity in chondrogenic cells than either lower or higher concentrations. Furthermore, this study showed that previously published in vitro research utilized a much lower HD concentration and that 250 mM HD is comparable to doses used in several clinical studies. We then showed direct visual evidence that 250 mM HD increases the rates of chondrogenic collagen deposition and cell proliferation within the first 18 hours after treatment initiation. These in vitro findings suggest that clinical reports of reduced pain may be associated with or the result of HD injections stimulating chondrocytes to regenerate cartilage as suggested by Topol et al. 15
We utilized an experimental design based on a wide-ranging dose-response scale that covered the full range of concentrations reported in the literature. We tested the various levels of HD in multiple experiments with two different outcome measures, and this study identifies that an HD concentration ranging from 200 to 250 mM stimulates chondrogenic cells. A more elaborate experimental design would include more intermediate concentrations, especially 175, 225, and 275 mM, and more direct methods of cell counting. If more intermediate concentrations had been included, then the regression model may have identified a concentration leading to maximal cellular metabolic activity with a greater degree of certainty. Additional methods to increase statistical strength include increasing the number of replicates from quadruplicate to octuplicate and increasing the number of treatment wells per concentration level. 37 The in vitro concentrations of HD tested in prior studies, including the in vitro study by Ekwueme et al., 17 are much lower than clinical doses (Table 2). The study results reported in Figure 1 suggest that the Ekwueme team, 17 who used a 92 mM HD concentration, may have observed greater metabolic activity if they had used a concentration closer to 250 mM. The 250 mM concentration utilized in this study is consistent with the doses reported in the clinical literature (223-429 mM) and was associated with one of the highest rates of metabolic activity on the curve (Fig. 1).
This in vitro research engages the clinically relevant outcome of cartilage regeneration by investigating collagen deposition and proliferation. The study results indicated that HD-treated cells deposited more than 3 times as much collagen as PBS-treated cells. Given the inherent low-turnover conditions of the highly prevalent ECM molecule collagen and that osteoarthritic joints have decreased collagen levels,5,6 the finding that HD stimulates chondrogenic cells to increase collagen deposition has promising implications for increasing the ECM volume in vivo. Osteoarthritis also involves apoptosis of chondrocytes, 2 the unique cellular component of articular cartilage that maintains the ECM. 6 Our study found that HD induces a substantial increase in cell proliferation compared with a PBS control. Together, these in vitro research findings support the clinical hypothesis that HD injections regenerate cartilage. 15
The results of the present study provide an empirical foundation for a novel explanation of a mechanism of action by which HD activates the wound healing cascade. A current explanation is that HD osmotically kills a small number of cells, which activates the wound-healing cascade.11,14,16 The microscopy experiments in this study showed no signs that HD induced cell death. As an alternative explanation, we propose that HD primarily acts through a stimulatory mechanism: HD creates a hypertonic environment that energizes cells to metabolize more glucose and then stimulates them to deposit collagen and proliferate. The utilization of mannitol to create a hypertonic environment similar to the HD environment provided empirical evidence as to whether HD stimulates collagen deposition and proliferation through a metabolic or strictly hypertonic effect. The results, which were consistent across multiple experiments, showed that HD- and mannitol-treated cells exhibited less cell area relative to cells treated with PBS. Furthermore, HD-treated cells exhibited less shrinkage later in the experiment, likely due to the transport and metabolism of glucose reducing the hypertonic effect. These results support the finding of Ekwueme et al. 17 that within 6 hours of treatment initiation, cells exhibit decreased metabolic activity and suggest this decrease is likely due to HD-induced shrinkage. Previous research with other hypertonic agents has also revealed increased metabolism, 38 as well as cartilage regeneration in cartilage tissue scaffolds. 19 Overall, our results provide a basis for our hypothesis, specifically, that HD leads to an initial reduction in cell size followed by an increase in glucose metabolism.
A limitation of this study is that the multiple experiments we report were all conducted on a single mouse chondrogenic (ATDC5) cell line. 33 In light of the growing scientific commitment to reproducing in vitro research, 39 cell lines are attractive because of their greater phenotypic stability than primary cells.40,41 Nonetheless, the study results remain to be confirmed in other cells, such as human chondrocytes (TC28A2). For even greater translational relevance, the results could be confirmed with primary cells in environments that include inflammatory stimuli mimicking those found in an osteoarthritic joint. Our experiments provide an initial understanding of the metabolic effect of HD by showing that mannitol fails to exhibit a regenerative effect through osmotic shock. The 3D culture research of Ylarinne and colleagues, 19 along with the clinical research of Topol and colleagues, 15 suggests that HD induces cartilage regeneration. Consequently, careful investigation is warranted to determine the specific mechanisms by which HD induces chondrocytes to regenerate cartilage in more complex systems. Further investigation of transcriptional changes, including changes in IGF-1 and FGF-2, after HD treatment would help to determine whether HD induces chondrogenic cells to proliferate and deposit collagen through a metabolic or signaling mechanism. 42
Our study is the first to report direct in vitro evidence of HD-induced collagen deposition and chondrogenic cell proliferation. The present study indicates that an HD concentration of 250 mM, which is consistent with concentrations utilized in clinical studies, stimulates chondrogenic cells to increase collagen deposition and to proliferate. The results also indicate that HD, like mannitol, initially induces cell shrinkage. Based on these findings, we hypothesize that HD operates not as a hypertonic irritant but as a metabolic agent with the potential, in the case of OA, to slow disease progression. Further testing of this hypothesis, especially as it pertains to the in vivo regeneration of cartilage and the biology of pain, may therefore lead to refinement of HD-related clinical procedures and improvement of patient-oriented outcomes.
Supplemental Material
sj-pdf-1-car-10.1177_19476035211014572 – Supplemental material for Hypertonic Dextrose Stimulates Chondrogenic Cells to Deposit Collagen and Proliferate
Supplemental material, sj-pdf-1-car-10.1177_19476035211014572 for Hypertonic Dextrose Stimulates Chondrogenic Cells to Deposit Collagen and Proliferate by Elisha Johnston, Yi Kou, Jason Junge, Lin Chen, Andrew Kochan, Michael Johnston and David Rabago in CARTILAGE
Footnotes
Supplemental Material
Acknowledgments and Funding
Authors thank each of the following for their respective contributions: Ruth Megan Elliott, MS, for advice on research design, quality assurance, and repeated close readings of the manuscript. Marisa Isaacson, PhD and John Tyburski, PhD for multiple critical readings of the manuscript and very helpful suggestions. Angelina Altobano for her graphic design assistance. This research was supported by the Translational Imaging Center, USC Office of the Provost. This research was not supported by any funding.
Declaration of Conflicting Interests
The author(s) declared no potential conflicts of interest with respect to the research, authorship, and/or publication of this article.
Ethical Approval
As this study investigates an immortalized murine cell line, ethics approval and consent to participate is not applicable.
References
Supplementary Material
Please find the following supplemental material available below.
For Open Access articles published under a Creative Commons License, all supplemental material carries the same license as the article it is associated with.
For non-Open Access articles published, all supplemental material carries a non-exclusive license, and permission requests for re-use of supplemental material or any part of supplemental material shall be sent directly to the copyright owner as specified in the copyright notice associated with the article.