
Abstract
Objective
The goal of this study was to explore the metabolic syndrome–associated phenotype of osteoarthritis by investigating the cross-sectional associations of glycemic markers and serum lipids with knee cartilage composition and structural abnormalities in middle-aged adults.
Design
Twenty participants between 40 to 70 years of age with Kellgren-Lawrence score 0-1 in at least one knee were recruited at a single center. Knee cartilage composition was assessed using 3.0 T cartilage T2 and T1ρ mapping. Evaluation of structural knee abnormalities was performed using the modified Whole-Organ Magnetic Resonance Imaging Score (WORMS). Linear regression was used to assess the associations of standardized fasting glucose (FG), hemoglobin A1c (HbA1c), insulin, total cholesterol, high-density lipoprotein (HDL), low-density lipoprotein (LDL), non-HDL cholesterol, and triglycerides with cartilage T2 and T1ρ as well as WORMS subscores, adjusting for body mass index.
Results
Higher FG and higher HbA1c were associated with higher WORMS meniscus sum (beta coefficient 1.31 [95% confidence interval (CI): 0.57, 2.05], P = 0.002 per standard deviation [SD] increase in FG; beta coefficient 0.90 [95% CI: 0.07, 1.73], P = 0.035 per SD increase in HbA1c). Also, higher total cholesterol and higher non-HDL cholesterol were associated with higher WORMS cartilage sum (beta coefficient 0.94 [95% CI: 0.01, 1.86], P = 0.048 per SD increase in total cholesterol; beta coefficient 1.05 [95% CI: 0.14, 1.96], P = 0.03 per SD increase in non-HDL cholesterol).
Conclusions
Higher FG and HbA1c were associated with increased meniscal degeneration while higher total and non-HDL cholesterol were associated with increased cartilage degeneration.
Introduction
Osteoarthritis (OA) is a degenerative joint disease that affects approximately 303 million people worldwide 1 and is one of the leading causes of disability in the elderly. 2 Although it is well-established that obesity contributes to cartilage degeneration through mechanical loading, obesity and other metabolic risk factors may also play a role in the systemic regulation of joint tissues, including in the non–weight-bearing joints of obese individuals.3,4 Links between OA and metabolic syndrome (MS) components such as insulin resistance and dyslipidemia have been suggested in numerous studies as these conditions share mechanisms of low-grade inflammation, oxidative stress, and vascular abnormalities.5-7
In observational studies, 2 meta-analyses reported epidemiological associations between diabetes and OA.8,9 Other studies have demonstrated accelerated cartilage degeneration and progression of structural lesions, assessed using magnetic resonance imaging (MRI), in participants with diabetes compared to nondiabetic controls.10,11 Moreover, epidemiological associations of dyslipidemia with OA have been reported as well. 12 Prior studies that have examined the relationship between metabolic biomarkers and OA have often utilized radiographs or joint replacements as outcome measures and therefore could not assess the direct impact on knee internal structures. However, a few studies utilized MRI to assess cartilage volume and lesions of the bone marrow, cartilage, and menisci.13-16 Furthermore, to the best of our knowledge, there has been no study that evaluated the associations of glycemic markers and serum lipids with knee cartilage composition using T2 and T1ρ measurements.
The aim of this cross-sectional study was to investigate the associations of glycemic markers and serum lipids with knee cartilage composition and structural abnormalities, assessed using MRI-based T2 and T1ρ measurements as well as semiquantitative Whole-Organ MRI Scores (WORMS), respectively.
Patients and Methods
Study Participants
Twenty study participants were recruited at a single center using the following inclusion criteria: 40 to 70 years of age, Kellgren-Lawrence (KL) score 0-1 in at least one knee with contralateral knee KL ≤2, no previous diagnosis of an inflammatory arthropathy, no knee pain most days of the month (>15 days over the last month), no history of knee injury or surgery, and no MRI contraindications such as metal implants. Bilateral standing knee radiographs were obtained in the anteroposterior projection and radiographic severity in the tibiofemoral compartment was assessed by an experienced musculoskeletal radiologist (TL) using the KL grading scale. 17 Participants with radiographic KL score ≥3 in either knee were excluded given that previous studies have shown quantitative assessments of cartilage composition may be limited for the evaluation of cartilage degeneration once advanced cartilage loss occurs. 18 Each participant’s age, gender, height, and weight were collected. Weight and height, measured with a calibrated balance beam scale and stadiometer, respectively, were used to calculate body mass index (BMI; weight in kilograms divided by the square of height in meters). Informed consent was obtained from all participants, and the study was approved by the institutional review board of the University of California, San Francisco (UCSF).
Laboratory Markers
Study participants were required to fast for 8 hours overnight prior to blood sample collection. Fasting glucose (FG), hemoglobin A1c (HbA1c), insulin, total cholesterol, high-density lipoprotein (HDL), low-density lipoprotein (LDL), non-HDL cholesterol, and triglycerides were measured. Plasma and serum samples were refrigerated and/or frozen at −20°C as required until assayed. Insulin was determined by chemiluminescent microparticle immunoassay (Abbott Architect i2000). FG was determined by the glucose oxidase method, total cholesterol by the cholesterol esterase/oxidase method, HDL by the direct method with detergent solubilization and cholesterol esterase/oxidase method, and triglycerides by the glycerophosphate oxidase method using a Beckman Coulter LX20 Clinical Chemistry analyzer. LDL was calculated using the Friedewald method. 19 HbA1c was analyzed from whole blood samples immediately after specimen collection using a Bio-Rad Variant II Turbo 2.0 (HPLC-Ion Exchange) system. All analyses were performed at the same laboratory (UCSF Clinical Laboratories China Basin, San Francisco, CA).
MRI Protocol
MR images were acquired of the knee with the lower KL score (or the right knee in case of equal KL scores) using a 3.0 T Discovery MR750w scanner (GE Healthcare, Waukesha, WI) with 16-channel Geometry Embracing Method (GEM) flex medium coil (Neocoil, Pewaukee, WI) within 1 hour of blood sample collection. The imaging protocol included a sagittal T2-weighted fat-saturated 2D fast spin echo (FSE) sequence (echo time [TE] = 68 ms; repetition time [TR] = 4,500 ms; field of view [FOV] = 20 cm; matrix = 320 × 192; slice thickness = 5 mm; echo train length [ETL] = 16; bandwidth = ±31.25 kHz; number of excitations = 4), a sagittal T2-weighted fat-saturated 3D FSE (CUBE) sequence (TE = 20 ms; TR = 1,300 ms; FOV = 14 cm; matrix = 384 × 384; slice thickness = 0.8 mm; ETL = 30; bandwidth = ±50 kHz; number of excitations = 0.5) and sagittal 3D T2 and T1ρ quantification sequences (3D Magnetization-Prepared Angle-Modulated Partitioned k-Space Spoiled Gradient Echo Snapshots [MAPSS]; 20 time of spin lock [TSL] = 0/10/40/80 ms for T1ρ; TE = 0/12.84/25.70/51.39 ms for T2; FOV = 14 cm; matrix = 256 × 128; slice thickness = 4 mm; views per segment = 64; time of recovery = 1.2 s; spin-lock frequency = 500 Hz; Autocalibrating Reconstruction for Cartesian imaging [ARC] phase-direction acceleration factor = 2). 21 Axially and coronally reformatted images were also obtained from the 3D FSE sequence. Both the 3D FSE used for cartilage segmentation as well as the 3D T2 and T1ρ quantification sequences were established and validated in previous studies.21-25
T2 and T1ρ Measurements
After image acquisition, 3D FSE images were rigidly registered and down-sampled along the left/right direction to the first T1ρ-weighted image (TSL = 0). Semi-automated spline-based segmentation was performed using an in-house algorithm written in MATLAB (MathWorks, Natick, MA). 26 Five knee regions (patella, medial and lateral femur, medial and lateral tibia) were segmented using 3D FSE images. Segmentations were carried out on a slice-by-slice basis and spanned all slices that contained the cartilage tissue. The trochlear region was excluded from the analysis due to interfering flow artifacts from the popliteal artery. Furthermore, slices with poor image quality or artifacts limiting segmentation were excluded from the analysis. Piecewise rigid registration was applied along both T2 and T1ρ echoes to account for nonrigid movement of the femur, tibia, and patella with respect to one another. Cartilage T2 and T1ρ maps were generated by fitting T2- and T1ρ-weighted images pixel-by-pixel using a Levenberg-Marquardt mono-exponential fitting algorithm described by the following respective equations:
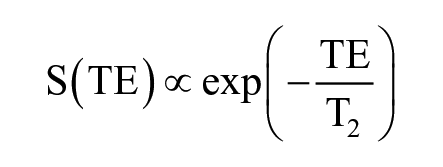
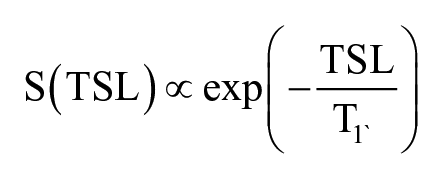
where S is signal intensity, TE is echo time, and TSL is time of spin lock. Mean T2 and T1ρ values were computed for each knee region. Global T2 and global T1ρ values were computed as the mean of all T2 and T1ρ regions, respectively.
To assess inter- and intrareader reproducibilities for T2 and T1ρ measurements, coefficients of variation (CV) were calculated on a percentage basis as the root mean square average. 26 Interreader reproducibility was assessed in 2 randomly selected participants between 2 readers (WA, SF). For intrareader reproducibility, cartilage segmentation was repeated in 2 randomly selected participants with at least 14 days separating the readings.
Knee Morphology
Structural knee abnormalities were graded on the 2D and 3D FSE images and reformatted images using the modified semiquantitative WORMS27-29 by one radiologist (SF, 3 years of experience) under the supervision of a board-certified musculoskeletal radiologist (TL, 26 years of experience). MR images were assessed for the location and severity of cartilage, meniscus, and ligamentous lesions as well as bone marrow edema pattern (BMEP) and effusion. Cartilage lesions (graded 0-6) and BMEP (graded 0-3) were assessed in the same 6 regions (patella, lateral/medial femur, lateral/medial tibia, trochlea). Meniscal lesions (graded 0-4) were scored in 6 regions (anterior, body, and posterior subregions of the medial and lateral menisci). Structural lesions of the cruciate and collateral ligaments, and of the patellar and popliteal tendons were graded from 0 to 4. Finally, effusion (graded 0-3) was scored according to WORMS as previously described. 27 For each type of lesion (cartilage, meniscus, ligament, BMEP), the WORMS sum score was calculated by adding the lesion scores of all knee regions.
Inter- and intrareader reproducibility of WORMS readings have been described and validated by our group in multiple previous studies.11,28,30,31 Intraclass correlation coefficients (ICC) for interreader reproducibility ranged between 0.79 (95% confidence interval [CI]: 0.72, 0.87) and 0.97 (95% CI: 0.95, 0.98) for WORMS cartilage to 0.84 (95% CI: 0.77, 0.91) and 0.97 (95% CI: 0.95, 0.98) for WORMS menisci.11,31 ICCs for intrareader reproducibility ranged between 0.86 (95% CI: 0.80, 0.93) and 0.99 (95% CI: 0.98, 0.99) for WORMS cartilage to 0.87 (95% CI: 0.80, 0.93) and 0.96 (95% CI: 0.94, 0.97) for WORMS menisci.11,31
Statistical Analysis
Statistical analysis was performed using STATA software (Version 15, StataCorp LP, College Station, TX). P values <0.05 were considered as statistically significant. Linear regression models were performed using standardized values for FG, HbA1c, insulin, total cholesterol, HDL, LDL, non-HDL cholesterol, and triglycerides as predictors. Outcomes were limited to global T2, global T1ρ, and WORMS subscores in order to address any potential issues due to multiple comparisons.
To simplify interpretation, we report standardized beta coefficients—the change in outcome per standard deviation (SD) change in the predictors. In addition to standardized predictors, standardized global T2 and standardized global T1ρ outcomes were used to aid interpretation. Standardized values were calculated by subtracting the mean value across all participants from the value for each participant and dividing by the SD. All models were adjusted for BMI.
Results
Participant Characteristics
Participant characteristics are reported in Table 1 . The 20 participants in this study had a mean age of 52.8 (5.2) years and mean BMI of 29.2 (3.6) kg/m2. Seven participants (35%) were female. Of the knees that were scanned, there were 7 knees (35%) with KL0 and 13 knees (65%) with KL1. The mean FG was 108.3 (31.5) mg/dL, mean HbA1c was 6.3% (1.2%), mean insulin was 35.6 (89.1) mU/L, mean total cholesterol was 170.1 (41.5) mg/dL, mean HDL was 48.8 (12.9) mg/dL, mean LDL was 99.6 (32.4) mg/dL, mean non-HDL cholesterol was 121.3 (37.0) mg/dL, and mean triglycerides was 108.9 (69.0) mg/dL. Thirteen of the 20 participants had MS according to the National Cholesterol Education Program Adult Treatment Panel III criteria. 32
Descriptive Characteristics of Participants a .
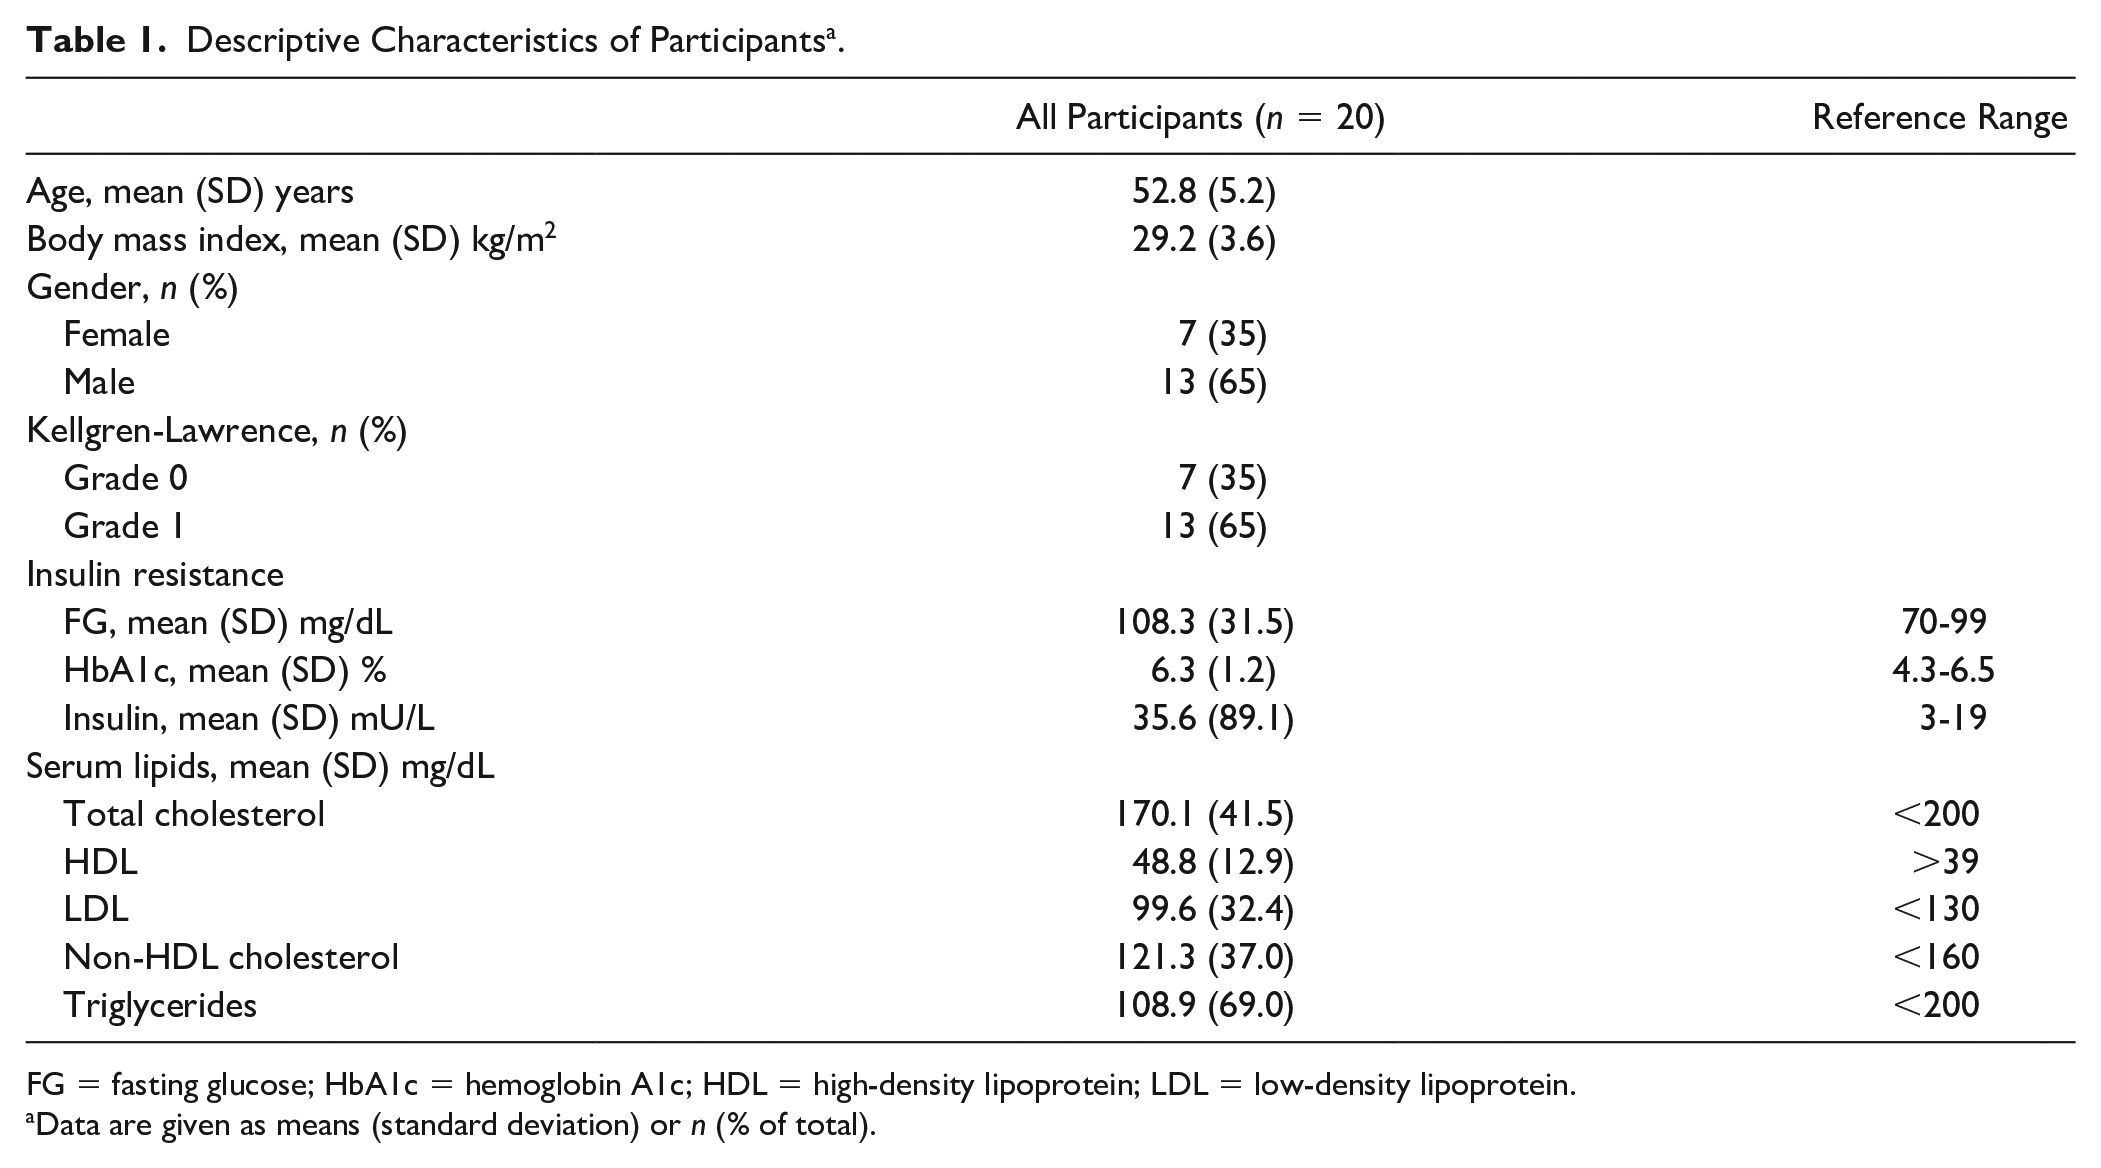
FG = fasting glucose; HbA1c = hemoglobin A1c; HDL = high-density lipoprotein; LDL = low-density lipoprotein.
Data are given as means (standard deviation) or n (% of total).
Imaging characteristics
Imaging characteristics are described in Table 2 . The mean global T2 of all study participants was 30.1 (2.5) ms, and the mean global T1ρ was 40.5 (2.6) ms. In terms of WORMS subscores, there were 7 knees (35%) with cartilage sum 0 to 1 and 13 knees (65%) with cartilage sum ≥2. Nine knees (45%) had meniscus sum 0 to 1 and 11 knees (55%) had meniscus sum ≥2. There were 18 knees (90%) with ligament sum 0 to 1 and 2 knees (10%) with ligament sum ≥2. Fourteen knees (70%) had BMEP sum 0 to 1 and 6 knees (30%) had BMEP sum ≥2. There were 14 knees (70%) with effusion 0 and 6 knees (30%) with effusion 1.
Imaging Characteristics of Participants a .

Data are given as means (standard deviation) or n (% of total).
WORMS = Whole-Organ Magnetic Resonance Imaging Score; sum = summation of WORMS subscores over all regions; BMEP = bone marrow edema pattern.
Glycemic Markers
A 1 SD increase in FG (31.5 mg/dL) was associated with higher WORMS meniscus sum (beta coefficient 1.31 [95% CI: 0.57, 2.05], P = 0.002, adjusted R2 = 0.43) as shown in
Table 3
. Also, a 1 SD increase in HbA1c (1.2%) was associated with higher WORMS meniscus sum (beta coefficient 0.90 [95% CI: 0.07, 1.73], P = 0.04, adjusted R2 = 0.18). R2, adjusted R2, and partial R2 are provided in
Association of Glycemic Markers With Global T2, Global T1ρ, and WORMS Subscores.
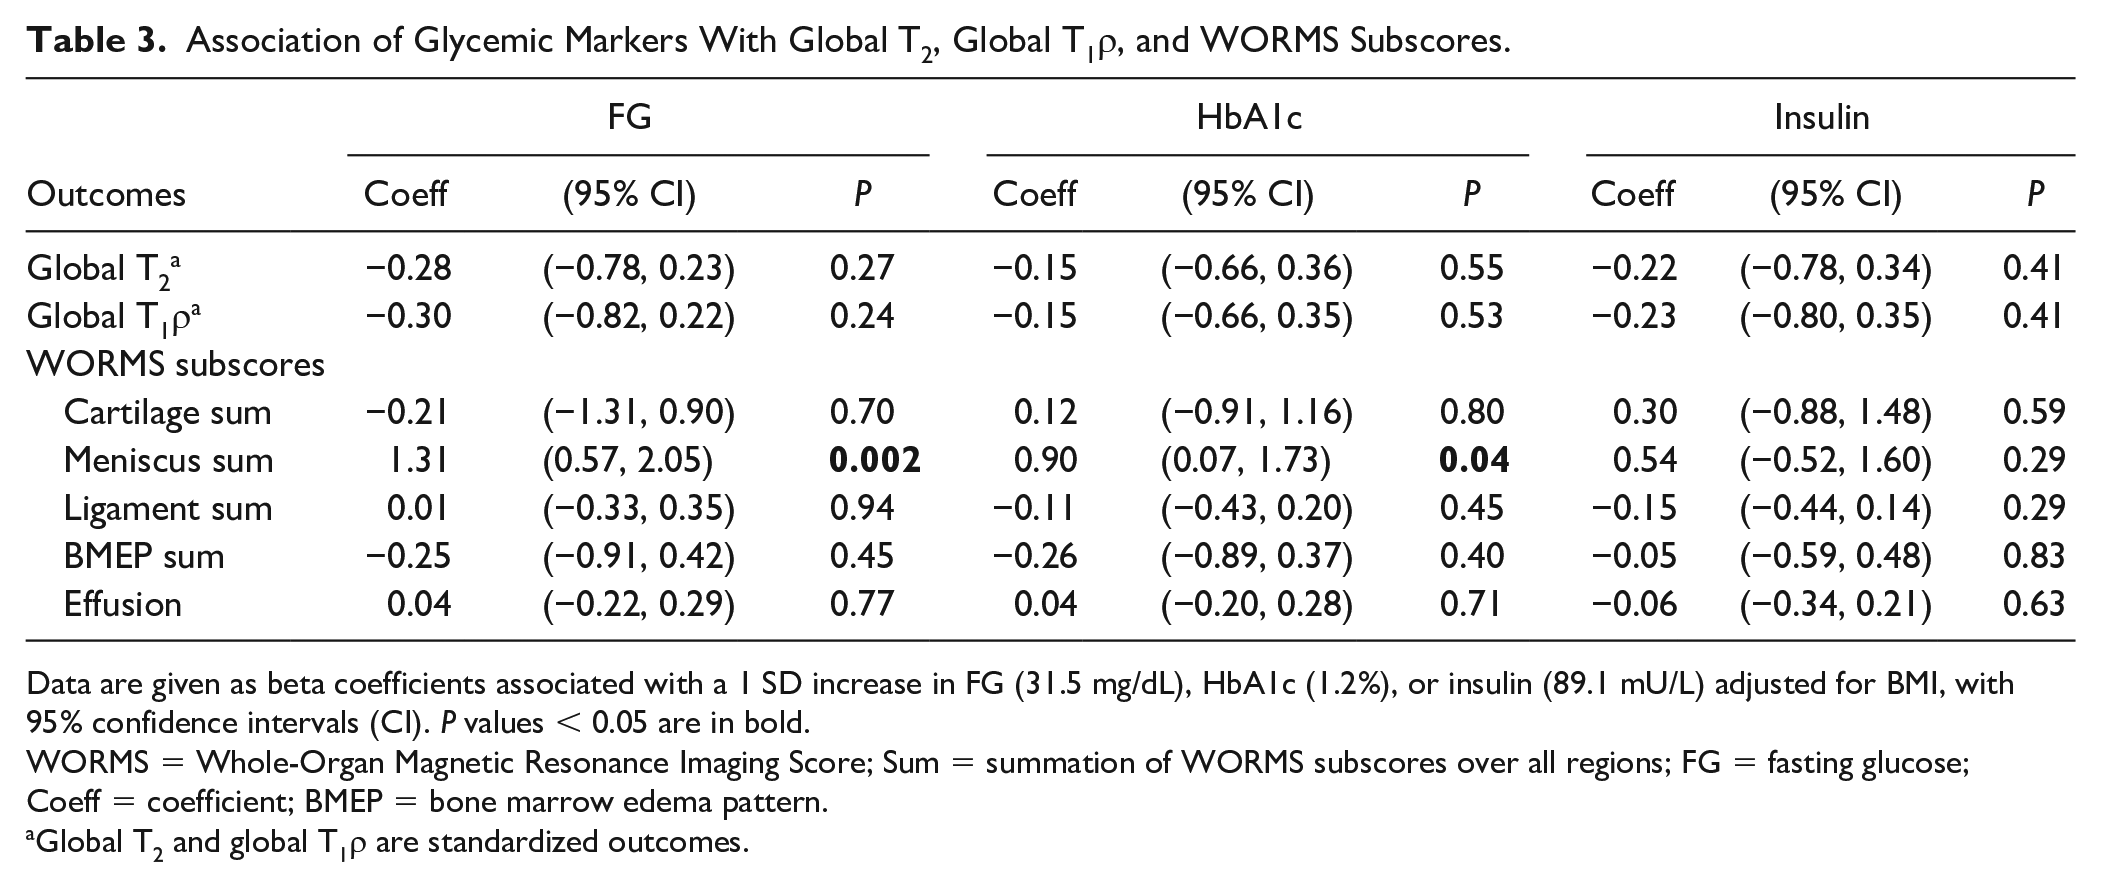
Data are given as beta coefficients associated with a 1 SD increase in FG (31.5 mg/dL), HbA1c (1.2%), or insulin (89.1 mU/L) adjusted for BMI, with 95% confidence intervals (CI). P values < 0.05 are in bold.
WORMS = Whole-Organ Magnetic Resonance Imaging Score; Sum = summation of WORMS subscores over all regions; FG = fasting glucose; Coeff = coefficient; BMEP = bone marrow edema pattern.
Global T2 and global T1ρ are standardized outcomes.
Serum Lipids
As shown in
Table 4
, higher total cholesterol (41.5 mg/dL per SD increase) was associated with higher WORMS cartilage sum (beta coefficient 0.94 [95% CI: 0.01, 1.86], P = 0.048, adjusted R2 = 0.15). Furthermore, higher non-HDL cholesterol (37.0 mg/dL per SD increase) was associated with higher WORMS cartilage sum (beta coefficient 1.05 [95% CI: 0.14, 1.96], P = 0.027, adjusted R2 = 0.20). R2, adjusted R2, and partial R2 are provided in
Association of Serum Lipids With Global T2, Global T1ρ, and WORMS Subscores a .
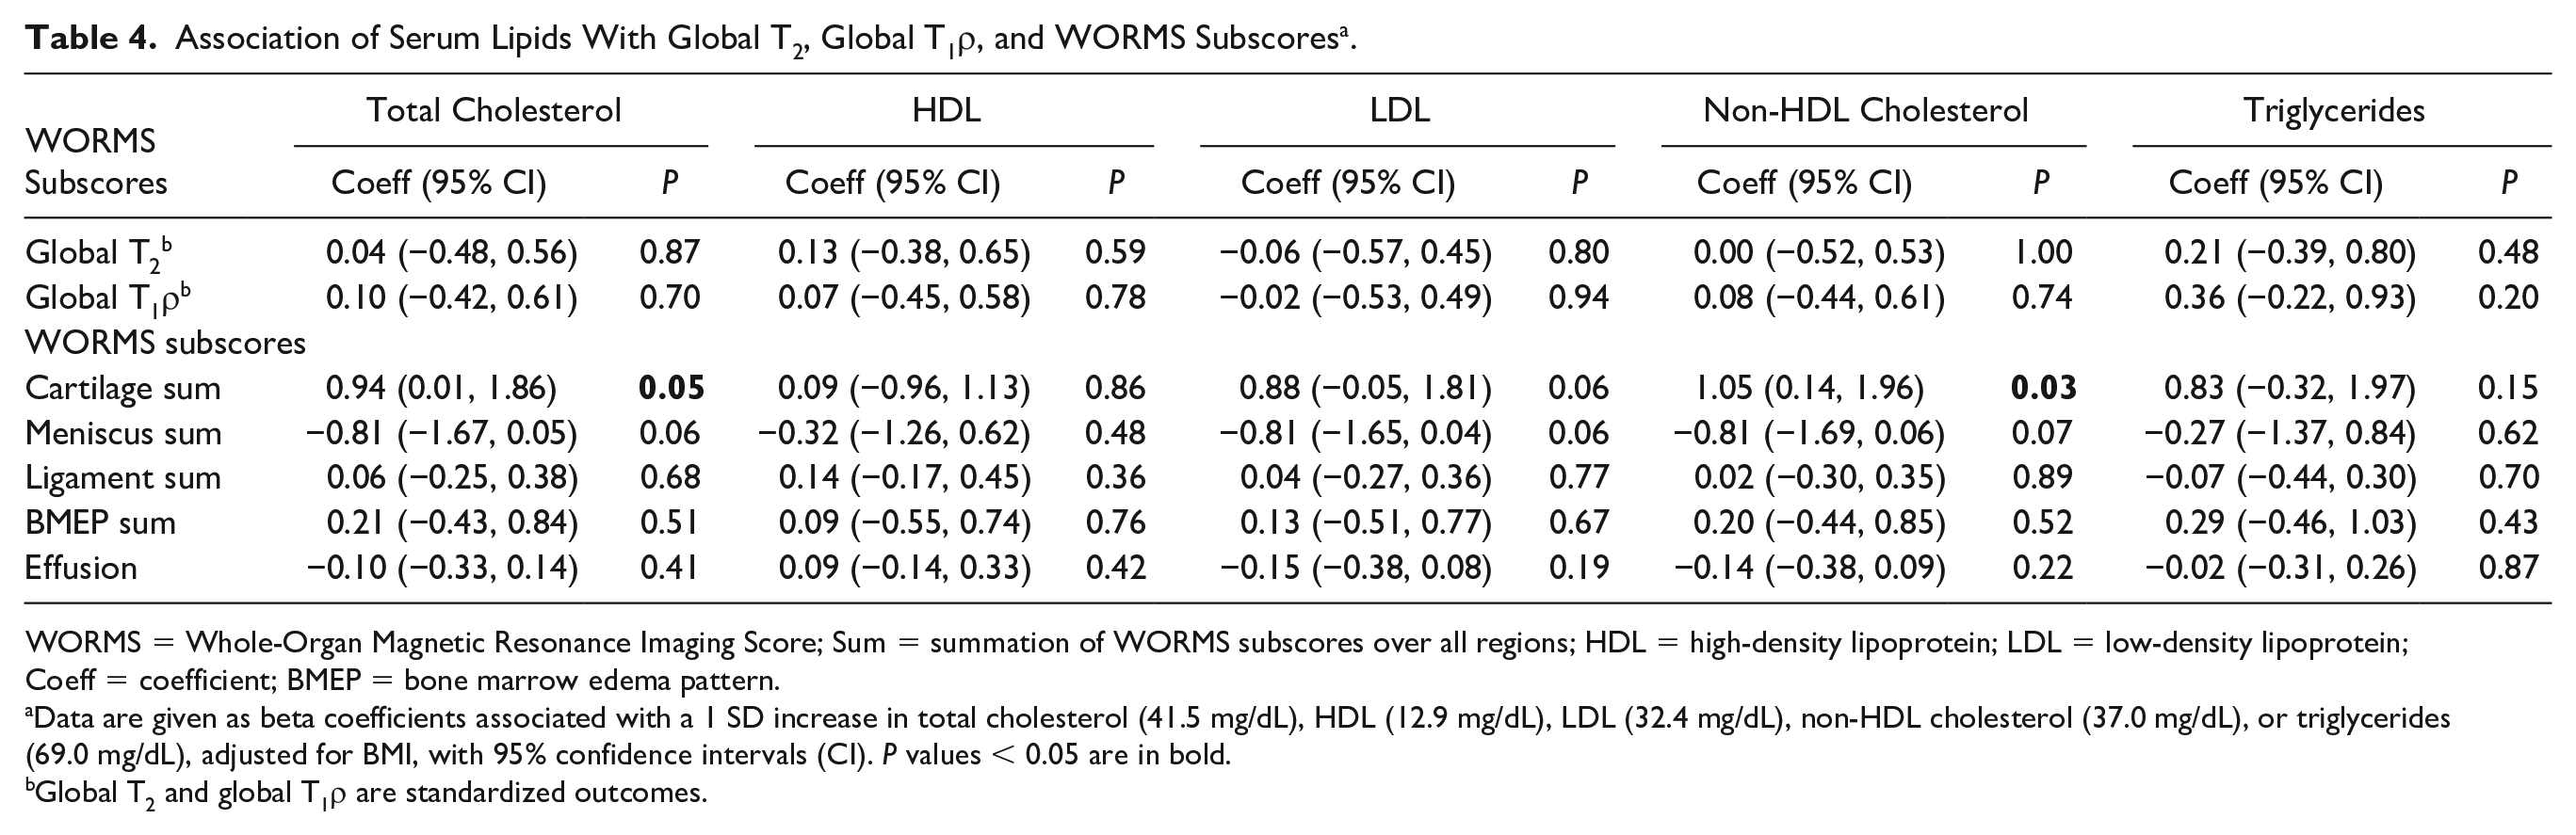
WORMS = Whole-Organ Magnetic Resonance Imaging Score; Sum = summation of WORMS subscores over all regions; HDL = high-density lipoprotein; LDL = low-density lipoprotein; Coeff = coefficient; BMEP = bone marrow edema pattern.
Data are given as beta coefficients associated with a 1 SD increase in total cholesterol (41.5 mg/dL), HDL (12.9 mg/dL), LDL (32.4 mg/dL), non-HDL cholesterol (37.0 mg/dL), or triglycerides (69.0 mg/dL), adjusted for BMI, with 95% confidence intervals (CI). P values < 0.05 are in bold.
Global T2 and global T1ρ are standardized outcomes.
Reproducibility
The interreader reproducibility CVs for mean T2 ranged from 0.59% in the medial femur to 3.62% in the lateral tibia with an overall average of 1.54% while intrareader reproducibility CVs for mean T2 ranged from 0.11% in the medial femur to 3.12% in the medial tibia with an overall average of 1.44%. For T1ρ, the interreader reproducibility CVs ranged from 0.27% in the medial femur to 4.11% in the lateral tibia with an overall average of 1.21% while intrareader reproducibility CVs ranged from 0.15% in the medial femur to 2.98% in the medial tibia with an overall average of 1.34%. Similar inter- and intrareader reproducibility CVs have been published previously.26,33
Discussion
This pilot study investigated the cross-sectional associations of glycemic markers and serum lipids with knee cartilage composition assessed using cartilage T2 and T1ρ measurements and knee structural abnormalities assessed using WORMS. Higher FG and higher HbA1c were associated with increased meniscal degeneration, as evidenced by higher WORMS meniscus sum. Furthermore, higher total cholesterol and higher non-HDL cholesterol were associated with worse cartilage joint morphology.
While some studies have reported associations of diabetes and dyslipidemia with knee OA,8,9,12,34,35 others have found no associations.36,37 Two meta-analyses reported associations of diabetes with OA even when controlling for BMI8,9 while a more recent meta-analysis found no association. 36 In a meta-analysis of 48 studies, Baudart et al. demonstrated an association of dyslipidemia with OA. 12 However, it is unclear whether this association persisted after adjustment for BMI. Garcia-Gil et al. showed in the Chingford cohort that higher HDL was associated with a lower incidence of radiographic hand OA and there was a trend toward higher radiographic OA incidence with higher triglycerides. 34 Other studies have reported an association of hyperlipidemia with incident radiographic hand OA. 35 Many of the studies previously discussed defined OA by clinical criteria, radiographs or arthroplasty in contrast to the present study which assessed cartilage composition and joint structures using more sensitive, MRI-based measures.
Among studies that utilized MRI for outcome measures, some found that elevated HDL levels may confer a protective effect against bone marrow lesions.13,14 Other studies have shown associations of higher total cholesterol and triglycerides with incident bone marrow lesions. 15 Pan et al. demonstrated that low HDL was associated with medial compartment cartilage volume loss and bone marrow lesion size increase. 16 In contrast to these studies, there was no strong evidence for associations of HDL, total cholesterol, and triglycerides with bone marrow edema and of HDL with cartilage defects in the current study. Differences in study populations, focus on early disease, length of follow-up, and grading of structural abnormalities may account for these discrepant results.
Our findings support the hypothesis that diabetes and dyslipidemia may be involved in OA structural pathophysiology. Diabetes has been proposed as an independent contributor to OA incidence and severity potentially via the formation of advanced glycation products and reactive oxygen species, increased catabolic activity of chondrocytes and hyperglycemia-induced inflammation.38,39 In the streptozotocin-induced diabetic rat model, researchers have demonstrated decreased proteoglycan and type 2 collagen content as well as cartilage resistance to the anabolic effects of insulin-like growth factor (IGF)-I.40,41 Furthermore, fibrochrondrocytes in meniscal tissue have the ability to regenerate in the presence of IGF-1. 42 Given that patients with diabetes may have decreased IGF-1 levels 43 and therefore diminished regenerative capacity for meniscal tissue, these patients may be more susceptible to meniscal degeneration. Our finding of an association of higher glycemic markers with increased meniscal degeneration is partially consistent with a study by Neumann et al., which found that participants with diabetes exhibited higher WORMS meniscus compared to diabetes-free controls though this cross-sectional difference was not statistically significant. 11 Furthermore, potential pathophysiological mechanisms underlying the relationship between dyslipidemia and OA include altered lipid metabolism leading to upregulation of pro-inflammatory signaling, 44 vascular pathology and subchondral ischemia, 7 deregulated expression of cholesterol influx genes, 45 and lipid oxidation and deposition in joint tissue.5,6
There are several limitations that should be acknowledged in interpreting this study’s findings. First, this is a cross-sectional pilot study with a limited number of study participants (n = 20). Although there were no strong associations of glycemic markers and serum lipids with cartilage T2 and T1ρ measurements, it may be that we were not able to detect these associations due to insufficient statistical power. Moreover, the exploratory analyses in this pilot study may be helpful to longitudinal studies with larger cohorts that are better suited for making causal inferences regarding associations of diabetes and dyslipidemia with OA. The associations reported in this study were not adjusted for multiple comparisons which may increase the rate of type 1 errors. Furthermore, there are several factors such as diet that may influence the associations described in this study and many were not available to be assessed. In the setting of a limited number of study participants, we focused on statistical adjustment for BMI given that the mechanical loading conferred by obesity is possibly independently associated with OA. 46
Overall, this study showed that higher FG and HbA1c were associated with worse meniscal joint morphology while higher total cholesterol and non-HDL cholesterol were associated with increased cartilage structural abnormalities. However, no significant associations of glycemic markers and serum lipids with knee cartilage composition using T2 and T1ρ measurements could be demonstrated.
Supplemental Material
Supplemental_Table_1 – Supplemental material for Investigating the Association of Metabolic Biomarkers With Knee Cartilage Composition and Structural Abnormalities Using MRI: A Pilot Study
Supplemental material, Supplemental_Table_1 for Investigating the Association of Metabolic Biomarkers With Knee Cartilage Composition and Structural Abnormalities Using MRI: A Pilot Study by Walid Ashmeik, Joe D. Baal, Sarah C. Foreman, Gabby B. Joseph, Emma Bahroos, Misung Han, Roland Krug and Thomas M. Link in CARTILAGE
Footnotes
Acknowledgments and Funding
We would like to thank the staff of the UCSF Imaging Center at China Basin and the UCSF Orthopaedic Institute for their invaluable assistance. The author(s) disclosed receipt of the following financial support for the research, authorship, and/or publication of this article: This study was supported by a seed grant from the UCSF Department of Radiology and Biomedical Imaging, with funding through the Pilot & Feasibility grant mechanism from the Nutrition Obesity Research Center (NORC) at UCSF (NIH Award P30DK098722). This study was also supported by the National Center for Advancing Translational Sciences, NIH, through UCSF-CTSI Grant Number TL1 TR001871.
Declaration of Conflicting Interests
The author(s) declared no potential conflicts of interest with respect to the research, authorship, and/or publication of this article.
Ethical Approval
All procedures performed in this study were in accordance with the 1964 Helsinki Declaration and its later amendments. The study was compliant with the Health Insurance Portability and Accountability Act and was approved by the institutional review board of the University of California, San Francisco (Committee on Human Research, Approval Number 16-18725).
Informed Consent
Written informed consent was obtained from all participants prior to enrollment.
References
Supplementary Material
Please find the following supplemental material available below.
For Open Access articles published under a Creative Commons License, all supplemental material carries the same license as the article it is associated with.
For non-Open Access articles published, all supplemental material carries a non-exclusive license, and permission requests for re-use of supplemental material or any part of supplemental material shall be sent directly to the copyright owner as specified in the copyright notice associated with the article.