
Abstract
Objective
The purposes of this study are to evaluate which growth plate parameters are associated with bone growth in mice and to compare the mouse results with those in humans.
Design
The sagittal sections of the proximal growth plate of the mouse tibia from neonate to young adult stages were subjected to histomorphometric and functional analyses. The radiographic images of tibias of human patients until puberty were analyzed to obtain the tibia length and the proximal growth plate height. It was found that a linear correlation best modeled the relationship between the growth plate variables with the tibia growth rate and length.
Results
In mice, total height, resting zone height, combined height of the proliferation and prehypertrophic zones, proliferation activity, and the total width of tibia growth plate showed high linear correlation with tibia bone length and bone growth rate, but the hypertrophic zone height and the growth plate area did not. In both mice and humans, the total growth plate width of tibia was found to have the strongest correlation with tibia length and growth rate.
Conclusions
The results validated that growth plate total height, the height of the resting zone and cell proliferation activity are appropriate parameters to evaluate the balance between growth plate activity and bone growth in mice, consistent with previous reports. The study also provided a new growth plate parameter candidate, growth plate width for growth plate activity evaluation in both mouse and human tibia bone.
Introduction
The growth plate is composed of chondrocytes, categorized as the resting, proliferation, prehypertrophic and hypertrophic zone based on shape, size, arrangement, and function.1-4 The multiple events in the growth plate that support and control longitudinal bone growth include the supply of new chondrocytes, chondrocyte replication in the proliferation zone, an increase in matrix volume in the prehypertrophic zone, an increase in cell size in the hypertrophic zone, and the calcification of matrix in the late hypertrophic zone.5,6 Morphological and functional changes in the growth plate have been studied and evaluated as characteristics of growth plate arrest during physiological skeletal growth and under pathological skeletal disorders.6-8 Typical parameters examined in the growth plate include proliferation activity, total height of the growth plate, height of the individual zones and cell death.9-12
Growth plate injuries account for 15% to 30% of skeletal injuries in children with an average age of 11 to 14 years.13-15 Injured growth plate may not be fully healed and proceed toward earlier arrest resulting in bone growth arrest, deformity, and limb length discrepancies. Understanding molecular and structure changes during growth plate healing is important for development modality for improvement of growth plate repair. Growth plate function is also impaired by many factors, including genetic mutations of signaling and extracellular matrix molecules, abnormalities of endocrine signals, chronic inflammation, and malnutrition.4,14,16,17 Studying human skeletal disorders and disturbances is commonly done in the animal models including mouse models. Humans and mice share similar bone biological mechanisms that make them an invaluable tool in orthopedics and endocrinology research. Knowledge of the mouse genome and the ease of manipulating genome allows them to mimic human diseases and to study the roles of various signaling pathways in skeletal development and growth.1,2,5,18,19 There are not many reports that evaluate histological and functional variables in the growth plate with bone growth rate from the early postnatal period to maturity in mice. Furthermore, analyzing parameters, location and anatomic position of the growth plate and the time points have been selected differently, which makes it difficult to compare and interpret the results.
In this study, we performed a histomorphometric study of the growth plate in mice from the neonatal to young adult stages focusing on the proximal growth plate of tibia in C57BL/6 mice, one of the most frequently studied growth plates. To define which parameters are closely related with bone growth, we analyzed the linear correlation between various parameters and bone growth. In addition, we examined radiographic images of tibiae of human patients until the puberty stage and analyzed the relationship between height and width of the proximal tibiae growth plate and tibial length.
Materials and Methods
Mice
All animal experiment procedures were approved by the Institutional Animal Care and Use Committee of Osaka University and the University of Maryland, Baltimore.
The proximal tibiae were harvested from female C57BL/6JJcl mice (CLEA Japan, Inc., Tokyo, Japan) at 6 different stages, P6, P13, P21, P28, P42, and P70, fixed with 4% paraformaldehyde for 24 hours at 4°C and decalcified with 10% ethylenediaminetetraacetic acid at pH 7.2 after taking radiographic images. P6, P13/P21, P28/P42, and P70 correspond to infant, juvenile, adolescent, and young adult stages, respectively. The mice received a peritoneal injection of 5-ethynyl-2-deoxyuridine (EdU; 50 mg/kg, Invitrogen Thermo Fisher Scientific (Eugene, OR) 2 hours before being euthanized.
Measurement of Length of Mouse Tibiae
The radiographic images of the lateral view of the fixed tibiae were taken by setting the medial site down using Faxitron X-ray Specimen Radiography System in an automatic exposure control mode. The lateral view was utilized to ensure reproducibility while positioning the mouse limbs for the image acquisition. The images were analyzed using Image J software. Lines were drawn to connect the anterior and posterior edge points of the calcified metaphysis of the proximal and distal growth plate of the tibiae. The distance between the center points of both lines was measured to evaluate the length of the tibia.
Measurement of Length of Human Tibiae
After obtaining institutional review board approval, a retrospective analysis of tibiae radiographs was performed to measure the growth plates in skeletally immature, pediatric patients, 0 to 14 years of age. A minimum of 5 patients per 2-year age range were measured for each gender, for a total of 10 patients per 2-year age range (i.e., 0-2, 2-4, etc.). Normal, lower leg radiographs in the anteroposterior (AP) view were gathered from the institution’s radiograph database (IMPAX 6.5.1.1008) and collected for growth plate measurements. Patients with fully fused or partially closing growth plates were excluded. Plain radiographs with an obvious fracture to either the tibia or fibula or those with a suspicion of fracture according to the radiologist’s note were also excluded.
Once the images were selected, three measurements of the proximal tibial physis were made and recorded for further analysis: proximal tibial physis height, proximal tibial physis width, and tibial length (Supplemental Fig. 1). 20 Physis width (red) was measured as the distance between the 2 widest points of the metaphysis. Tibial length (green) was measured from the inferior aspect of the proximal tibial physis to the superior aspect of the distal tibial physis in the midpoint of the tibia physis red line. Physis height (purple) was measured at the central point of the proximal tibial physis. Following the measurements, the patient’s clinical charts were secondarily reviewed to further exclude any patients who had a history of a tibial growth plate injury.
Histology of Human Growth Plate
The growth plate tissues (4 males and 2 females, 11-14 years) obtained at the epiphysiodesis surgery were fixed with 10% formalin and histologically analyzed after hematoxylin and eosin (H&E) staining. The study is performed under approved institutional review board protocol at the University of Maryland, Baltimore.
Sectioning
The 5 μm sagittal serial sections were analyzed to cover the center portion of tibial medial plateau in the range of 200 to 250 μm. These sections have the fan-shaped meniscus and convexed articular cartilage of proximal tibia and distal femur. The sections were subjected to H&E staining, EdU staining, terminal deoxynucleotidyl transferase-dUTP (TUNEL) staining and immunohistochemistry.
Histomorphometric Analysis
The images of the H&E-stained sections were captured and analyzed using BZX-700 (Keyence, Itasca, IL). The outline of the growth plate was defined as shown in Supplemental Figure 2. The top line is the border between the secondary ossification center and the growth plate (Supplemental Fig. 2A, yellow line). This was defined by the bone and bone marrow overlaying growth plate cartilage. For P6 sections and partial portions of P13 sections, the top line was defined below the cells that had a diameter that was less than 15 µm. The bottom line was defined by the border between the hypertrophic cells and the primary spongiosa (Supplemental Fig. 2A, red line). The side lines were defined by the perichondrium (Supplemental Fig. 2A, blue lines). The border between the growth plate and the lateral part of the epiphyseal cartilage was separated by a 45° angled line from the deepest point (arrow) of Ranvier’s groove (Supplemental Fig. 2A, green lines). The resting zone was defined by the region where the cells were not aligned (Supplemental Fig. 2B, R). It was difficult to differentiate between the proliferation zone and the prehypertrophic zone of the sections of P42 or older ages of mice because of the similarity in cell structure. Therefore, the 2 zones were combined and analyzed (Supplemental Fig. 2B, P), and called the proliferation zone in this study. The hypertrophic zone was defined by the region where the cells represent a diameter more than 15 µm (Supplemental Fig. 2B, H). The morphological definition was confirmed by collagen X expression (Supplemental Fig. 3). The entire growth plate and zone area was measured by the area measurement function of the BZ-X analyzer. The width and height were measured by the XY measurement function of the BZ-Analyzer. The width of the entire growth plate was measured at the level of the top margin of the hypertrophic zone (Supplemental Fig. 2A, black horizontal line). The height of the entire growth plate or each zone was measured at the central point of the growth plate based on the top line of the hypertrophic zone as defined above (Supplemental Fig. 2A, black vertical line). The cell border of the hypertrophic zone was manually defined, and the cell size was measured by the Hybrid Cell Count function of the BZ-X Analyzer. P6 (n = 7), P13 (n = 6), P21 (n = 7), P28 (n = 3), P42 (n = 6), and P70 (n = 8) were used for histomorphometric analysis.
EdU Staining
We measured proliferation activity by detection of EdU that had been injected in mice 2 hours prior to euthanization using the Click-it EdU Imaging Kits Alexa Fluor 488 (Invitrogen Thermo Fisher Scientific, Waltham, MA). After deparaffinization, sections were dried for 30 minutes and then incubated with 0.1% pepsin in 0.02 N HCl solution for 10 minutes at 37°C. Sections were blocked with 3% bovine serum albumin (BSA), pH 7.4, for 30 minutes at room temperature. Sections were incubated with Click-It EdU reaction cocktail for 30 minutes at room temperature. After washing, the slides were incubated with DAPI (4′,6-diamidino-2-phenylindole) solution (0.5 μg/mL, Molecular Probes, Thermo Fisher Scientific) for 5 minutes for nuclear staining. The images of EdU and DAPI staining were observed and captured by the BZX700. The number of EdU and DAPI positive cells in the center part of the growth plate were analyzed using the Hybrid Cell Count feature of the Keyence analyzer software. The ratio of EdU positive cells to DAPI positive cells was calculated. Three fields each section for 3 to 4 independent samples were analyzed and averaged.
TUNEL Assay
TUNEL assay was performed using the Click-iT Plus TUNEL staining kit (Invitrogen Thermo Fisher Scientific) following the manufacture protocol. After staining, the sections were incubated with DAPI. The results of the TUNEL staining were observed and captured in the BZX700. Intensity of the TNUEL staining was measured in the primary spongiosa in 200 μm height below the edge of hypertrophic zone in the middle portion of growth plate (1/3 from both edges were excluded) and normalized by the intensity of the DAPI staining in the corresponding region.
Immunohistochemical and Immunofluorescence Staining
Sections were baked for 1 hour at 60°C and then deparaffinized. Sections were incubated with 10 mM sodium citrate buffer solution, pH 6.0, for 8 minutes at 95°C, incubated in 3% hydrogen peroxide in methanol for 10 minutes at room temperature and blocked with blocking buffer, 5% BSA with 1% goat serum, for 30 minutes at room temperature. They were then incubated with the primary antibody, anti-p21Cip1 (ab188224, 1:150) (Abcam, Cambridge, MA) and anti-p27Kip1 (ab32034, 1:400) overnight at 4°C. The sections were then incubated with biotinylated anti-rabbit igG 1:200 (Vector Laboratories, Burlingame, CA) followed by color detection using ImmPACT DAB peroxidase substrate (Vector Laboratories) and counter staining with methyl green (Alfa Aeser, Haverhill, MA). For collage 10 staining, the sections were incubated with rabbit anti-collagen 10 antibodies (ab 58632, 1:1000, Abcam) after trypsin digestion followed by visualization with goat anti-rabbit IgG, Alexa Fluor 488 (1:200, Thermo Fisher Scientific) and DAPI staining.
Statistical Analysis
The mean and standard deviation (SD) were calculated from 3 to 8 independent values per age. Results were analyzed by ordinary 1-way analysis of variance (ANOVA) and Tukey’s multiple comparison tests using Prism 6 (GraphPad Software, La Jolla, CA). The threshold for significance for all tests were set as P < 0.05. Multiple regression of the histomorphometric results with the tibia growth rate was analyzed using Excel (Microsoft Corp., 2016) and R 3.5.1 (R Core Team, 2018), models integrating multiple factors were compared via ANOVA, finding the linear correlation models to be best.
Results
Analysis of Height, Width and Area of Growth Plate during Skeletal Growth in Mice
To examine changes in structure of growth plate from neonatal to young adult, the growth plate in the proximal tibia was used because it represents a relatively simple and horizontal shape compared to the growth plate of other bones, and the proximal tibia is used frequently for histological studies of the growth plate. Supplemental Figure 2 shows the histology of the proximal tibiae from the neonatal stages (P6 and P13) (Supplemental Fig. 2C and D, respectively), adolescent stages (P21, P28, and P42) (Supplemental Fig. 2E-G, respectively) and young adult stage (P70) (Supplemental Fig. 2H). The total height of the growth plate remained the same until P13 and gradually decreased until P70 ( Fig. 1A ). In contrast, the width increased until P28 and then plateaued ( Fig. 1B ). The total area increased until P21 and then decreased ( Fig. 1C ). The resting zone height gradually decreased after P13 ( Fig. 1D , black circles), and the total height of the proliferation zone decreased until P42 ( Fig. 1D , gray triangles). The height of the hypertrophic zone showed a maximum value at P13 and then decreased ( Fig. 1D , white squares). Enlargement of hypertrophic cells is important to provide longitudinal bone growth space.21-23 To make a procedure easy and simple, we measured the size of chondrocytes in the hypertrophic zone where the cells represent a diameter more than 15 µm. The cell size in the hypertrophic zone was noted to decrease with age ( Fig. 1E ). Lui et al. 9 have reported that height of terminal hypertrophic chondrocytes increased up to 4 weeks of age and then decreased. The discrepancy may be due to difference in definition of hypertrophic chondrocytes since this study focuses on the most enlarged cells in hypertrophic zone.
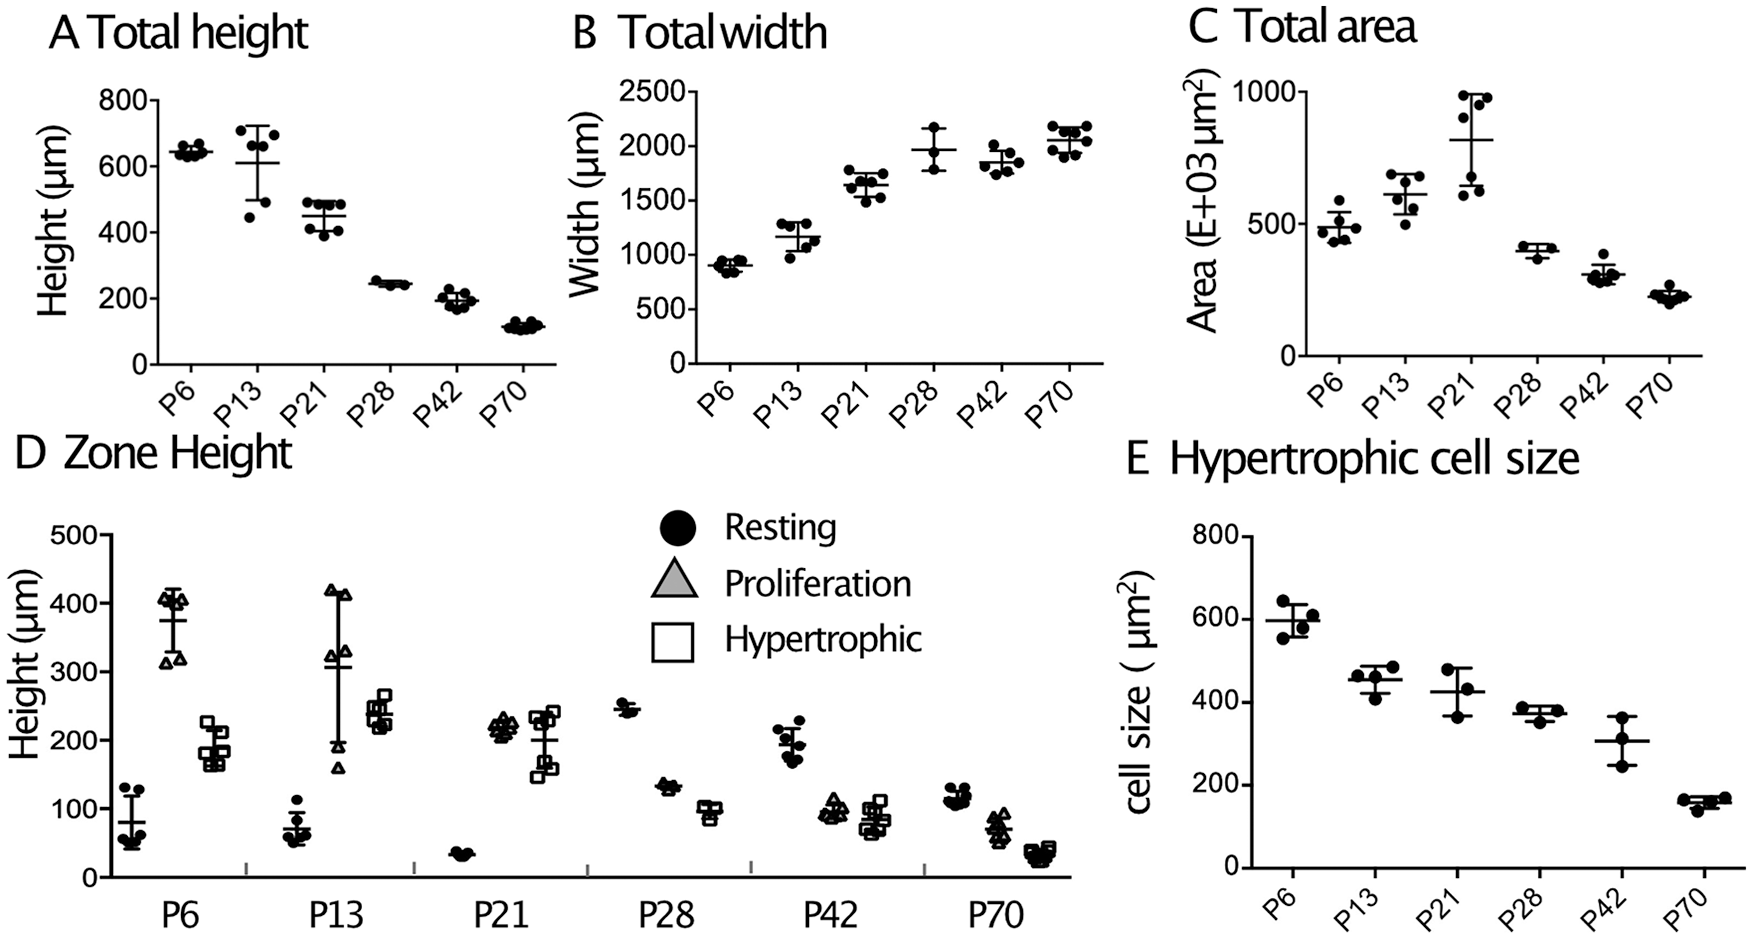
Histomorphometrical analyses of mouse growth plate. The longitudinal sections of proximal tibial growth plate from P6 to P70 C57BL/6J female mice were subjected to histomorphometric analysis. (
Correlation Analysis between Variables of the Growth Plate and Bone Growth in Mice
Figure 2 shows changes in tibia length and growth rate over age in mice. The total bone length reached a plateau at P70 ( Fig. 2A ). The growth rate of each week of age showed a rapid growth phase from P1 to P14 and a steady growth phase from P14 to P42 ( Fig. 2B ), which likely corresponds to birth to 5 years and 5 years to the onset of skeletal maturity in humans, respectively. 24 To evaluate significance of each parameter in bone growth, we preformed multiple regression analysis varying measured growth plate parameters for bone length and bone growth rate, then compared models via ANOVA. We found the linear correlation relating growth plate height and growth plate width best to represent the relationship between the growth plate variables and the total bone length or bone growth rate, respectively. Table 1 shows the R2 values and corresponding P for the linear correlation. The total growth plate height, the height of the resting zone and proliferation zone and hypertrophic cell size showed strong positive and negative correlation with the bone growth rate and bone length, respectively. In contrast, the total growth plate width showed strong negative and positive correlation with the bone growth rate and bone length, respectively. The results suggest that the total height and width of the growth plate are reliable histomorphometric parameters to correlate bone growth ( Fig. 2C-F ).
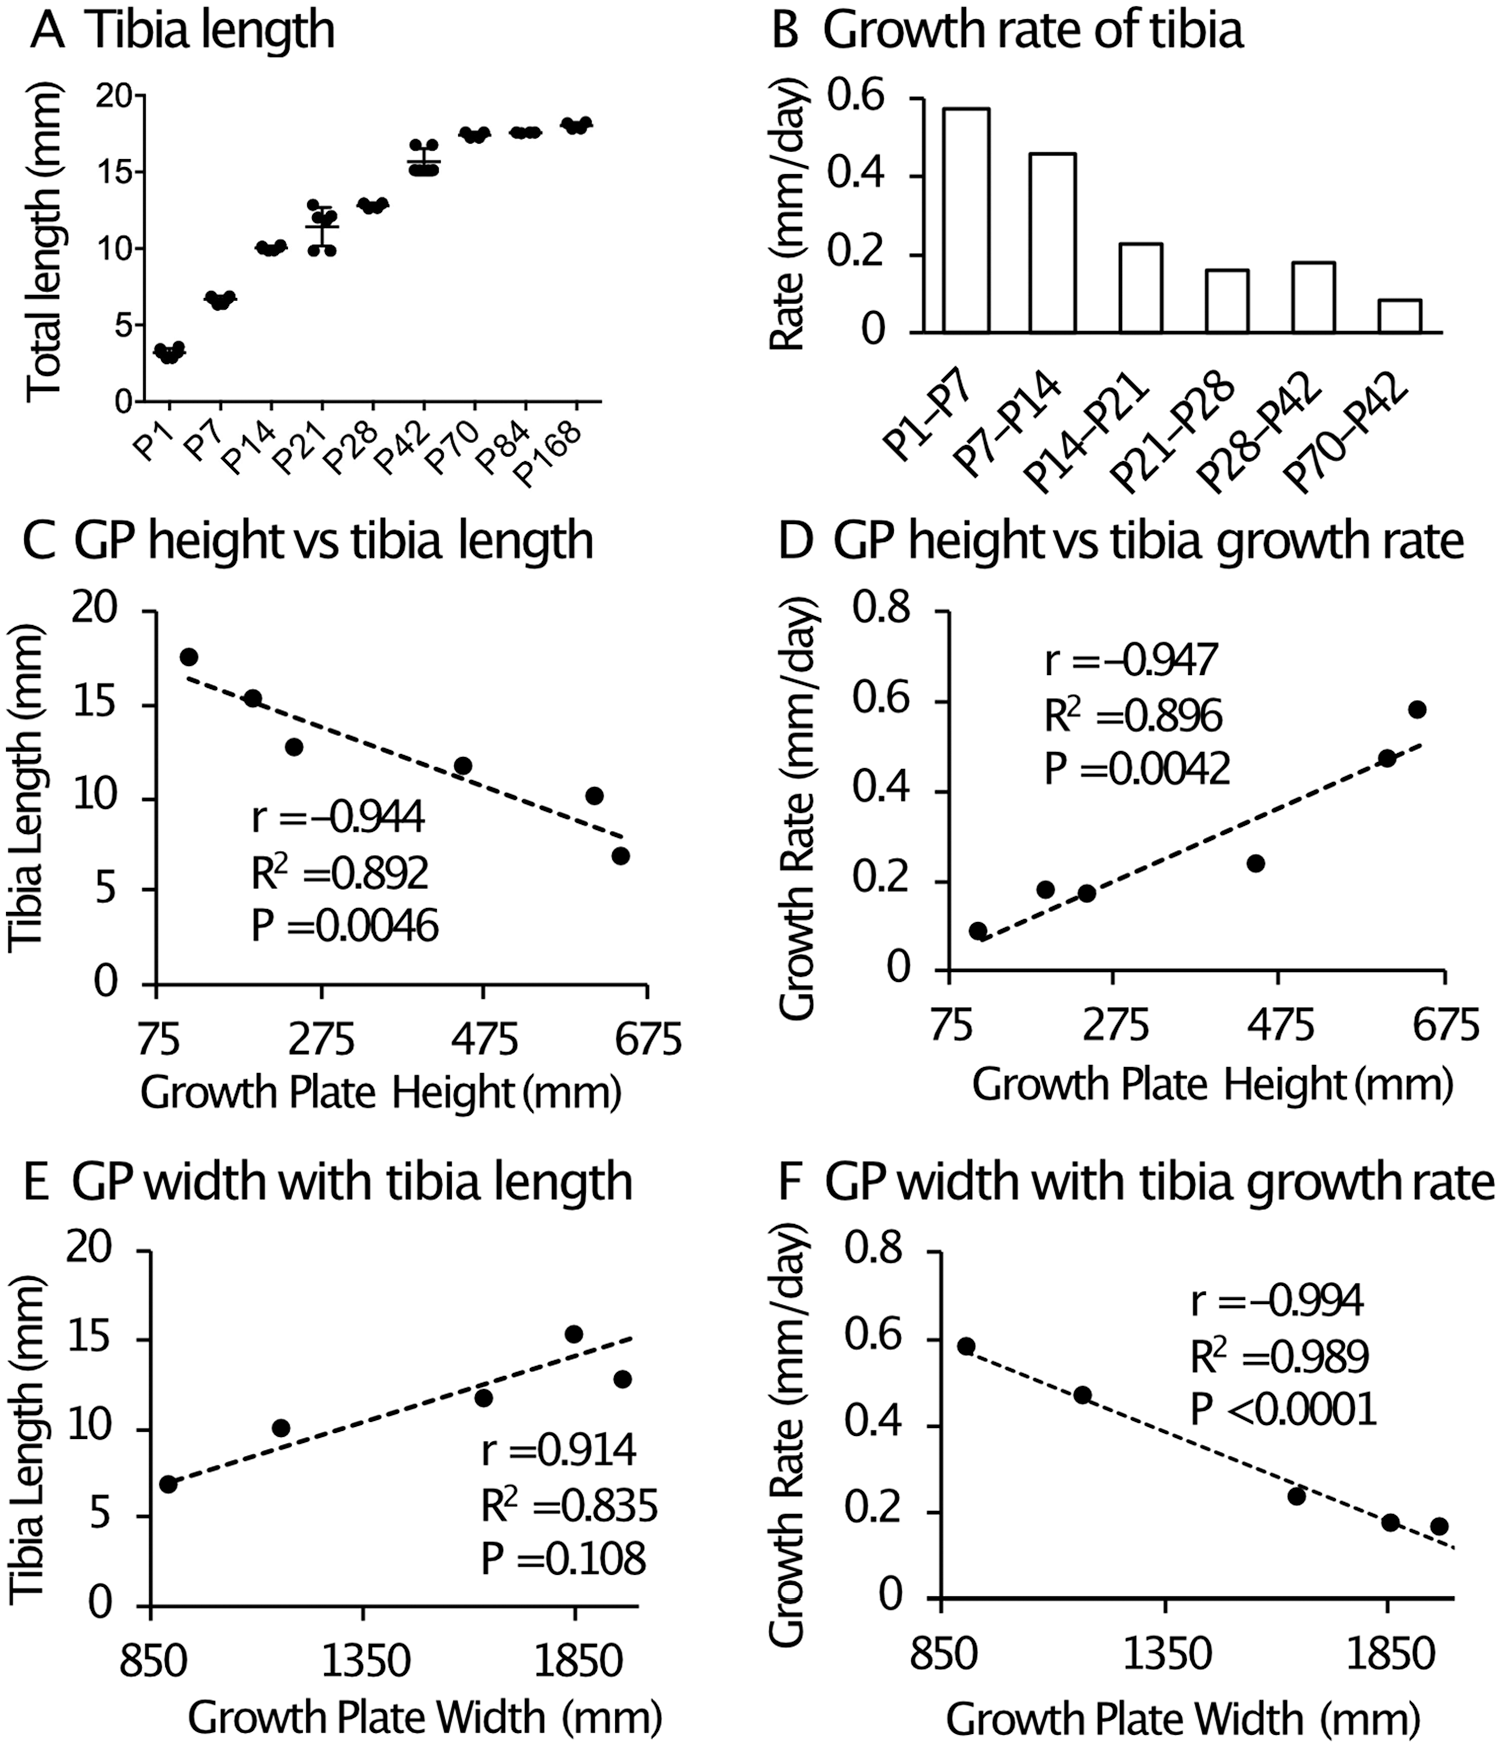
Relationship between growth plate height/width and tibia bone growth in mice. (
Linear Correlation between Variables of the Tibia Growth Plate and Tibia Length/Growth Rate. a
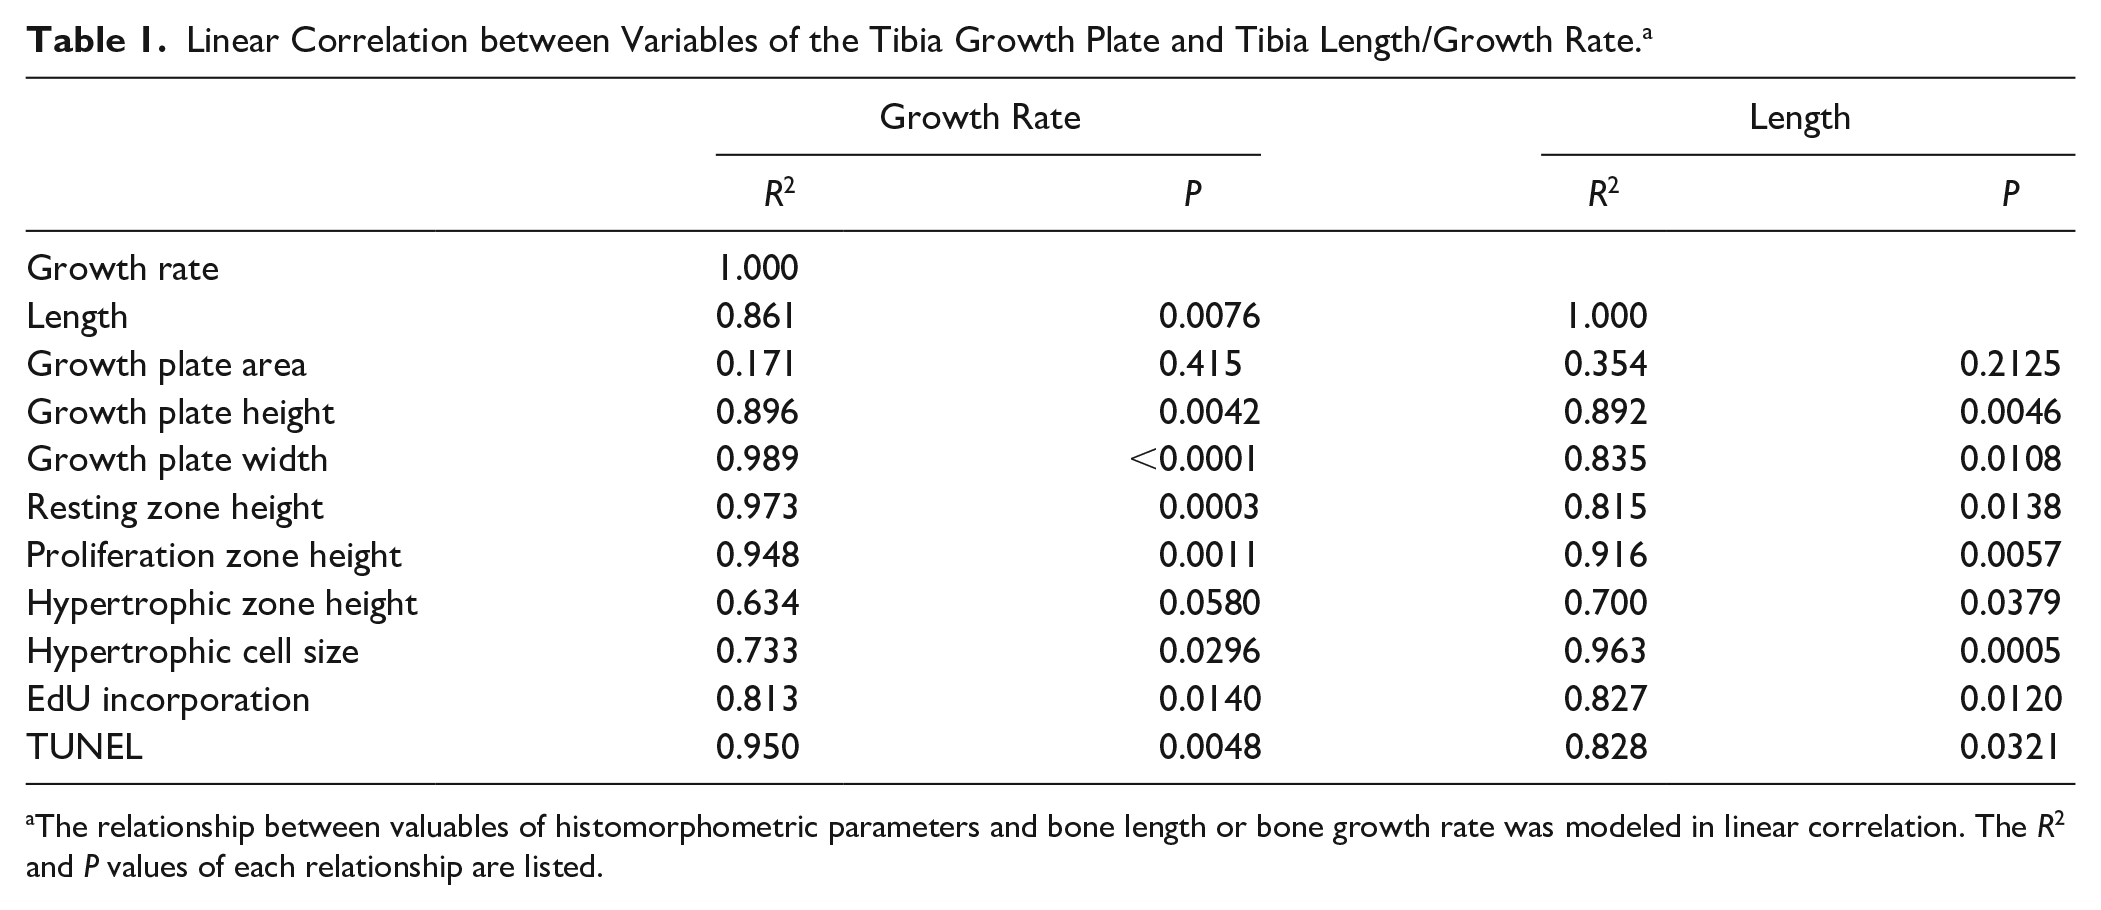
The relationship between valuables of histomorphometric parameters and bone length or bone growth rate was modeled in linear correlation. The R2 and P values of each relationship are listed.
Analysis of Functional Changes in the Growth Plate of Mice
We next analyze functional changes in growth plate chondrocytes during skeletal growth. The analysis of EdU incorporation revealed that cell proliferation was very active until P13, and then decreased over age ( Fig. 3 ). The EdU incorporation values showed strong correlation with bone length and growth rate ( Table 1 ).
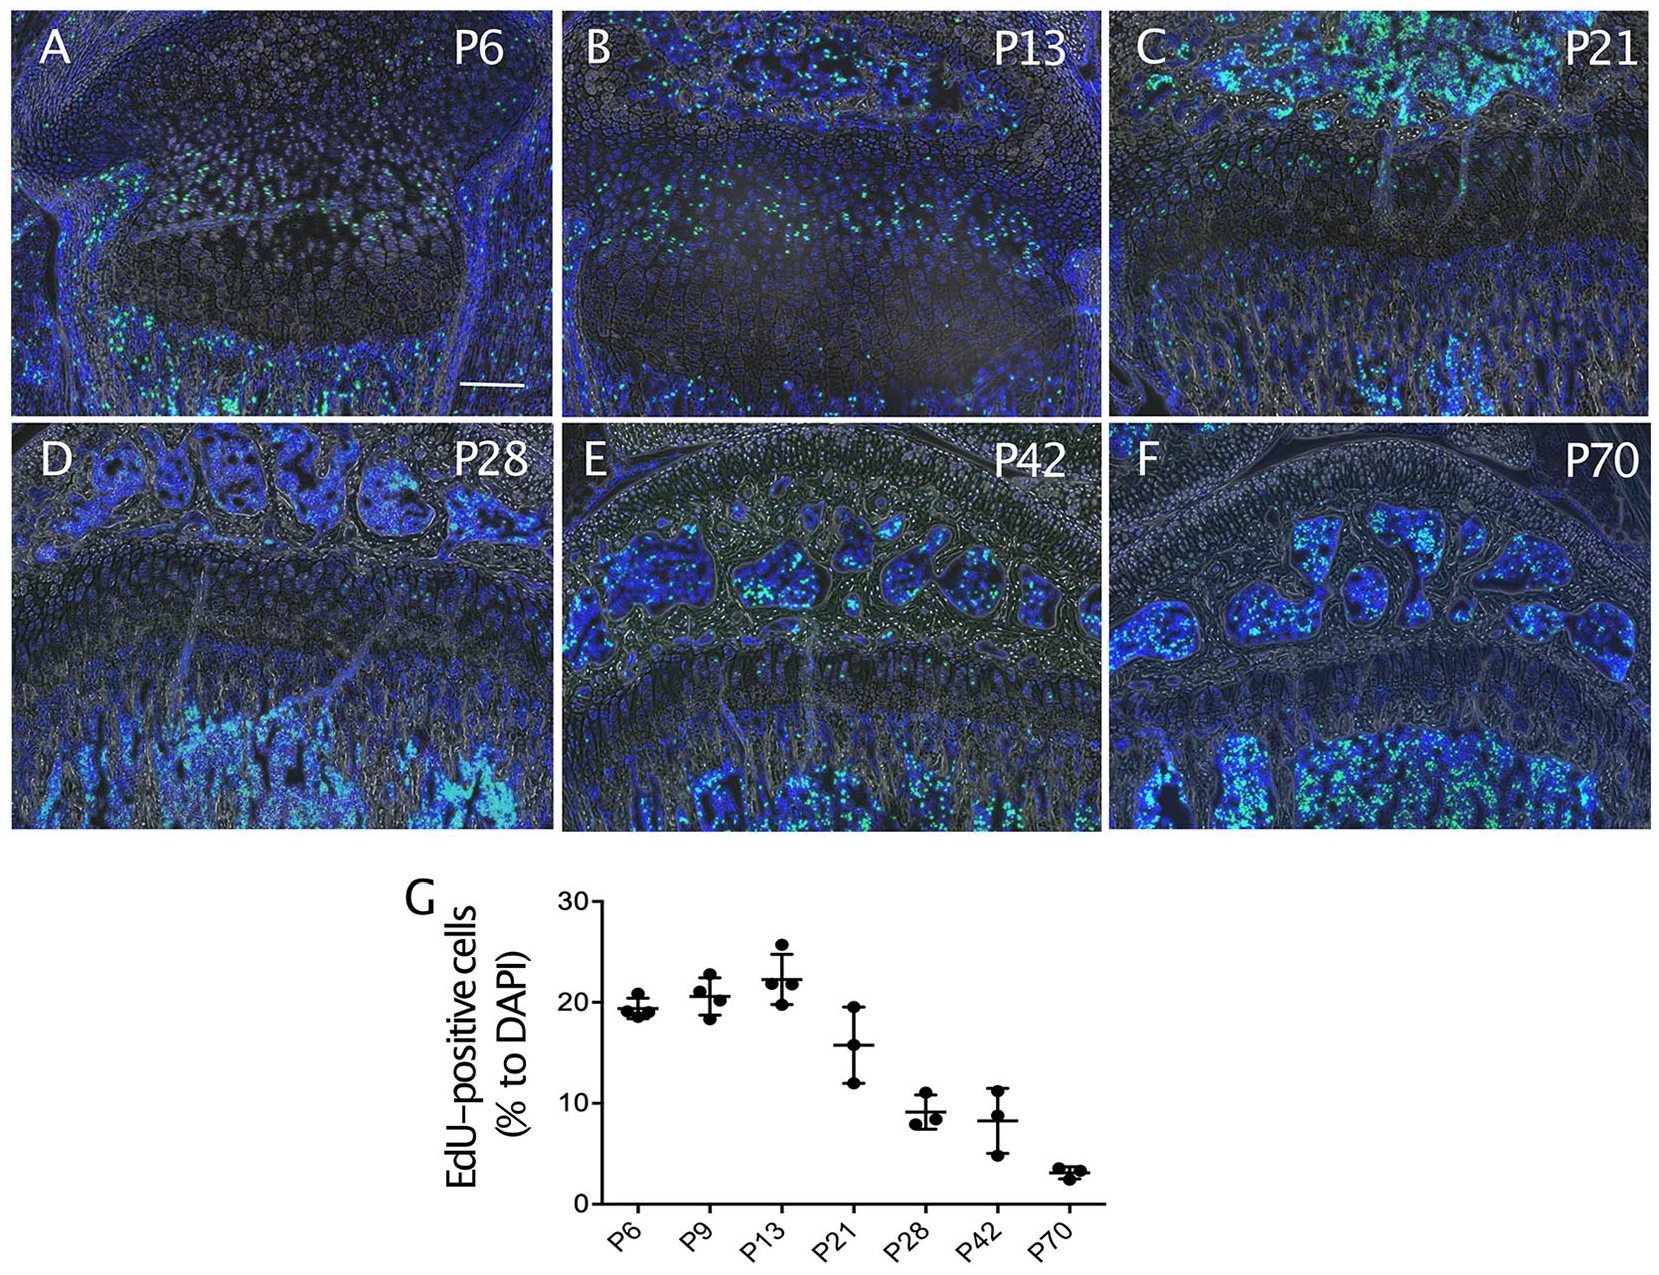
Changes in proliferation activity in growth plate during skeletal growth in mice. The mice received a peritoneal injection of 5-ethynyl-2-deoxyuridine (EdU) (50 mg/kg) 2 hours before being euthanized at the indicated ages. (
Immunohistochemical staining for p21Cip1 and p27/Kip1 were performed since these cyclin-dependent kinase inhibitors have been demonstrated to control cell arrest and sequester a wide variety of proteins. 25 Staining of both p21Cip1 and p27/Kip1 showed a similar pattern. At P6 and P13, both p21Cip1 and p27/Kip1 were found in the prehypertrophic and hypertrophic regions as expected (Supplement Fig. 4A and B). The staining decreased and became confined within the hypertrophic zone at P21 and P42, and undetectable at P70 (Supplemental Fig. 4A and B). A decrease in the staining might reflect a decrease in the basal level of protein expression activity.
Hypertrophic cells are thought to proceed toward apoptosis or to transdifferentiate into osteoprogenitors. The results of TUNEL staining indicate that apoptotic cells hardly exist inside the hypertrophic zone but do so in the primary spongiosa just outside of the hypertrophic zone ( Fig. 4A ). The number of apoptotic cells in the primary spongiosa underneath the growth plate was high at P6, and significantly decreased by P13 and became very low at P28 ( Fig. 4B ).
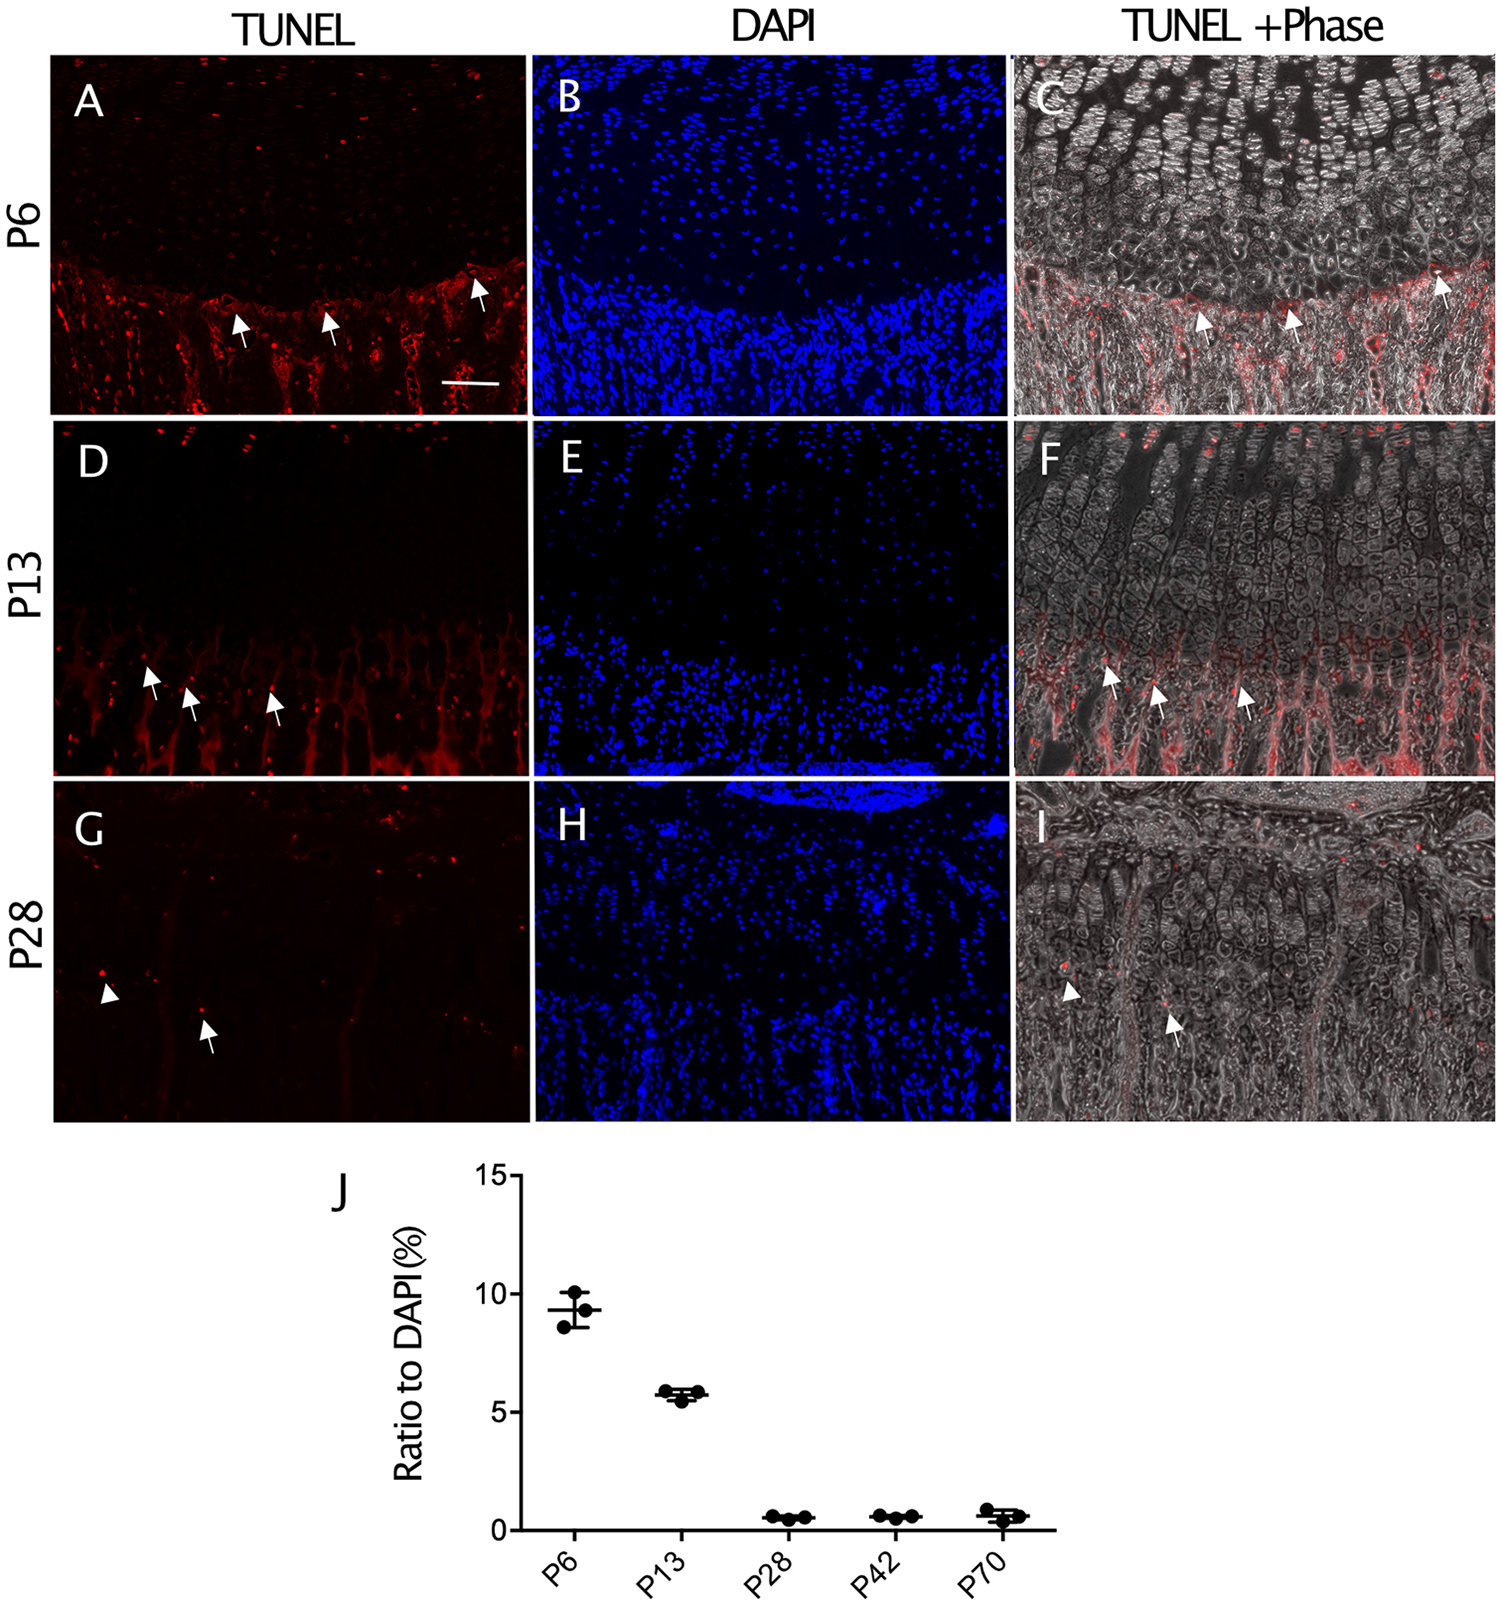
Distribution of apoptotic cells in growth plate during skeletal growth in mice. (
Analysis of Height and Width of Human Growth Plate
Long bone growth has been studied to provide the baseline and guideline for diagnosis and prognosis of bone growth disorders.20,26,27 However, there are few reports to compare the growth plate morphometric value with bone length. We performed cross-sectional data analysis of the radiographic images and compared the height and width of growth plate of the proximal tibia with the length of the tibia, ranging from 0 to 12 years old in females, from 0 to 15 years old in males. In females, the relationship between tibial length and age was strong from 0 to 5 years of age (Supplemental Fig. 5A, filled circles), but became weaker after 5 years of age (Supplemental Fig. 5A, open circles). In males, the relationship between tibial length and age was consistently strong from 0 to 15 years of age (Supplemental Fig. 5B)). The R2 values of the linear correlation between growth plate height and bone length were low in both females and males ( Fig. 5A and B ). In contrast, the R2 values between growth plate width and bone length were very high in both females and males (0.927 and 0.912, respectively) ( Fig. 5C and D ), comparable to that in female mice (0.835) ( Table 1 ).
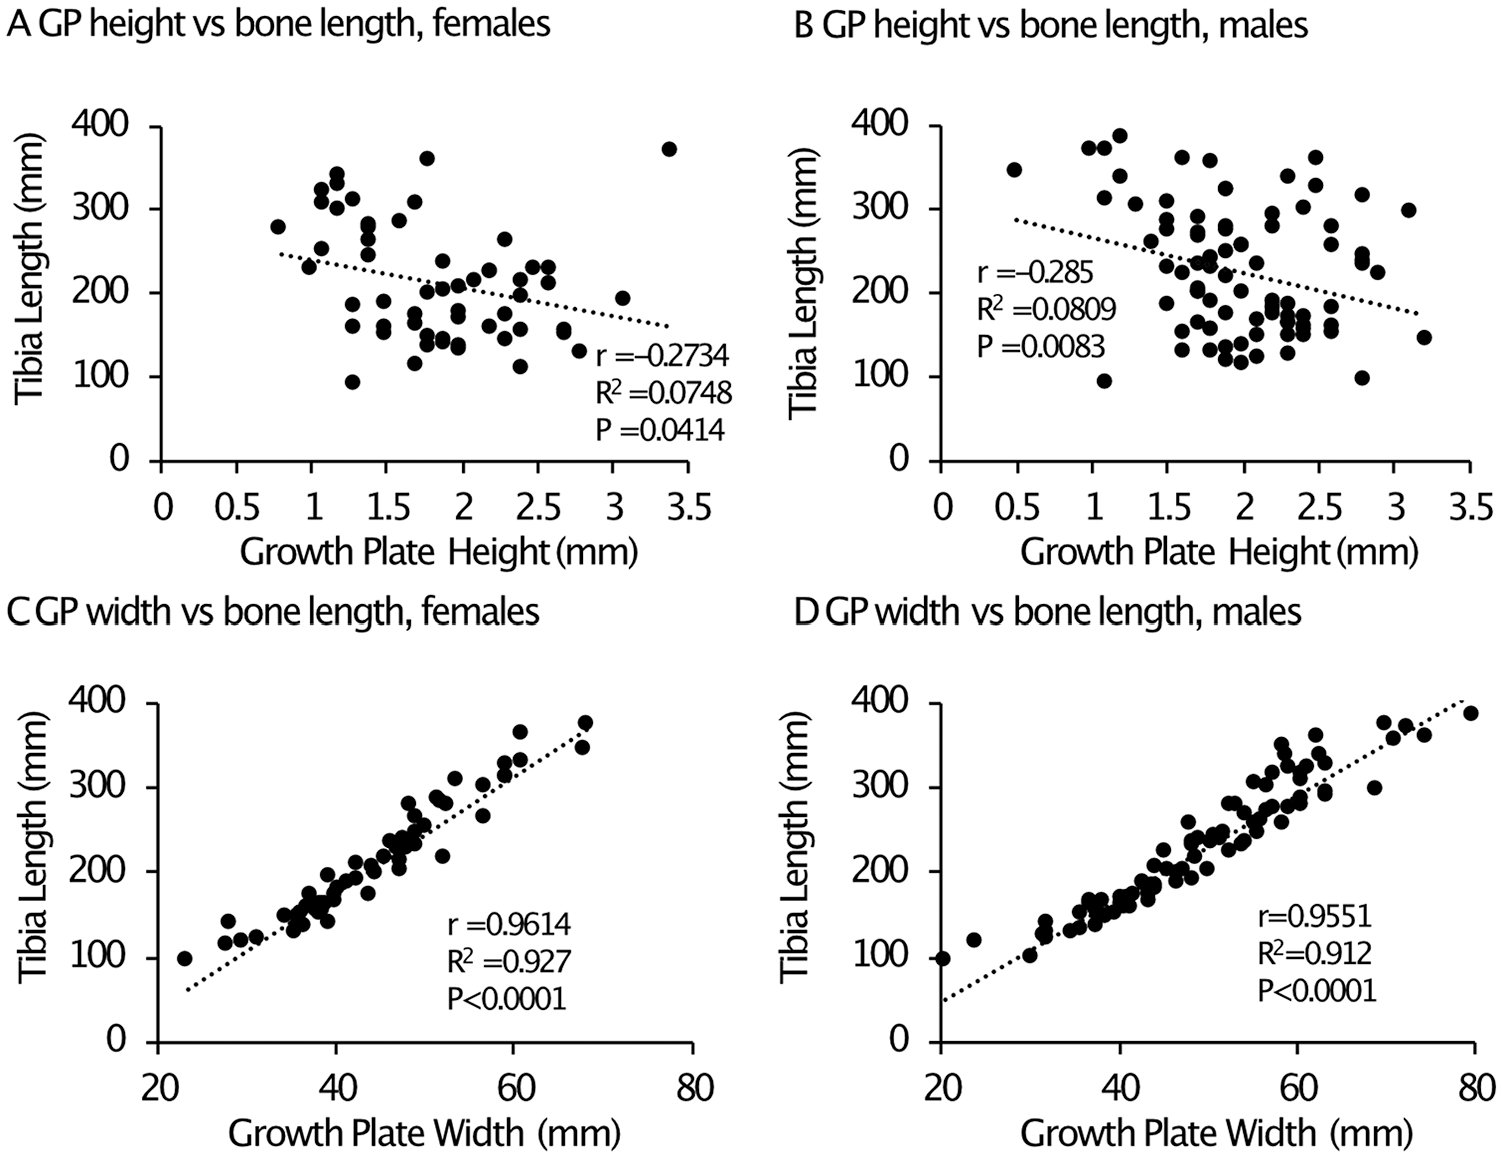
Relationship between tibia growth plate height/width and tibia bone length in humans. Normal, lower leg radiographs in the anteroposterior (AP) view of pediatric patients, 0 to 14 years of age were gathered from the institution’s radiograph database (IMPAX 6.5.1.1008). The proximal tibial physis height, proximal tibial physis width, and tibial length were measured. A minimum of 5 patients per 2-year age range were measured for each gender, for a total of 10 patients per 2 years age range (i.e., 0-2, 24, etc.). (
Discussion
This study examined the proximal tibia growth plate in female mice and demonstrated changes in various histomorphometric and functional parameters in the growth plate from the neonatal stage to the young adult. The linear correlation analysis with bone length and bone growth rate strengthens the significance of histomorphometry analysis of growth plate in this study since previous studies mostly did not perform comprehensive analysis the correlation. The results confirmed that growth plate total height, the height of the resting zone and cell proliferation activity are appropriate parameters to evaluate the balance between growth plate activity and bone growth in mice, which has been previously reported.9,12,28 The study also provides new information that the total width and the height of the proliferating and prehypertrophic zones have good variables correlated with bone growth regarding tibia. Limitations of the analysis in this study include a lack of information on male mice. We need to examine whether a linear correlation that we observed in tibia can be obtained in other bones such as femur and radius. We also need to validate how and whether the results can be used to predict the bone growth and interpret the growth plate phenotype in mouse models for skeletal disorders. The cross-sectional analysis of human tibial growth plate and bone length demonstrated similarity and differences of the variables from those in mice. In humans, while the total height of the growth plate does not show strong correlation with bone length, the total width of the growth plate does. The growth plate width is currently understudied but may be an important parameter to evaluate bone growth.
Histological Parameters of the Growth Plate that Corelate with Bone growth in Mice
Growth plate disturbances can happen because of trauma, 14 inflammation, 16 musculoskeletal genetic disorders, 4 kidney failure, 29 radiation treatments, 30 and sensory deficit or muscular neurological disorders. 31 Researchers frequently use wild type or transgenic mice to study orthopedic conditions.32-37 Histological features are a gold standard to provide evidence of growth plate dysfunction. There are various parameters to evaluate abnormalities of the growth plate structure, including total height, zone height, cell density, and zone proportion. Which parameters should be most valuable for validation of growth plate activity? The results obtained from this study indicate that in mouse tibia, total height and width of the growth plate would be the most simple and reliable parameters that have a strong correlation with tibia bone length and bone growth rate under the physiological condition. The tibia is one of major long bones used for histological analysis of growth plate due to its fairly simple shape and clinical significance. The total height and width of the tibia growth plate are very simple, easy, and reliable to measure comparing to other histological parameters such as area and cell size and functional parameters. This information will support and require future investigation on the comparison between these parameters and bone growth under various pathological conditions. Impaired bone growth retardation may be associated with higher values of the growth plate height and lower values of width compared to normal since the height shows negative correlation and the width shows positive correlation with bone length. Longer growth plate height is a sign of catch-up growth after a transient disturbance of growth plate activity.17,38 It would be interesting to examine whether this value can be used to predict bone growth rate or length. Studies on linear correlation between the growth plate parameters and bone length may provide the evidence for imbalance in interplay between growth plate activity and bone formation.
Growth Plate Analysis in Humans
The growth plate in growing bone is much weaker than the surrounding ossified bone making it susceptible to injury before complete closure. Growth plate injuries occur most often due to trauma from sports activities, accidents, or overuse.13-15 Gymnasts are prone to have growth plate injuries due to the repeated force from countless hours of practice. Insufficient healing of growth plate injuries could result in orthopedic disorders such as bone deformity and limb length discrepancies. The diagnosis of a growth plate arrest (physeal arrest) is clinically important since treatment plans, including conservative and surgical procedures, are dependent on this diagnosis. 39 Currently, a discrepancy between affected and unaffected bone length is used for prediction of bone growth deficit and the correct timing of epiphysiodesis.24,33 The results of this study indicate that the growth plate of the human tibia, as determined by radiographic images, does not reduce in height until skeletal maturity, which is different from what we found in the mouse growth plate. This may be due to the difference in growth plate histology: The resting zone of the human tibia is much wider than that in mice (Supplemental Fig. 6), and reduction in the proliferation and prehypertrophic zones, even if present, may not affect the total height. In contrast, the growth plate width is correlated with the bone length during both rapid and steady growth phases. The growth plate width could be a supplement parameter for evaluation of growth plate activity and bone growth. Measurement of growth plate width on radiographic studies may have inter- and intraobserver variability as reported. 40 Clear guidelines for position and angle during the image acquisition and resolution and anatomical landmarks on the image analysis are required.
Functional Parameters on Growth Plate Arrest
Growth plate arrest, a decrease in growth plate activity causes or is associated with bone growth stoppage. Previous studies have indicated that functional events that represent growth arrest are reduction in cell proliferation and a decrease or loss of supply of chondroprogenitor cells to the growth plate. 38 The results of this study showed a close correlation of decreases in EdU incorporation rate and height of the resting zone with the bone growth rate. It is unclear whether growth plate chondrocytes cause cellular senescence, an irreversible cell cycle arrest, and whether this concept explains growth plate arrest. The expression of p21Cip1 and p27Kip1 was examined, and both of which are increased at a post mitotic stage and have been shown as cellular senescence markers. 41 As expected, the distribution of these proteins excluded the zone rich in EdU-positive proliferating cells. However, the immunoreactivity of p21Cip1 and p27Kip1 were greatly reduced after P28 and became undetectable at P70. This may reflect a decrease in growth plate activity. At a minimum, these molecules are not suitable to evaluate growth plate arrest over age. Senescence-associated beta-galactosidase (SA β-Gal) is a widely used marker for cellular senescence. 42 Hypertrophic chondrocytes or other chondrocytes are mostly negative to staining of this enzyme at any time points while cells in the primary spongiosa are positive and become dominant after 6 weeks of age (P42), 43 suggesting that hypertrophic chondrocytes do not become senescent in the growth plate. We have also confirmed these observations. The growth plate chondrocytes are thought to proceed to apoptosis in hypertrophic zone classically. The results of TUNEL staining in this study showed that few cells were apoptotic inside the hypertrophic zone while a certain number of apoptotic cells were found in the primary spongiosa. The findings suggest that hypertrophic chondrocytes remain intact until released outside the growth plate by breakdown of the cartilage matrix. The number of apoptotic cells was greatly reduced after P13. This might be correlated with a decrease in the rate of chondrocyte turnover. Further studies are required to clarify which death process occur during loss of hypertrophic chondrocytes. Recent studies have shown that chondrocytes can become osteogenic cells, directly supporting bone formation.44-46 The efficiency of transdifferentiation may change during growth plate arrest and should be investigated.
In conclusion, the histomorphometric studies in the proximal tibia growth plate in growing mice demonstrated the total height and width of growth plate and cell proliferation activity are easy and reliable parameters to correlate bone length and growth rate. In humans, the tibia growth plate width but not height is correlated with the bone growth.
Supplemental Material
Supplement_information_rev_Wilson – Supplemental material for Analysis of Association between Morphometric Parameters of Growth Plate and Bone Growth of Tibia in Mice and Humans
Supplemental material, Supplement_information_rev_Wilson for Analysis of Association between Morphometric Parameters of Growth Plate and Bone Growth of Tibia in Mice and Humans by Kimberly Wilson, Yu Usami, Danielle Hogarth, Amanda L. Scheiber, Hongying Tian, Takeshi Oichi, Yulong Wei, Ling Qin, Satoru Otsuru, Satoru Toyosawa, Masahiro Iwamoto, Joshua M. Abzug and Motomi Enomoto-Iwamoto in CARTILAGE
Footnotes
Author Contributions
The conception and design of the study: YU, MI, JMA, and MEI. Acquisition of data: KW, YU, DH, HT, TO, and YW. Analysis and interpretation of data: YU, KW, DH, AS, LQ, SO, ST, MI, JMA, and MEI. Drafting the article: KW, DH, MEI. Revising the article critically for important intellectual content: YU, AS, HT, YW, LQ, SO, ST, MI, JMA, and MEI. Final approval of the version to be submitted: all authors.
Acknowledgments and Funding
The author(s) disclosed receipt of the following financial support for the research, authorship, and/or publication of this article: This study is partially supported by the National Institute of Arthritis and Musculoskeletal and Skin Diseases of the National Institutes of Health under Award Number R01AR056837 and R01 AR072713, POSNA Microgrant Awards and the interdepartmental fund.
Declaration of Conflicting Interests
The author(s) declared the following potential conflicts of interest with respect to the research, authorship, and/or publication of this article: The individual (MEI) serving as co-investigator on the grant (R01AR056837) is a spouse.
Ethical Approval
All animal experiment procedures were approved by the Institutional Animal Care and Use Committee of Osaka University and the University of Maryland, Baltimore. The study is performed under approved institutional review board protocol at the University of Maryland, Baltimore.
Supplemental Material
Supplemental material for this article is available online.
References
Supplementary Material
Please find the following supplemental material available below.
For Open Access articles published under a Creative Commons License, all supplemental material carries the same license as the article it is associated with.
For non-Open Access articles published, all supplemental material carries a non-exclusive license, and permission requests for re-use of supplemental material or any part of supplemental material shall be sent directly to the copyright owner as specified in the copyright notice associated with the article.