
Abstract
Objective
In native articular cartilage, chondrocytes are surrounded by a thin pericellular matrix (PCM) forming chondrons. The PCM is exclusively rich in type VI collagen. The retention of the PCM has a significant influence on the metabolic activity of the chondrocytes.
Design
This study investigated the influence of 2 hydrogels (hyaluronic acid [HA] and agarose) and 2 media compositions (basal and chondrogenic) on the preservation/maintenance and acceleration of PCM formation over a 21-day time course. Different combinations of chondrocytes, chondrons, and mesenchymal stem cells (MSCs) were studied.
Results
Both hydrogels preserved chondrons PCM from day 1 up to 21-day culture regardless of media composition. Type VI collagen immunostaining of the cultured chondrons appeared both dense and homogenous. The presence of MSCs did not influence this outcome. At day 1, type VI collagen was not present around chondrocytes alone or their co-culture with MSCs. In the HA hydrogel, type VI collagen was located within the PCM after 7 days in both mono- and co-cultures. In the agarose hydrogel, collagen VI was located within the PCM at 7 days (co-cultures) and 14 days (monocultures). In both hydrogel systems, chondrogenic media enhanced the production of key extracellular matrix components in both mono- and co-cultures in comparison to basal media (11.5% and 14% more in glycosaminoglycans and type II collagen for chondrocytes samples at day 21 culture samples, respectively). However, the media types did not enhance type VI collagen synthesis.
Conclusion
Altogether, a 3D chondrogenic hydrogel environment is the primary condition for maintenance and acceleration of PCM formation.
Introduction
Articular cartilage is a thin hydrated tissue, which covers the articulating joint surfaces. In native articular cartilage tissue, the extracellular matrix (ECM) is a fibrillar mesh of interacting collagens, proteoglycans, glycosaminoglycans (GAGs), and other non-collagenous glycoproteins residing in a highly aqueous environment. 1 The chondrocytes within the ECM are surrounded by a thin pericellular matrix (PCM) forming chondrons. The PCM is rich in hyaluronan, proteoglycans, GAGs, and type II collagen; it is the exclusive location of type VI collagen.2,3 Type VI collagen anchors the chondrocyte to the PCM through a beaded fibrillar arrangement, which intersects the PCM arrangement at different angles. 4 This multi-angled configuration ensures that chondrons are stiffer than chondrocytes and better to withstand compressive load. 5 During chondron isolation procedures, the retention of the PCM has a significant influence on the metabolic activity and the mechanical signaling from and to the ECM via cell-matrix interactions. 6 Studies have revealed that osteoarthritic cartilage has both disorganised 7 and a lower density of type VI collagen. 8 There is evidence from our own laboratory 9 and others10,11 that the PCM can be destroyed during both enzymatic digestion and in vitro culture. Enzymatically extracted chondrons adhering to hard substrates in monolayer will change their morphology from a rounded shape to a fibroblastic shape and this is accompanied by the loss of PCM following a week in culture. Enhancing the formation of the PCM and developing approaches to enable the PCM to remain intact and rapidly mature are important issues for cartilage regeneration.
Hydrogels possess key properties, which make them suitable for articular cartilage regenerative medicine strategies. Their properties include hydrophilicity, biophysical, homogenous cell distribution, and high permeability for nutrients and waste products.12,13 Within hydrogels, chondrocytes can be stimulated to produce ECM in a way that preserves the accumulation and retention of newly produced ECM.13,14 There is much evidence to show that preserving the chondrogenic phenotype can be achieved by culturing the chondrocytes and chondrons in agarose and hyaluronic acid (HA) hydrogels environment.6,15-18
Mesenchymal stem cells sourced from bone marrow (BM-MSCs) can differentiate into multiple lineages including chondrocytes, 19 making them an ideal cell source for cartilage regeneration strategies. Over the past decade, MSC differentiation has been found to be modulated by growth factors, mechanical stimulation, co-culture with chondrocytes or chondrons, and interactions with the ECM. Several research groups, including our own, have shown that co-culture of chondrocytes or chondrons with MSCs results in superior ECM production compared with cultures containing only chondrocytes or chondrons.9,20-22 Evidence has revealed that BM-MSCs convey these actions via trophic factors23,24 secreted in exosomes in work that was first described by Lai et al. 25
Work still remains to be done to optimize the ratio of chondrons to MSCs and to fully characterize the cartilage ECM that they produce. Our recently published work found that co-culture of chondrons with MSC slowed the loss of type VI collagen and improved ECM production. 9 The regenerative medicine field lacks systematic studies investigating whether culture conditions have a positive impact on MSC/chondron or chondrocyte co-cultures with respect to preservation of the PCM and enhancement of PCM regeneration. Herein, we aim to define the 3D culture environment that facilitates the preservation, regeneration, and stabilization of PCM. More specifically, we investigated several key parameters including hydrogel type, presence of MSCs, and culture medium type and culture duration in parallel experiments.
Materials and Methods
Chondrocyte and Chondron Isolation
Full-depth articular cartilage was dissected from the articulating surface of the trochlea humerus of 18-month-old cows, which were obtained from a local abattoir. Four separate isolations were performed, each using 1 humerus. Chondrocyte and chondron isolations were performed according to established protocol. 26 Briefly, diced cartilage was sequentially digested with 0.1% (w/v) proteinase K for 1 hour and then 0.3% (w/v) collagenase type IA for 3 hours. Chondrocytes from the supernatant were strained through a 70-µm cell sieve, washed in Dulbecco’s Modified Eagle’s Medium (DMEM) supplemented with 10% (v/v) fetal bovine serum (FBS). The filtrate was centrifuged at 750g. The cells were washed 3 times with DMEM. For chondron isolation, diced cartilage was digested with 0.3% (w/v) dispase and 0.2% (w/v) collagenase type XI in DMEM for 5 hours. The cell suspension was filtered through a 70-µm cell sieve, washed in DMEM supplemented with 10% FBS, and centrifuged at 750g for 3 times.
Rat Mesenchymal Stromal Cells Isolation
Rat MSCs were isolated following an established protocol. 27 Briefly, the tibias and femurs from 4-week-old Sprague-Dawley rats were dissected after euthanasia by Schedule 1. Both ends of the bones were cut down along the epiphysis, and then the bone marrow was flushed out with 10 mL of cell culture medium consisting of α-minimal essential medium (α-MEM) supplemented with 10% FBS. Bone marrow cells were transferred to a T25 flask and incubated at 37°C and 5% CO2. Nonadherent cells were removed and media were replaced every 3 days.
Preparation of Hyaluronic Acid and Agarose Hydrogels
HA sodium salt powder with an average molecular weight of 1.5 × 10⁶ Da was supplied by Shangdong Freda Biopharm Co., Ltd., China. HA gel was prepared by cross-linking of HA molecules with 1,4-butanediol diglycidyl ether (BDDE; Sigma) as a cross-linker according to an established protocol. 28 Briefly, HA powder was dissolved in 1% (v/v) NaOH at a concentration of 10%, after which BDDE was added to the HA solution with vigorous stirring to a final concentration of 0.4% (v/v). The solution was then allowed to cross-link at 40°C for 5 hours followed by drying at room temperature for 3 days. For rehydration, phosphate-buffered saline (PBS) was then added to the cross-linked HA. The hydrated HA was dialyzed against deionized water and PBS to remove any residual BDDE and the resulting gel was adjusted with PBS to a concentration of 20 mg/mL. 29 The hydrated HA was further processed to allow the reconstruction of gels into different size. Briefly, the crosslinked HA was pulverized with a homogenizer to obtain mini viscous gel particles of 0 to 400 µm. The homogenized mini HA gels were mixed with 2% (w/v) agarose (melting point, 26°C, Sigma) solution in a ratio of 9:1 (HA: agarose) at below 20°C and gelated at above 26°C to obtain reconstructed HA gel with the required shape and thickness. The reconstructed HA gel and pure agarose gel (2%) were used for 3D culture models with notation of HA and ag, respectively.
Fabrication of 3D Culture Models
All samples were cultured in 96-well plates. For cell embedding within the hydrogel, 75 µL of hydrogel solution were cast first, after 30 minutes polymerization, 5 × 10³ cells/well were seeded and allowed to attach at 37°C for 2 hours. Following this incubation period, another 75 µL of hydrogel solution were dispensed into individual wells. The encapsulated 3D constructs were incubated with 2 different culture media defined below, respectively, for 21 days at 37°C with 5% CO2 and taking samples for analysis at days 1 (D1), 7 (D7), 14 (D14), and 21 (D21).
Four cell groups containing monoculture, chondrocytes (CY), chondron (CN), and their co-culture with MSC in the ratio of 50:50 were prepared based on the outcome of our 2D culture model. 9 Two types of media, Basal (Bas), which contained DMEM supplemented with 10% (v/v) FBS, 1% (v/v) L-glutamine, 1% penicillin-streptomycin (v/v), or chondrogenic (Ch) medium, which contained DMEM with 1% (v/v) L-glutamine, 1% (v/v) NEAA, 1% (v/v) sodium pyruvate, 1% (v/v) insulin transferin sodium selenite, 50 µg/mL ascorbic acid, 50 µg/mL L-proline, 0.1 µM dexamethasone, 10 ng/mL transforming growth factor-β1 and 2 types of hydrogels, reconstructed HA gel (HA) and agarose (ag), were applied to all cell groups separately ( Table 1 ). The encapsulated 3D constructs were incubated with Basal and chondrogenic media for 21 days at 37°C with 5% CO2 and taking samples for analysis at days 1 (D1), 7 (D7), 14 (D14), and 21 (D21).
Description of Experimental Groups with Cell Types and Seeding Density.
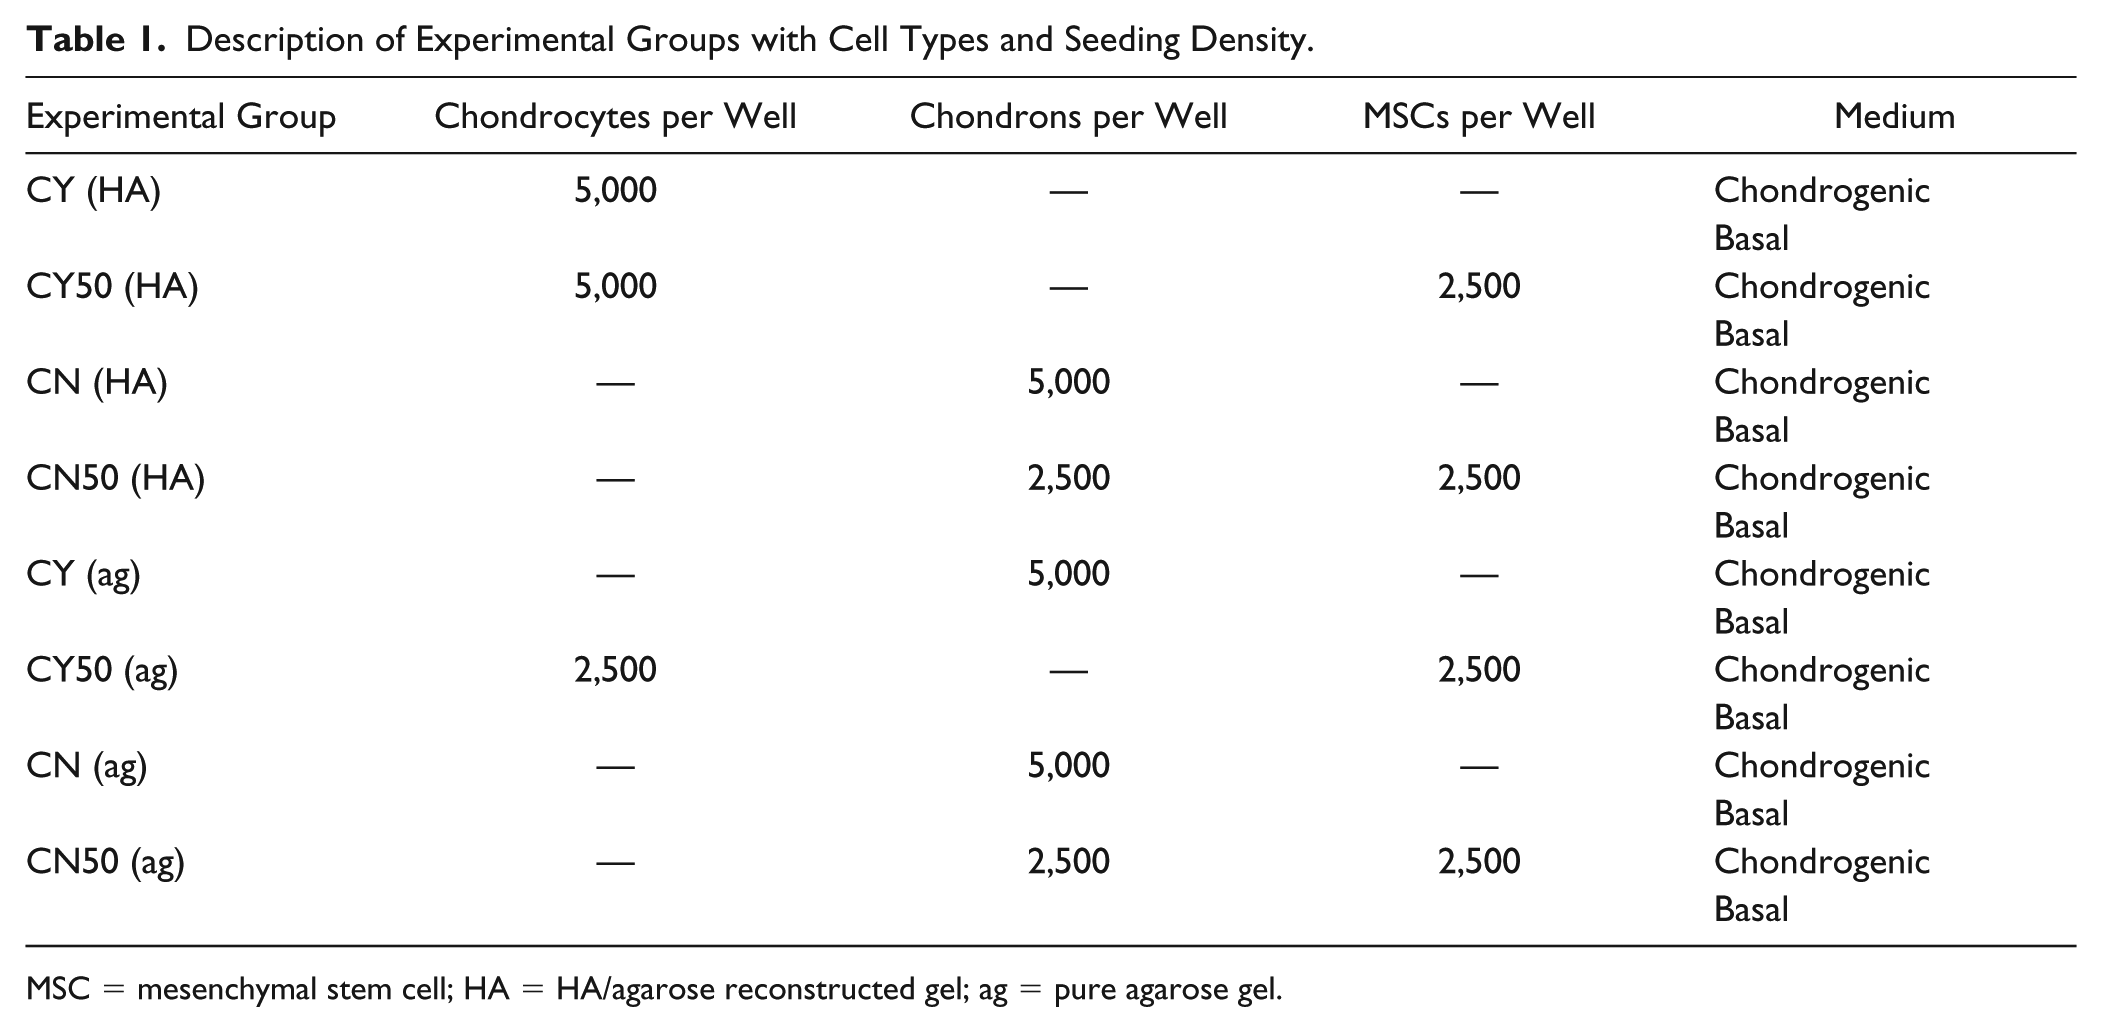
MSC = mesenchymal stem cell; HA = HA/agarose reconstructed gel; ag = pure agarose gel.
Biochemical Assays
The total cell number and GAG deposition were analyzed by digesting samples at given culturing time points. The digestion solution was made at a pH of 6.5 by dissolving 125 µg/mL of papain in 0.1 M sodium phosphate, 5 mM EDTA, and 5 mM cysteine-HCl. The experimental samples were separately digested with 300 µL papain solution per sample for 8 hours at 60°C. The digests were stored at −20°C for further analysis.
PicoGreen DNA Assay
Total cell number was assessed using the Quant-iTTM PicoGreen dsDNA assay kit with serial dilutions of a lambda DNA standard (0-1 µg/mL). The PicoGreen solution was prepared as a 1:200 dilution in 1× Tris-EDTA (TE) buffer. Duplicate standards or cell/lysis samples (100 µL) were transferred to 96-well plates followed by 100 µL of 1× TE buffer. The plate was incubated in the dark for 5 minutes before fluorescence readings were read. The fluorescence was determined at 485 nm excitation and 535 nm emission using a Synergy II BioTek plate reader. The previously reported value of 7.7 pg of DNA per chondrocyte was used to approximate cell number. 30
Total Sulfated Glycosaminoglycan Assessment
Total sulfated glycosaminoglycan (sGAG) production was evaluated using 1,9-dimethylmethylene blue (DMMB) dye following the established protocol. 31 DMMB regent comprised 4 mg of DMMB in 250 mL of solution containing 0.58 g sodium chloride (NaCl), 0.75 g glycine, and 2.08 mL of 0.1 M hydrochloric acid dissolved in 248 mL of dH2O. Standards (0-40 µg/mL) were prepared by dissolving bovine tracheal chondroitin sulfate in dH2O. The pH was adjusted to 3. A total of 100 µL of cell lysis sample or culture media or standard were introduced into each well of 96-well plates and then 200 µL DMMB were added to all wells. The absorbance of the solution in the plate was read immediately at 530 nm using a Synergy II BioTek plate reader.
Histological Analysis of Proteoglycan
Toluidine blue staining was performed to assess the distribution of proteoglycans and their associated sGAGs following our published work. 32 The hydrogel within the samples was removed by warming to 40°C for 45 seconds. The samples were centrifuged at 750g. Cells were resuspended in 0.9% (w/v) NaCl and then cytospun onto microscope slides for 1 minute at 250g. Once the cells had been deposited onto slides, samples were fixed with formalin at room temperature for 30 minutes. Formalin was discarded, and the samples were washed 3 times with PBS. The fixed samples were toluidine blue stained for sGAG. The stained cell layer was left to dry at room temperature prior to viewing under an Evos AMEX-1100 light microscope.
Immunolocalization of Key Chondrogenic Markers
Immunofluorescence staining was performed using primary antibodies against the following components in the PCM: type VI collagen (goat; Santa Cruz) and type II collagen (mouse; Abcam). Three samples for each culture group were fixed with 4% (w/v) paraformaldehyde at room temperature for 30 minutes. All samples were subjected to an unmasking treatment prior to the staining in accordance with an established protocol. 9 After pretreatment, the samples were incubated with the primary antibodies and then labelled with the fluorescein isothiocyanate (FITC)-conjugated secondary antibody for type VI collagen and tetramethylrhodamin (TRITC)-conjugated secondary antibody for type II collagen and finally contrast stained with DAPI to label the nuclei. Bovine articular cartilage was used as a positive control. Primary antibodies were omitted for negative controls. The fluorescence intensity of all samples were evaluated by confocal microscopy (Olympus) using the same exposure time, gain, and offset camera settings so that the immunofluorescence intensity was directly comparable among the groups for each given antibody. The intensity of immunofluorescence staining was semiquantified using the ImageJ software. Using the integrated intensity function within the ImageJ software, we compared the stained region with the unstained background. Three randomly selected areas from 3 images were analyzed for each group. At least 5 cells in each 3 randomly nominated areas for 3 biological samples were selected for the calculation.
Statistical Analysis
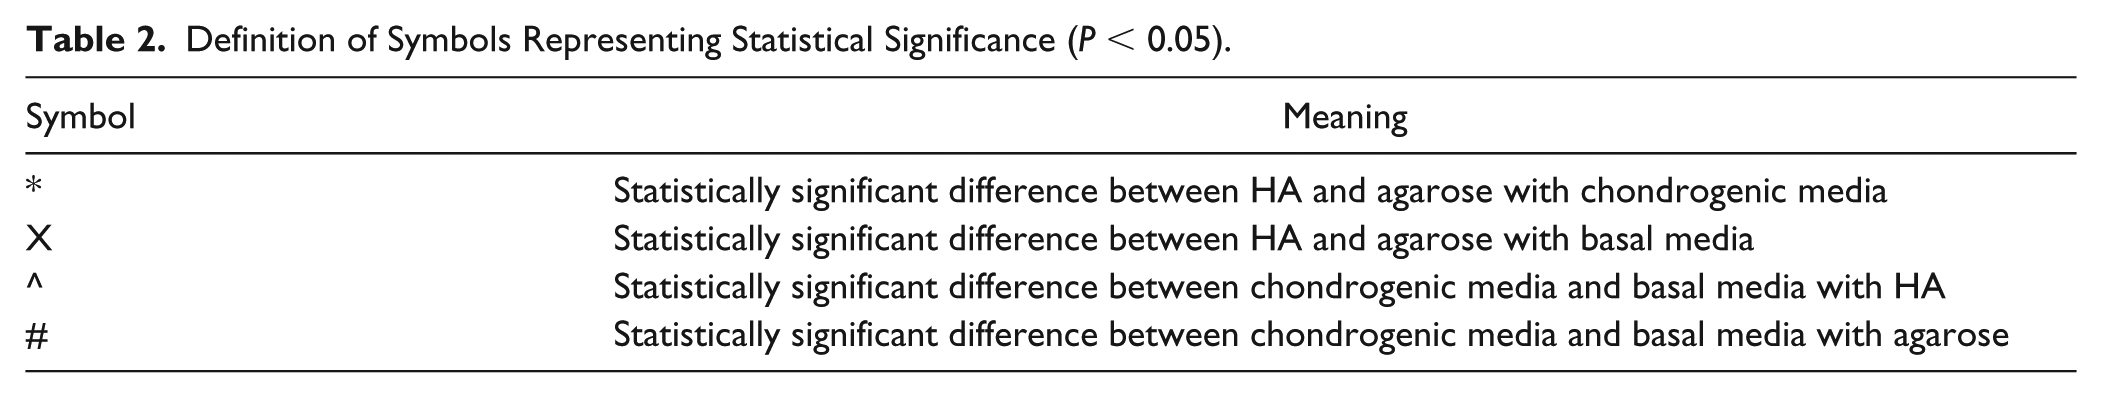
For each analysis, data were expressed as mean ± standard deviation. Statistical analyses were performed with SPSS statistical software (version 15.0). All experimental groups had a sample size of at least 3 replicates (n = 3). Statistical significance was determined by performing one-way ANOVA, followed by a Tukey’s post-test. Significance was accepted at P value < 0.05. The symbols indicating the comparison groups are listed in Table 2.
Definition of Symbols Representing Statistical Significance (P < 0.05).
Results
Cell Number
Figure 1 shows that co-cultures had a higher cell number in comparison with monoculture of both chondron and chondrocytes constructs in both HA hydrogel and basal media. Also, the chondrocytes had a higher cell number than the chondrons within the culture time in both mono- and co-cultures. Samples in the HA hydrogel demonstrated a significantly higher cell number than in the agarose hydrogel (P < 0.05) at different culture time points in both chondrogenic and basal media. Over time, the HA hydrogel had a higher proliferation rate in comparison with agarose which showed almost the same cell number across the time course. Regarding medium types, cell number was higher in a basal media culture in HA hydrogel in both chondron and chondrocytes mono- and co-cultures (P < 0.05). Chondrogenic media culture showed that cell number decreased after day 7 in both mono- and co-cultures.
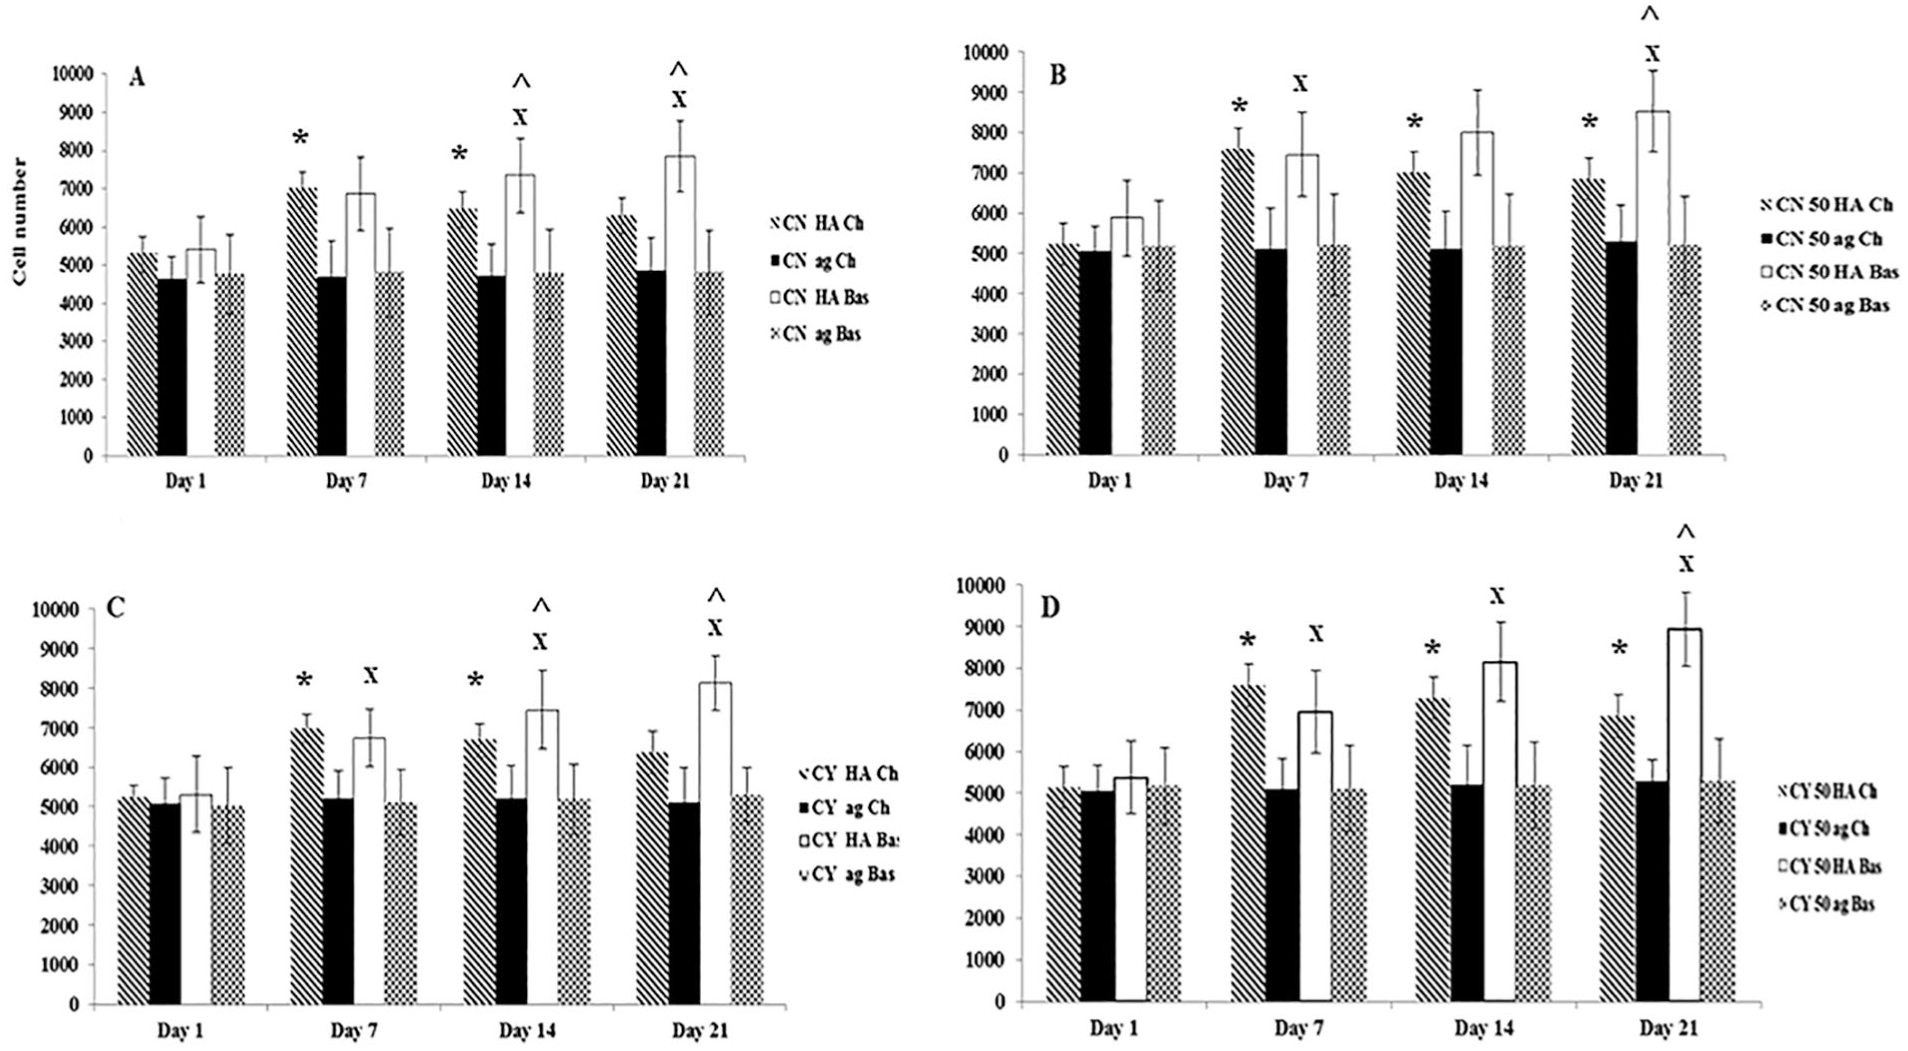
Cell number in monoculture and co-culture with MSC within hyaluronic acid (HA) and agarose (ag) hydrogels under chondrogenic (Ch) and basal (Bas) media at days 1, 7, 14, and 21. (
Total Sulfated GAG Deposition
Figure 2 shows the accumulated sGAG in mono- and co-cultures for both chondron and chondrocytes constructs using different hydrogel materials and medium types at different culture time points. Co-culture had a moderate enhancement on sGAG deposition in both chondron and chondrocytes constructs. Also, the chondron accumulated more sGAG than chondrocytes within the same time point in both mono- and co-cultures. HA hydrogel demonstrated higher sGAG deposition than agarose hydrogel along different time points in both chondrogenic and basal media. The accumulated sGAG increased with culture time. At day 21, the chondrogenic medium culture showed enhancement and a higher sGAG deposition than the basal medium culture in HA and agarose hydrogels and in both mono- and co-cultures of chondron and chondrocytes.
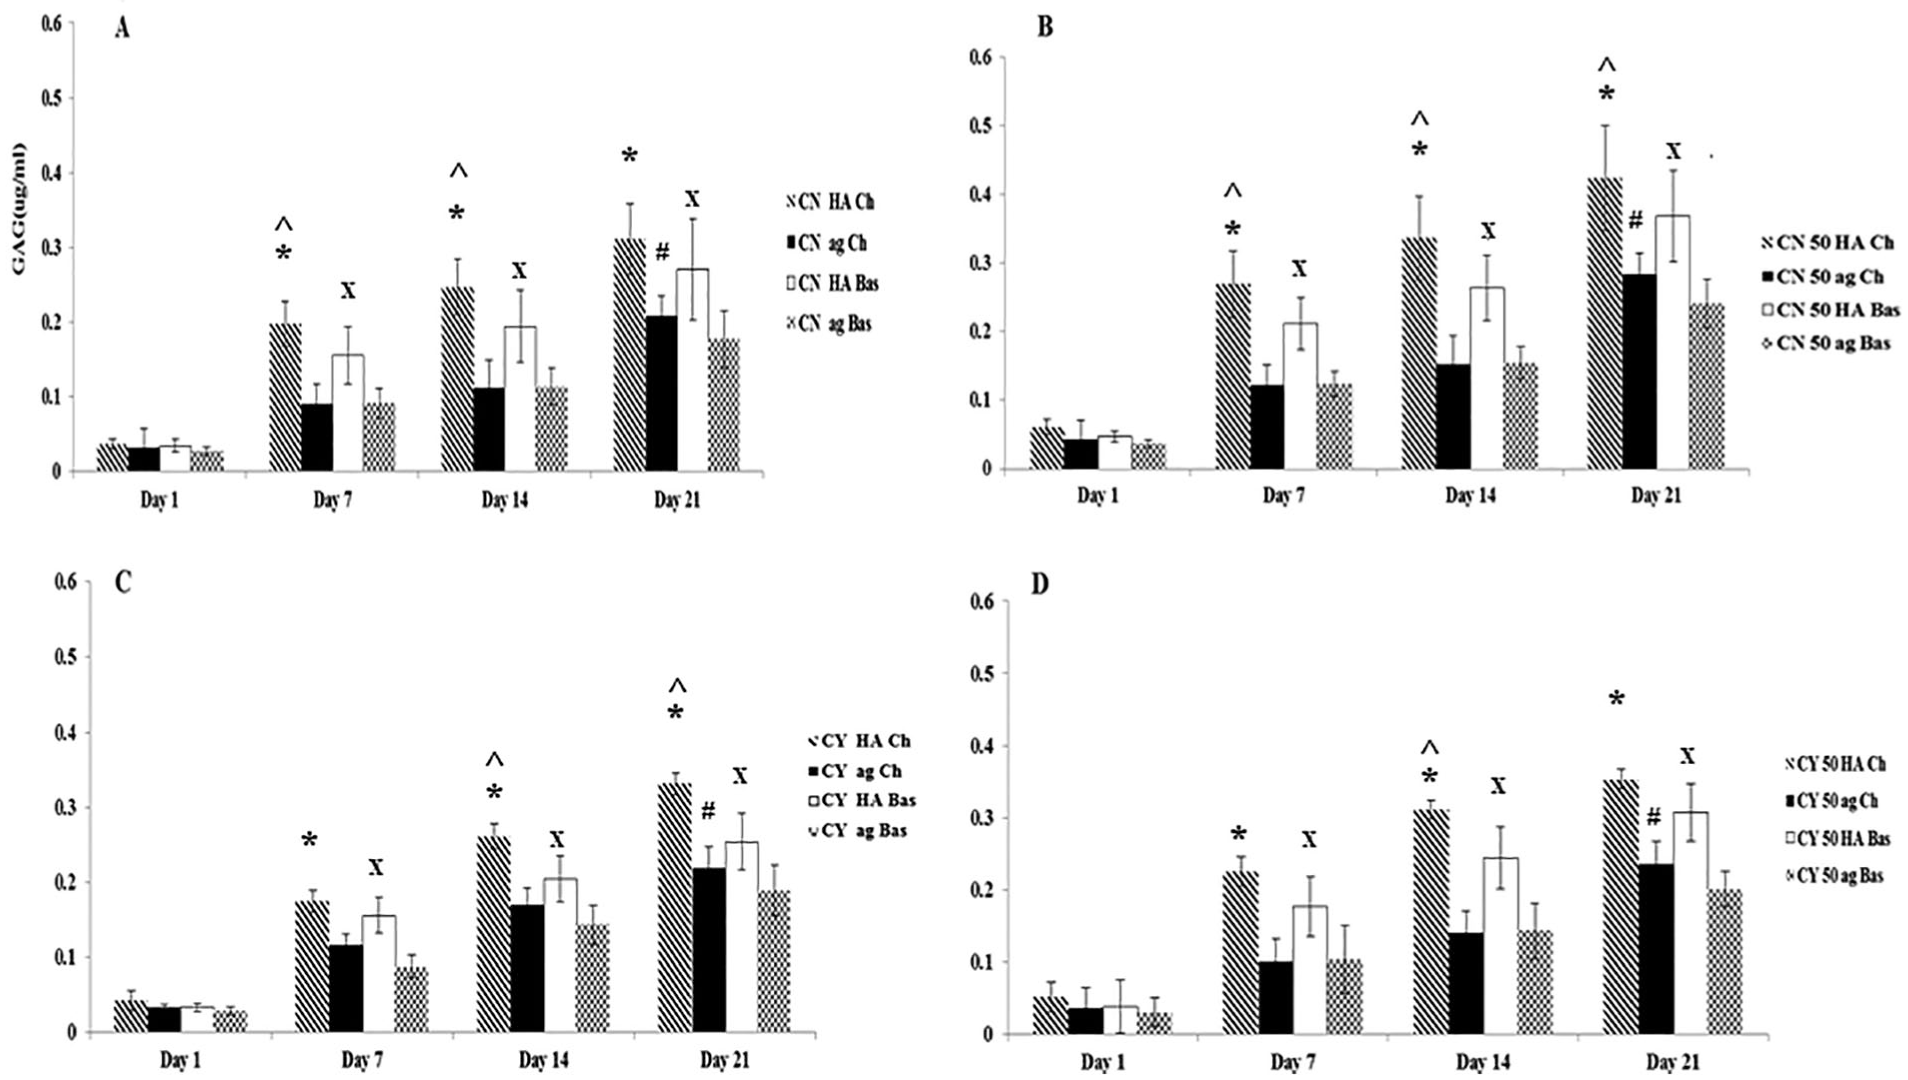
Total sGAG deposition of the samples within hyaluronic acid (HA) and agarose (ag) hydrogels and under chondrogenic (Ch) and basal (Bas) mediums at days 1, 7, 14, and 21. (
sGAG deposition values normalized to cell number confirmed that sGAG deposition per cell increased with time. Furthermore, MSC and chondron co-cultures significantly increased sGAG deposition per cell (P < 0.05). The highest normalized sGAG deposition ( Fig. 3 ) was in the samples within the HA gel, using chondrogenic media and 50% MSC with 50% chondron or 50% chondrocytes.
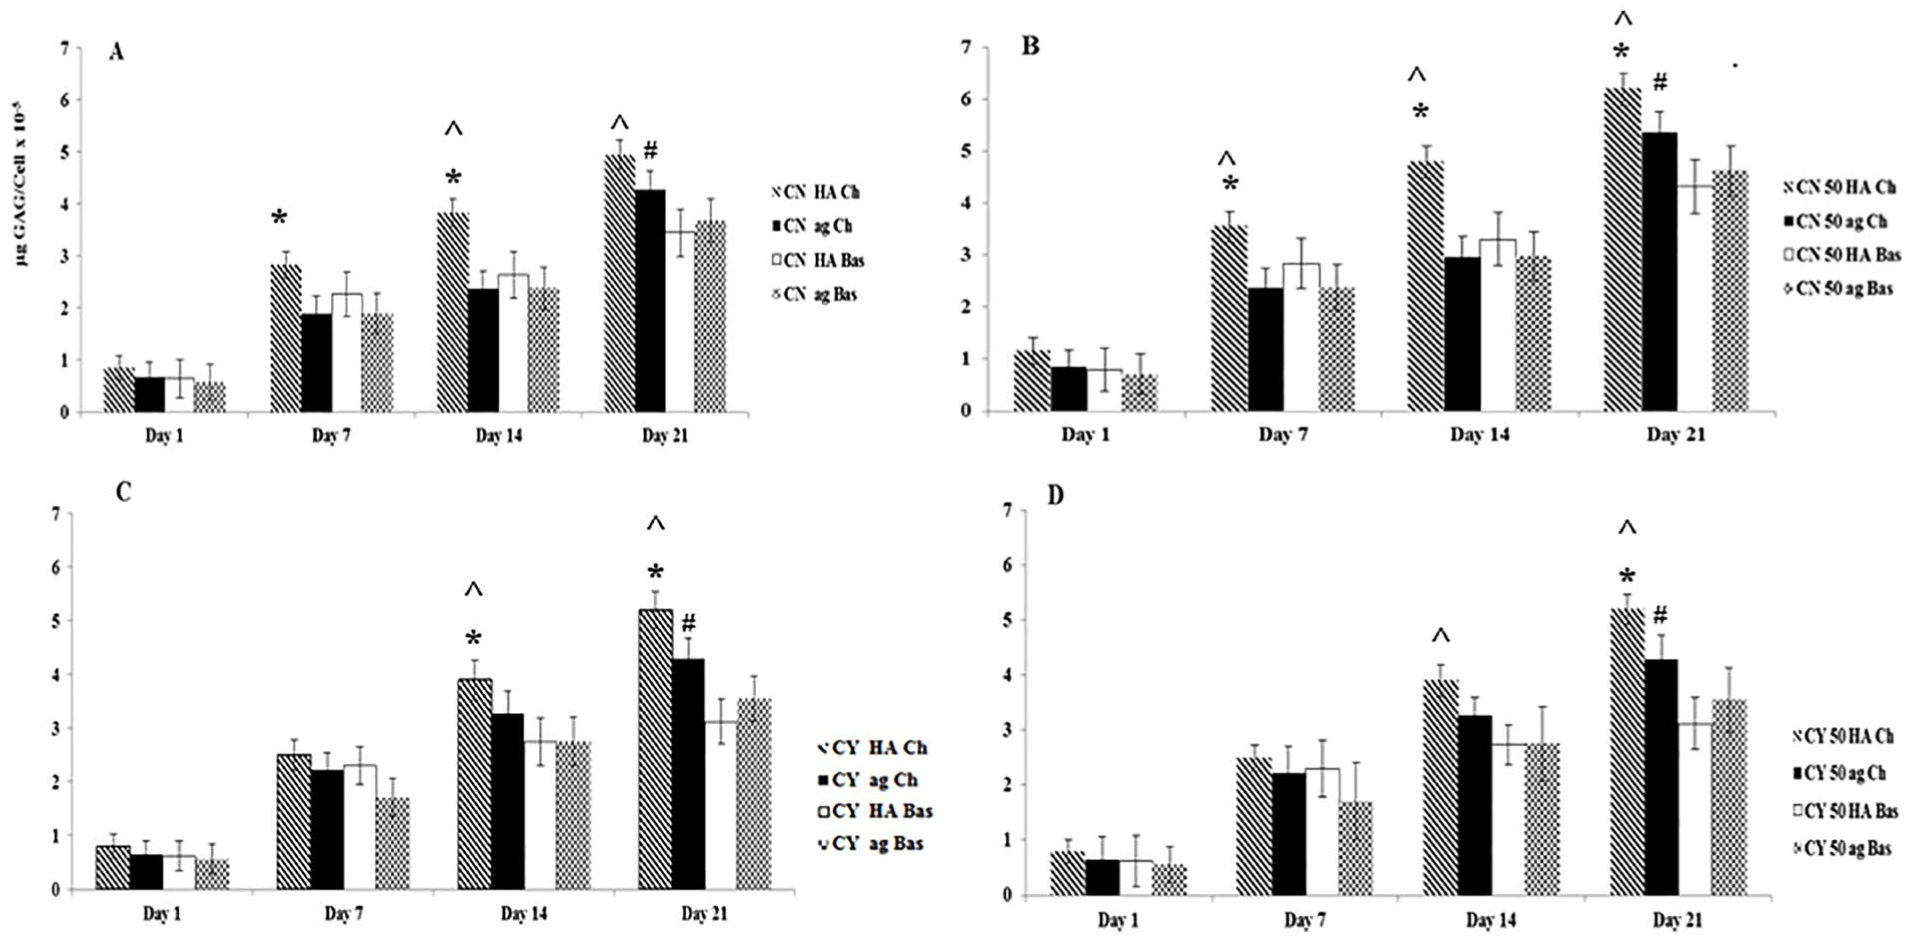
Total sGAG deposition normalized to cell number in monoculture and co-culture within hyaluronic acid (HA) and agarose (ag) hydrogels and chondrogenic (Ch) and basal (Bas) media at days 1, 7, 14, and 21. (
Histology
Each cultured sample was stained with toluidine blue to detect the presence and distribution of sGAG. Throughout the time course, sGAG deposition increased in both chondron and chondrocyte mono- and co-cultures constructs ( Fig. 4A and B ). Samples in HA hydrogel showed more strongly stained than the one in agarose for both mono- and co-cultures. Furthermore, the samples cultured in chondrogenic media demonstrated more sGAGs than in basal media.
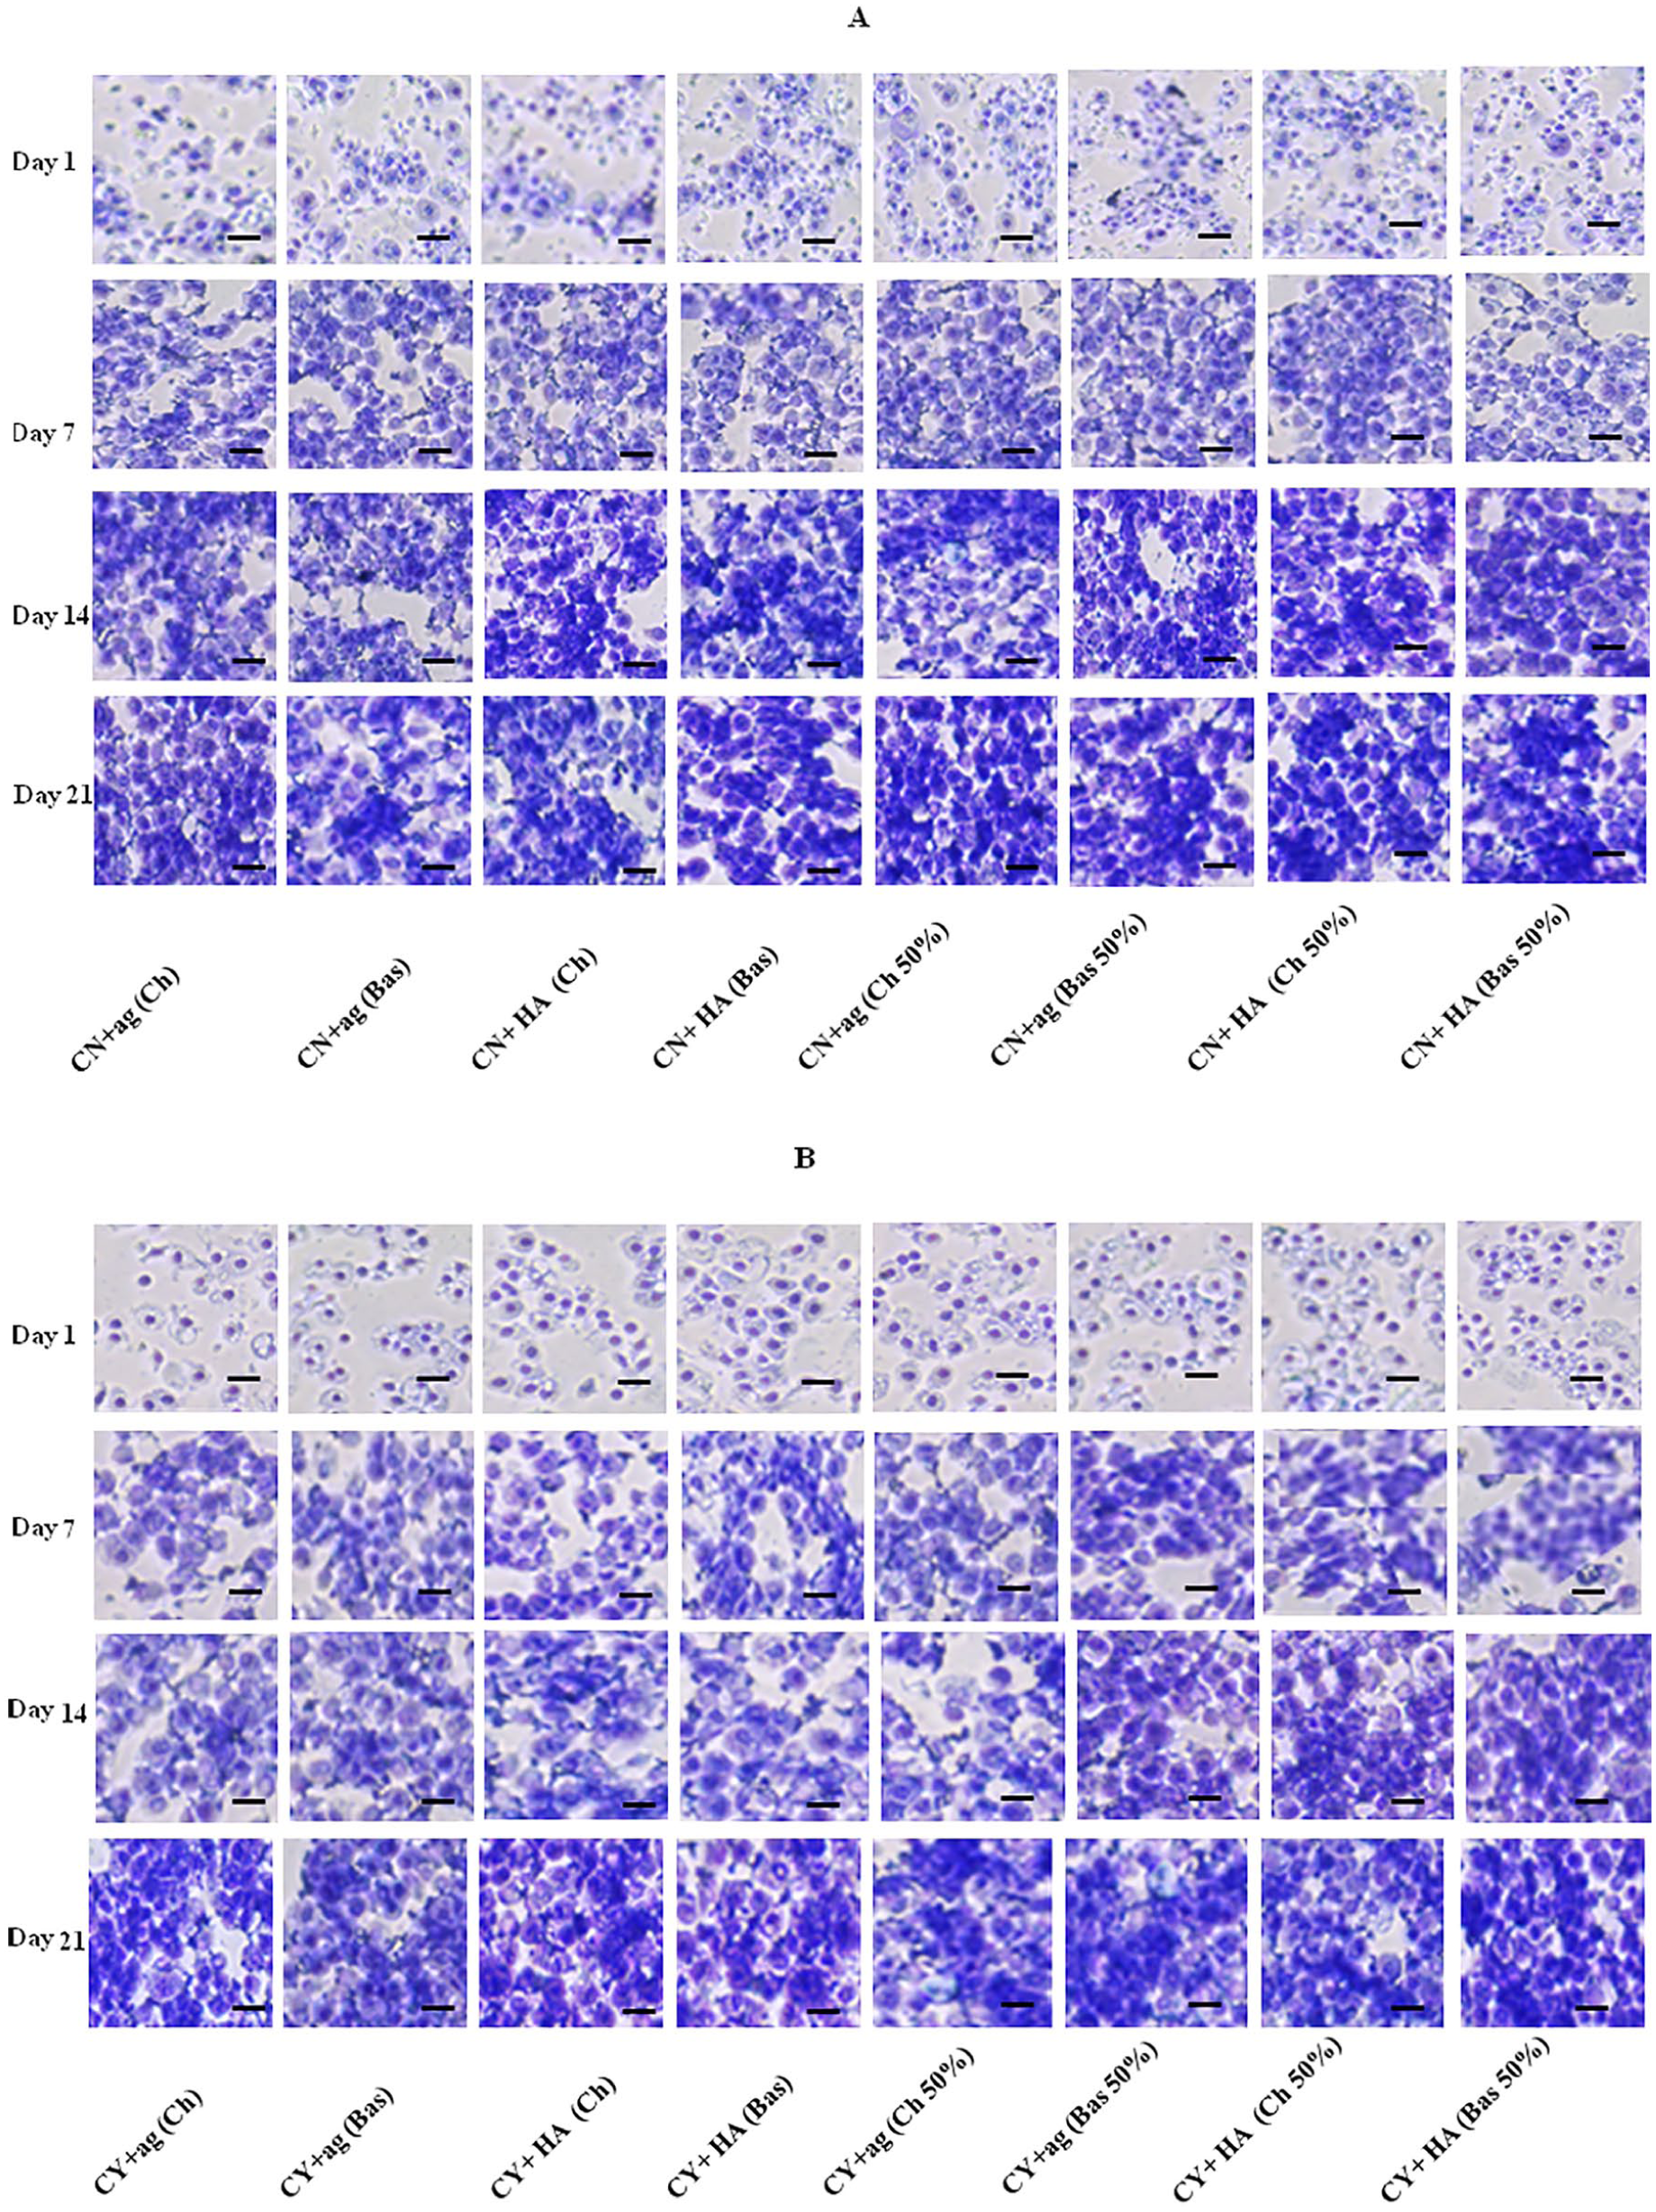
Representative toluidine blue staining for mono- and co-cultures samples within hyaluronic acid (HA) and agarose (ag) hydrogels under chondrogenic (Ch) and basal (Bas) media at days 1, 7, 14, and 21 with 50% MSCs. (
Expression of Key PCM and ECM Components
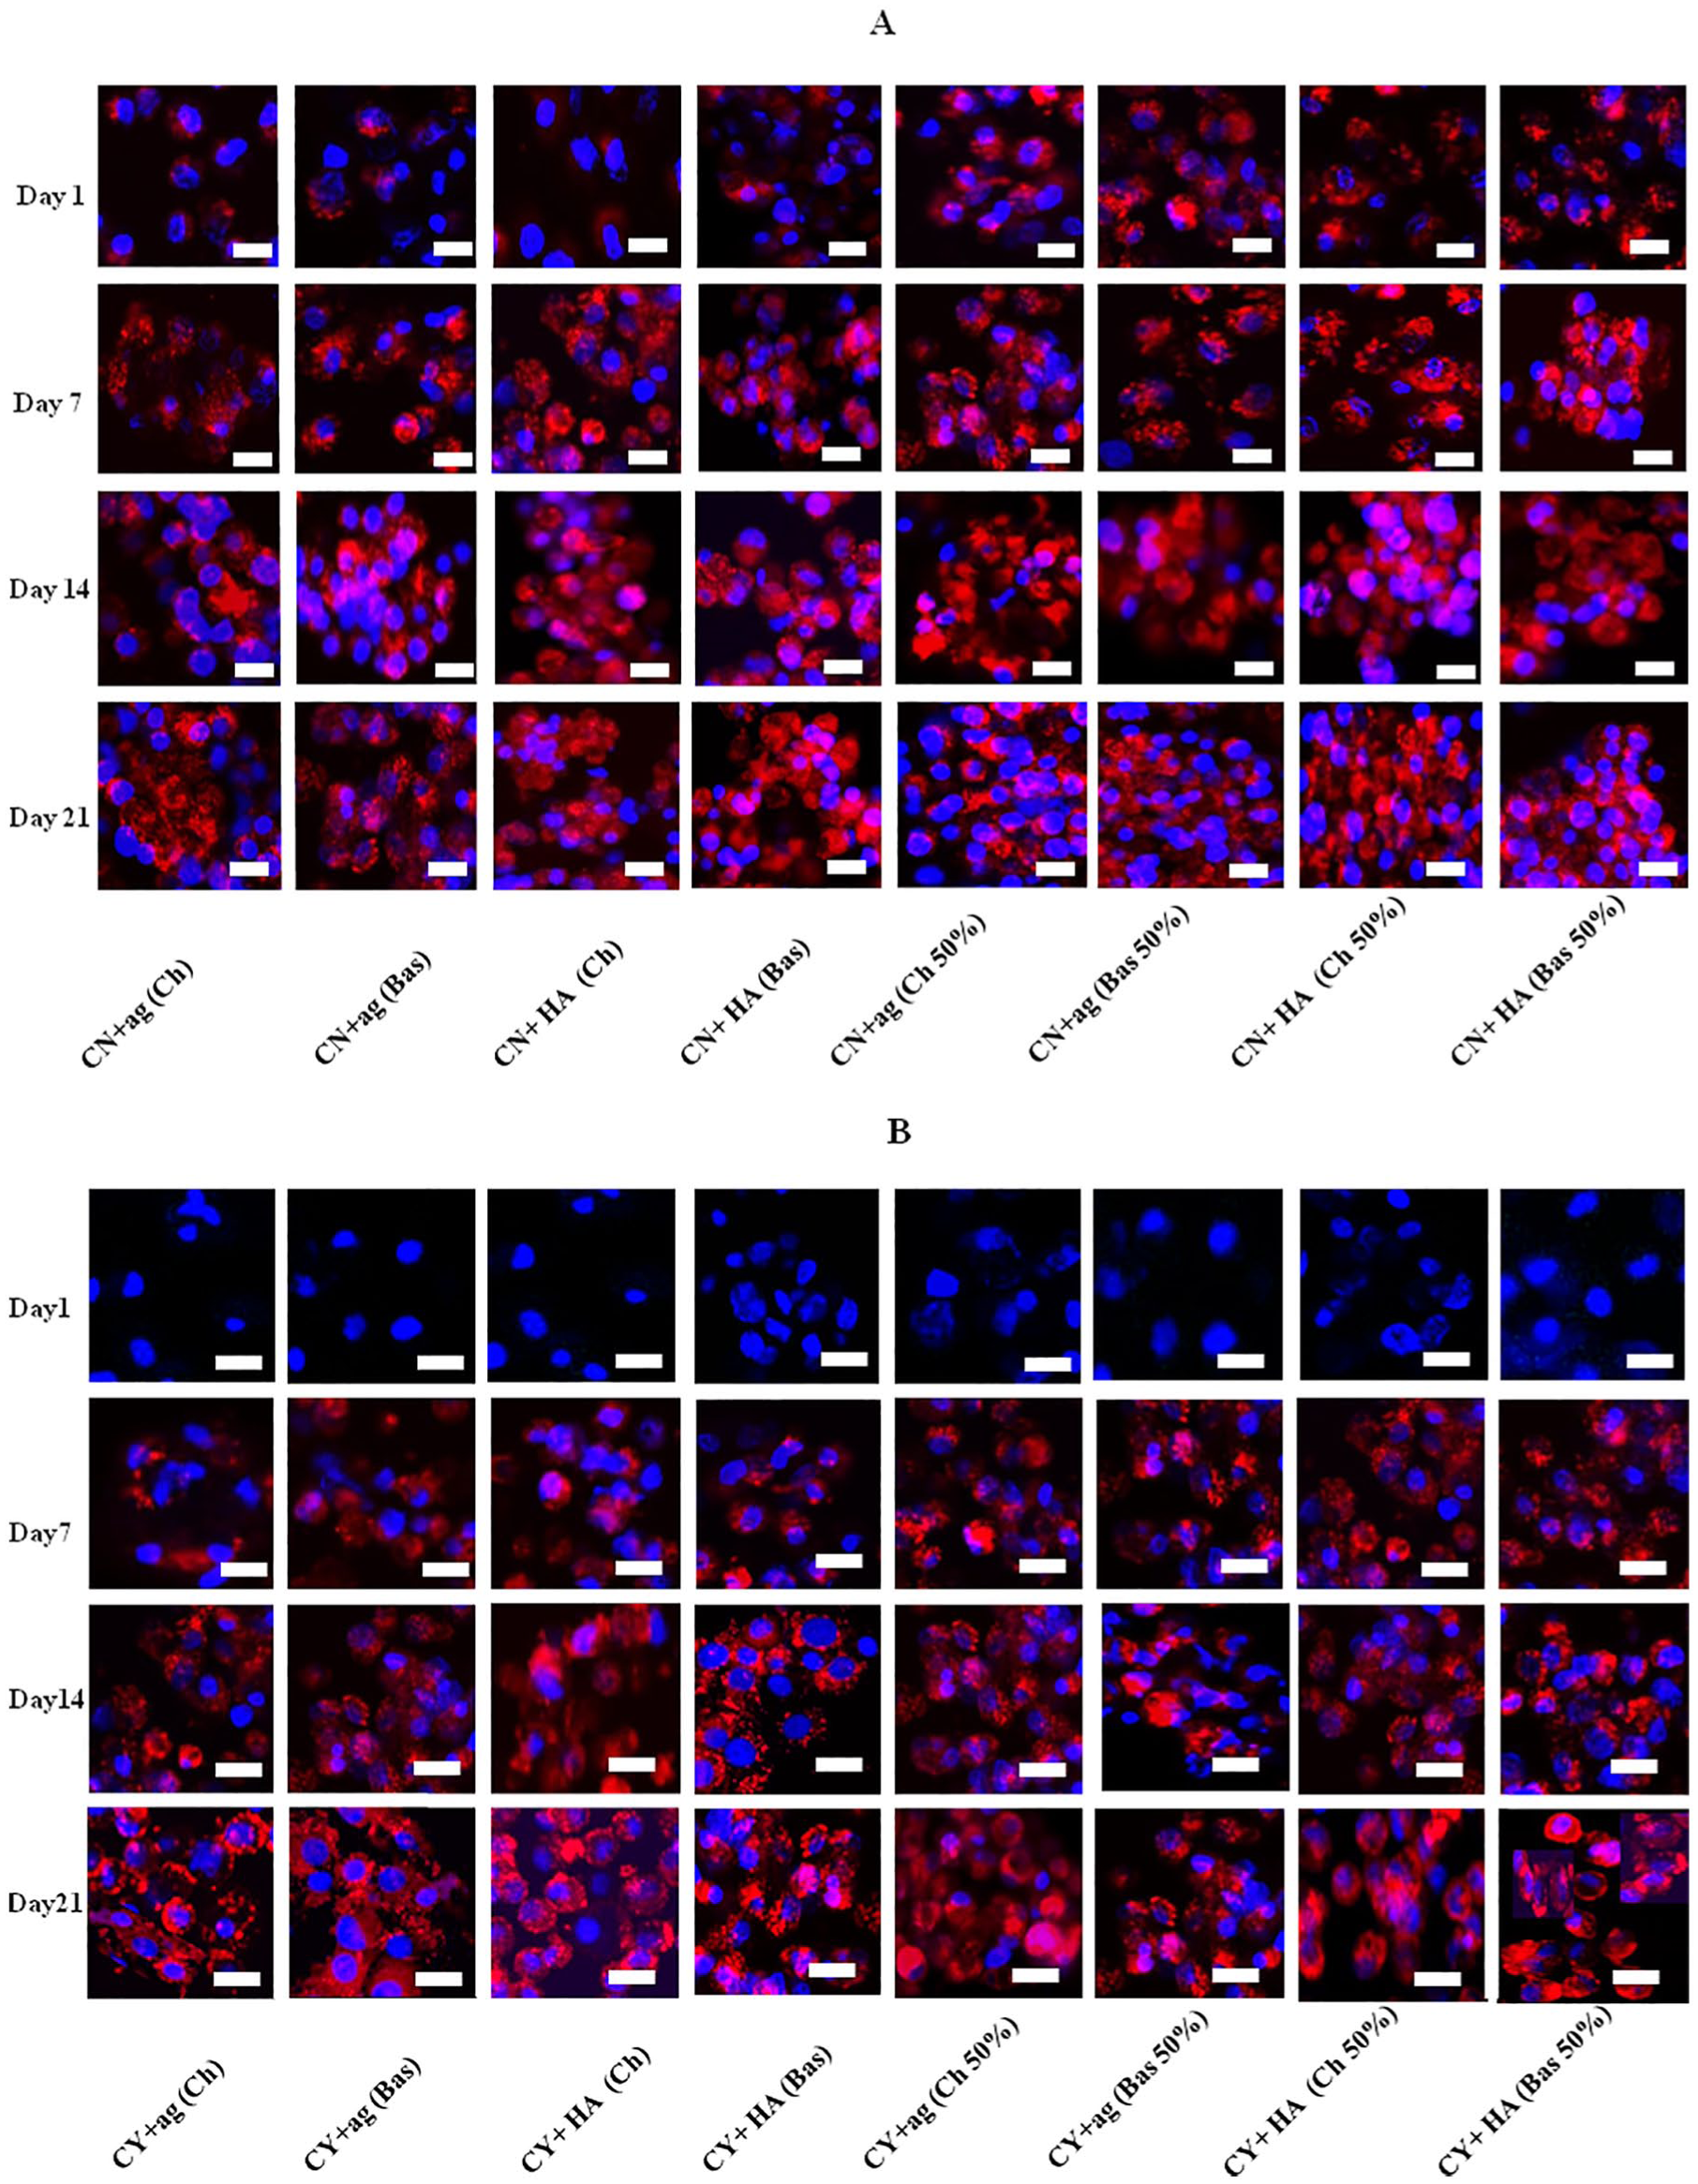
Immunofluorescence staining was conducted to identify the PCM/ECM markers, type VI collagen and type II collagen, in the mono- and co-cultures samples with different culture conditions at different time points. Figure 5 demonstrates collagen VI expression. It is clear that type VI collagen staining intensity and morphology was strongly dependent on whether the initial cells were chondron or chondrocytes. In chondron monocultures, type VI collagen was presented and located around the cells from day 1 through whole culture period; but there was slight variation during the culture and reduction at the 21-day culture in agarose hydrogel. While for chondron co-culture with MSCs at days 7, 14, and 21, there were no significant differences from the day 1 expression. Culture conditions did not impact upon the results. Type VI collagen staining was intense, homogeneous in close proximity to each cells within all chondron groups.
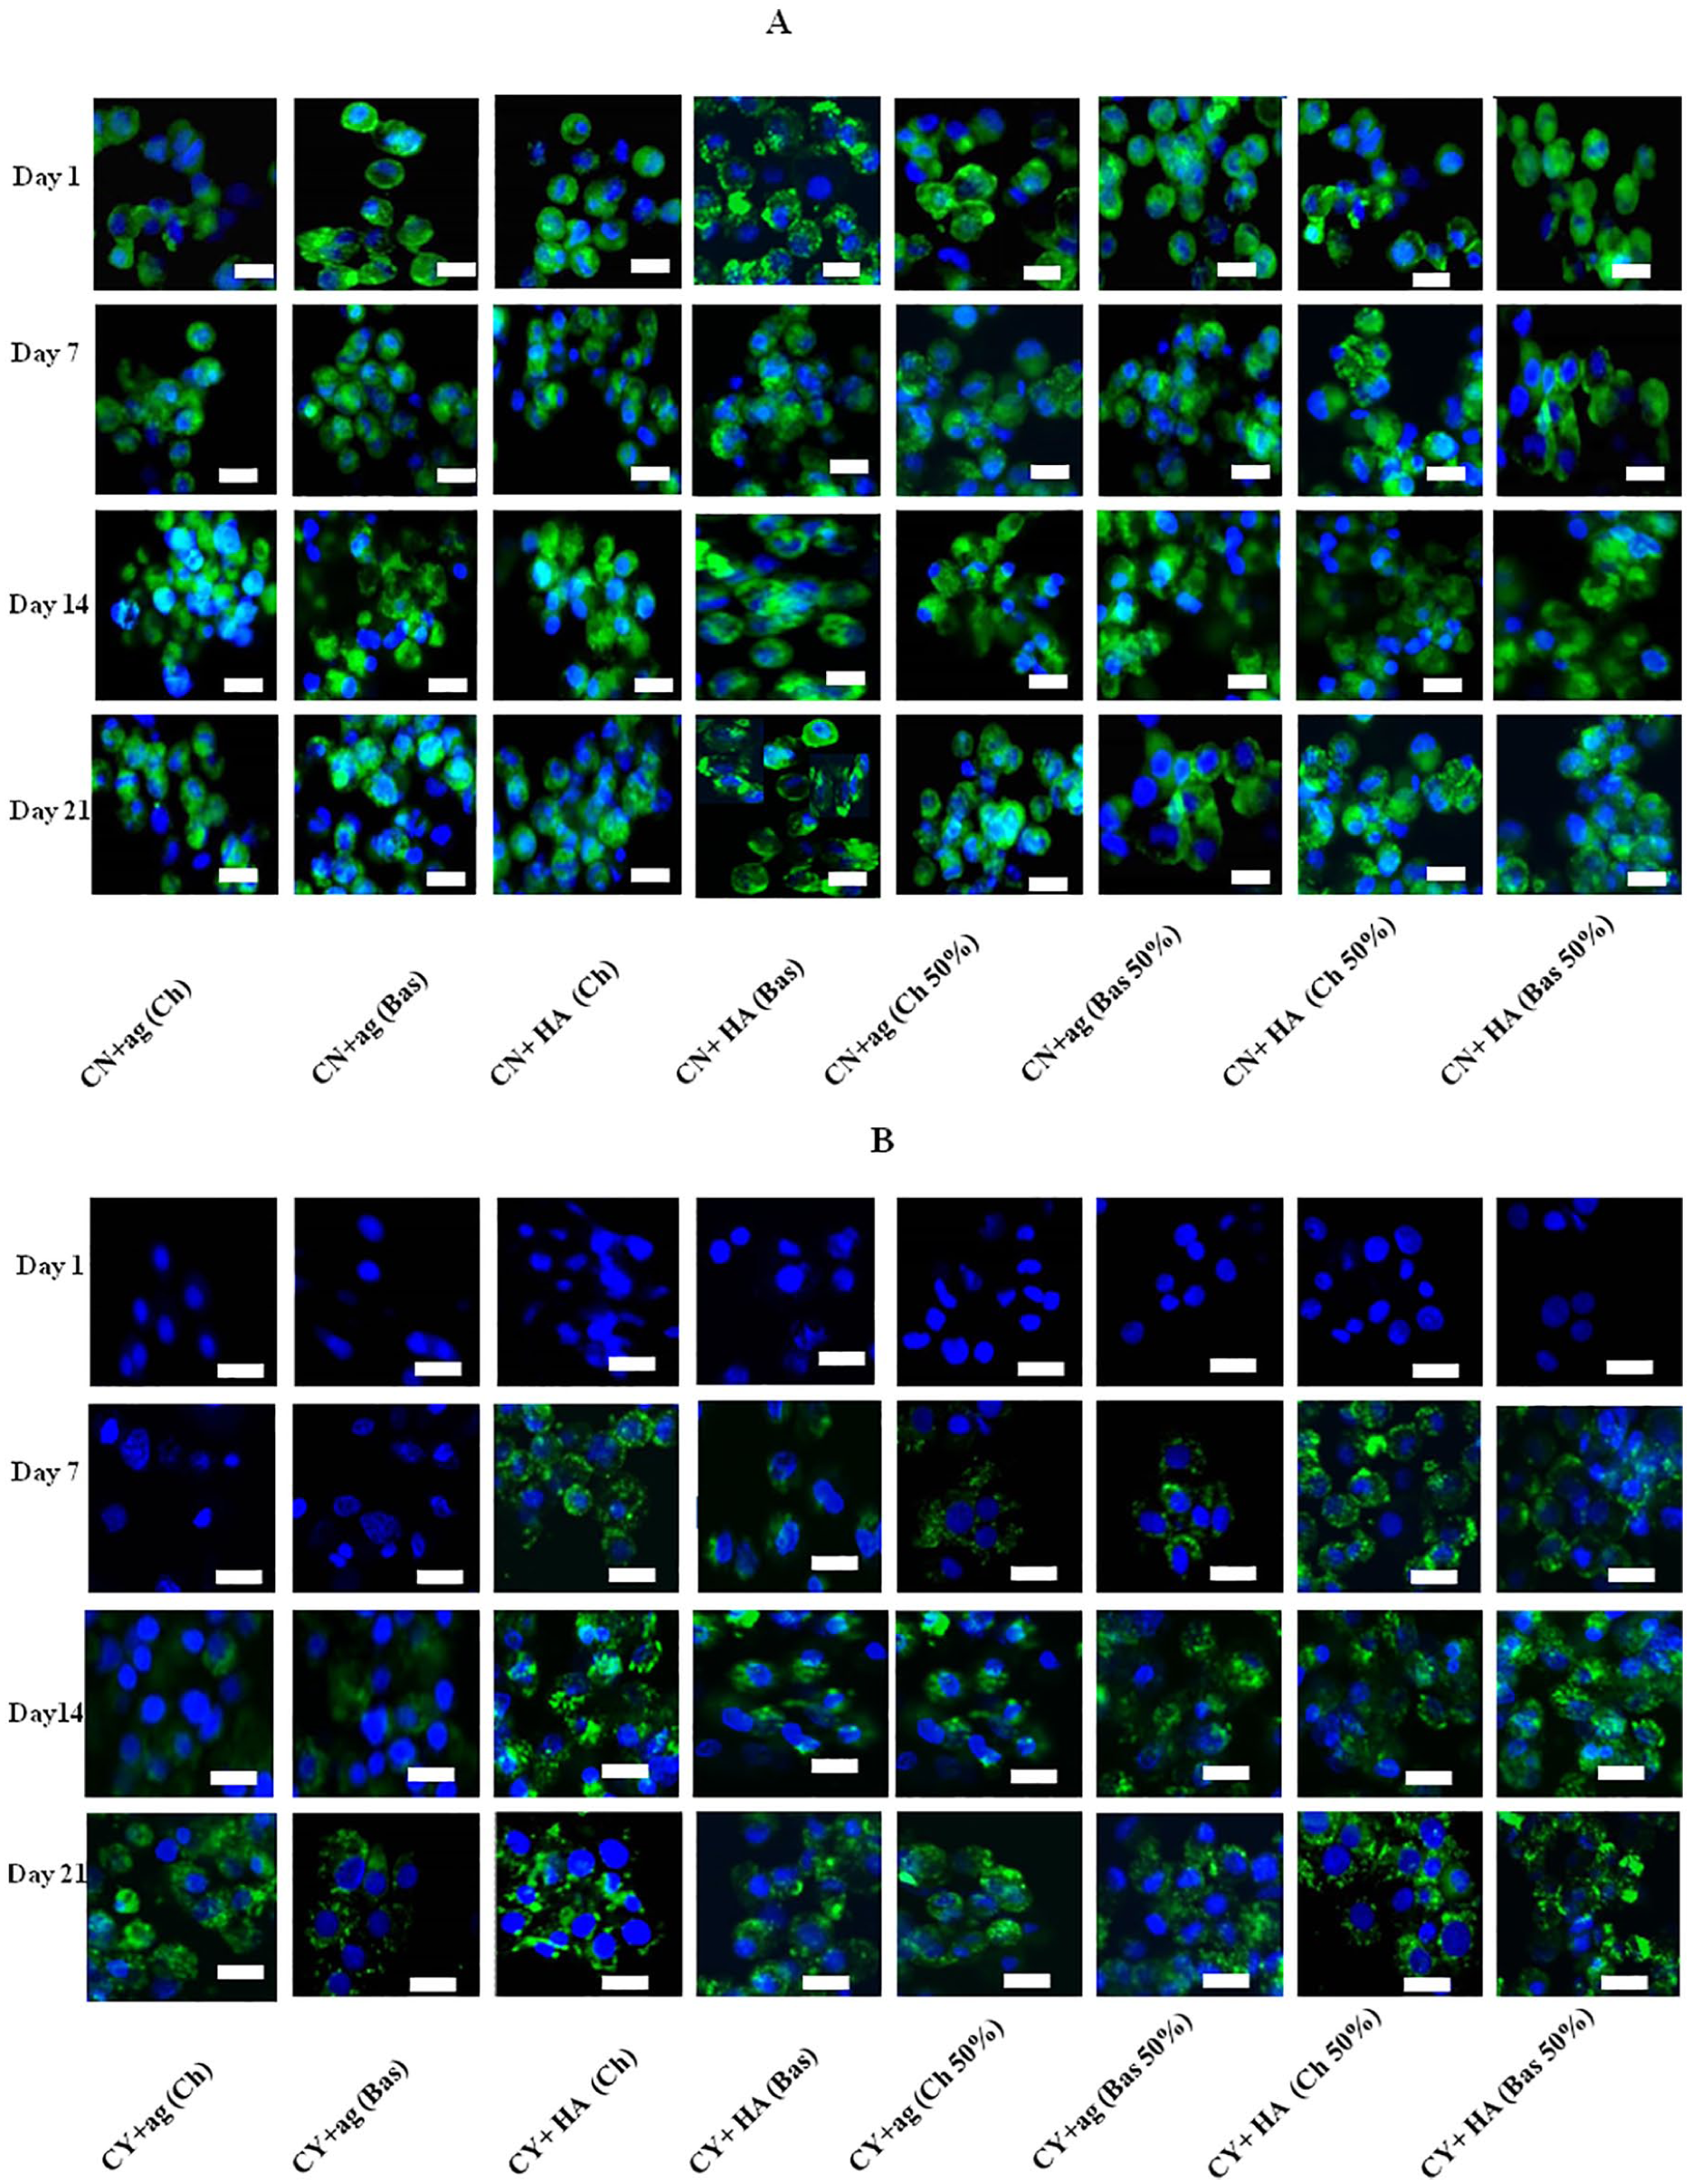
Representative collagen VI immunofluorescent staining in mono- and co-cultures within hyaluronic acid (HA) and agarose (ag) hydrogels under chondrogenic (Ch) and basal (Bas) media with 50% MSCs at days 1, 7, 14, and 21 with 50% MSC. (
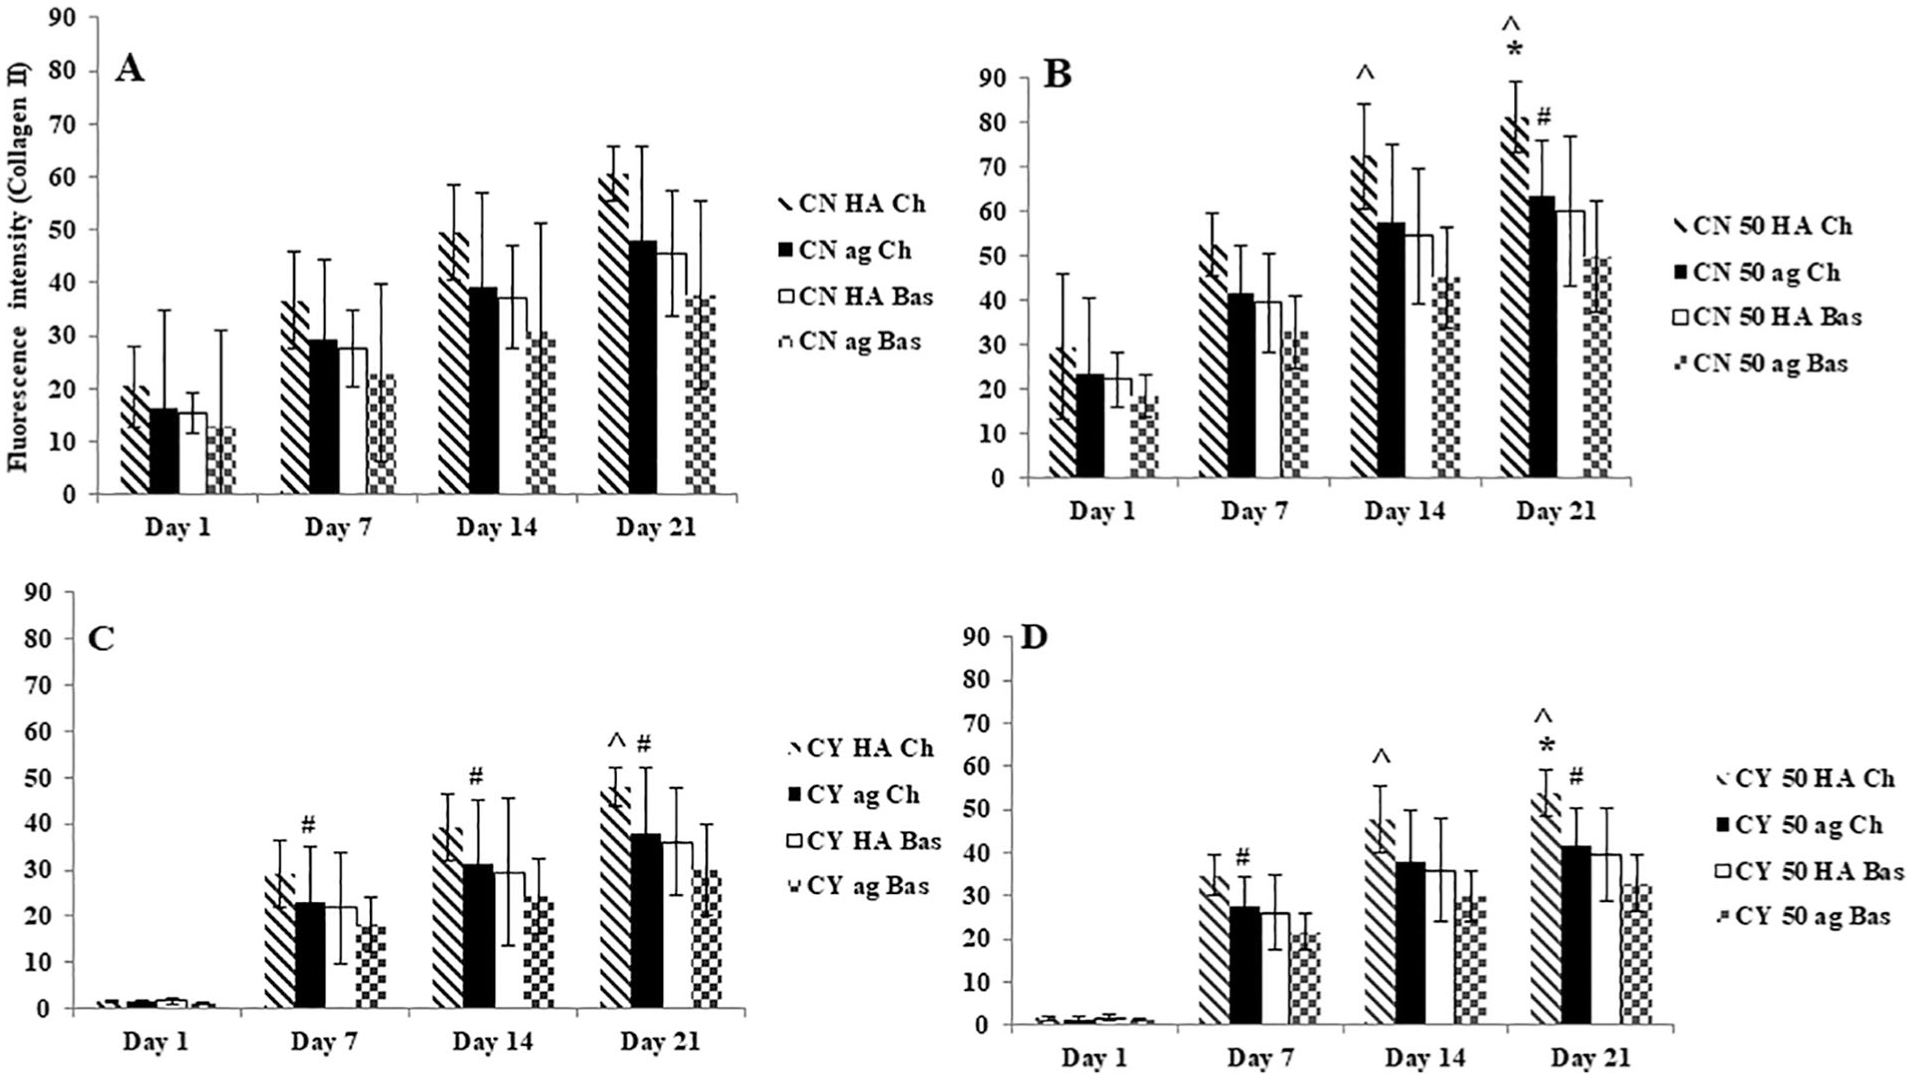
For chondrocytes in monoculture collagen VI was not apparent at day 1 at all conditions. Type VI collagen was detected at day 7 within the HA hydrogel. It became apparent that cell surfaces were stained positively for type VI collagen at day 14 under agarose hydrogel. Co-culture of MSC and chondrocytes increased overall type VI collagen expression level; most important, the samples in all conditions expressed type VI collagen from day 7 including under agarose gel condition. The expression of type VI collagen increased in all conditions along culture time with HA condition showing the highest type VI collagen. By the end of the culture period (3 weeks), the presence of a clear type VI collagen stained region surrounding the chondrocytes with a little difference between mono- and co-cultures and between HA and agarose hydrogels was obvious. Furthermore, the morphology of type VI collagen staining around chondrocytes was quite different to that around chondrons. The newly formed type VI collagen demonstrated fragmented and spotting appearance, which was distinct from that of native type VI collagen. The semiquantification of staining intensity correlated well with staining imaging of the type VI collagen expression ( Fig. 6 ).
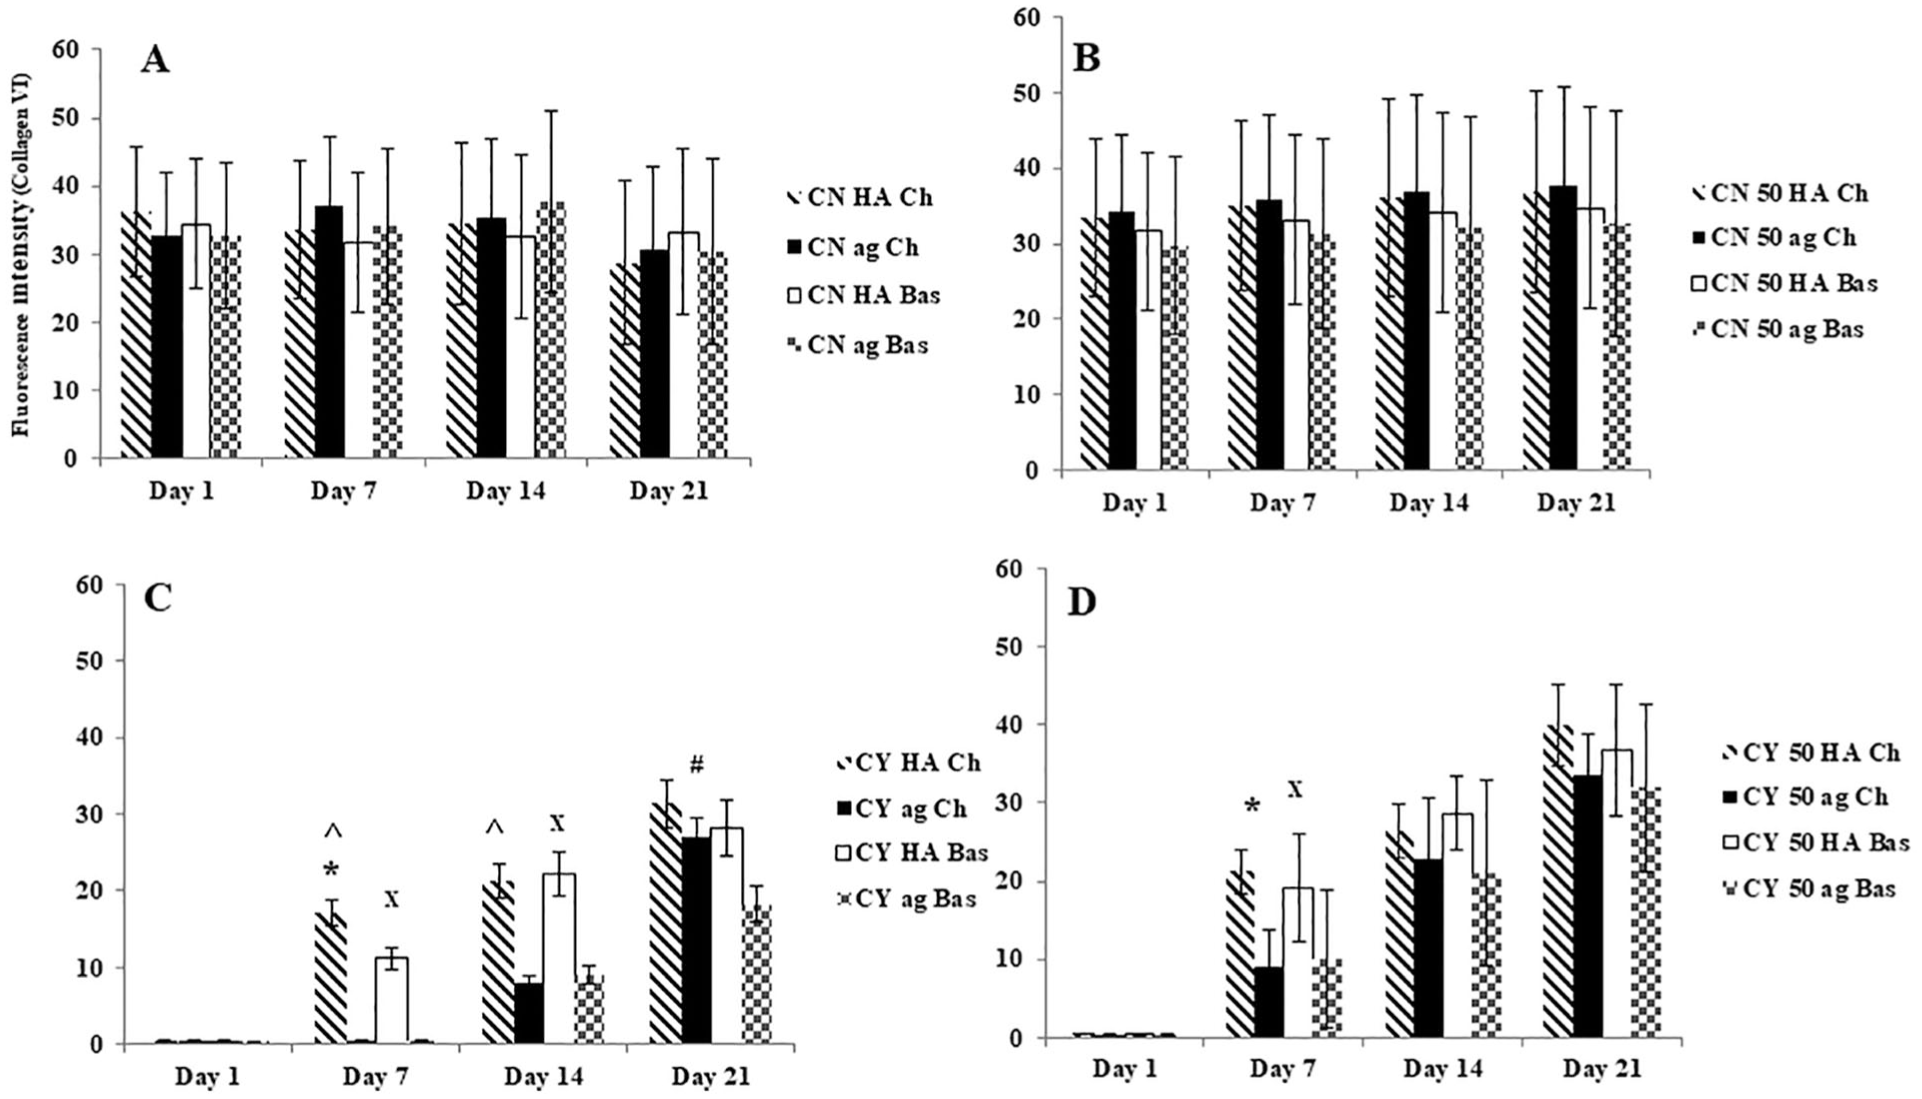
Semi-quantification of collagen VI immunofluorescent staining intensity in (
Both chondron and chondrocyte in mono- and co-cultures showed staining for type II collagen ( Fig. 7 ) under all different culture conditions and at all time points. There was different staining intensity of type II collagen within HA hydrogel and agarose in mono- and co-cultures but the difference was not significant. Culture within the HA hydrogel generated more abundant type II collagen than culture within agarose. Furthermore, chondrogenic media demonstrated expression enhancement for type II collagen with higher fluorescent staining than basal media. It was revealed that the staining for type II collagen in 50% chondron: MSC co-cultures were more intense than in monocultures for both chondron and chondrocytes, with chondron co-culture expressing higher value. Semi-quantification of the type II collagen staining intensity across the groups and culture time by ImageJ Analysis software is shown in Figure 8 .
Representative collagen type II immunofluorescent staining in mono- and co-cultures within hyaluronic acid (HA) and agarose (ag) hydrogels and chondrogenic (Ch) and basal (Bas) media at days 1, 7, 14, and 21 with 50% MSCs. (
Semi-quantification of collagen II immunofluorescent staining intensity in (
Discussion
Unlike other cell types, native chondrocytes are surrounded by thin layer of the PCM which bridge chondrocytes to ECM. The abnormality of PCM has been proposed to examine the relative health and turnover of cartilage matrix. 3 It has been reported when chondrocytes lose the ability to interact with their surrounding matrix via type VI collagen, such as in osteoarthritis, chondrocytes expressed more type VI collagen, 33 which implies that chondrocytes have a strong capacity to restore their PCM to rebuild the signaling pathways to ECM once 3D chondrogenic environment is present. To test this hypothesis, we utilized 3D HA and agarose hydrogel with 2 defined culture conditions to investigate PCM regeneration. Our first finding was that both HA and agarose hydrogel systems maintained the morphology of the cells and supported the deposition of ECM and PCM, and the HA hydrogel supported greater chondrogenic potential than agarose hydrogel. Our second finding was that co-culture MSCs with both chondron and chondrocytes had a higher chondrogenic capacity in comparison with their monoculture in 3D hydrogel conditions. Our third finding was that the chondrogenic culture media enhanced the expression of cartilage-specific ECM markers in comparing with basal media but both of them had no preferred effect on PCM marker “type VI collagen” synthesis.
Chondrocytes in native articular cartilage tissue demonstrated round-shape morphology and clustered in small groups. 1 Several groups have reported that maintaining the round and clustered cell morphology for chondrocytes is essential for chondrogenic expression. Furthermore, the environment that can store and accumulate newly produced chondrogenic products from chondrocytes is required as well. The highly hydrated ECM in native cartilage perfectly plays the 2 roles for chondrocytes. Thus, the highly hydrated 3D hydrogels that bear similar chemical and physical structure as the native ECM are frequently selected as 3D matrix to mimic the ECM in native cartilage13,14 for regeneration of cartilage. We compared 2 types of highly hydrated hydrogels in this study. Agarose is a “biologically inert” yet permissive matrix for chondrogenic expression. 34 It is the widely and early used hydrogel in this purpose. A specific subset of known integrins is produced by each cell type, which controls the interactions between the cells and their microenvironment. 35 Agarose hydrogel has no cell adhesion motifs to support direct cell anchorage and its highly hydration feature prevents the absorption of adhesive proteins from the environment. 36 Thus, agarose becomes a simple 3D matrix. Its chondrogenic effect is largely through maintaining the round shape of chondrocytes for prolonged culture or encapsulation of chondrocytes with less or nonbiological interaction with chondrocytes. HA is a highly hydrated hydrogel found natively in cartilage tissue. 16 HA is known to interact with chondrocytes via various surface receptors including CD44. 16 It has been confirmed that during cell mitosis, a thin pericellular layer rich in HA is secreted by cells, which mediates their detachment from the ECM and promotes cell rounding 37 and the chondrocyte CD44 receptor interacts with secreted HA chains, keeping the cells surrounded by a gel-like environment that is crucial for maintaining the differentiated phenotype. 38 Thus, the water-swollen networks of HA provide a local signal microenvironment to cells and serve as a permeable matrix for the diffusion of soluble factors because HA can bind proteins and other cytokines.
In this study, both hydrated hydrogels (HA and agarose) maintained round and cluster cell morphology of chondrocytes, supported the deposition of cartilage-specific matrix markers including GAGs, type II collagen, and promoted rebuilding cartilaginous-like ECM, but HA hydrogel culture had higher chondrogenic potency than agarose hydrogel culture in all culture conditions in terms of more accumulated GAG and type II collagen production (13% and 10% more in GAG and type II collagen, respectively, for chondrocytes samples at day 21), which confirms that maintaining of cell morphology only is not sufficient to achieve high chondrogenic potential. Also, our results confirmed ( Fig. 1 ) that the stiff agarose (2%) did not promote chondrocyte proliferation, which is in agreement with previous studies. 39
The influence of different hydrogels on the PCM regeneration was clear. Our results showed that the formation of PCM was hydrogel type dependent and a dynamic process. Culture within the HA hydrogel displayed the presence of collagen VI after 7 days in both mono- and co-cultures with speckled stripe structures surrounding the chondrocytes. Culture within the agarose hydrogel took up to 2 weeks to restore the PCM. By 14 days, type VI collagen staining was present in all 3D cultures. The increased ECM production (higher GAG and collagen II) in the HA hydrogel (as shown in Fig. 5 ) may synergistically promote PCM production. Morphologically, chondrons demonstrated dense and homogenous collagen VI staining, while staining for chondrocytes was spotted and thinly deposited. This study clearly showed that the chemical and biological properties of the hydrogel substantially affects both the quantity and quality of ECM and PCM regeneration.
Our data indicated that the deposited PCM seemed to accelerate further PCM formation. Further PCM maturation takes longer than 3 weeks under current conditions. It has been reported type VI collagen regeneration is a slow process, requiring time to accumulate the protein. 17 Chang and Poole 15 observed a narrow ring of type VI collagen around the cells after 7 days when chondrocytes were cultured in agarose hydrogel, and an 11-week period was needed to remodel into a mature and native-like PCM. To confirm VI collagen present in chondron, Vonk et al. compared chondron with chondrocytes culture. They found that in the chondrons, the type VI collagen was traced around the cells along culture duration. Some type VI collagen was found around the chondrocytes after 25 days of culture in alginate beads, but chondrocytes had a smaller amount of type VI collagen than that found around the chondrons. 6
In vitro expanded chondrocytes are still the first source of cells to be used to repair small focal cartilage defects, but they are not necessarily the ideal form of the cell or cell type for native cartilage formation. This is an even bigger issue when we consider large, full depth defects repair. The presence of intact and mature PCM is crucial for many functions of cartilage including ECM formation.11,40 Adding exogenous growth factors such as TGF-β to induce autologous MSCs to cartilage has revealed adverse hypertrophic phenotype. 41 This study demonstrated that in 3D culture environment, HA and agarose hydrogels can regenerate PCM in chondrocytes within 3 weeks culture. We also sought an acceleration strategy for PCM regeneration through co-culture chondrocytes with MSC without addition of growth factors. A beneficial effect of higher and faster PCM production has been evident, especial for agarose culture condition in which type VI collagen production was detected from day 7 instead of day 14 in monoculture condition. On the other hand, there were no significant differences for chondron co-culture with MSCs at days 7, 14, and 21 and in comparison to mono chondron culture. In all cultures, type VI collagen staining was intense, homogeneous in close proximity to each cell within all chondron groups from the day 1 expression.
A few mechanisms or pathways could be proposed to explain the role of MSC in co-culture for promotion of PCM production. The widely accepted mechanism is the paracrine effect of MSCs. Wu et al. 42 have identified FGF as the main MSC secreted growth factor that is responsible for a trophic effect of MSCs on the chondrocytes rather than the differentiation of MSCs into chondrocytes in MSC-chondrocytes co-culture. The group also detected upregulated BMP-2 expression in chondrocytes that has been induced by the MSCs in co-culture. Both BMP-2 and FGF-1 have been reported to have important roles in both chondrocyte proliferation and ECM formation.43,44 Another study demonstrated that articular chondrocytes secreted parathyroid hormone-related protein, which can inhibit hypertrophy of chondrocytes or MSCs during chondrogenesis. 45 Thus, the MSCs mediated a paracrine effect on chondrocytes through growth factor secretion or cell-to-cell interaction, upregulating the cartilaginous phenotype of chondrocytes. These secreted growth factors and cytokines from MSCs and chondrocytes mutually interacted. Most notably, the chondrogenesis effect of MSCs only works when combining with 3D culture environment. Our previous 2D co-culture model demonstrated that MSC could not maintain chondrogenic phenotype of chondron and PCM (type VI collagen) lost from chondron culture by day 5, 9 implying that the newly formed growth factors and cytokines have to be anchored to solid matrix and accessible to associated cells closely.
In order to enhance the chondrogenic capacity, the catabolic and anabolic processes of chondrocytes are known to be influenced by a defined medium of several growth factors which stimulate ECM production and promote the chondrogenesis of MSCs. 46 There is no report whether the PCM integrity and production are affected by different culture medium, especially with respect to synthesis of type VI collagen if it is with aggregate culture within biomimic gel and presenting MSC. In this study, chondrogenic media showed enhancement in cartilage-specific matrix markers, that is, GAGs and type II collagen production using both hydrogels types and in both mono- and co-cultures in comparison to basal media (11.5% and 14% more) in GAG and type II collagen for chondrocytes samples at day 21, respectively ( Figs. 2 and 8 ), but both of mediums types had no influence in type VI collagen syntheses. We speculate that chondrogenic media used in this study only supplemented with specific growth factors influencing on GAG and type II collagen production but containing less specific stimulators on type VI collagen synthesis.
The total sGAG were similar between chondrocytes and chondrons cultured within the same type of gels and culture medium. This implied that both HA and agarose can maintain a chondrogenic environment. Furthermore, the co-culture of chondrons with MSCs increased sGAG deposition than for the co-culture of chondrocytes ( Fig. 2 ). The underlying mechanism could be via trophic factors secreted by MSCs and the positive effect conveyed by the PCM 9 .
Conclusion
This work showed that 3D culture environment is the primary and essential condition to maintain the chondrogenic phenotype and regenerate PCM (type VI collagen) in in vitro culture. Both HA and agarose preserved PCM in chondron from day 1 up to 21 day culture. The appearance of type VI collagen in the cultured chondrons was dense and homogenous; and co-culture with MSCs did not affect much the appearance and density of type VI collagen. The generation of PCM in chondrocytes was time and culture condition dependent. In the HA cultures, PCM was observed after 7 days in both mono- and co-cultures with speckled stripe structures surrounding the chondrocytes surface. The cultures required 2 weeks to restore the PCM. For agarose cultures, a distinct and focused stippled pattern of staining was visible around the chondrocyte after 7 days in co-cultures and after 14 days in monocultures. The PCM was restored after 3 weeks. Thus, the presence of MSCs led to the preservation and maturation of PCM integrity. Furthermore, chondrogenic culture media enhanced the expression of cartilage-specific ECM markers in comparing with basal media but both of them had no preferred effect on PCM marker, type VI collagen synthesis.
Supplemental Material
S1_1 – Supplemental material for Maintenance and Acceleration of Pericellular Matrix Formation within 3D Cartilage Cell Culture Models
Supplemental material, S1_1 for Maintenance and Acceleration of Pericellular Matrix Formation within 3D Cartilage Cell Culture Models by Hamza A. Owida, Nicola L. Kuiper and Ying Yang in CARTILAGE
Supplemental Material
S2 – Supplemental material for Maintenance and Acceleration of Pericellular Matrix Formation within 3D Cartilage Cell Culture Models
Supplemental material, S2 for Maintenance and Acceleration of Pericellular Matrix Formation within 3D Cartilage Cell Culture Models by Hamza A. Owida, Nicola L. Kuiper and Ying Yang in CARTILAGE
Supplemental Material
S3_2 – Supplemental material for Maintenance and Acceleration of Pericellular Matrix Formation within 3D Cartilage Cell Culture Models
Supplemental material, S3_2 for Maintenance and Acceleration of Pericellular Matrix Formation within 3D Cartilage Cell Culture Models by Hamza A. Owida, Nicola L. Kuiper and Ying Yang in CARTILAGE
Footnotes
Supplemental Material
Acknowledgments and Funding
The author(s) received no financial support for the research, authorship, and/or publication of this article.
Declaration of Conflicting Interests
The author(s) declared no potential conflicts of interest with respect to the research, authorship, and/or publication of this article.
Ethical Approval
Ethical approval was not sought for the present study because there was no patients’ samples or live animal experiments involvement.
Animal Welfare
The present study followed international, national, and/or institutional guidelines for humane animal treatment and complied with relevant legislation.
References
Supplementary Material
Please find the following supplemental material available below.
For Open Access articles published under a Creative Commons License, all supplemental material carries the same license as the article it is associated with.
For non-Open Access articles published, all supplemental material carries a non-exclusive license, and permission requests for re-use of supplemental material or any part of supplemental material shall be sent directly to the copyright owner as specified in the copyright notice associated with the article.