
Abstract
Objective
Both selenium (Se) deficiency and mycotoxin T2 lead to epiphyseal plate lesions, similar to Kashin-Beck disease (KBD). However, regulation of selenoproteins synthesis mediated by SECISBP2, in response to these 2 environmental factors, remained unclear. The present study proposed to explore the mechanism behind the cartilage degradation resulting from Se deficiency and mycotoxin T2 exposure.
Design
Deep chondrocyte necrosis and epiphyseal plate lesions were replicated in Dark Agouti (DA) rats by feeding them T2 toxin/Se deficiency artificial synthetic diet for 2 months.
Results
Se deficiency led to decreased expression of COL2α1, while T2 treatment reduced the heparan sulfate 6-O-sulfotransferase 2 (HS6ST2) expression, both of which affected the cartilage extracellular matrix metabolism in the rat models. The expression of Col2α1, Acan, Hs6st2, Secisbp2, Gpx1, and Gpx4 were all significantly decreased in cartilage tissues from DA rats, fed a Se-deficient diet or exposed to T2 toxin, contrary to Adamts4, whose expression was increased in both conditions. In addition, T2 treatment led to the decreased expression of SBP2, GPX1, GPX4, and total GPXs activity in C28/I2 cells.
Conclusion
DA rats exposed to T2 toxin and/or Se-deficient conditions serve as the perfect model of KBD. The 2 environmental risk factors of KBD, which serve as a “double whammy,” can intensify the extracellular matrix metabolic imbalance and the antioxidant activity of chondrocytes, leading to articular cartilage degradation and epiphyseal plate abnormalities similar to those observed in KBD.
Introduction
Kashin-Beck disease (KBD), an endemic chronic osteoarthropathy, is prevalent in the northern parts of China and relates to multiple environmental factors. 1 KBD is characterized by epiphyseal plate lesions, delayed skeletal development, secondary osteoarthritis, and even dwarfism and disability, disordered extracellular matrix (ECM) metabolism, and deep layer hypertrophic chondrocytes impairment of articular cartilage.2,3
Epidemiologically, T2 toxin (T2) exposure is implicated in the etiology of KBD.4-6 T2, one of the most important trichothecene mycotoxins, is produced by Fusarium, which is a fungus that contaminates grain crops stored under cold, damp conditions. 7 The wheat flour consumed by KBD families exhibited elevated T2 levels (range = 2.0-1549.4 µg/kg, mean = 468.7 µg/kg). 4 T2 downregulates aggrecan (ACAN), upregulates matrix metalloproteinases (MMP-1, MMP-13) and TIMPs, and disrupts chondroitin sulfate sulfation motif expression in articular cartilage, as reported by various studies using the rat models of KBD.8-10 Interestingly, the expression of heparan sulfate 6-O-sulfotransferase 2 (HS6ST2), an enzyme that transfers a sulfate group to the C-6 of the glucosamine residue in heparan sulfate, is significantly reduced in the cartilage of KBD patients 11 and osteoarthritis. 12 Furthermore, T2 induces the production of reactive oxygen species in chondrocytes and activates nuclear factor-κB (NF-κB) and hypoxia-induced factor-2α (HIF-2α) expression, a key mediator and transactivator of a series of catabolic genes in hypertrophic chondrocytes, 4 such as the Wnt/β-catenin pathway. 13 These reports indicated that T2 could cause ECM degradation and induce apoptosis in chondrocytes, both of which are implicated in the pathogenesis of KBD.
On the other hand, selenium (Se) supplementation can protect Se-deficient rats from epiphyseal plate lesions and has been used in the therapy of KBD, although its mechanism of action is not well understood.5,14,15 Selenium is an essential biological trace element and is incorporated into selenocysteine (Sec), which is the 21st proteinogenic amino acid. 16 Sec is required to form the active center of selenoproteins (Sel), which are named after selenium.16,17 Sec is encoded by the codon UGA, which can also act as a termination codon in cells.18,19 Thus, the biosynthesis of selenoproteins is regulated through several special cis-trans elements and trans-acting factors, particularly the selenocysteine insertion sequence (SECIS) and SECIS binding protein 2 (SECISBP2).20,21 SECIS is located within the mRNA 3′-untranslated region (3′-UTR) of Sel. During Sel synthesis, SECISBP2 can recognize and bind to SECIS, and recruits Sec-tRNASec, whose anticodon pairs with the UGA as the codon for Sec in the ribosomal “A site.”20,21 Selenium deficiency gives rise to the altered synthesis of several selenoproteins,22,23 which results in abnormal matrix metabolism in chondrocytes, articular cartilage degradation, and epiphyseal plate abnormalities, as observed in KBD. 14 However, the pathophysiology of secondary arthritis and selenium deficiency remains exceptionally obscure and must be investigated further.5,14,15
The present study aimed to reveal the pathological processes triggered by T2 exposure and/or selenium deficiency in the Dark Agouti (DA) rat cartilage, particularly in the epiphyseal plate. We established that selenoprotein expression in the epiphyseal plate was strongly inhibited by T2. Selenium deficiency and T2 exposure served as a “double whammy” and could intensify the imbalance of ECM metabolism and antioxidant activity, resulting in articular cartilage degradation and epiphyseal plate abnormalities similar to those observed in KBD.
Materials and Methods
Rats
Inbred DA rats were obtained from the Section of Medical Inflammation Research, Lund University, Sweden. They were bred and kept in a climate-controlled environment, housed in polystyrene cages containing wood shavings, and fed artificial, totally synthetic diets and sterile deionized water ad libitum in the SPF animal house of the Department of Biochemistry and Molecular Biology, Xi’an Jiaotong University Health Science Center.
Experimental Diets
The inbred DA rats were fed ad libitum with a totally artificial synthetic Se-deficient and/or T2-added diet that was based on the nutrition available to the people from KBD endemic areas. 4 All diets were prepared fresh every week to avoid freezing/thawing the prepared diet. Se contents were measured in the prepared diets to ensure that the Se intake from each diet was consistent with the experimental design. Notably, all diets were based on the Se-deficient diet; Na2SeO3 and/or T2 toxin (Sigma-Aldrich, St. Louis, MO, USA) were added as appropriate. The detailed formula of the basic synthetic diet is shown in Supplemental Tables S1, S2, and S3 as Burk RF Formula. 24 In addition, 4.5 mg fat-soluble T2 was mixed into 1 kg corn oil and added into the diet, making the final T2 concentration as 0.3 mg/kg. The diets were always prepared by the same personnel, and each diet was stored separately at −20°C.
Model Establishment
Forty rats, aged 10 to 12 weeks, were randomly divided into 4 groups with equal age and sex compositions. Each group included 5 male and 5 female rats. The Se-sufficient (SeS) group was fed for 2 months with the Se-sufficient diet as a control; the other 3 groups were fed a Se-deficient diet (SeD group), Se-sufficient and T2 diet (SeS-T2 group), or Se-deficient and T2 diet (SeD-T2 group).
At the end of the experimental period, the left lower limbs, including the femoral heads, were collected, and the muscle, periosteum, and connective tissue were removed. The bone tissues were subjected to histological examination by staining with Safranin O and fast green dye or hematoxylin and eosin (HE). The right femur heads were stored at −80°C for RNA isolation. The knee joints were well exposed to ensure successful fixation.
Detection of Selenium and Total GPx Activity
The Se contents in the diets and the sera of DA rats were measured by a fluorometric method, using a fluorescent atomic absorption spectrometry. 25 Plasma or chondrocyte total GPx activity was determined with the direct DTNB method.26,27
Appraisement of Epiphyseal Plate Chondrocyte Apoptosis
Epiphyseal plate morphology was observed by optical microscopy. The observed abnormal lesions could be divided into 3 types: “Necrosis or lack of columns,” “Necrosis or lack of flakes,” and “Chondrocyte clusters” 14 ; the categories were appraised by an Olympus image acquisition and analysis system (Olympus, Japan).
Cell Culture
C28/I2 cell line, human juvenile hypertrophic chondrocytes, was maintained in Dulbecco’s modified Eagle’s medium/F-12 medium (DMEM/F12, Hyclone, USA) containing 10% fetal bovine serum (FBS, Gibico, USA) in a humidified incubator with 5% CO2 at 37°C. Cells were cultured in 6-multiwell plates and inoculum size was 6 × 10⁴ cells/well in a 6-multiwell plate for RNA isolation and protein extraction. The medium was replaced every other day.
Total RNA Extraction and Quantitative RT-PCR Analysis
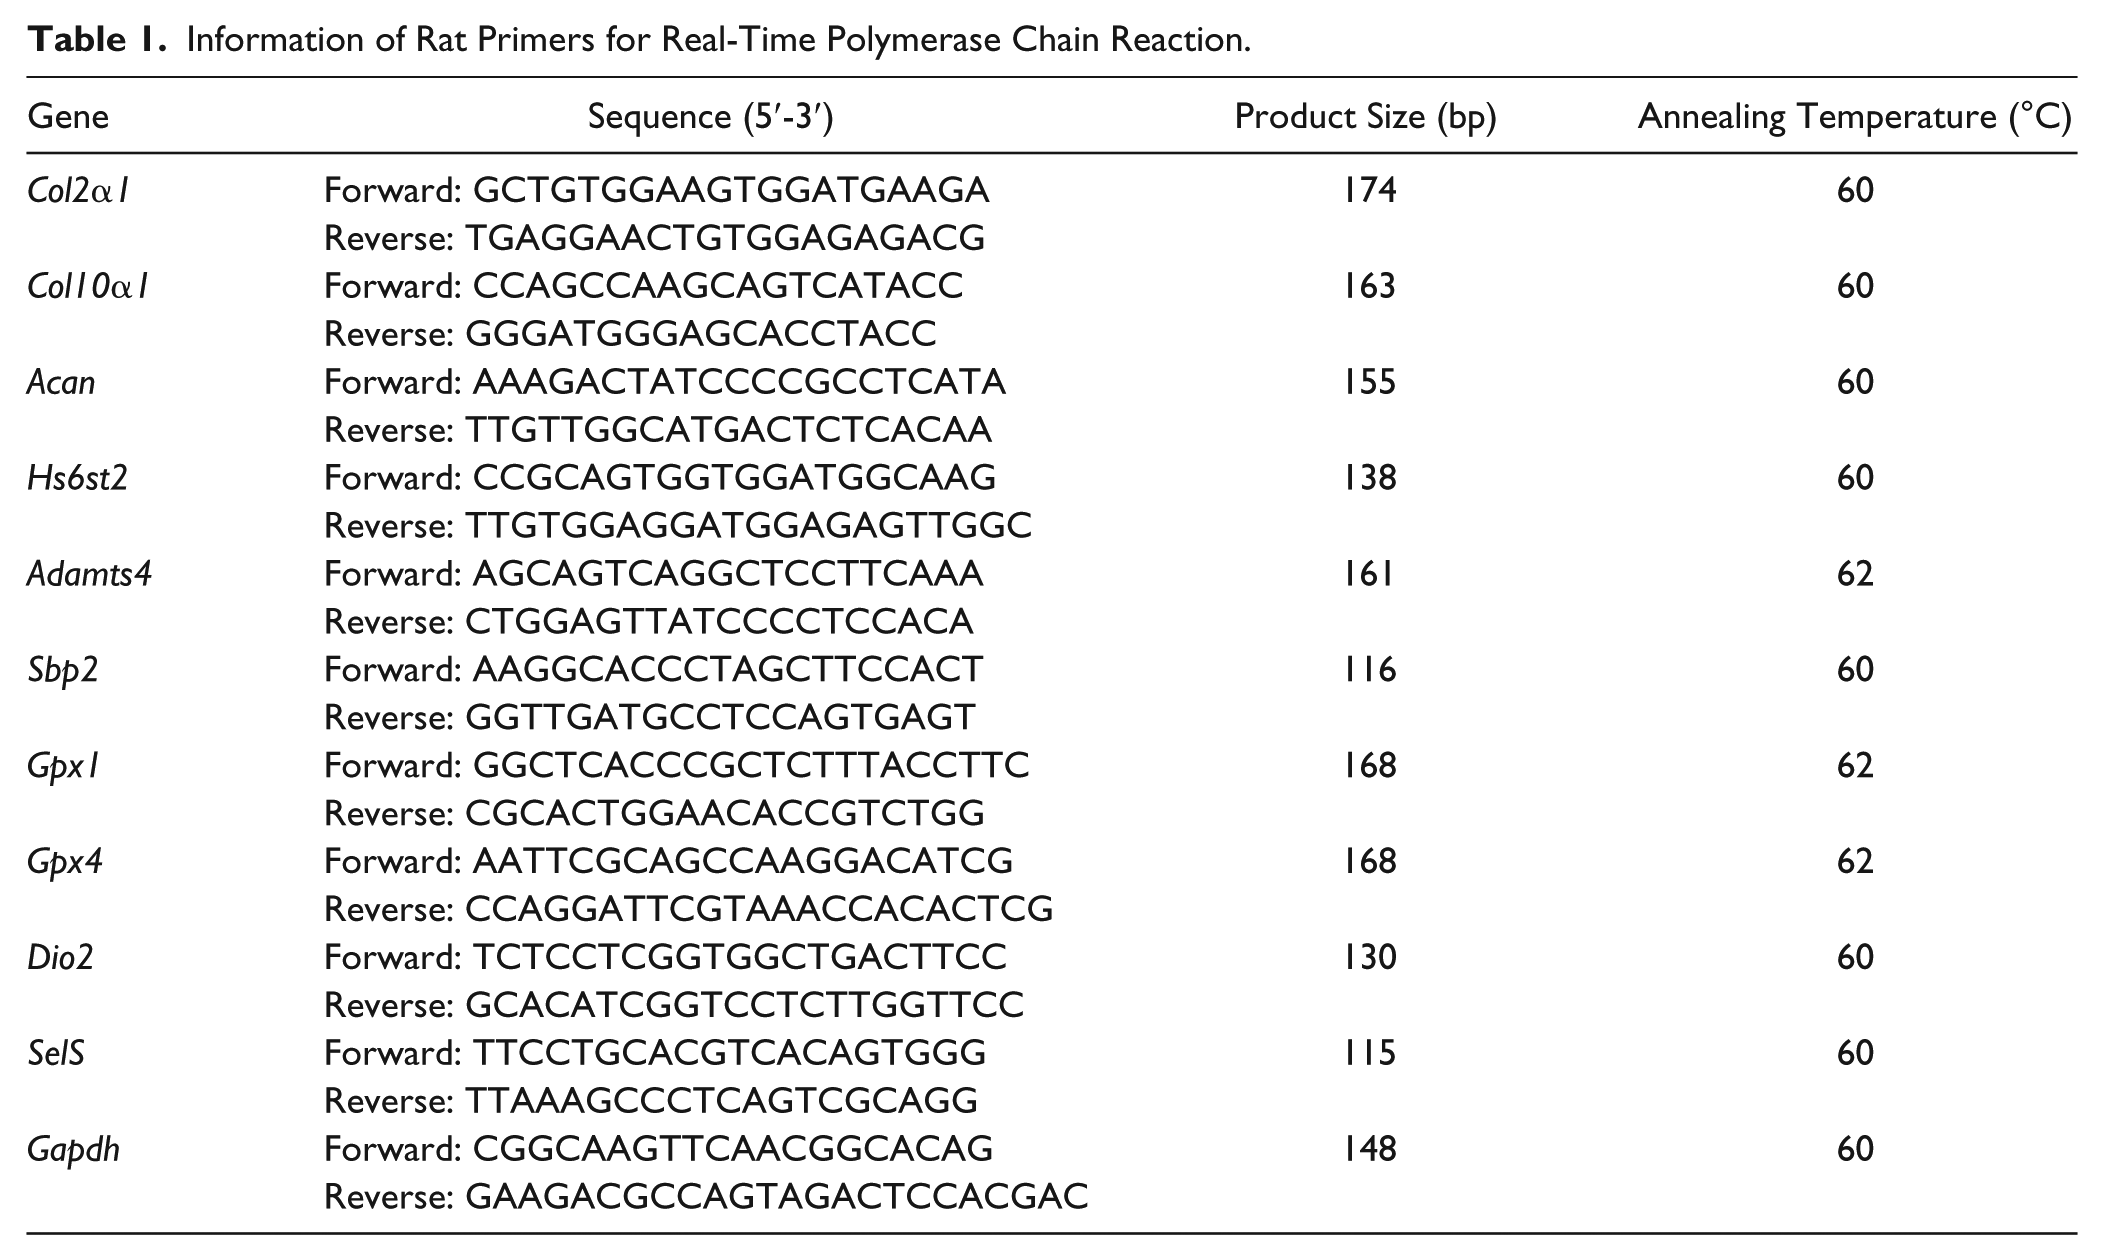
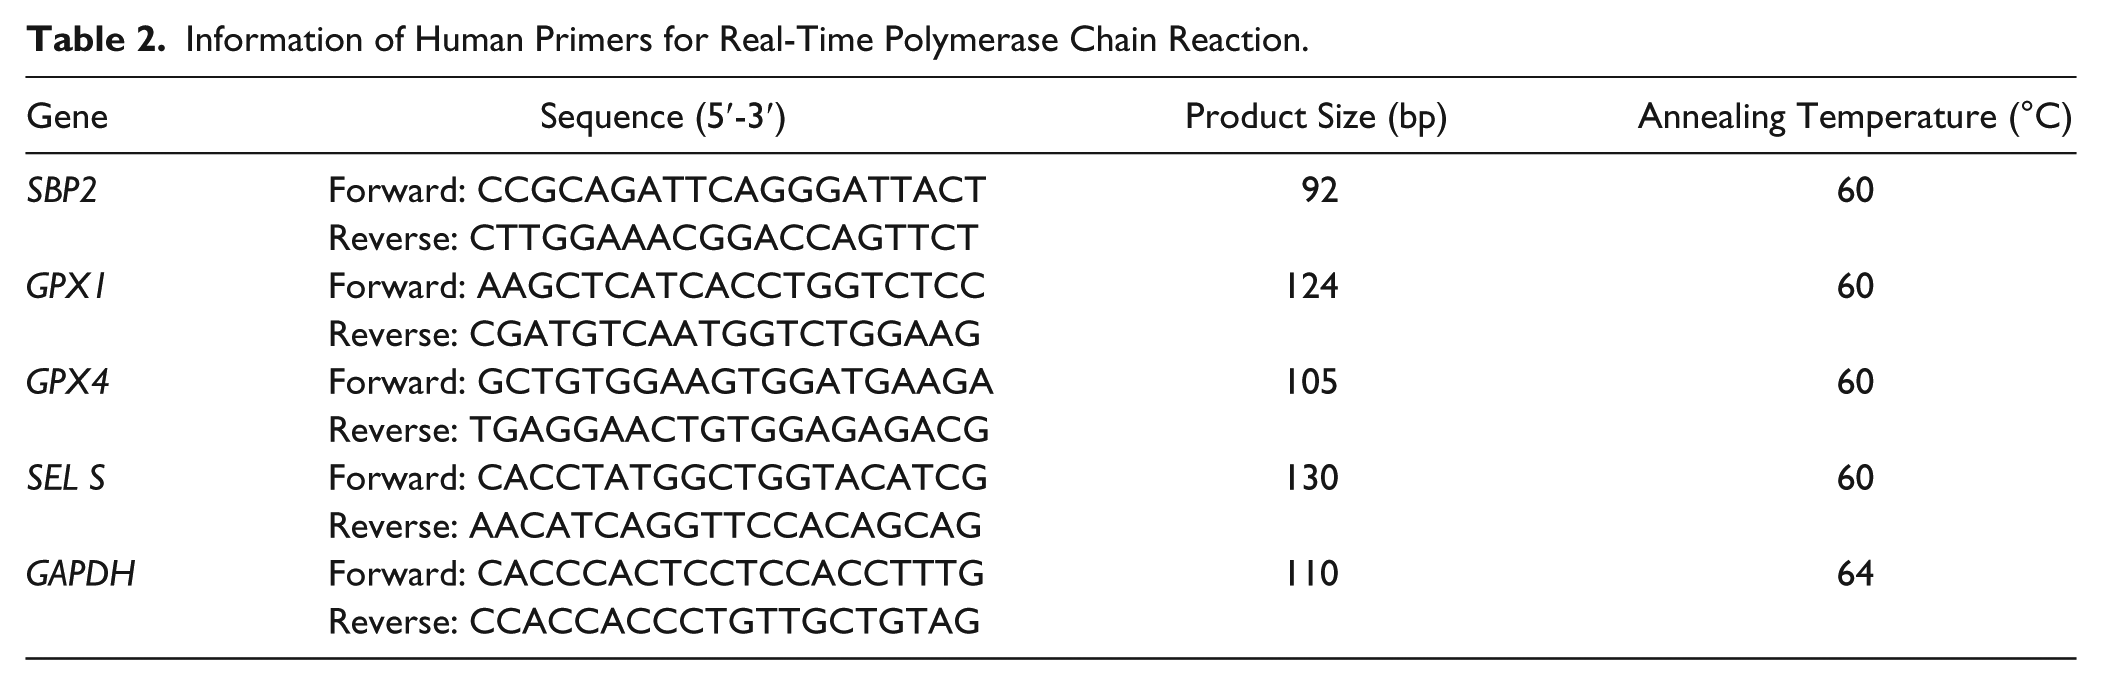
Total RNA was extracted from the cartilage or internal organ samples or cell line with TRIzol (Invitrogen, Carlsbad, CA) according to the manufacturer’s instructions. The cDNA was synthesized from 2 µg of total RNA in a 20 µL reaction volume by utilizing a reverse transcription kit (RevertAid; Fermentas, Canada) and stored at −20°C until use. The mRNA expression levels were determined by real-time polymerase chain reaction (qPCR), which was performed on an iQ5 real-time PCR detection system (Bio-Rad, Hercules, CA) with SYBR Premix Ex Taq II (TaKaRa, Japan). The RT-qPCR reactions contained 2 µL cDNA, 1 µL of each primer, and 5 µL 2× SYBR Premix. Each sample was run in duplicate, and the relative gene expression was normalized by Gapdh (rats) or GAPDH (humans). Primer information is given in Table 1 (rats) and Table 2 (humans).
Information of Rat Primers for Real-Time Polymerase Chain Reaction.
Information of Human Primers for Real-Time Polymerase Chain Reaction.
Immunohistochemistry (IHC) Staining
The femoral head and knee joint were fixed with 4% paraformaldehyde (PFA), gently decalcified in 10% EDTA buffer for 4 weeks, and subsequently embedded in paraffin and sectioned at 5 µm thickness. Then, the expression of COL2α1 and HS6ST2 in the epiphyseal plate and the expression of SECISBP2 and GPX1 in femoral surface cartilage were examined. After intrinsic peroxidase activity was blocked with 3% hydrogen peroxide (H2O2), the articular cartilage tissue specimen sections were incubated with 1.5% bovine serum albumin for 1 hour. The sections were incubated with anti-COL2α1 (1:200 dilution), anti-HS6ST2 (1:50 dilution), anti-SECISBP2 (1:250 dilution), and anti-GPX1 (1:250 dilution) antibodies, purchased from Epitomics (USA), in a humid chamber at 4°C. After 14 hours, the sections were rinsed with phosphate-buffered saline and sequentially incubated with biotinylated secondary antibody for 1 hour and DAB reagent (Boster, Wuhan, China) for 5 minutes at room temperature. Chromogenic reactions were terminated when “claybank-stained regions” were observed under the microscope. Rabbit IgG was used as a negative control.
Western Blotting
Total protein was isolated from rat articular cartilage or cell line. Protein samples were separated using 10% SDS-PAGE and transferred to PVDF membranes (EMD Millipore, Darmstadt, Germany). After blocking with 3% nonfat milk in TBST buffer, the membrane was incubated with primary antibodies, followed by horseradish peroxidase (HRP)-conjugated secondary antibodies. Blots were visualized using the ECL detection system (EMD Millipore, Darmstadt, Germany) on a chemiluminescence imaging platform. Antibody against SECISBP2 (12798-1-AP, 1:500 dilution) was obtained from Epitomics (USA). The GAPDH primary antibody (1:1000 dilution) and HRP-conjugated anti-rabbit (1:5000 dilution) and anti-mouse (1:5000 dilution) secondary antibodies were purchased from Beyotime Biotech (Jiangsu, China).
Statistical Analysis
Comparisons of macroscopic and microscopic scores were analyzed by the Mann-Whitney U test. The comparison of joint onset rate was analyzed by Fisher’s exact test. Quantitative data were expressed as mean ± SEM. The statistical analysis of differences between experimental groups was performed on at least triplicate samples. In all tests, a P value less than 0.05 (*P < 0.05 and **P < 0.01) was considered to indicate statistical significance. All analyses were performed using GraphPad Prism 6.0 software (GraphPad Software, San Diego, CA).
Results
Artificial Totally Synthetic Se-Deficient Diet Caused Se Insufficiency in DA Rats and T2 Aggravated This Insufficiency
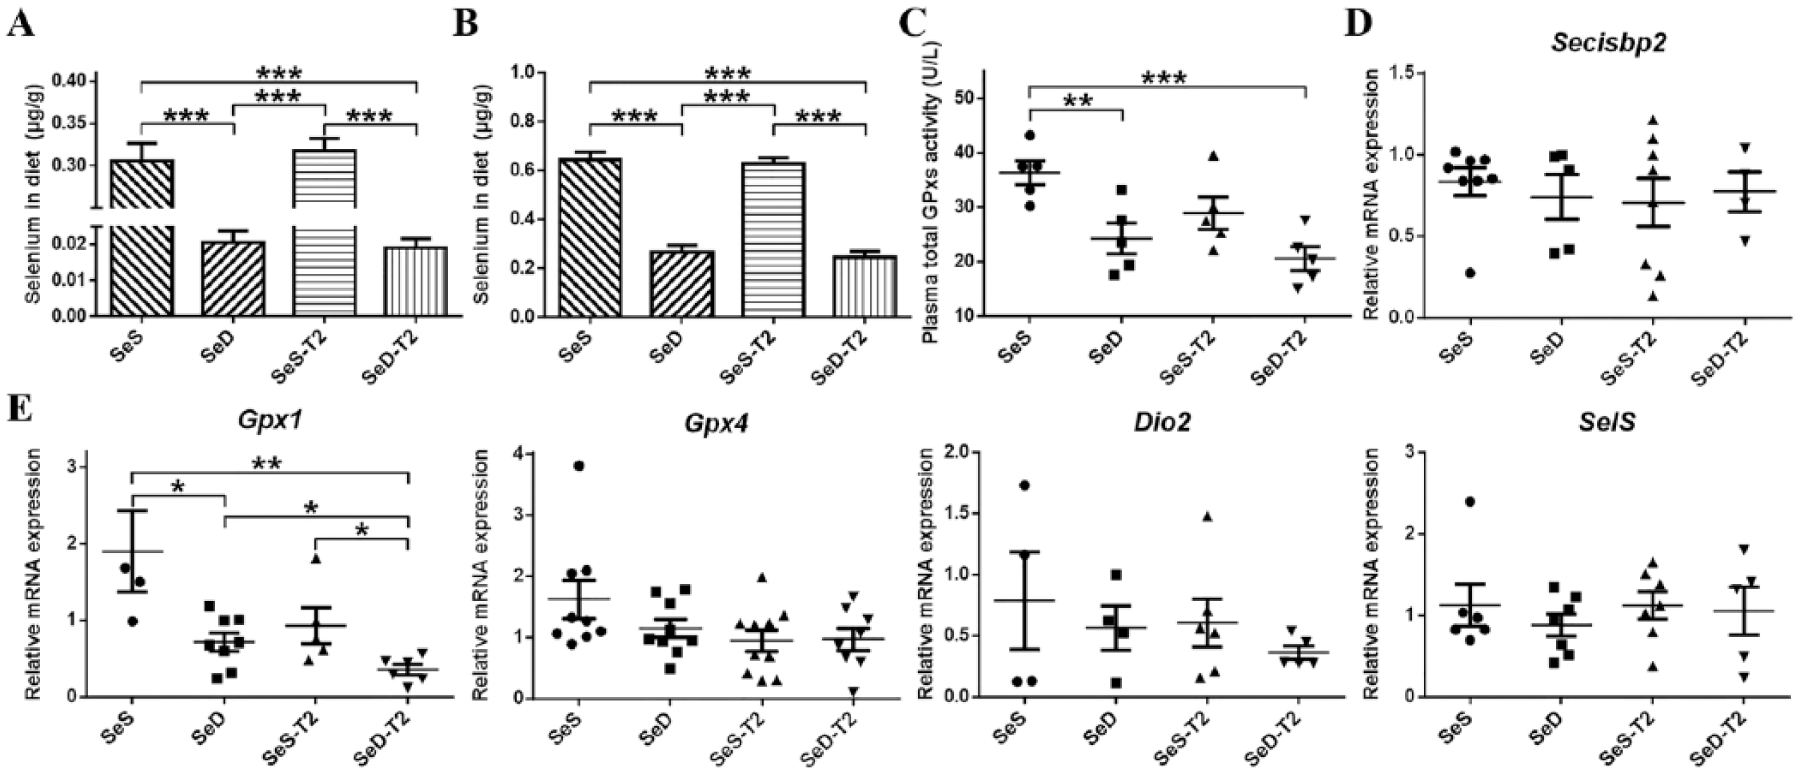
As expected, the selenium contents in both the SeD group and the SeD-T2 group were detected significantly lower than those in the Se-sufficient groups ( Fig. 1A ). Meanwhile, the Se levels in both the SeS group and the SeS-T2 group were similar to those observed in rats fed a normal, natural diet. These results confirmed that the diets were appropriate for use in subsequent experiments.
Evaluation of Se and T-2 status in experimental rats. (
The plasma Se contents were observed much lower in the SeD and SeD-T2 rats than those in the SeS and SeS-T2 rats ( Fig. 1B ). The total GPx activity in plasma was significantly decreased in the 2 Se-deficient groups compared with the SeS groups, but it was unchanged between the SeS and SeS-T2 groups; and it also remained steady among the SeD, SeS-T2, and SeD-T2 groups ( Fig. 1C ). The Gpx1 mRNA expression in the liver was significantly reduced in the SeD and SeD-T2 groups compared with the SeS group and was further reduced in the SeD-T2 group significantly compared with all the groups ( Fig. 1E ). Interestingly, the mRNA expression levels of Secisbp2, Gpx4, Dio2, and SelS were not significantly changed in livers of all the 4 rat groups ( Fig. 1D and E ). These results showed that the rats fed a Se-deficient synthetic diet exhibited a Se-deficient status, which was further aggravated by T2 exposure. The plasma Se concentration represented the Se intake from diet, and the plasma total GPx activity and liver Gpx1 mRNA also suggested Se deficiency status in vivo as indicated by these marker genes. The Se-deficient status in the rats resulted in reduced total GPx activity in plasma, as well as the Gpx1 mRNA level in liver.
Se Deficiency Was More Likely to Affect the Epiphyseal Plate Thickness while T2 Induced the Hypertrophic Chondrocytes Necrosis in DA Rats
To investigate whether Se deficiency and/or T2 exposure caused epiphyseal plate lesions in DA rats, both the epiphyseal plate thickness and the necrosis or absence of proliferative chondrocytes layer were evaluated histologically for pathological changes.
Histologic sections of tibial plateau, distal femur, and proximal femur from the same rats were subjected to Safranin O and fast green staining ( Fig. 2A ) and measured for epiphyseal plate thickness ( Fig. 2B ). All 3 epiphyseal plates in the SeD and SeD-T2 rats were significantly thinner than those in the SeS and SeS-T2 rats. Epiphyseal plate thickness remained unchanged between SeS and SeS-T2 rats but was thicker in SeD rats than SeD-T2 rats, particularly in the distal femur and tibial plateau ( Fig. 2A and B ).
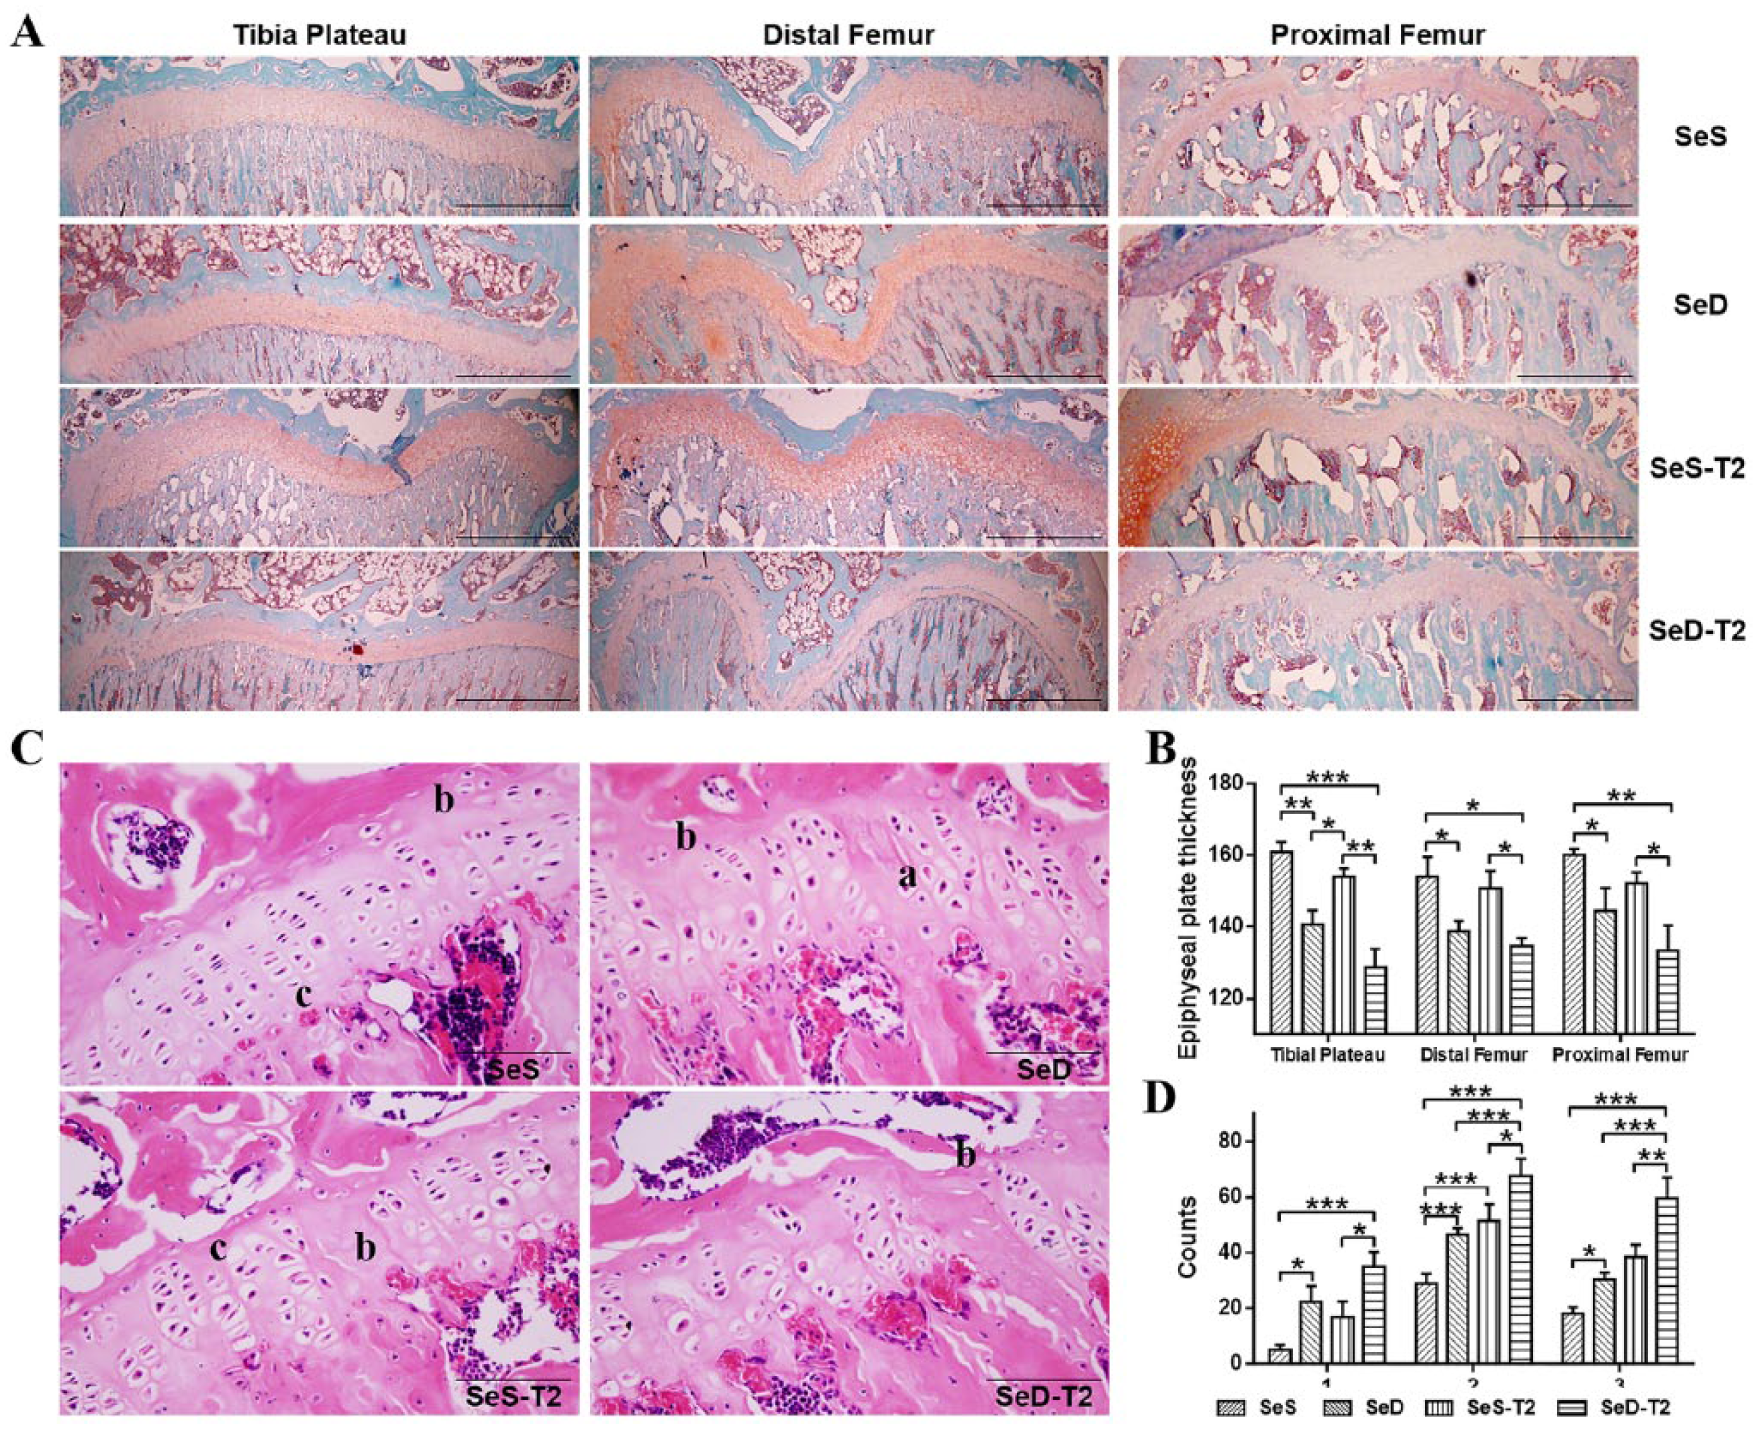
Comparisons of epiphyseal plate growth and chondrocyte apoptosis among 4 experimental rat groups. (
In terms of histopathology, the SeD, SeS-T2, and SeD-T2 rats presented (in order) significantly higher counts of “necrosis or lack of columns” in proliferative chondrocytes compared with SeS rats, especially SeD-T2 rats. Analogously, SeD, SeS-T2, and SeD-T2 rats presented remarkably higher levels of “necrosis or lack of flakes” and “chondrocyte clusters” than the SeS group, despite the unchanged epiphyseal plate thickness between SeS and SeS-T2 rats; the SeD-T2 group was most severely affected ( Fig. 2C and D ).
Se Deficiency Was Associated with Reduced COL2α1 and T2 Depressed Chondroitin Sulfate Expression to Affect ECM Metabolism
As indexes of cartilage ECM metabolism, Col2α1, Col10α1, Acan, Hs6st2, and Adamts4 expression levels were evaluated in the distal femur cartilages of the 4 experimental rat groups.
The Col2α1 mRNA expression was significantly higher in the 2 SeS groups (SeS and SeS-T2) than the 2 SeD groups (SeD and SeD-T2). However, it was unchanged when compared between SeS and SeS-T2; and between SeD and SeD-T2 groups ( Fig. 3A ). The intensity of Col2 staining in cartilage sections corresponded to the Col2a1 mRNA levels measured by RT-qPCR ( Fig. 3B ). These results showed that Col2α1 expression was strongly associated with Se status and significantly reduced in Se deficiency conditions in DA rats, irrespective of the T2 treatment. However, neither T2 exposure nor Se status could influence the Col10α1 expression in our rat models ( Fig. 3A ). Furthermore, the Acan and Hs6st2 mRNA expression levels were significantly decreased in SeD, SeS+T2, and SeD+T2 groups, as compared to the SeS group. In fact, T2 treatment further downregulated the expression of these 2 genes in SeS+T2 and SeD+T2 rats, measured at mRNA level ( Fig. 3A ). The HS6ST2 protein staining in cartilage specimens corresponded to Hs6st2 mRNA, measured by RT-qPCR. The cartilage sections stained with HS6ST2 antibody showed the highest protein intensity in the SeS group, followed by the SeD group, decreasing down in the SeS-T2 group to the SeD-T2 group, where it was detected at the lowest level among the 4 groups ( Fig. 3C ). As expected, the expression of Adamts4 went up with T2 toxin exposure and/or with selenium deficiency ( Fig. 3A ).
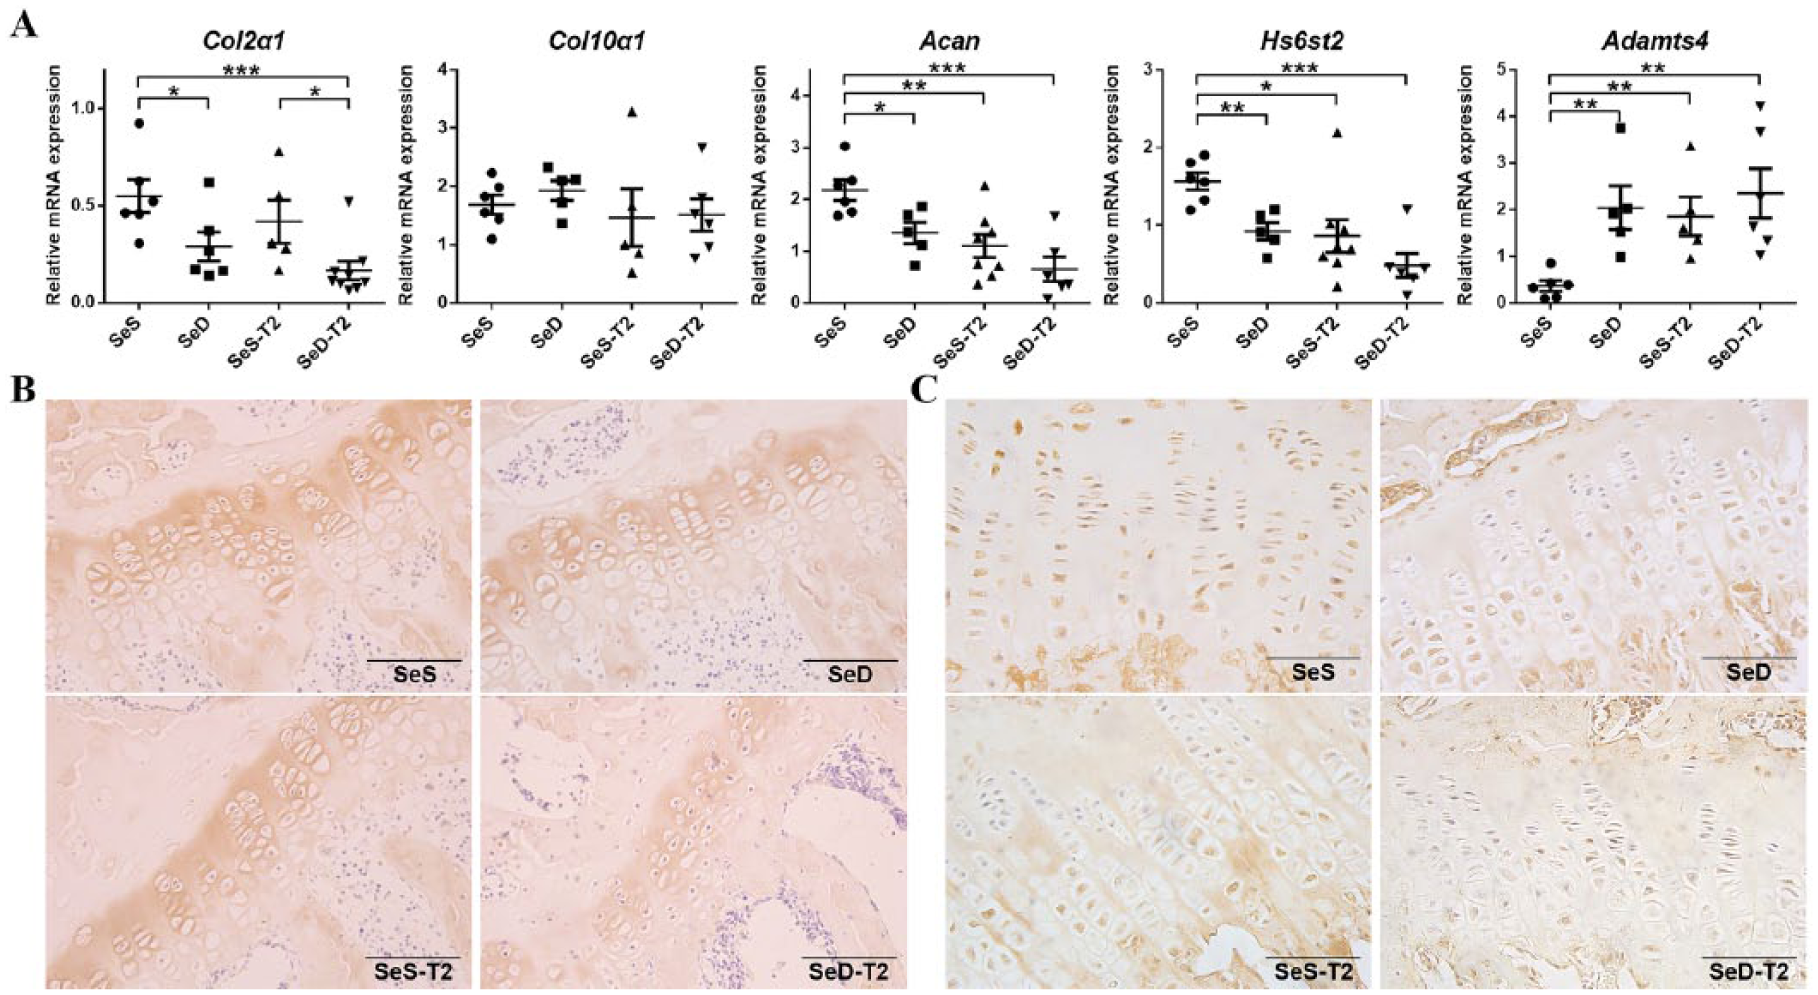
Comparison of articular cartilage extracellular matrix metabolism among 4 experimental rat groups. (
Both Se Deficiency and T2 Exposure Affect Antioxidant Gene Expression in Articular Cartilage
To examine the antioxidant capacity of the chondrocytes in distal femoral cartilages and costal cartilages of the 4 rat groups, we observed the expression of Secisbp2 and selected selenoproteins by RT-qPCR and IHC.
The Secisbp2 mRNA expression was significantly decreased in the SeD, SeS-T2, and SeD-T2 groups as compared to the SeS group. There was no significant difference between the SeD and SeS-T2 groups; however, Secisbp2 expression was further downregulated significantly in the SeD-T2 group compared with the SeD and SeS-T2 groups ( Fig. 4A ). The intensity of SECISBP2 staining in cartilage sections and epiphyseal plates corresponded to the SECISBP2 mRNA levels measured by RT-qPCR, except SECISBP2 protein levels in SeD rats, which were not markedly different from the SeS-T2 rats ( Fig. 4B ). Meanwhile, the Gpx1 mRNA expression showed a significant downregulation in all T2 and Se-deprived groups compared with the SeS group, and expression in the SeS-T2 group was significantly decreased compared with that in the SeD group ( Fig. 4A ). Furthermore, GPX1 was most highly expressed in the epiphyseal plates of SeS rats, and was visibly reduced in SeD-T2 rats compared with SeD and SeS-T2 rats ( Fig. 4C ). Moreover, the Gpx4 mRNA expression was higher in SeS rats than others and lower in SeD-T2 rats than SeD rats. However, the mRNA levels of Dio2 and Selenoprotein S were not changed among all the groups ( Fig. 4A ). Besides, the mRNA expression levels of all the antioxidant genes tested in costal cartilages were not changed among the 4 groups except Secisbp2, whose mRNA expression was increased in SeS rats compared with SeS-T2 rats (Suppl. Fig. S).
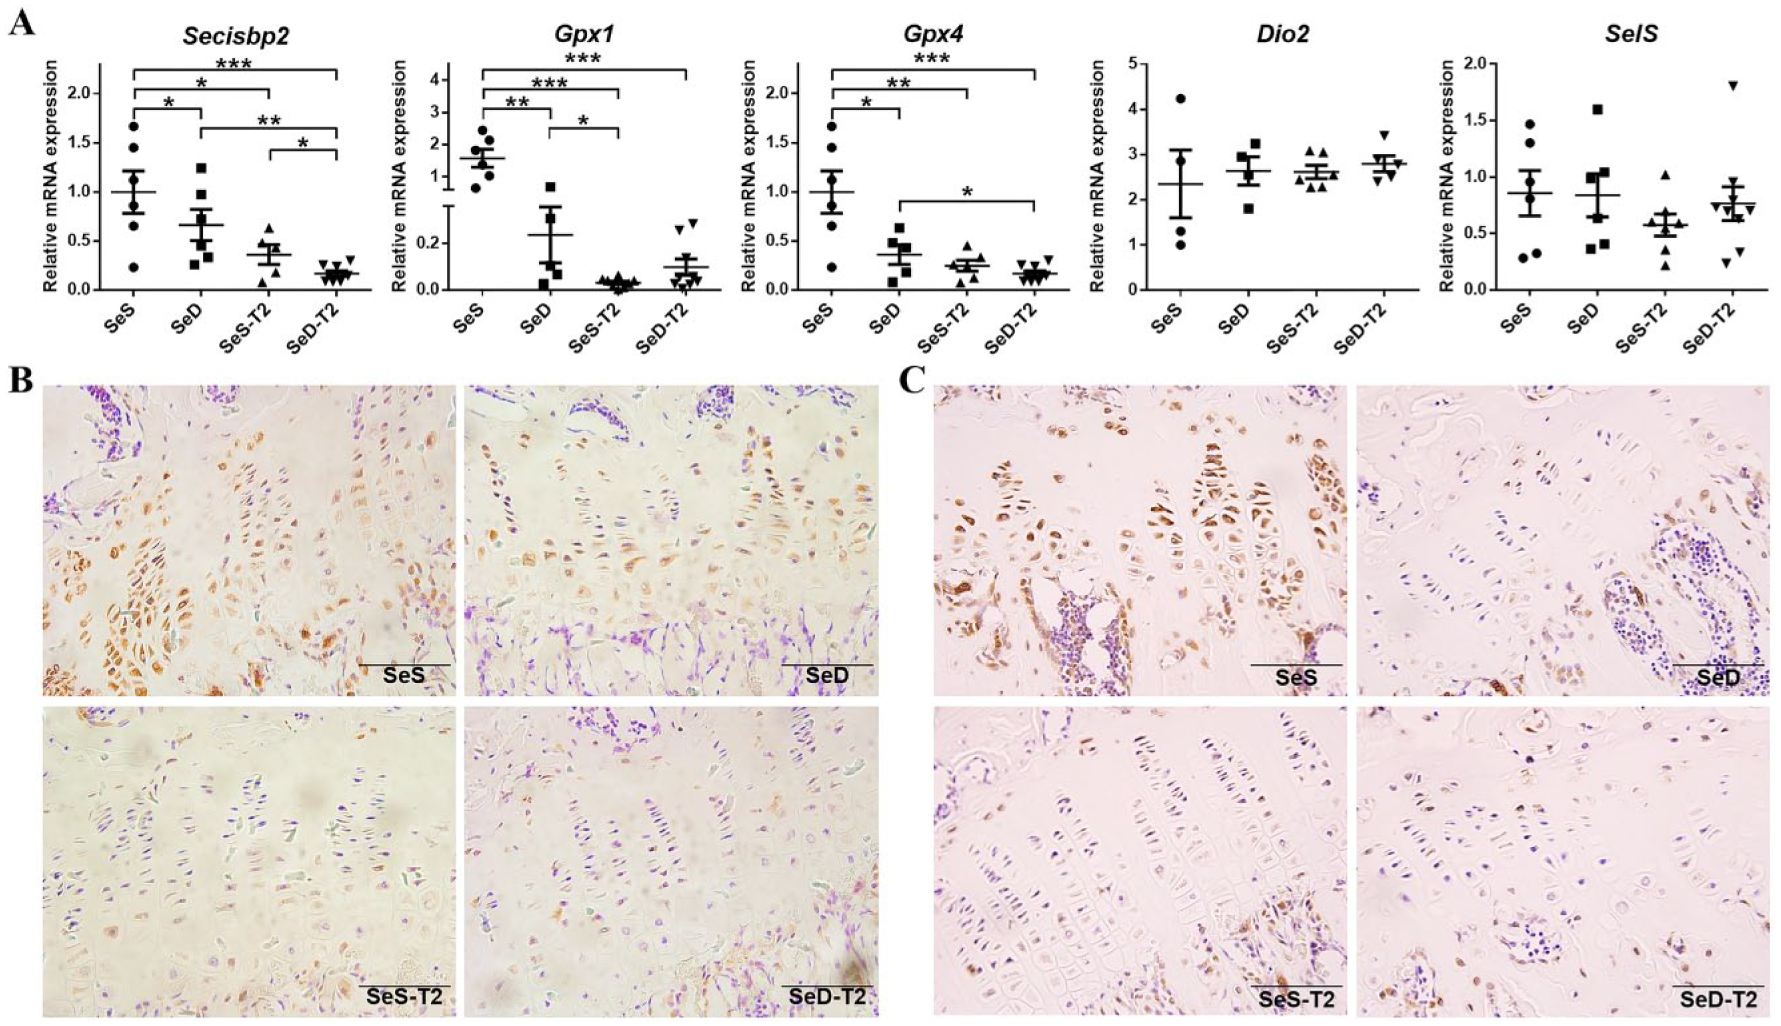
Comparative analysis of articular cartilage selenocysteine synthesis among the 4 experimental rat groups. (
T2 Inhibits the SECISBP2-Mediated Selenoproteins Synthesis in C28/12 Cells Causing a Decrease in Antioxidant Capacity of the Chondrocytes
SECISBP2 expression was reduced in C28/I2 cells after treatment with 10, 20, 40, and 80 ng/mL of T2 for 24 hours both at mRNA ( Fig. 5A ) and protein levels ( Fig. 5B ). In addition, 20 ng/mL of T2 robustly decreased the SECISBP2 expression levels in C28/I2 cells from 24 to 48 hours both at mRNA ( Fig. 5C ) and protein levels ( Fig. 5D ). The results showed that T2 decreased SECISBP2 expression in a time- and dose-dependent manner. Besides, treatment of C28/I2 cells with 20 ng/mL of T2 for 24 hours downregulated the SECISBP2, GPX1, and GPX4 expression at the mRNA level ( Fig. 5E ). At the same time, the total GPXs activity was found significantly reduced ( Fig. 5F ) in C28/I2 cells treated with 20 ng/mL of T2 for 24 hours, and this might be due to the decreased expression of SECISBP2, GPX1, and GPX4. These results reveal that intracellular selenoproteins synthesis is significantly inhibited in C28/I2 cells under T2 treatment, which might be mediated by SECISBP2, as reported earlier.20,21
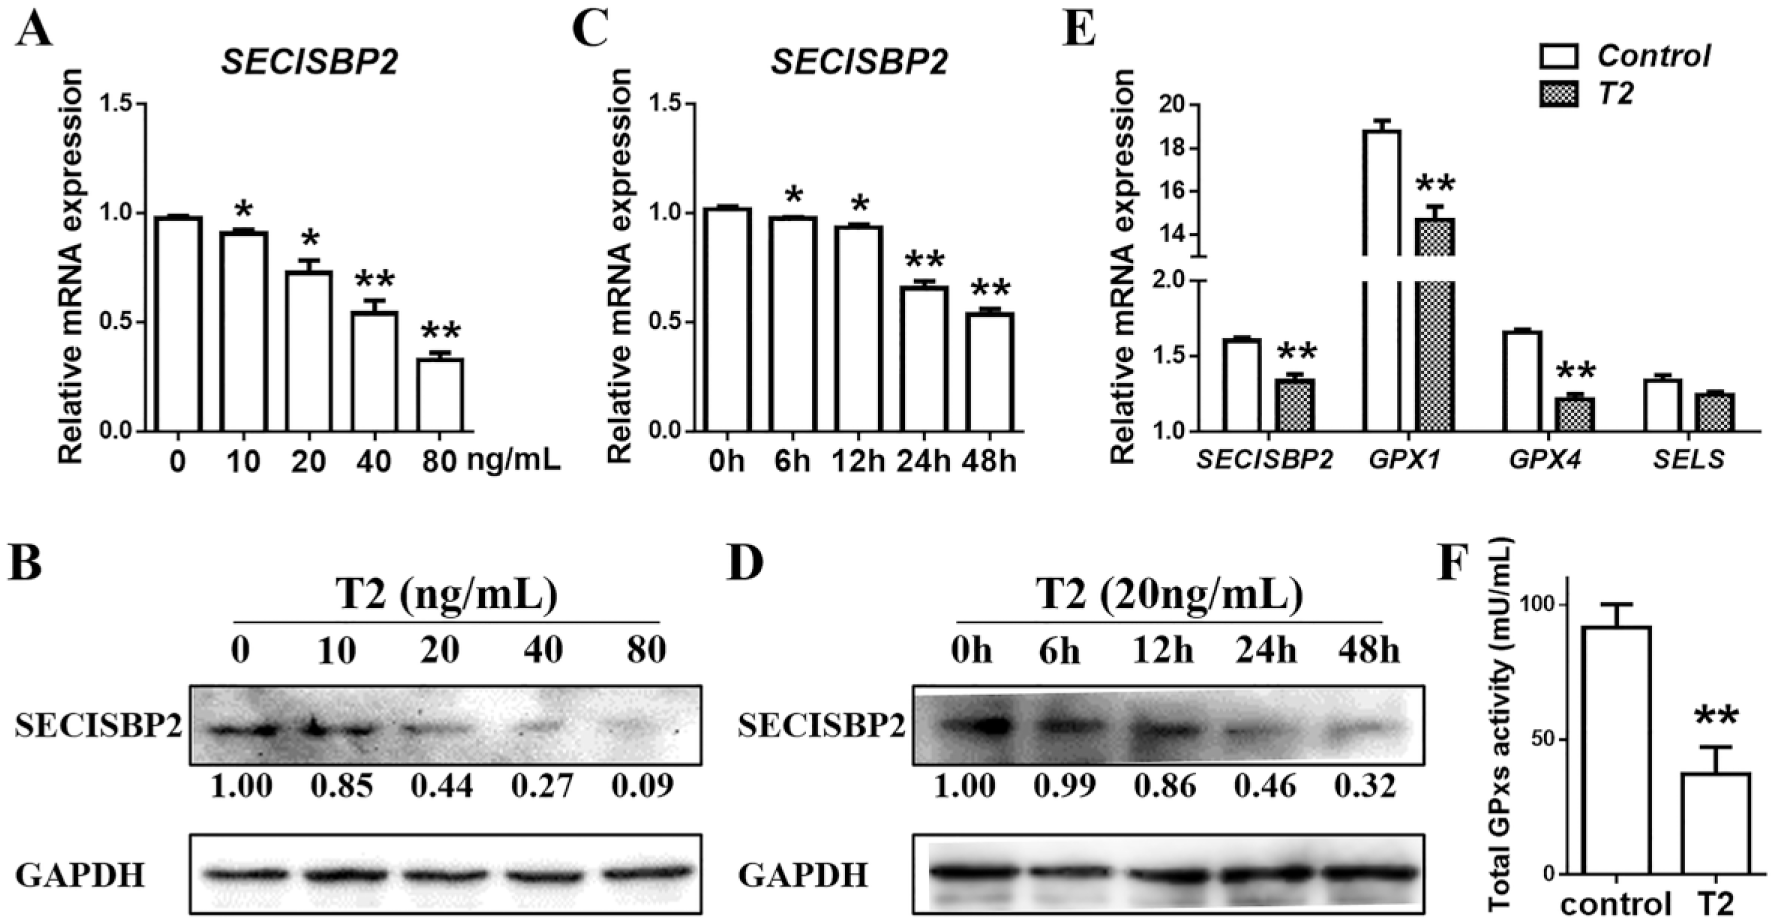
T2 inhibits the selenocysteine synthesis and GPXs activity in C28/I2 cells. (
Discussion
Several existing animal models have been used to imitate the typical pathological phenotypes of KBD, characterized by deep chondrocytes necrosis and epiphyseal plate cartilage lesions. However, a model using outbred Wistar or SD rats fed Se-deficient diet or exposed to mycotoxins has proven to be elusive.28-32 In addition, these treatments seem to induce putative osteopenia in Wistar rats 22 and in mice. 33
In this work, considering hypersensitive to induced arthritis, the inbred DA rats were fed ad libitum with a totally artificial synthetic Se-deficient or/and T2-added diet that was based on the nutrition available to the people from KBD endemic areas of China. 4 The KBD pathological phenotypes were successfully replicated in DA rats, which provided a technically sound and efficient in vivo model. 14 Specifically, the Se-deficient DA rats showed a perfect match for a KBD nutritional deficiency model. Therefore, we used these DA rats to investigate the mechanisms of KBD risk factors, such as Se deprivation and T2 exposure, in this study. The progressive destruction of cartilage, a common characteristic of KBD, is attributed to the metabolic imbalance and degradation of COL2α1 and ACAN,2,3 which leads to irreversible loss of the cartilage structural integrity. 2 Moreover, Se promotes a chondrocytes hypertrophy phenotype by enhancing COL10α and MMP expression. 34 On the other hand, T2 exposure decreases ACAN expression and disrupts the chondroitin sulfate sulfation expression in cartilage.8,11-13
Sulfotransferases are involved in the synthesis of glycosaminoglycans, which are carbohydrate chains of ACAN. 35 The activity of HS6ST2, a representative member of the sulfotransferase family, is decreased in KBD 35 and OA cartilage. 12 In addition, the sulfate residues of heparin sulfation are necessary for interactions with heparin-binding growth factors such as fibroblast growth factor (FGF). 36
In the present study, we observed that Se deficiency was associated with reduced COL2α1 expression, and T2 depressed the chondroitin sulfate and aggrecan expression to affect ECM metabolism. As an aggravating factor, Se-deficient diet in combination with T2 exposure intensified the Se deficiency status in DA rats, which exhibited the KBD-like phenotype. In a comparison of Se-D and SeS DA rats, the epiphyseal plate lesions and cartilaginous degeneration were found strongly related to Se supply levels. Together, these findings confirm that an imbalance of cartilage ECM metabolism occurs during the chondrocytes proliferation rather than during the hypertrophy period, due to Se deficiency. 14
SECISBP2 distinctively is a critical node regulating the metabolic balance between Se and selenoproteins.20,21,37 Due to insufficient Sec-tRNASec, selenocysteinyl tRNASec knock-out mice produce inactive, truncated selenoproteins and show chondronecrosis and abnormal skeletal development, also observed in KBD.29,37 Sec-tRNASec is required for protection against reactive oxygen species–induced cellular damage and cell survival. 38 For instance, gene mutations in SECISBP2 lead to decreased expression of several selenoproteins, resulting in a systemic selenoprotein deficiency disorder in humans, 39 which is associated with an increase in the blood levels of lipid peroxidation products mediated by free radicals. 40
Meanwhile, GPX1, GPX4, and SELS were found out-of-step regulated by miR-181a-5p and this regulation was mediated by SBP2, because the SECIS domain of the 3 selenoproteins has different affinity and binding efficiency with SBP2,20,21,41-44 and SBP2 affects the expression of selenoproteins at mRNA levels.41-43,45 Gpx1 and Gpx4, used as the indicator cartilage selenoproteins in this study, are crucial antioxidant enzymes in vivo, and their synthesis is mediated by SECISBP2. On one hand, selenium regulates SECISBP2-mediated GPx1 and GPX4 expression in vitro and in vivo. 46 On the other hand, Secisbp2, Gpx1, and Gpx4 are drastically downregulated by Se deprivation and/or T2 exposure in C28/12 cells and the cartilage tissues from our DA rat models (present study). In addition, T2 exposure shows more significant inhibitory effect than Se insufficiency. In the position of selenoproteins synthesis, both Se deprivation and T2 exposure can dysregulate epiphyseal plate chondrocytes anabolism and limit the oxidation resistance capacity through epigenetic mechanisms, especially PRMTs and HDACs (our unpublished results).
In conclusion, both Se deficiency and T2 exposure cause imbalanced ECM anabolism and catabolism in chondrocytes and decrease the biosynthesis of selenoproteins leading to increase oxidative stress due to a lack of GPXs activity. The synergy of disordered articular cartilage metabolism and disrupted selenoprotein biosynthesis induces chondrocyte apoptosis and contributes to cartilage destruction and epiphyseal plate lesions, the typically observed in KBD.
Supplemental Material
Supplementary_Figure – Supplemental material for T-2 Toxin Induces Epiphyseal Plate Lesions via Decreased SECISBP2-Mediated Selenoprotein Expression in DA Rats, Exacerbated by Selenium Deficiency
Supplemental material, Supplementary_Figure for T-2 Toxin Induces Epiphyseal Plate Lesions via Decreased SECISBP2-Mediated Selenoprotein Expression in DA Rats, Exacerbated by Selenium Deficiency by Jian Sun, Zixin Min, Wenxiang Zhao, Safdar Hussain, Yitong Zhao, Dongxian Guo, Fujun Zhang, Yuanxu Guo, Mengyao Sun, Huang Huang, Yan Han, Nannan Zhong, Peng Xu and Shemin Lu in CARTILAGE
Supplemental Material
Supplementary_Table – Supplemental material for T-2 Toxin Induces Epiphyseal Plate Lesions via Decreased SECISBP2-Mediated Selenoprotein Expression in DA Rats, Exacerbated by Selenium Deficiency
Supplemental material, Supplementary_Table for T-2 Toxin Induces Epiphyseal Plate Lesions via Decreased SECISBP2-Mediated Selenoprotein Expression in DA Rats, Exacerbated by Selenium Deficiency by Jian Sun, Zixin Min, Wenxiang Zhao, Safdar Hussain, Yitong Zhao, Dongxian Guo, Fujun Zhang, Yuanxu Guo, Mengyao Sun, Huang Huang, Yan Han, Nannan Zhong, Peng Xu and Shemin Lu in CARTILAGE
Footnotes
Author Contributions
Jian Sun and Shemin Lu conceived and supervised the study. Jian Sun, Zixin Min and Wenxiang Zhao completed most of experiments, analysis, and interpretation of the data and wrote the original manuscript. Safdar Hussain, Yitong Zhao, Dongxian Guo, Fujun Zhang, Yuanxu Guo, Mengyao Sun, Ying Yuan, Huang Huang, Yan Han, and Nannan Zhong helped with the experiments. Jian Sun, Shemin Lu, and Peng Xu obtained the funding. Shemin Lu and Peng Xu critically revised the article for important intellectual content andtake responsibility for the integrity of the work as a whole.
Acknowledgments and Funding
The author(s) disclosed receipt of the following financial support for the research, authorship, and/or publication of this article: This work was supported by grants from the National Natural Science Foundation of China (Project No. 81772410, 81371986, 81301598), the Shaanxi province Natural Science Foundation (Project No. S2016YFJM1171), and the Fundamental Research Funds for the Central Universities (xjj2015073).
Declaration of Conflicting Interests
The author(s) declared no potential conflicts of interest with respect to the research, authorship, and/or publication of this article.
Ethical Approval
Ethical approval for this study was obtained from the Institutional Animal Ethics Committee of Xi’an Jiaotong University (APPROVAL NUMBER/ID: 2015-321).
Animal Welfare
The present study followed international, national, and/or institutional guidelines for humane animal treatment and complied with relevant legislation.
Supplemental Material
Supplemental material for this article is available online.
References
Supplementary Material
Please find the following supplemental material available below.
For Open Access articles published under a Creative Commons License, all supplemental material carries the same license as the article it is associated with.
For non-Open Access articles published, all supplemental material carries a non-exclusive license, and permission requests for re-use of supplemental material or any part of supplemental material shall be sent directly to the copyright owner as specified in the copyright notice associated with the article.