
Abstract
Objective
It was hypothesized that the respective protein profiles of bovine cartilage from sites of localized mild to moderate (GI to GII) degeneration versus adjacent sites of intact tissue would vary in accordance with the tissue microstructural changes associated with a pre-osteoarthritic state.
Methods
A total of 15 bovine patellae were obtained for this study. Paired samples of tissue were collected from the lateral region of each patella. If the patella contained a site of degeneration, a paired tissue set involved taking one sample each from the degenerated site and the intact tissue adjacent to it. Sufficient tissue was collected to facilitate 2 arms of investigation: microstructural imaging and proteome analysis. The microstructural analysis used a bespoke tissue preparation technique imaged with differential interference contrast optical microscopy to assess fibrillar scale destructuring and underlying bone spicule formation. An iTRAQ-based proteome analysis was performed using liquid chromatography–tandem mass spectrometry to identify the differential levels of proteins across the intact and degenerated cartilage and further, the results were validated with multiple reaction monitoring assay.
Results
In the healthy cartilage pairs, there was no significant variation in protein profiles between 2 adjacent sample sites. In pairs of tissue that contained a sample of GI/GII tissue, there were both significant microstructural changes as well as the difference in abundance levels of 24 proteins.
Conclusions
From the known functions of the 24 proteins, found to be strongly aligned with the specific microstructural changes observed, a unique “proteins ensemble” involved in the initiation and progression of early cartilage degeneration is proposed.
Introduction
There is currently no cure for, or reversal of, osteoarthritis (OA). Typically involving pain in the joint, clinical OA symptoms are associated with a relatively late stage of the disease, as the early OA joint is likely to be asymptomatic and largely undetectable. Arguably, the major hurdle in finding a cure for OA, lies in the difficulty of determining the early onset of the disease. 1 To this end, we have been able to show that bovine patellae cartilage, with localized mild (GI) positive staining using India ink, 2 is indeed a very early state of degeneration within the OA process. 3 In such tissue, the gross appearance of the cartilage is no different from the healthy tissue. However, while India ink washes off healthy cartilage tissue, in the GI grade bovine patella tissue, there is mild uptake of the ink leaving a slight stain (compare Fig. 1B with 1A ). It has been shown in previous work (extensively by authors Thambyah and Broom) that such positive staining and its intensity are correlated with ultrastructural fibrillar-scale network destructuring followed by reaggregation of the fibrils into larger radially aligned bundles,3-8 and all these structural changes only detectable via microscopy.
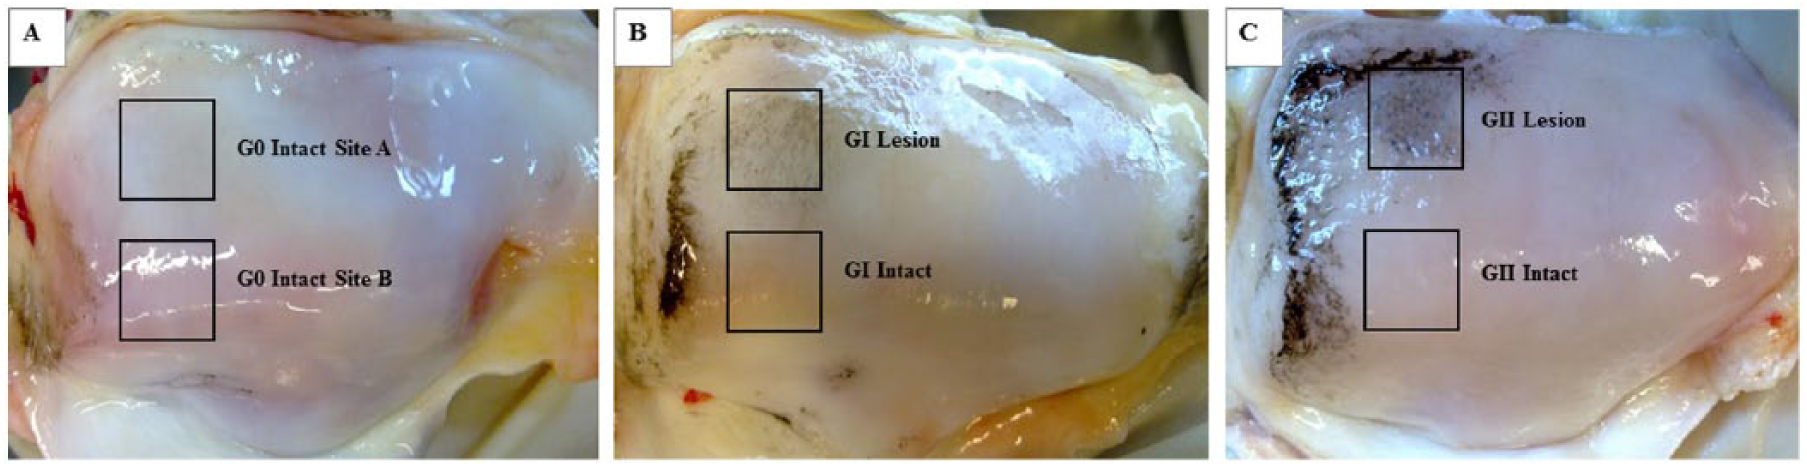
Representative bovine patellae that has been washed with India ink to show the paired sampling sites (boxes) used for the present study. (
This subtle degenerative process of fibrillar reorganization, of destructuring and reaggregation, in bovine GI tissue has been suggested as a preceding event to further larger-scale matrix disruption, and analogous to very early stages of human OA. 6 An additional subtle indicator of this ‘pre-OA’ state in bovine patellae tissue is the formation of microscale bone spicules that emerge from the cement line into the zone of calcified cartilage (ZCC). 8 Reported as evidence that early bone changes take place in conjunction with cartilage changes, these spicules have also been shown to occur also in human OA tissue. 6 Our studies,3-9 on thousands of bovine patellae over the years, with tissue of varying degrees of degeneration, have thus identified this tissue source as a convenient and suitable model for investigating the all-important pre-to-early OA changes in the joint. However these studies have been exclusively structural and mechanical, and nothing is known about the associated molecular or protein changes. We believe that the bovine patella model for early joint tissue degeneration can be potentially useful, as a large animal model, for understanding molecular microstructure mechanisms in degenerative change. Therefore as a starting point, protein profiling of such bovine tissue is proposed in the present study.
Proteomic profiling, typically carried out by mass spectroscopy methods, tend to be “hypothesis-free,” and mostly for the purposes of “discovery” of biomarkers for the disease. 10 Such an approach applied to cartilage research has been directed to identifying biomarkers for the diagnosis 11 and prognosis 12 of OA. In the present study however, the use of proteomic profiling is to support a hypothesis-driven investigation on the mechanism of collagen fibril destructuring and reaggregation. In terms of collagen structure, most of the recent emphasis on type II collagen degradation in osteoarthritis has been on molecular cleavage, and how biomarkers such as C-telopeptide (CTX-II) are involved.13,14 The need for understanding structural degradation of cartilage, across all scalar levels, in relation to the associated proteomic changes has not been considered. Such a disconnect between proteomics and multiscale structural studies of cartilage degeneration may explain why urinary CTX-II (along with 15 other popular cartilage degradation biomarkers) was found to be unassociated to MRI-based cartilage-thinning.12,15 Thus the quest for biomarkers of the disease onset often overshadows that of understanding the mechanisms of biomolecular-mediated structural breakdown of cartilage, and especially how the early destructuring of the tissue begins and progresses in relation to the levels of specific proteins expressed.
This then may be the reason why many proposed biomarkers for osteoarthritis lead to dead ends. The current approaches ignore the complexity of a disease that typically involves an ensemble of protein expressions arbitrated by an interplay of several structure-related events. For example, COMP and CILP are fairly well-studied proteins in relation to cartilage structure, as it is involved in collagen fibril formation 16 and cartilage scaffolding, 17 respectively. Yet, while previously it has been shown to be increased in early osteoarthritis,18,19 nothing further has been made from these proteins in terms of how it may be used as an early detector of disease onset. Could such specific structure-related proteomic increases be part of an ensemble of proteins that are associated with a wider array of structural changes be indicative of the early or a pre-osteoarthritic change? Such a question can only be addressed in proteomic studies that also include a detailed and systematic structural analysis, which we propose can help us understand the collagen de-structuring seen during early cartilage degeneration.
Therefore, the aim of the present study is to correlate the subtle microstructural indicators of degenerative change in the bovine model of pre-to-early OA, with the respective abundance levels of proteins. The added power of this study is in its comparison of the protein profiles of bovine patella cartilage from sites of localized mild-to-moderate degeneration versus the respective adjacent sites of intact tissue. We hypothesise that tissue structure-specific protein profiles would vary significantly in accordance with the tissue micro-to-ultrastructural changes.
Methods
Tissue Source
From the distal lateral quarter of bovine patellae, of dairy cows slain at about 5 to 9 years of age, we have been able to obtain cartilage-bone tissue displaying a range of structural integrity, from completely intact to localized mildly degenerated and moderately to severely degenerated cartilage.3-9 To reveal the localised degeneration, the structural “health” of the tissue is established by India ink staining 20 and using the Outerbridge’s classification for cartilage tissue degeneration. 2 From this classification, three grade groups are obtained from the stock of bovine patellae: G0 (negative staining and hence healthy), GI (mild staining indicating early degeneration), and GII (increased staining for moderate degeneration).
For the present proteomics study, due to unknown possible reactions, India ink staining was avoided as a precaution. Therefore, we based our inclusion criteria for G0, GI and GII patellae for this study, on using visual and tactile evaluations, together with our extensive laboratory experience using this model of early OA.3-9,21,22 Importantly, all 15 patellae selected were also graded following histological staining to help verify the initial evaluation. From each of the 15 patella a comparable pair of cartilage-on-bone samples, of en face dimensions of ≈10 × 15 mm, was sawn ( Fig. 1 ). One of the pair was from the distal lateral region, and the other was from a region adjacent to it. In the G0 group ( Fig. 1A ), the pairing was to determine whether there existed a topographical variability in protein levels across the healthy joint surface. The outcome of this pairing comparison in the G0 group was to be used as a reference when comparing the pairings in the GI and GII groups. Of the pairs in the GI and GII groups, the distal lateral sample represented the early degenerative change region or affected region ( Fig. 1B and 1C ).
Each of the 30 cartilage-on-bone blocks obtained was divided into 2 equal portions, one half processed for structural analysis and histology, the other for proteomic analysis. The overall workflow adopted for the present study is shown in Figure 2 .
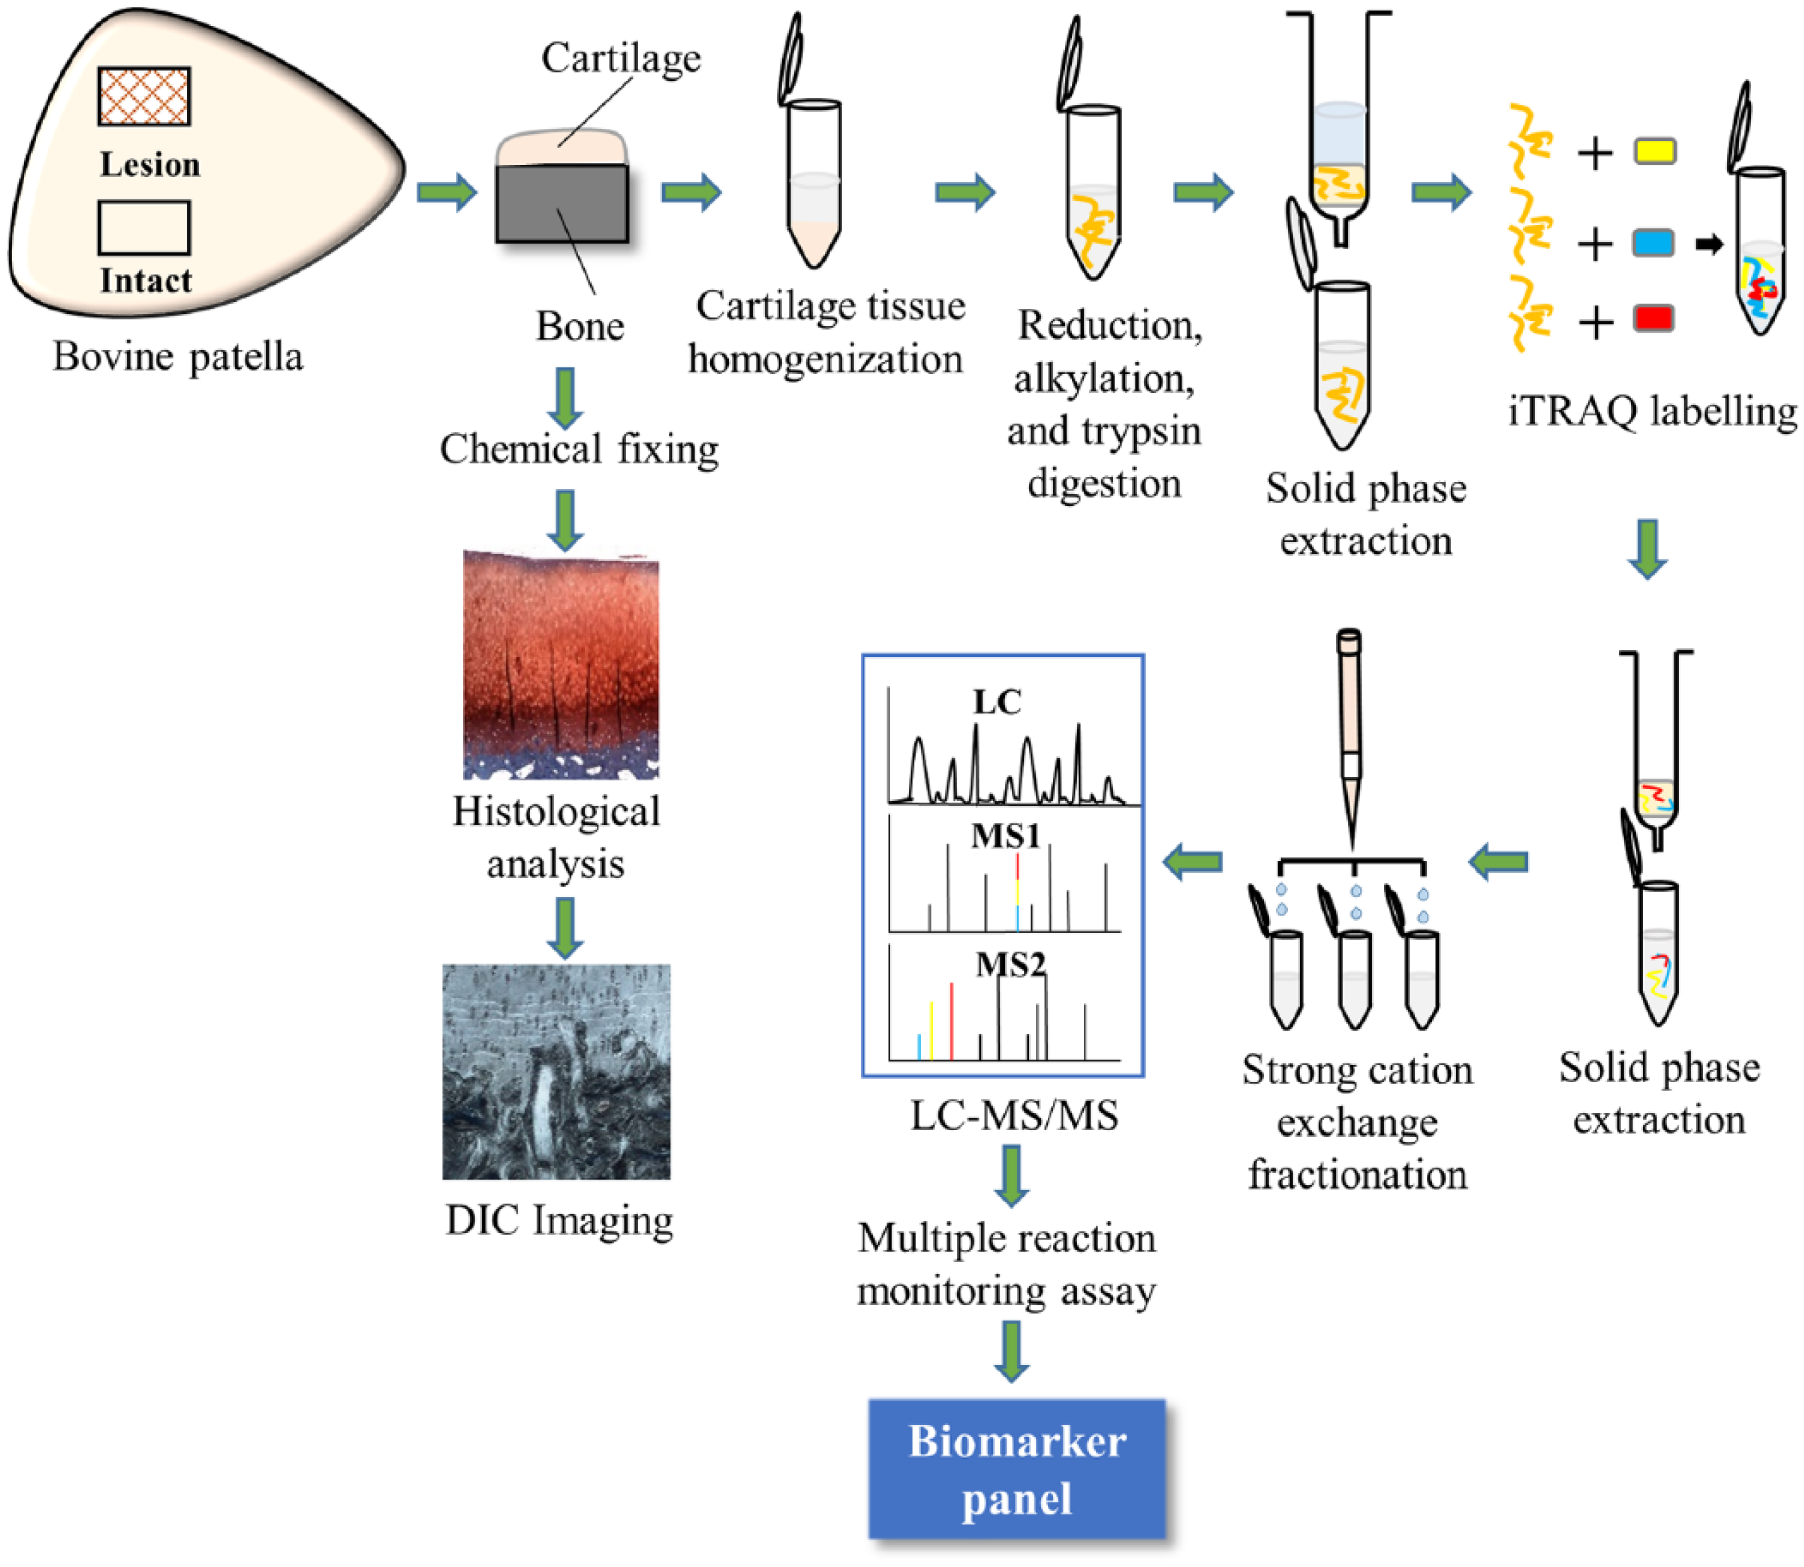
Schematic workflow for this study. Shown is the scheme for microstructural studies and mass spectrometry analysis.
Histology Studies
For histological analysis cartilage-on-bone samples were formalin fixed overnight and then decalcified in 10% formic acid, followed by standard histological processing. Five-micrometer thick microtomed sections were dewaxed, nuclei stained with Weigert’s iron hematoxylin, following which proteoglycans were stained with safranin-O and counterstained with fast green. The sections were imaged using bright field transmission microscopy and then assessed for their level of degeneration using the Mankin cartilage grading system. 23
Microstructural Studies
All samples were equilibrated in 0.15 M saline for 2 hours at 4°C, formalin-fixed overnight, washed in cold running water, and then decalcified in 10% formic acid solution. The samples were then cryo-sectioned to obtain 20-μm thick osteochondral sections that were wet-mounted in 0.15 M saline on a glass slide under a cover slip and examined using differential interference contrast (DIC) optical microscopy, following which they were scored for the tangential layer loss, fibrosity, and rugosity index. The significance of the scoring was assessed by applying 2-sample t test for means.
Proteomics Studies
Sample Preparation and iTRAQ Labeling
For proteomic analysis, 30 cartilage-on-bone blocks were snap-frozen in liquid nitrogen and the cartilage tissue was cryo-microtomed into 10-µm thick sections. Twenty milligram of each sample was individually homogenized by sonication in 500 µL of urea-thiourea buffer (7 M urea, 2 M thiourea, 10 mM dithiothreitol in 50 mM ammonium bicarbonate, pH 8), at 12 Hz for 30 seconds thrice, then microwaved using CEM microwave digestor at 56°C for 10 minutes to reduce the disulphides, alkylated with 25 µl of 1 M iodoacetamide (final concentration 50 mM) in darkness for 30 minutes and the reaction was quenched with 5 µL of 1 M DTT. 24
Each sample was then centrifuged at 16,000 × g at 4°C for 5 minutes, the supernatant collected and used for protein analysis. The total protein concentration of individual sample was determined by fluorescence-based protein assay (EZQ Protein Quantitation Kit, Invitrogen). A reference pool was created with an equal supernatant volume from all cartilage samples. Fifty micrograms of each protein sample and the reference pool were diluted 10-fold in 50 mM ammonium bicarbonate and then digested with trypsin (Promega, Madison, WI, USA) at 1:25 ratio at 45°C maximum using 15 W power microwave irradiation for 3 hours, followed by overnight incubation at 37°C.
The resulting digests were acidified with 50% formic acid and cleaned by solid phase extraction on 10 mg Oasis HLB cartridges (Waters, Milford, MA, USA) and the proteins were eluted with 300 µL of 40% acetonitrile. Extracts were dried in a speed vacuum centrifuge before being reconstituted with 30 µL of dissolution buffer (AB Sciex, Foster City, CA, USA) and labelled with 8-plex iTRAQ chemical tags (AB Sciex) as per the manufacturer’s instructions. The labelling scheme is shown in the supplementary data (Fig. S1, available in the online version of the article). The pools of 8 labeled samples were concentrated in a vacuum centrifuge to ~250 µL, diluted to 2 mL with 0.1 % formic acid and loaded onto 30 mg Strata-X SPE cartridges (Phenomenex, Torrance, CA, USA) eluting with 0.9 mL of 50% acetonitrile. The final extracts were concentrated to ~300 µL in a vacuum centrifuge. The resulting peptides were desalted on 10 mg Oasis SPE cartridges (Waters Corporation, Milford, MA) and completely dried down using a speed vacuum concentrator (Thermo Savant, Holbrook, NY). 25 The samples were run in 6 independent iTRAQ experiments for this work.
LC-MS/MS and Database Searches
Aliquots of the labeled pools were fractionated using 10 salt steps (5, 10, 15, 20, 25, 30, 50, 75, 150, and 600 mM KCl in 10% acetonitrile, 0.1% formic acid) on a 0.32 × 35 mm BioBasic SCX column (Thermo, San Jose, CA, USA). A 0.3 × 5 mm PepMap cartridge (LC Packings, Dionex Corporation, Sunnyvale, CA, USA) was used for capturing the peptides, which were separated on a 0.3 × 100 mm Zorbax 300SB-C18 column (Agilent), using—0.1% formic acid in water as solvent A and 0.1% formic acid in acetonitrile as solvent B, at a flow rate of 6 µL/min and a linear gradient of 10% to 35% B over 85 minutes. The HPLC fractions were directed onto the Ion Spray Source of QSTAR XL hybrid Quadrupole-Time-of-Flight mass spectrometer (Applied Biosystems, Foster City, CA, USA), with an m/z scan range of 330 to 1600 m/z. This was followed by 3 rounds of MS/MS (m/z 75-1200) on the 3 most intense multiply charged ions in each cycle, giving a total cycle of 6 seconds. The resulting data were searched against 60806 protein entries in the IPI Bovine database v3.73 (European Bioinformatics Institute, Hinxton, Cambridge, UK) using ProteinPilot v4.0 (Applied Biosystems). Search parameters were: Sample type- iTRAQ 8-plex (Peptide Labeled); Enzyme, trypsin; Special factors, urea denaturation; Cys alkylation, iodoacetamide; Search effort—Thorough (Thorough mode considers about 150 modifications including biological, sample preparation modifications, and unexpected cleavages); FDR (false discovery rate) analysis, Yes.
Statistical Analysis of iTRAQ Results
The ProteinPilot outputs were processed as described previously. 25 Briefly, data obtained from all the searches were combined and assessed in terms of FDR score. Any proteins below the FDR score were pruned off. The peptide summary was further trimmed to discard any spectra where unused score is 0 or it is matched to a reversed sequence.
The iTRAQ areas were normalized with correction factors established for each label. Any peptide ending with proline or containing a proline (P) immediately followed by glutamine (Q) (since both these have been found to interfere with the 115 (PQ) and 116 (N-terminal P) labels) and peptides found to contain a missed cleavage were processed using a separate set of correction factors. From the peptide summaries, the areas were summed separately for each protein in each label. All the compromised spectra that matched to a peptide containing a PQ or ending with a P were manually deleted across all 8 labels or, if only P/PQ spectra were available, the final sums were deleted for 115 only (in case of PQ) or 116 only (in case the matched peptide ended with a P).
The sum of areas obtained from peptide and protein summaries in each sample were log transformed. Ratios for the resulting logs were obtained for each protein, between the individual sample and the reference sample pool, the latter of which was repeated between the runs. These ratios represented the relative abundance of each quantified protein in each analysed sample making comparisons between them possible. These ratios from individual samples were then grouped into control site A (n = 3), control site B (n = 3), GI intact (n = 7), GI lesion (n = 7), GII intact (n = 5), and GII lesion (n = 5) (more detailed iTRAQ data processing is given in supplementary data, Document 1, available in the online version of the article).
For the controls (i.e., the G0 patellae), the paired samples (refer to Fig. 1A , sites A and B) obtained from adjacent sites were used to compare regional differences. A repeated-measure (RM) 2-way analysis of variance (ANOVA) was performed on all protein ratios obtained to check for significant differences (P < 0.05) between the sites.
Similarly, for the GI and GII groups, each protein’s abundance level was indicated by calculating the ratio of its mass tag signal intensity from the lesion site relative to the adjacent, paired, intact site. Since these ratios were relative numbers, the intact group protein ratios from GI patellae were scaled to zero in log space (1.00 in normal space), and represented as “no change”, while the rest of the ratios from the degenerated groups were relative to that. These scaled ratios were then used to calculate the average and 95% confidence intervals for the relative abundance level (ratio) for each protein and the group in log space. to compute statistically significant differences between the groups, RM 2-way ANOVA was performed. For any protein showing P < 0.05, a Sidak’s multiple comparison test was conducted.
All statistical analyses were performed using GraphPad Prism 6 for Windows.
MRM Assay
For the multiple reaction monitoring (MRM) assays, the following sampling was carried out. From the homogenized cartilage tissue, 9 representative pairs (from the total 15 pairs available) of tissue samples were selected, yielding 3 pairs each, for G0, GI, and GII groups (refer to Fig. 1 ). From each sample, 50 µg protein aliquots were reduced, alkylated and digested using trypsin as stated earlier.
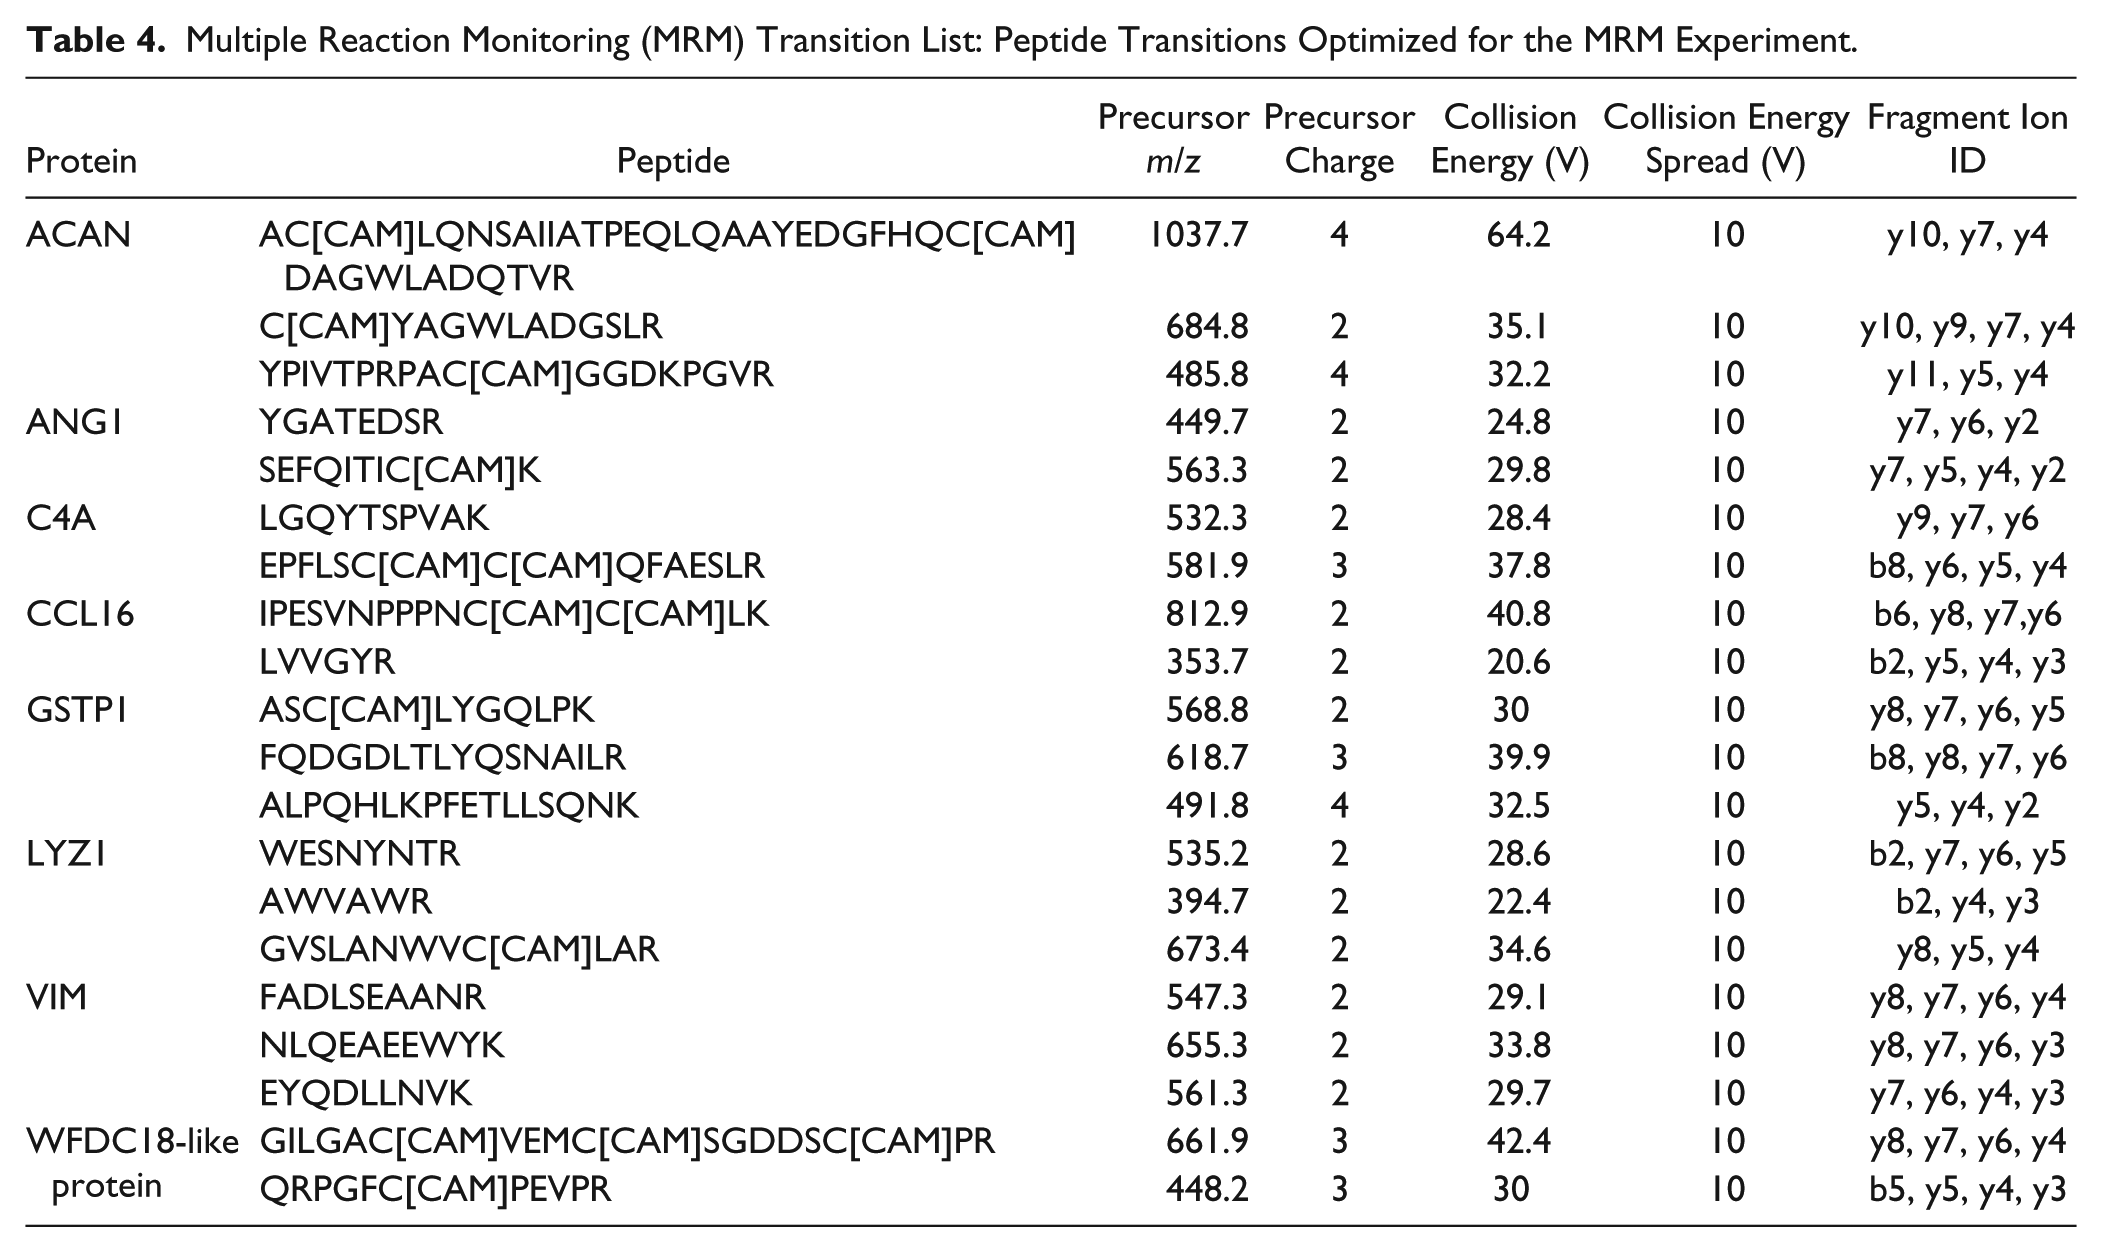
For MRM analysis, a select group of “proteins of interest” were identified from the entire protein profiles obtained in the earlier discovery proteomics experiments. Importantly these selected proteins of interest were based on their significance and relevance to our defined cartilage microstructural changes in early OA. Of the proteins of interest, the peptide targets with high confidence scores (obtained from ProteinPilot) were selected for MRM assays. Transition lists were then built using Skyline 26 and acquisition methods were exported to Analyst TF software. Three to 4 transitions per precursor peptide were selected for each protein of interest. 25
MRM data were acquired using a Sciex TripleTOF 6600 instrument with an Eksigent ekspert nano HPLC system. Solvents were 0.1% formic acid in water (solvent A) and 0.1% formic acid in acetonitrile (solvent B). Peptides were loaded onto a Reprosil C18 Aq 3 µm, 0.3 × 10 mm trap column (Dr. Maisch GmbH) in 2% acetonitrile at 2 µL/min before being separated on a PicoFrit emitter (New Objective, Woburn, MA with a 75 µm internal diameter and a 15 µm emitter, that had been packed to a length of 20 cm with Reprosil C18 Aq 3 µm). Separations were performed with a gradient of: 2% buffer B for 30 seconds; 2%-35% buffer B in 46.5 minutes; 35%-98% buffer B in 2 minutes. The column effluent were directed into the ion spray source of Sciex TripleTOF 6600 instrument. The data were obtained and processed using Skyline software. The peak areas of MRM spectral data was exported into MS Excel for subsequent analysis. The identity of the peptides was confirmed by comparison of retention times between discovery and targeted analysis and by comparison of the intensities of fragment ions in MS/MS spectra.
For MRM assays, significant differences in relative abundance between cartilage groups were analyzed for all proteins using a RM 2-way ANOVA followed by a Sidak’s multiple comparisons test.
Results
For convenience, the tissue from the degenerated site in the GI and GII patellae ( Fig. 1B and 1C ) was classified as the “lesion” sample while the adjacent normal appearing tissue, free of any obvious surface disruption, was classified as “intact.” It is important for the reader to note that the present authors are of the view that the term “lesion” indicates a wide range of abnormality. Hence while reading on, the authors wish to emphasise that the early degeneration in the cartilage used in this study is not a typical lesion, as the cartilage “abnormality” is not clearly detectable at the macro-scale. In fact out of the 5 G0 patellae selected for this study, 2 turned out to be characterized as GI, following postanalysis with histology and DIC. Hence this study reports the results for 3 G0, 7 GI, and 5 GII patellae.
Histological Analysis
From the safranin O-fast green staining the intact cartilage samples from both the GI and GII patellae showed Mankin scores ranging from 0 to 1 ( Fig. 3A and 3C ). The lesion sites from the GI patellae showed Mankin scores in the range of 1 to 4 ( Fig. 3B ), whereas those from the GII patellae scored 2 to 5 ( Fig. 3D ). The controls (image not included) were similar to the intact regions ( Fig. 3A and 3C ). For more details on histology, please refer to supplementary data (Fig. S2 and Table S1, available in the online version of the article).
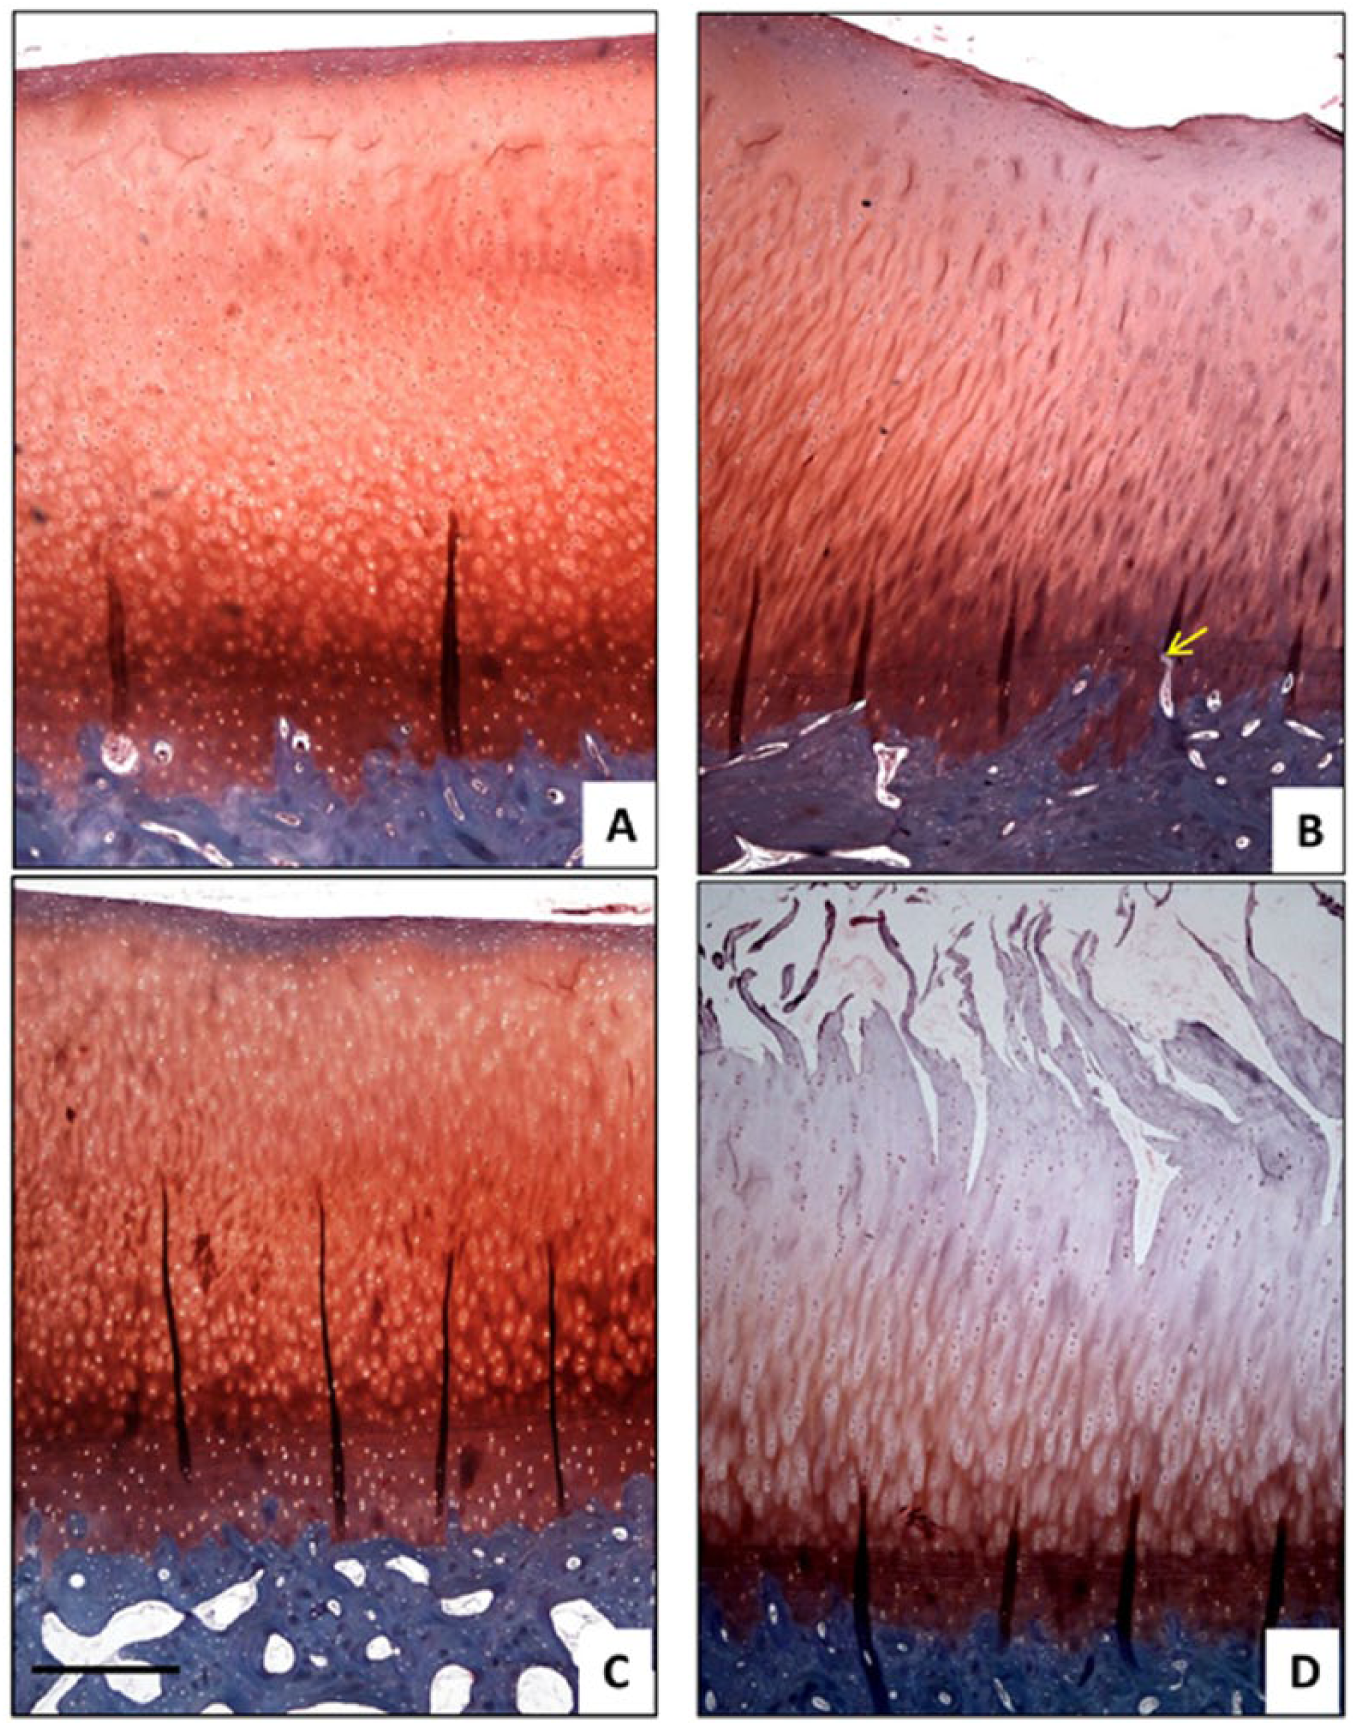
Histological sections of cartilage (orange/red) on bone (blue) stained with safranin-O fast green. (
Microstructural Analysis
The DIC images of all intact tissue samples from the GI and GII patellae exhibited a well-defined tangential zone as indicated by the tangentially aligned chondrocytes ( Fig. 4A and 4C ). This chondrocyte alignment was less pronounced in the GI lesion sites ( Fig. 4B ), and mostly absent in the GII lesion sites ( Fig. 4D ). Also, in the latter there were some localized regions nearer the disrupted surface that exhibited multicell clustering or cloning. The tangential zone in the controls (image not included) was similar to that of the intact regions ( Fig. 4A and 4C ). In order to quantify the extent of microstructural changes in the osteochondral samples, an in-house developed scoring method was applied. Using the images obtained from DIC, fibrillar destructuring in the cartilage matrix (fibrosity) was quantified by a single observer to range from none-to-mild, moderate to severe. A score from 0 to 5 was assigned based on the extent of fibrosity observable in the DIC image (see Supplementary Fig. S3, available in the online version of the article). Similarly, the surface layer (tangential zone) was graded from 0 to 5 representing intact to increasing levels of degeneration such as microscale fraying (1 to 2), diminished tangential layer (2 to 3), and severe loss of a surface layer (4 to 5). Finally, changes in the bone cement line were obtained as a rugosity index, calculated as the digital length of irregular cement line divided by length of horizontal tidemark.
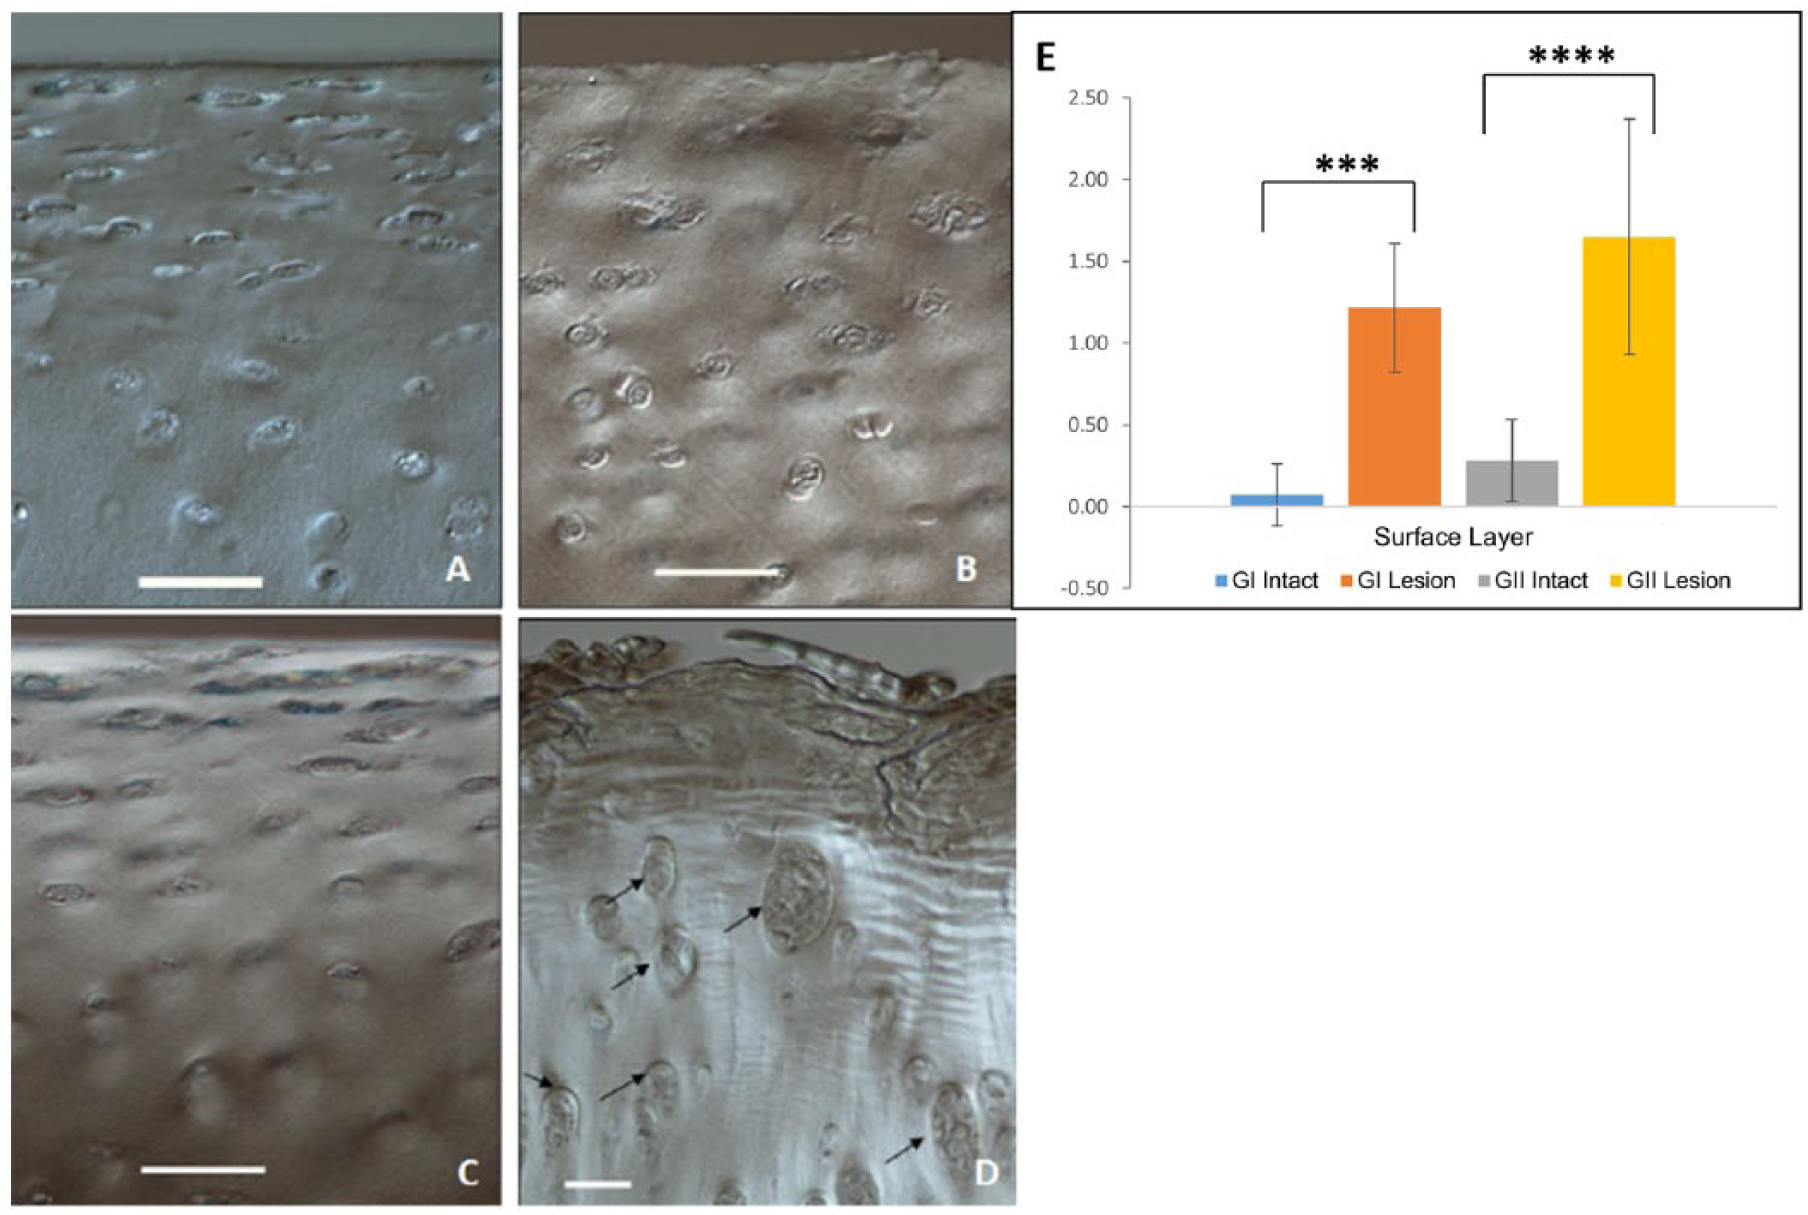
Differential interference contrast (DIC) images of the cartilage surface layer from tissue obtained from GI and GII patellae. (
A significant change was seen at the tangential layer of lesion samples compared to corresponding intact sites, in both GI and GII cartilages ( Fig. 4E ).
With higher resolution DIC imaging, the mid-zone matrix in the intact samples from both the GI and GII patellae presented a relatively amorphous texture with little obvious fibrosity ( Fig. 5A and 5C ). By contrast, the lesion sites ( Fig. 5B and 5D ) exhibited a strong directional fibrosity which varied in both intensity and location, the most intense texture with a distinct crimp morphology occurring near the exposed surface of the GII patellae ( Fig. 5D ). The mid-zone matrix in the controls (not shown) was similar to that of the intact samples ( Fig. 5A and 5C ). On assigning scores, fibrosity was assessed to be increased in the lesion samples, more so in the GII samples but the level of change in fibrosity was not found to be significant ( Fig. 5E ).
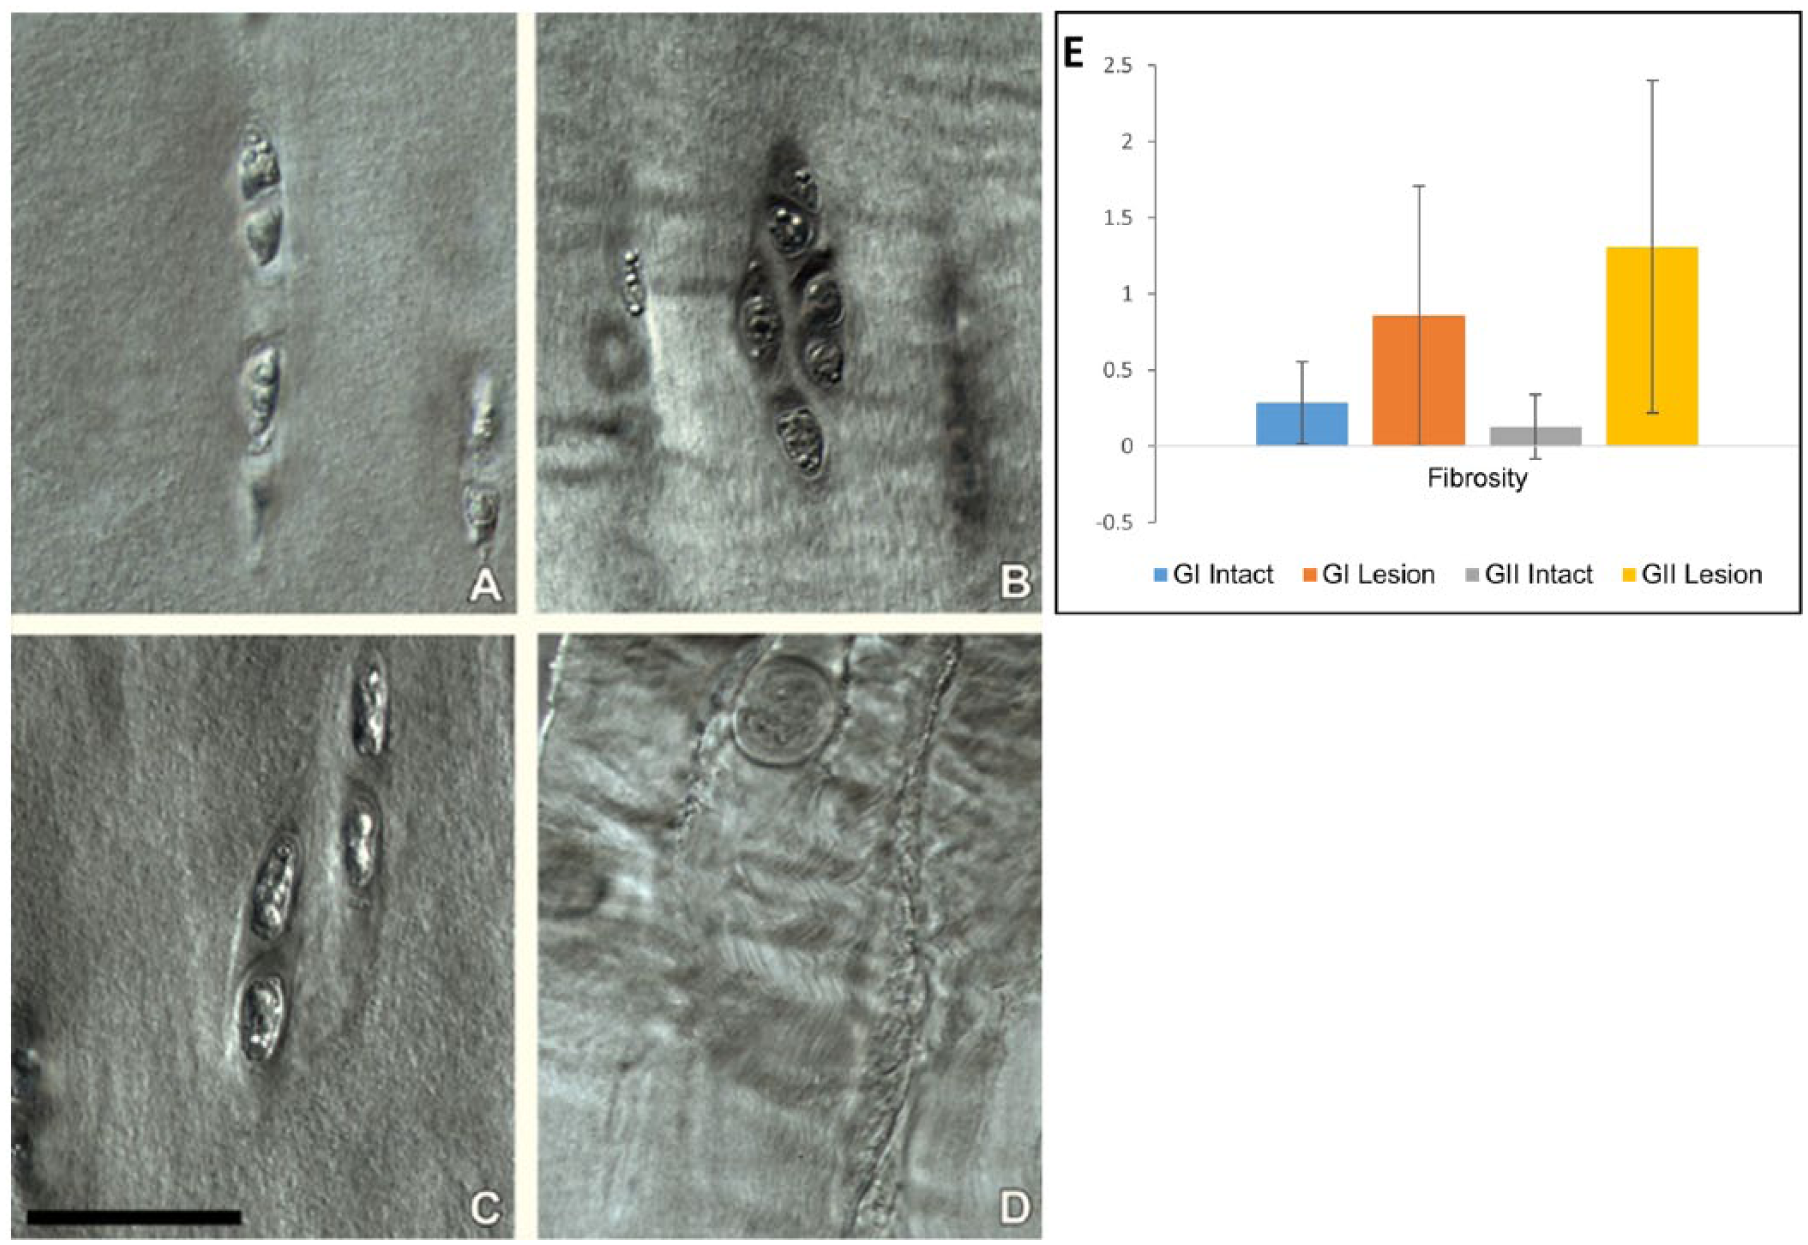
Differential interference contrast (DIC) images of the mid-zone cartilage matrix for tissues obtained from (
The osteochondral junction in the control tissues showed a clearly defined zone of calcified cartilage (ZCC) with the bone cement line well below the uppermost most tidemark (see Supplementary Fig. S4, available in the online version of the article). Progressing from the control to the intact tissue in the GI patellae ( Fig. 6A ), there appeared to be a relative increase in mineralization (as indicated by the ZCC thickness) with the most significant changes occurring at the lesion site ( Fig. 6B ) where the ZCC was disrupted intermittently by bone spicules growing toward the uppermost tidemark. These spicules were less obvious in the intact region of the GII patellae, instead appearing more blended with the bone cement line ( Fig. 6C ). Figure 6D is from a GII lesion site showing remnants of a micro-damage in the ZCC with what appears to be reactive tissue growth into the articular cartilage resulting in a slight distortion of the surrounding matrix. The changes in the bone cement line calculated using rugosity index (ratio of the irregular cement line divided by horizontal tidemark), failed to identify any significant difference between the groups (refer to Supplementary Table S2, available in the online version of the article, for detailed DIC-based scores).
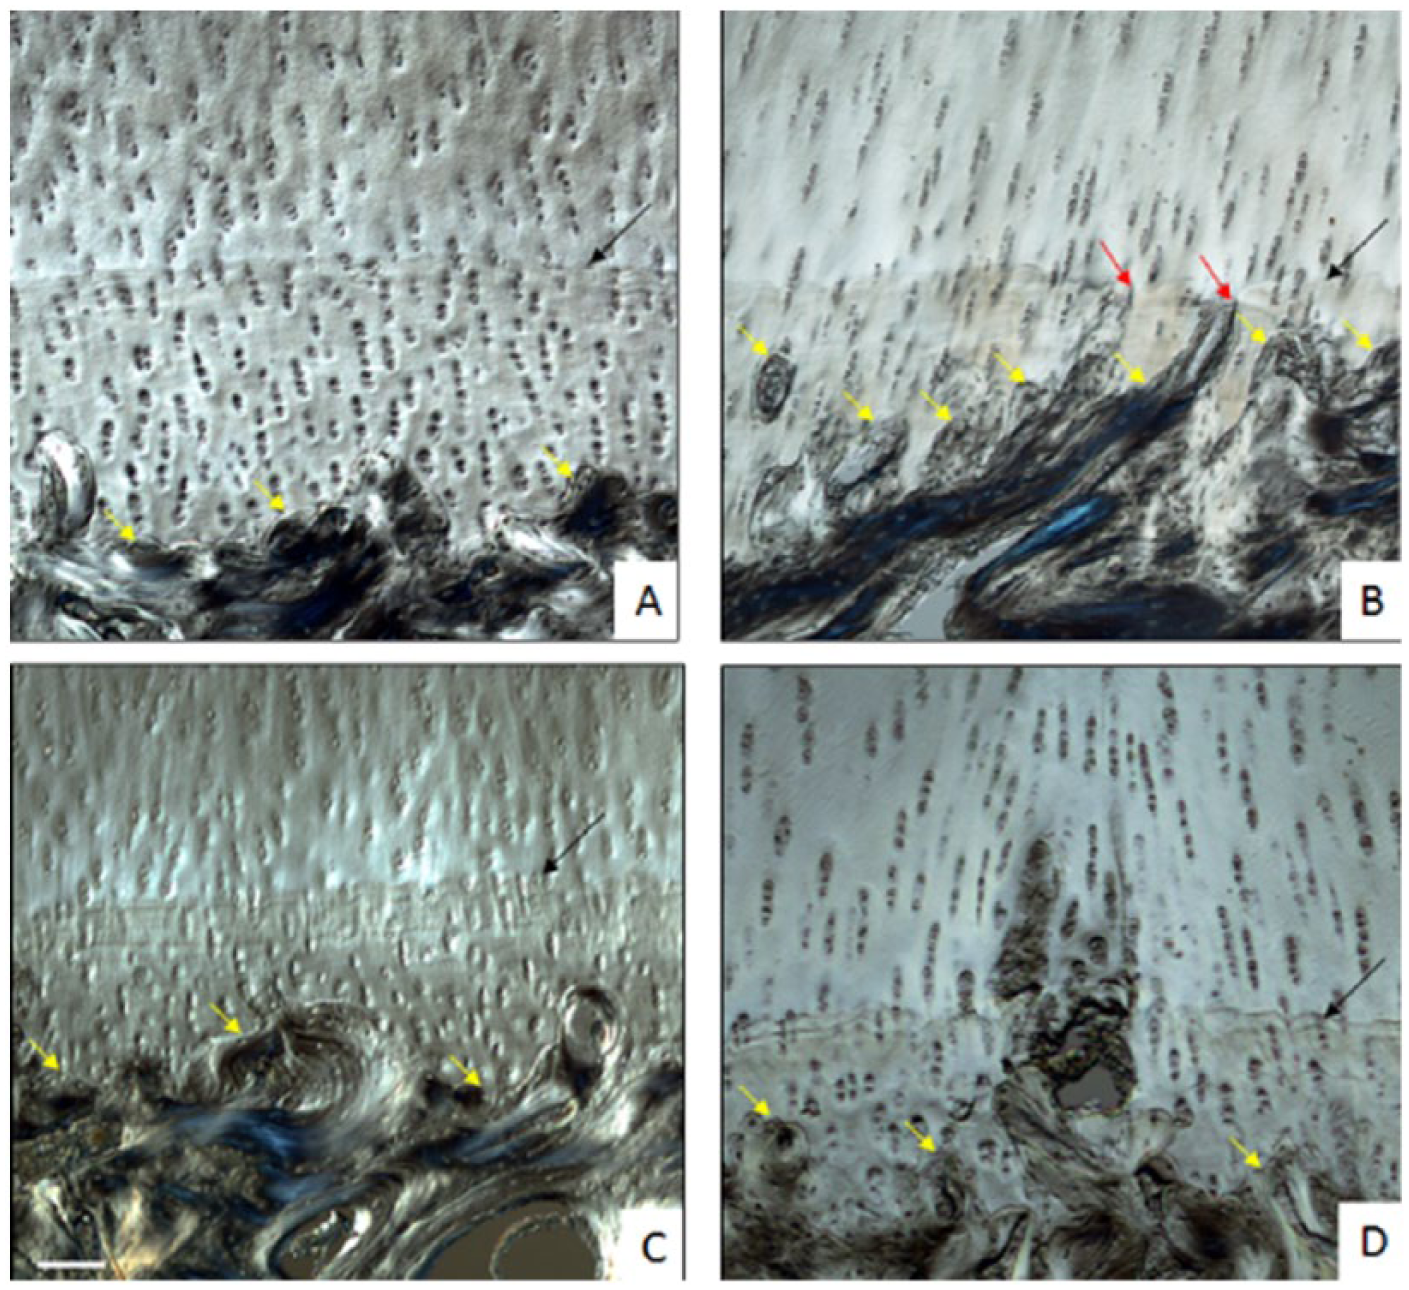
Differential interference contrast (DIC) images of zone of calcified cartilage (ZCC) in (
Proteomic Analysis
Discovery Proteomics
A total of 191 proteins was identified in this study from the 30 samples analyzed over 6 independent iTRAQ experiment—109 proteins were detected in normal samples and 166 proteins in degenerated samples.
We looked for significant inherent regional variations in the control patellae (Supplemetary Table S3). This led to the finding that except for 3 proteins (collagen IX alpha 3 [COL9A3], tetranectin [CLEC3B], and osteoglycin [OGN]), the changes in protein levels between the 2 sites were not significant.
For the intact and lesion sites of the 12 degenerated patella, 166 proteins were analyzed, of which 46 proteins displayed statistically significant regional differences (P < 0.05) (Supplementary Table S4). Among these, 21 proteins showed lower level and 23 showed higher level in the lesion samples of both GI and GII patellae compared with their respective intact tissues. The Sidak’s multiple comparison test was performed for proteins with P < 0.05 after RM 2-way ANOVA. Four different comparisons were made: GI intact versus GI lesion, GII intact versus GII lesion, GI intact versus GII intact, and GI lesion versus GII lesion.
The posttest identified a stronger difference between GI intact and GI lesion ( Table 1 ). Of the 24 proteins that were significantly different between GI intact and GI lesion sites, 16 had higher level at lesion sites and 8 had lower level. GII intact and GII lesion also had 10 proteins which were significantly different in that group. Only 2 proteins were significantly different among GI intact and GII intact-site cartilages whereas 3 proteins were significantly different when the lesion site samples from GI and GII patellae were compared. Table 1 also presents the microstructural changes observed in these comparisons.
Number of Proteins with Significant Difference (P < 0.05) after Sidak’s Multiple Comparison Test and Corresponding Microstructural Changes Seen between 2 Groups of Patellae (GI and GII) and 2 Tissue Types (Intact and Lesion).
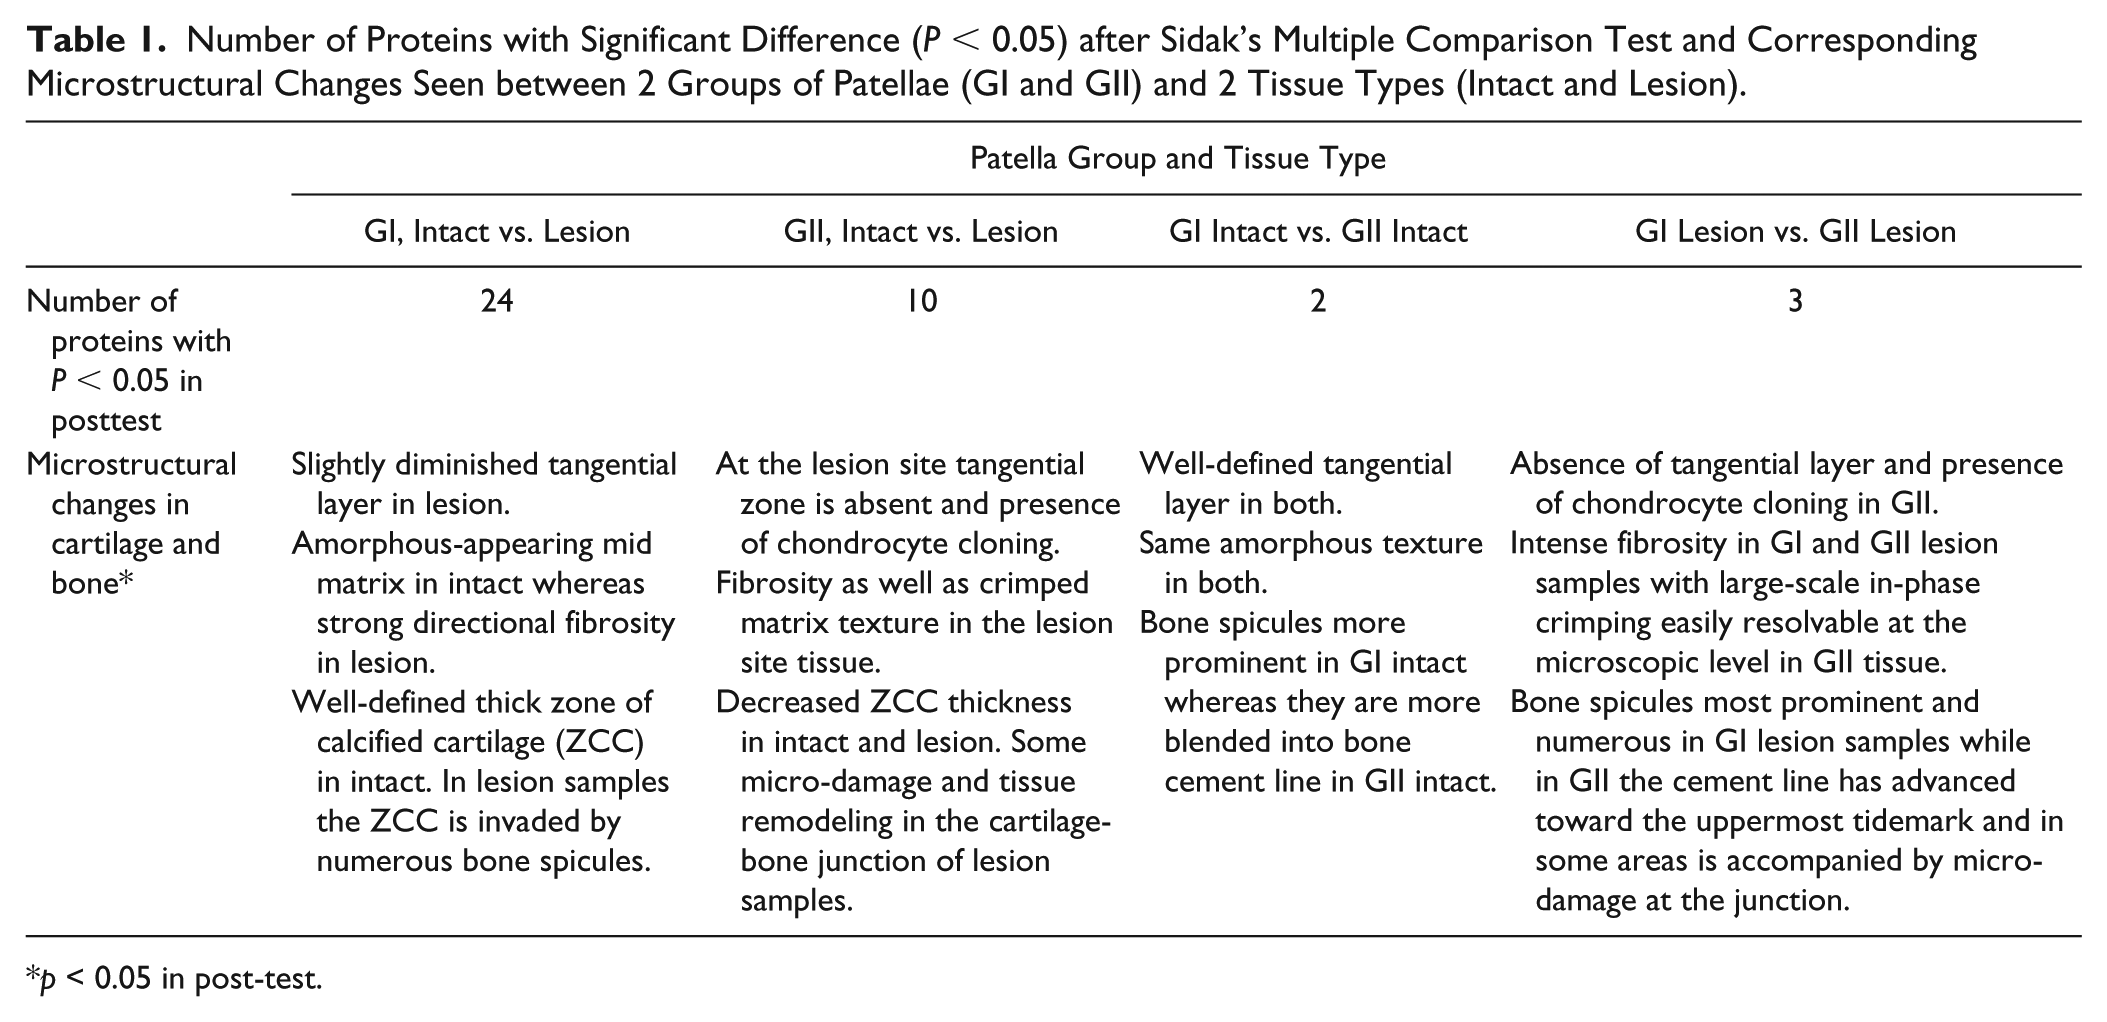
p < 0.05 in post-test.
Of particular interest to us were those proteins in the lesion samples that showed a significantly raised or lowered abundance level relative to their respective intact sites in GI patellae ( Table 2 ) and GII patellae ( Table 3 ). Among these, ACAN, LYZ1, and C4A abundance levels were significantly reduced, while transforming growth factor-b-induced gene product-h3 (TGFBI) was significantly increased, in lesion sites of the mildly (GI) and moderately (GII) degenerated patellae. Compared with intact cartilage, lesion cartilage samples of the mild (GI) patella showed a large and significant reduction in the novel protein, WAP 4-disulfide core domain 18-like (WFDC18) protein, but did not change significantly in GII patella.
GI Patellae Group: Proteins Found in All 7 Patellae for This Group and Which Showed Significant Difference in Their Lesion and Corresponding Adjacent Intact Cartilage Samples (P < 0.05) after Sidak’s Multiple Comparison Test.
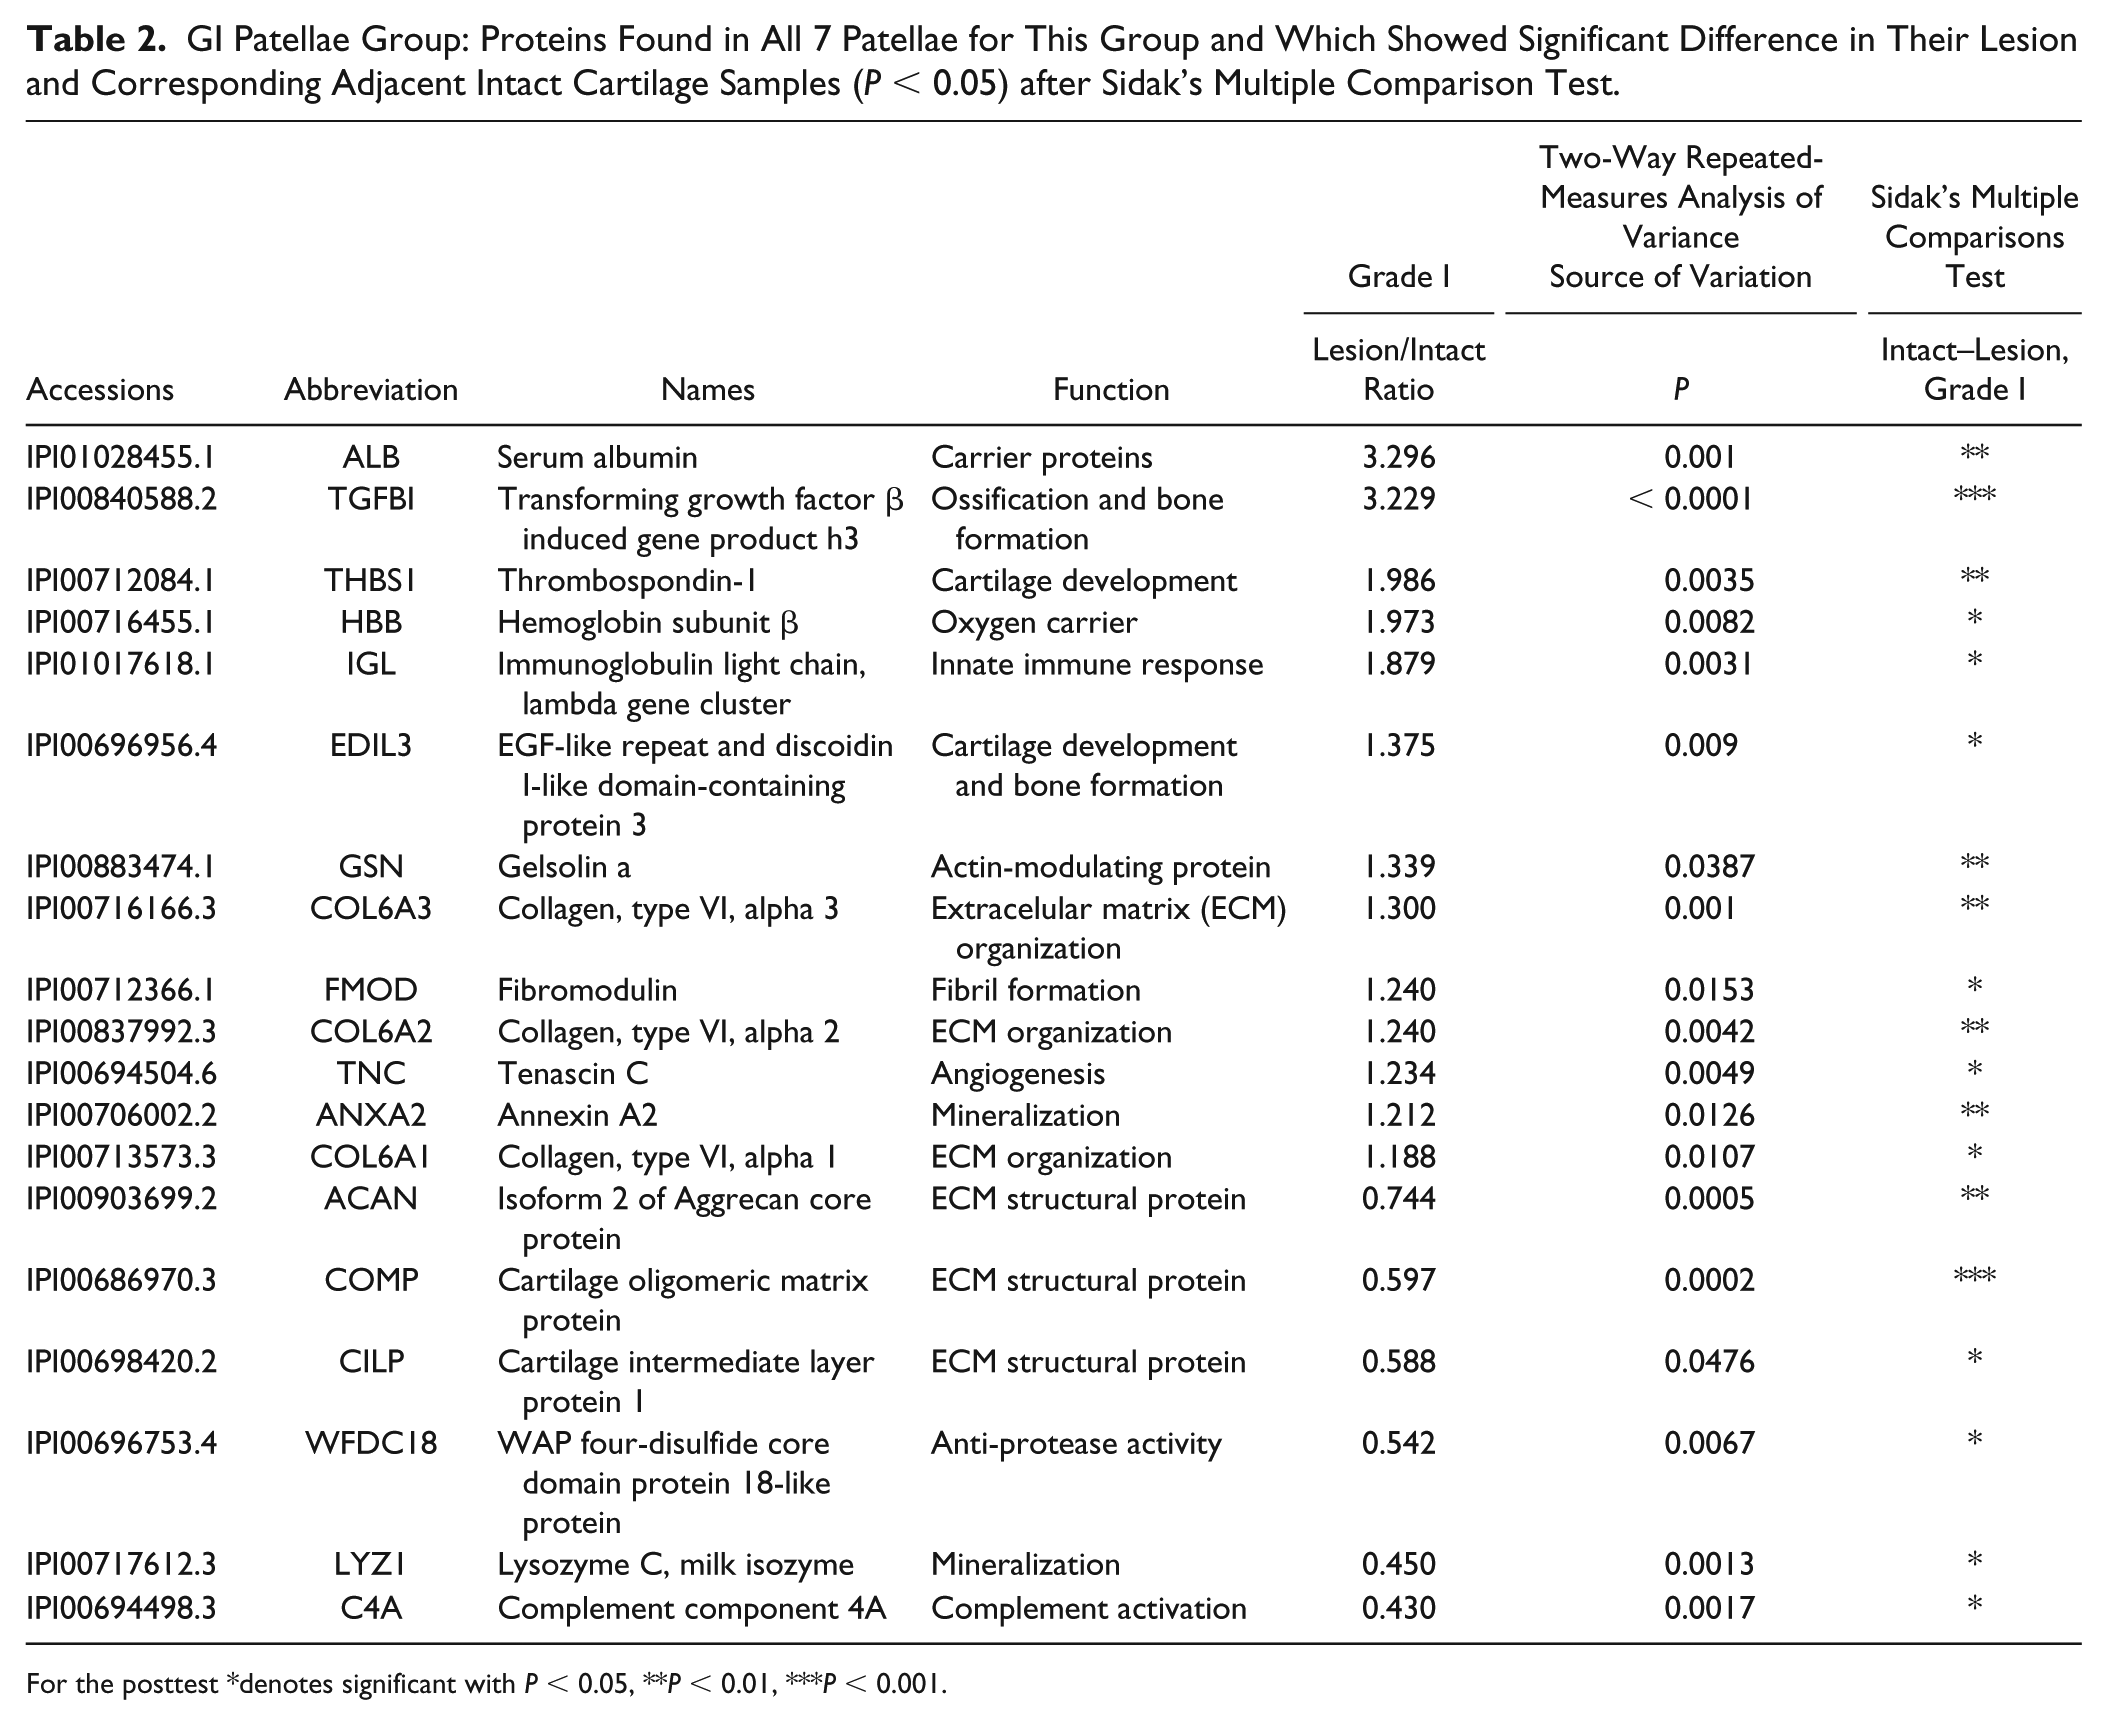
For the posttest *denotes significant with P < 0.05, **P < 0.01, ***P < 0.001.
GII Patellae Group: Proteins Found in All 5 Patellae of This Group and Which Showed Significant Difference in Their Lesion and Corresponding Adjacent Intact Cartilage Samples (P < 0.05) after Sidak’s Multiple Comparison Test.
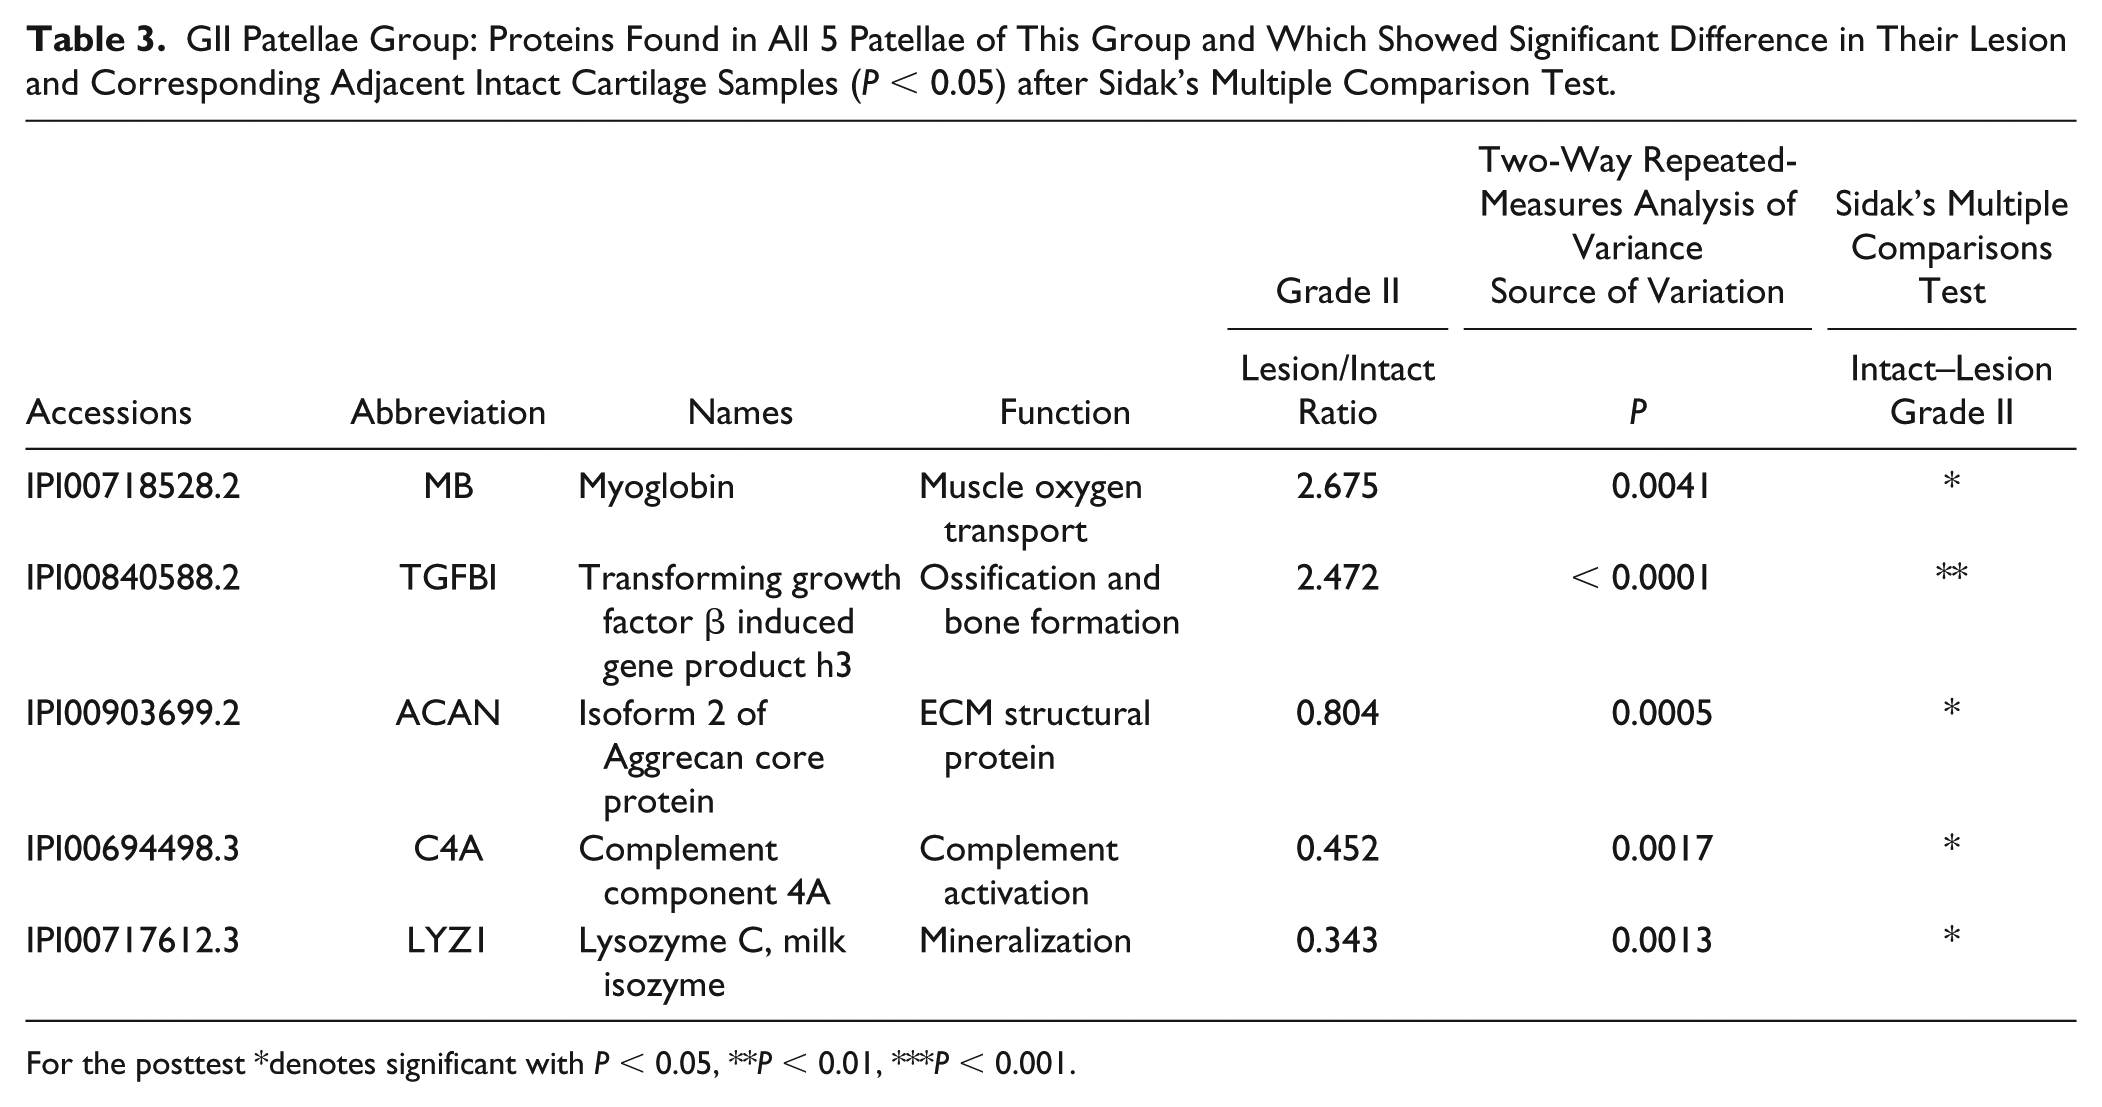
For the posttest *denotes significant with P < 0.05, **P < 0.01, ***P < 0.001.
Targeted Proteomics
For validation, 8 proteins of interest from the first (discovery) part of the study were selected for a further (targeted) study using MRM assay. The peak areas for MRM transitions were integrated as measures of peptide abundance and compared with the reference peptides selected for targeting in 6 cartilage groups (n = 3 per group) as shown in Table 4 . Significant differences in relative abundance between cartilage groups were analyzed for all proteins using a repeated-measures 2-way ANOVA followed by a Sidak’s multiple comparisons test (GraphPad Prism 6). All the 8 selected proteins were found to differ significantly between the groups and ratios (Table S5) were generally in good accordance with the iTRAQ experiment.
Multiple Reaction Monitoring (MRM) Transition List: Peptide Transitions Optimized for the MRM Experiment.
The posttest showed significant differences (P < 0.05) in 4 proteins: ACAN, GSTP1, LYZ1, and VIM. The fact that not all selected proteins showed significant difference between groups in the MRM validation study may be due to the smaller sample size (n = 3) used in the targeted study.
Comparison of Discovery and Targeted Proteomics
Compared with the discovery phase, the changes in relative abundance found by targeted MRM analysis for ACAN, LYZ1, and ANG1 followed the same pattern across all cartilage groups ( Fig. 7A ). The MRM analysis for C4A, CCL16, GSTP1, and WFDC18 showed an almost similar variation for the GI cartilage groupings to the discovery phase iTRAQ study but was different for the GII cartilage groupings ( Fig. 7B ). Whereas VIM had slightly different trend in GII lesion group when MRM work was compared with the iTRAQ result ( Fig. 7A ). This slight change in the overall trend in MRM experiment was limited only when the GI intact was taken as reference point, alternatively the comparison of intact to its corresponding lesion site in both GI and GII patellae followed the same trend as in iTRAQ investigation.
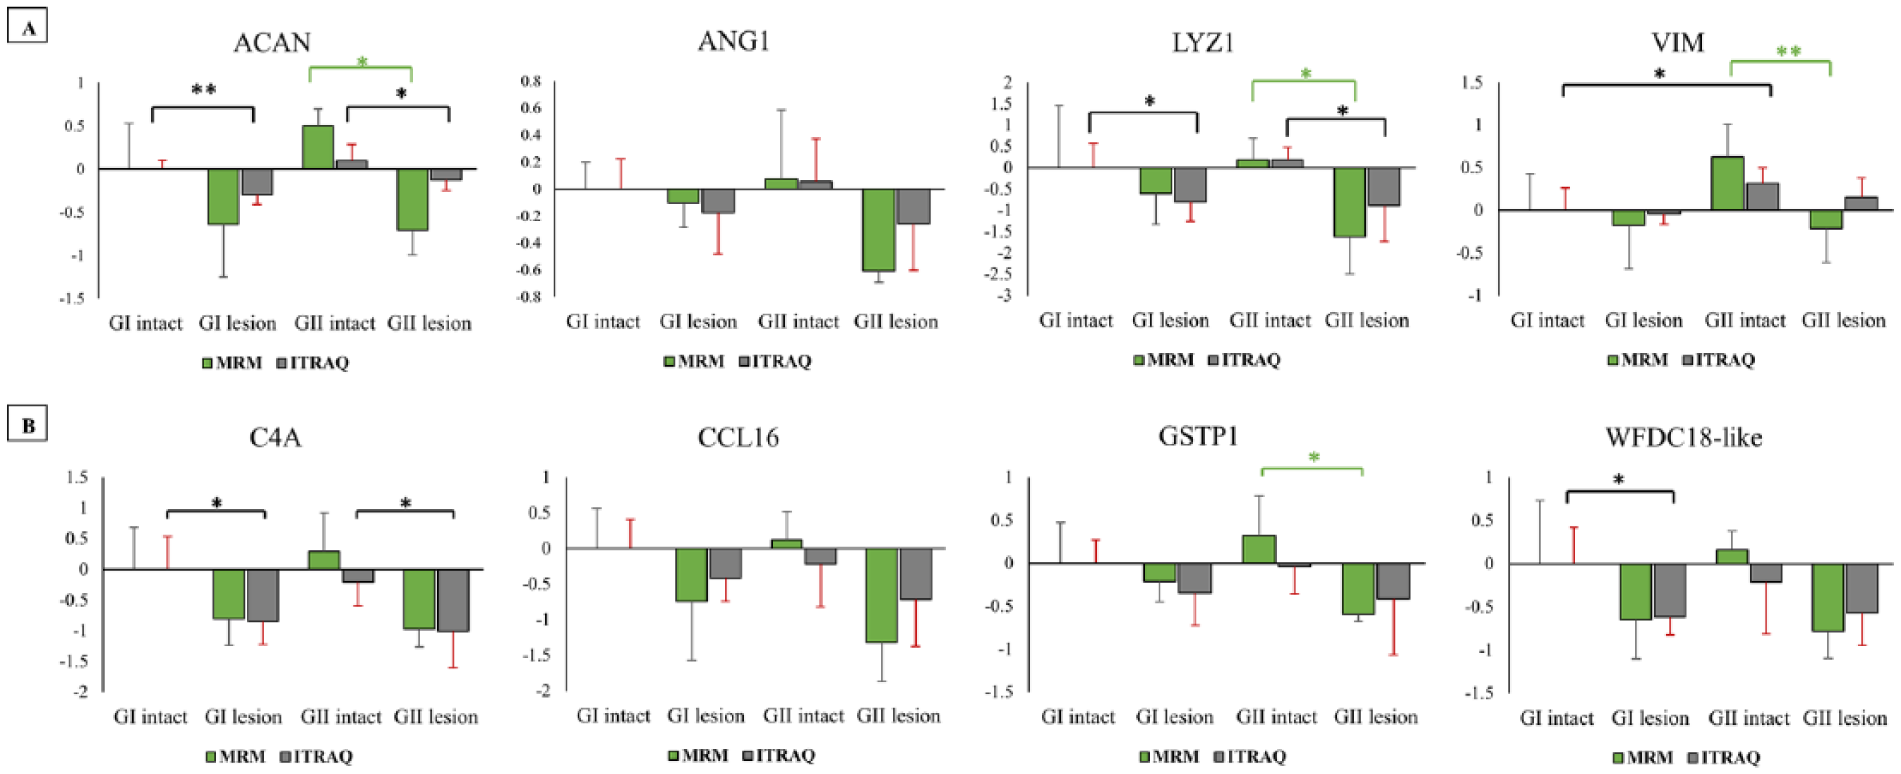
Ratios of natural log (LN) value of proteins found significant in iTRAQ and multiple reaction monitoring (MRM) experiment. For each protein the GI intact is scaled to 0 in log space and represents “no change,” and other are relative to that. (
Discussion
To summarize the results, this study found that in the healthy cartilage pairs, there was no significant variation in protein profiles between two adjacent sample sites. In pairs of tissue that were healthy and contained a lesion, there were both significant microstructural changes as well as the difference in abundance levels of 24 proteins, for both pairs of healthy/GI and healthy/GII. The results should be noted in context of the inherent considerable limitations to a discovery approach, where the protein profile data must overcome major computational challenges of identifying a protein, subject to probabilistic assessments, 27 which in turn is possibly subject to bias originating from how survey scans are carried out toward identifying only those proteins of high abundance in the samples. 28 The experiments conducted in the present study, with the number of samples used, were already extremely time-consuming and expensive and these practical issues further hinder the progress of any proteomics studies. However, to alleviate the potential problems of sample sizes, we used paired tissues from the same patellae to compare between healthy and degenerate cartilage, with the aim of reducing interanimal, and even interjoint variation. Therefore, any issues that arise, such as the inclusion of contaminants like synovial fluid and blood, should be considered in context of the samples having come from the same joint. Yet we still observed increased levels of contaminant proteins like serum albumin, immunoglobulin and hemoglobin in the GI lesion samples compared to their intact counterparts. These protein differences were not found between intact and lesion regions of the GII patellae. Why this is the case remains unknown but does not detract from the attention of this study to the levels of those proteins that have a role in cartilage and bone microstructure, and show a significant difference between adjacent sites.
By using the bovine model of early cartilage degeneration and providing a detailed microstructural analysis of the tissue state, the present study provides, for the first time, a tissue-structure based context in which to identify specific biomarkers associated with early degeneration of the joint. We believe that the correlation of protein changes with very subtle microstructural changes (see Table 1 ), and the corresponding proteomic profiles of early structural change ( Tables 2 and 3 ), offers the basis for gaining new insight into the very early-stage initial breakdown of the cartilage matrix. We propose that there are two aspects of the present study that is unique to the study of early cartilage degeneration and proteomics: (1) the association of subtle structural changes (i.e., grossly undetectable microscale changes of collagen fibril destructuring, bone spicule formation, and an advancing cement line) with specific protein profile changes and (2) the comparison of these protein profiles between tissue with subtle structural changes and its respective adjacent intact tissue with no such changes.
Squire et al. 29 stressed the importance of investigating early OA, and did so by studying human tissue with degenerative focal lesions seen in aging and compared them with the same characteristics as those observed in OA. In doing so, they proposed that the degenerative (but non-OA) changes in aging were representative of the early OA state. However, in that article by Squire et al., 29 the “early OA” degenerative lesion was still relatively advanced, in that the gross appearance of the surface layer was shown to include fibrillation and loss of safranin-O staining (see Squire et al., 29 figure 1). Our bovine tissue with early degeneration shows an even less obvious structural state of degeneration, where there is full thickness cartilage and a gross appearance that shows no overt surface disruptions, together with microstructural changes in the fibrillar matrix (see Supplementary Figure S2). Comparing also the present study on bovine tissue, with another study carried out on human tissue, 30 there are similarities and differences in both methods and results. Lourido et al. 30 compared human cartilage secretome from wounded (lesion) and adjacent unwounded samples, against tissue obtained from healthy knees. Thus they did not compare wounded versus unwounded, which we have done in the present study. The comparison of tissue within a joint we believe strengthens the power of the test. Furthermore, the Mankin scores of lesion tissue in Lourido et al. 30 ranged from 7 to 9, while in the present study the Mankin scores of degenerated tissue was between 1 and 5. We believe we have been able to capture, in our bovine model of pre-OA, a range of tissue states that represent a very early state of degeneration, difficult to obtain in human studies.
Therefore, in view of keeping the discussion of the findings within the scope and relevance of those proteins that may have a role in early structural degeneration ( Tables 2 and 3 ), the implication of these listed proteins is thus presented in relation to the five microstructural differences observed between the degenerated and intact regions, namely cartilage matrix de-structuring, proteoglycan loss, hypercellularity, new bone formation and angiogenesis. An additional sixth section on catabolic factors is included at the end of this discussion.
Cartilage Surface Disruption, Collagen Fibrillar Destructuring, and Reaggregation
Early degenerative changes in cartilage typically include fibrillar disruption of the tangential zone, destructuring of the matrix, and proteoglycans loss.22,31-33 In the present study the degradation of the tangential layer, along with the subtler destructuring of the cartilage general matrix, may be correlated with specific collagen metabolic and structure-related proteins.
COMP acts as a catalyst in linking the collagen molecules during fibril formation. 16 Previous studies have reported increased levels of COMP in the human serum during early OA. 18 CILP, a non-collagenous extracellular matrix (ECM) protein is associated with cartilage scaffolding 17 and is also known to be increased in early osteoarthritic cartilage. 19 The increase in these proteins could be interpreted as being a reparative response in “rebuilding” a failing matrix. Similar to these previous studies, and comparing G0 cartilages (controls) to the degenerated samples (both GI and GII), we saw a higher level of COMP and CILP in the GI and GII group samples (see Supplementary Table S5).
Of interest was the regional difference in the levels of these two proteins across mildly degenerated patellae (GI) where the COMP and CILP-1 were found to be significantly lower in the lesion site. These lower levels of COMP and CILP at the lesion site ( Fig. 8A ) were associated with a reduced tangential zone seen in the corresponding degenerated site ( Fig. 4B ). These 2 protein levels between intact and lesion sites were not significantly different in the GII patellae even though their corresponding cartilage surface structure ( Fig. 4C and 4D ) were significantly different; at the intact site was a well-preserved tangential layer and at the corresponding lesion site was a mostly absent one. However, there were increased number of chondrocyte clusters in the GII lesion site tissue ( Fig. 4D ). It is possible that the presence of these large cell clusters may be responsible for the relative increase in COMP and CILP-1 in this region. We also suspect that these initial stages of degeneration in our GI and GII groups are still considerably not advanced to a higher level of degeneration. However this is mere speculation and requires testing of more degenerated tissue possibly with GIII and GIV lesions 2 where we hypothesize that the site-specific differences in COMP and CILP-1 will remain insignificant.
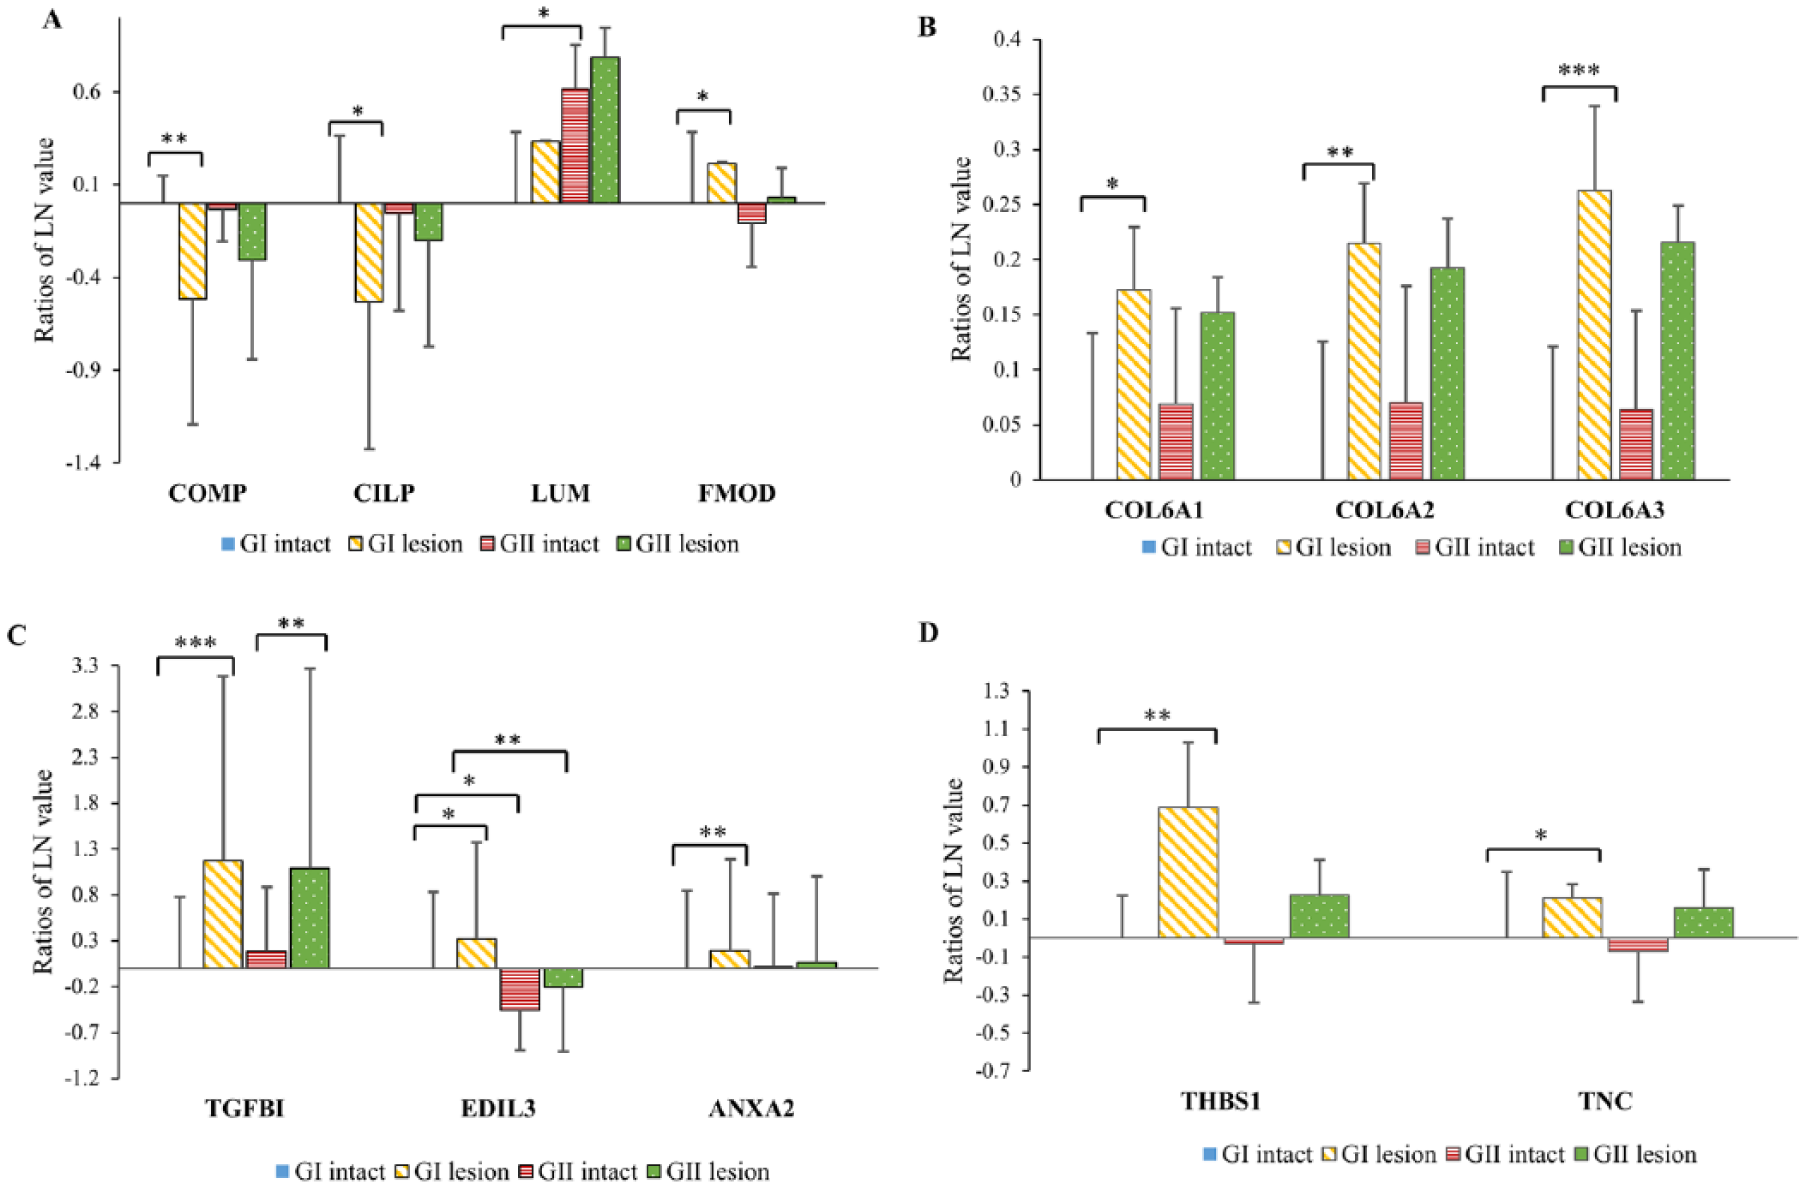
Scaled natural log (LN) ratios of proteins found to have potential role in (
We also found in the lesion sites increased levels of lumican and fibromodulin which belong to the small leucine-rich proteoglycan (SLRP) family. The level of lumican in GII intact site was also significantly increased ( Fig. 8A ). Melrose et al. 34 showed increased level of SLRP fragments in degenerated human cartilage compared with age-matched controls. Lumican and fibromodulin are known to be involved in fibrillogenesis and competes for the same binding site on the collagen fibril and they also influence collagen cross-linking. 35 It is possible that these SLRPs are involved in the increased re-aggregation (i.e., following destructuring) of the fibrils into larger optically resolved bundles ( Fig. 5B and 5D ). Importantly, SLRPs coat the fibril surface and have been shown to impede the fibril’s access to proteinases such as MMP-1 and MMP-13. 36 Furthermore, Monfort et al. 37 have shown that SLRPs are degraded by MMP-13 and suggest that the protease-driven cleavage of the SLRP may be a critical initial event in cartilage degeneration preceding collagen cleavage.
Hypercellularity in the Chondrons
The large cluster of cells in the chondrons of the lesion samples ( Fig. 4D ) are associated with chondron pericellular remodeling in the degenerating matrix. 38 Type VI collagen is largely involved in the formation of the chondron pericellular matrix (PCM)38,39 and by its association with hyaluronan, decorin and fibronectin, it aids in anchoring the chondrocyte to the PCM. Molecules such as cytokines and various growth factors which come in contact with chondrocytes, pass through the PCM, which acts as a screening point modulating the transiting molecules. 40
Mechanically the PCM acts as a transition between the stiffer matrix outside the chondron and the considerably more compliant chondrocyte that the PCM effectively cushions. 39 The increased levels of type VI collagen measured at the lesion sites (significant increase seen only in GI patellae) ( Fig. 8B ) may reflect an early attempt to stiffen the PCM matrix, to protect the chondrocytes rendered increasingly vulnerable because of a weakened extracellular structural (interterritorial) matrix arising from fibril-network destructuring. This hypothesis is supported by earlier studies showing that chondron remodeling and cluster formation is sensitive to the stiffness gradients across the pericellular, territorial, and interterritorial matrices. 38 Others too have suggested that type VI collagen may affect the mechano-transduction signals from the ECM into the chondrocytes. In human lesion samples taken from advanced OA cartilage, the proliferating chondrocyte clusters and their surrounding ECM demonstrated strong staining for type VI collagen mRNA. 31 This supports the hypothesis that the chondrocytes are attempting to adapt to the above structural changes by sequestering the type VI collagen. 38
Vimentin, an important cytoskeletal element in chondrocytes was found to have decreased levels at the lesion site of patellae with both GI and GII grade of degeneration compared with their intact regions. This finding was validated with MRM method and supports the earlier studies where reduced expression of vimentin was seen in chondrocytes from rat osteoarthrosic model 41 and increased vimentin degradation products seen in cells from human lesion samples. 42
Proteoglycan Loss
While the smaller proteoglycans (<50 kDa) such as lumican and fibromodulin showed an increase in abundance in the lesion tissue sites compared to the adjacent intact sites, there was a significant reduction in the levels of aggrecan (large proteoglycan aggregates >2500 kDa) ( Figs. 3B , 3D , and 7A ), which was confirmed by MRM analysis too. This reduction in aggrecan level at the lesion sites may be linked to the catabolic mechanisms occurring in cartilage. 43 In these, proteases and other degradative molecules attack the aggrecan core protein as well as its hyaluronan (HA) backbone. Any recovery from this initial damage phase, is hampered by the HA-bound aggrecan fragments which prevent the newly synthesized aggrecan molecule from binding at the impaired site. 33
Proteoglycan aggregates are also known to prevent calcium phosphate from precipitating in the cartilage. 44 Lysozymes produced at higher concentrations by chondrocytes 45 during the early stages of OA, cleave the HA backbone of the proteoglycan aggregates, releasing proteoglycan monomers that no longer hamper the precipitation process 44 and thus promotes the mineralization. In our degenerated patellae, the lysozyme levels in the intact cartilage regions were more than double those in the corresponding lesion sites ( Fig. 7A ) and this finding was validated by MRM experiment. It is possible that the increased thickness of ZCC at the intact sites of the GI OA tissues ( Fig. 6A ) is a consequence of the enhanced mineralization taking place due to the higher levels of proteins like lysozyme at these regions.
We therefore hypothesize that the significant increase in the lysozyme level in the intact site may be a precursor to the eventual decline in the aggrecan level in the lesion site. This would also reinforce earlier suggestions that the structural transition from the intact to lesion regions of cartilage in a joint is an analogue for the pathway from initiation to progressive degeneration of the joint tissues in OA.3,8
Mineralization and New Bone Formation
The new primary bone formation that Thambyah and Broom 8 reported previously in their structural study of the early or pre-OA joint, was shown to commence during early cartilage degeneration. The process involved the upward growth of distinct bone spicules containing a central vascular channel from the cement line, and traversing the increased width of the ZCC between the articular cartilage and underlying bone. Thambyah and Broom 8 showed that the spicules are similar to the cutting cones seen in the fracture healing of bone 46 and these are clearly visible in micro images of the tissue in the present study ( Fig. 6B ).
With regard to protein levels, the lesion sites in the degenerated patella showed varying levels often associated with mineralization and bone formation. TGF-βI, EGF-like repeat discoidin I-like domain-containing protein 3 (EDIL3), and annexin A2 (ANXA2) all increased significantly at the GI patellae lesion sites ( Fig. 8C ) whereas LYZ1 decreased ( Fig. 7A ). EDIL3, which is reported to be involved in cartilage development and bone formation, 47 showed significant difference between the GI and GII intact regions and also GI and GII lesion sites ( Fig. 8C ). Importantly, the GI lesion site contained the most abundant level of EDIL3. This abundance is accompanied by the most amount of bone spicule expression in the ZCC ( Fig. 6B ) where in some cases the spicules have crossed the uppermost tidemark. This association between EDIL3 levels and bone spicule formation provides an intriguing direction for future investigations.
Of particular interest too is the significant increased level of TGFβI in the GI and GII lesion sites compared with their respective intact sites. This protein is induced by TGF-β and it facilitate cell interactions by binding to various collagens and SLRPs. 48 Experiments conducted on TGFBI knocked out mices revealed that TGFBI helps in maintaining bone and cartilage ECM and also prevents MMPs from attacking the collagen frameworks. 49
Angiogenesis
The avascular cartilage is sustained metabolically by the subchondral bone and the synovium. Normal cartilage actively maintains its avascularity by balancing pro- and anti-angiogenic factors. 50 However, we found that THSB1, an anti-angiogenic factor, 51 was significantly lower at the intact site of GI patellae ( Fig. 8D ). THSB1 binds to angiogenic factors such as vascular endothelial growth factor (VEGF) preventing their binding to receptors 52 and was previously found to be increased in mild and moderate osteoarthritic cartilage. 53
Furthermore, pro-angiogenic CCL16 is a cytokine that promotes endothelial cell migration required for vascular formation and has been found to be upregulated in arthritic patients. 54 It is also known to induce the release of other pro-angiogenic factors 55 and was seen to be elevated in the intact cartilage regions in this study and was confirmed by MRM assay ( Fig. 7B ). Finally, angiogenin (ANG1), another pro-angiogenic molecule associated with neovascularization, was found to be increased at the intact site both in iTRAQ and MRM experiments ( Fig. 7A ). Although at first sight, these changes in angiogenic factors seem confounding, there was also a significant decrease in pro-angiogenic tenascin (TNC) in the intact site ( Fig. 8D ), a factor known to promote vascularization. 51 Others have also shown that the tenascin deficiency progressed during cartilage degeneration in spontaneous and induced OA models. 56 This rise and fall of pro- and anti-angiogenic factors across 2 regions in the early OA patella may indicate a complex interplay of factors attempting to sustain some level of homeostasis in a failing tissue.
Cartilage’s Response to Catabolic Influences
In osteoathritic cartilage increased hypoxia is observed, 57 which in turn induces angiogenesis, 58 illustrating the stress-related homeostatic nature of this process. During joint disorders, the lowered oxygen levels in cartilage alters the levels of reactive oxygen species (ROS). 59 ROS have the normal physiological function of acting as signaling molecules in chondrocytes but their higher levels in cartilage have detrimental effects leading to pathological results. To tackle excess ROS, antioxidants are present in the cartilage—GSTP1 is one such enzymatic antioxidant. GSTP1 scavenge for the degradative radicals generated in the cartilage. 60 Earlier studies have reported increased synthesis of GSTP1 by the OA chondrocytes compared with healthy chondrocytes. 61 We found a decrease in GSTP1 at the lesion site ( Fig. 7B ) compared with intact site, suggestively making the degenerated tissue more susceptible to ROS.
C4A released during the classical complement pathway have been found to increase in osteoarthritic synovial fluid. 62 The excessive complement activation by the cartilage ECM fragments is suggested to cause cartilage degeneration, inflammation and chondrocyte apoptosis. 63 Reports also suggest that inflammation may precede structural changes in early OA and that the complement activation can trigger further cartilage damage. 64 We observed significantly lower level of this protein at the lesion sites compared with the adjacent intact in both GI and GII patellae ( Fig. 7B ). To explain our findings, we suggest that first, previous studies 62 having sampled from the synovial fluid may not have been able to resolve on the actual source for the increase in C4A. Second, that the intact site in GI and GII patellae, showing a relatively higher level of C4A, could be indicative of the site’s response to the adjacent lesion. This site dependent variation of proteins GSTP1 and C4A were further validated by MRM method.
Finally, also of much interest is the novel secretory 65 protein—WAP 4-disulfide core domain protein 18-like. Although this protein has not been sufficiently characterized to determine its biological function in cartilage, it being the structural motif of a WAP 4-disulphide core (WFDC) domain may indicate its possible role in the tissue. Similar structural motifs are present in serine protease inhibitors which prevents serine proteases from attacking the cartilage. Thus WAP proteins possibly could have a protective function in tissue during early cartilage degeneration. In addition, WAP containing proteins also control the inflammation through anti-protease activity. 66 and by regulating the pro-inflammatory factors. 67
We thus propose further investigations on whether WFDC18-like protein are active in early cartilage degeneration by inhibiting serine proteases in the tissue and thus protecting the collagen fibrils from further degeneration. Such a functional presentation of WAP proteins suggest that the higher expression of WFDC18-like protein in the intact site cartilage could be some type of defensive action by which the tissue is trying to prevent the impending degeneration. The prominent presence of WFDC18 in intact cartilage of mildly degenerated patellae ( Fig. 7B ) along with the MRM validation also suggests its potential as a possible biomarker for early OA.
Another promising future direction for this work is in correlating the matrix protein changes to specific patterns of microstructural modification, to explore the hypothesis of early OA initiation and progression. From the data of this study, such an exploration of the initiation and progression of OA is depicted schematically in Figure 9 . The presence of features such as surface cleft or fissures, fibrillar network destructuring, and aggregation, and increased mineralization and vascularized channels in the osteochondral region could, in various ways, contribute to elevated levels of communication between the cells via biological factors interactions and signaling pathways. 68
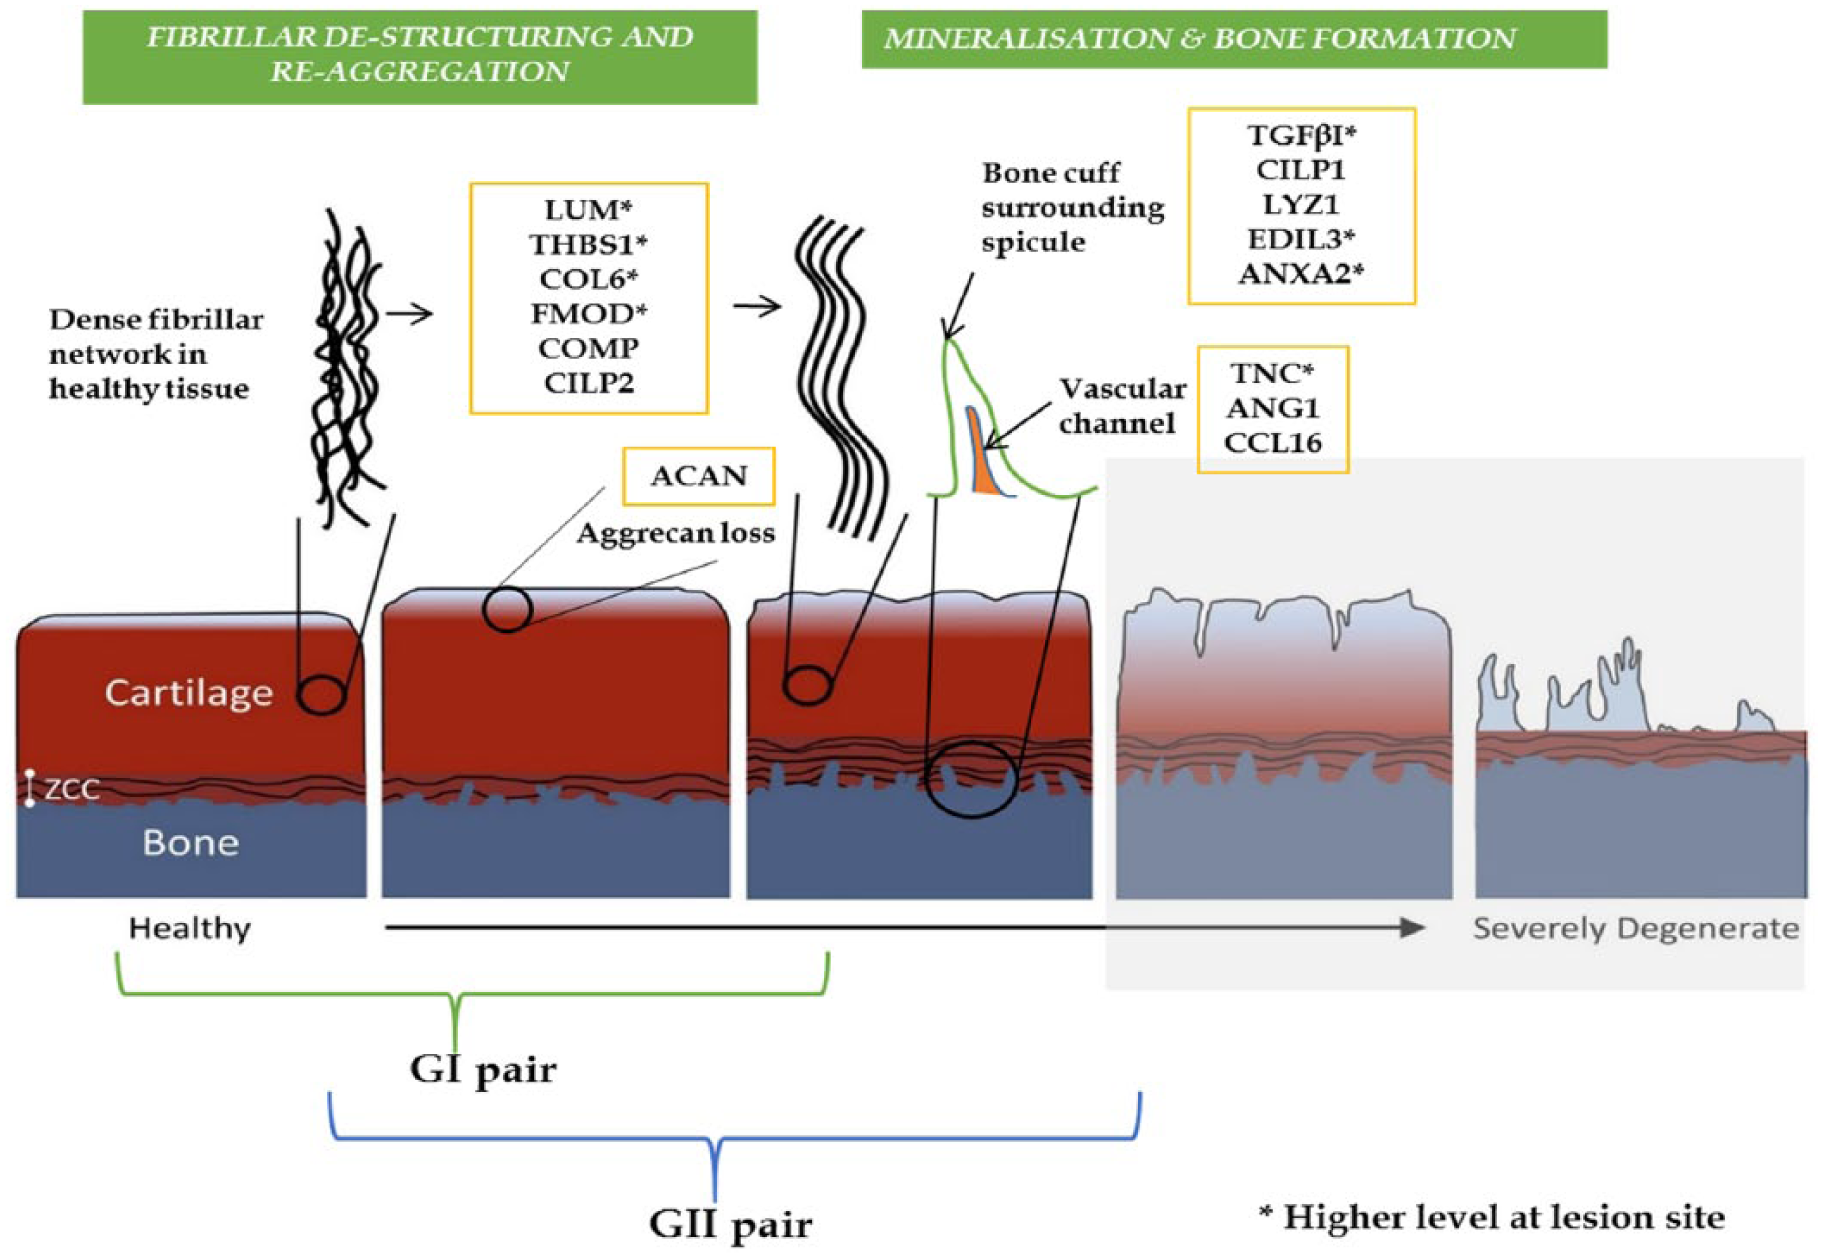
Schematic illustrating the proposed early progression of osteoarthritis (OA) involving significant changes in tissue structure, histological staining response and protein levels. The samples from the present study fall largely within the first 4 stages where there appears to be an adaptive change in the zone of calcified cartilage (ZCC) related to changes in the fibrillar structure of the articular cartilage matrix. The proteins indicated here are described in more detail in Tables 2 and 3 and in the text. Several key proteins specifically found to be relevant to the microstructural changes reported in this study are highlighted.
Conclusions
Although, between 2 adjacent sample sites in normal cartilage, there is no significant regional variation in protein profiles, the adjacent regions of intact and mild/moderate degenerated cartilage have prominent structural and proteomic changes. In those proteins showing changes, their known functions were found to be strongly aligned with the specific microstructural changes observed in the tissue samples. These proteins identified presents a unique protein ensemble that could help understand the initiation and progression of early cartilage degeneration.
Supplemental Material
CART809401_Supplemental_Material – Supplemental material for Protein Levels and Microstructural Changes in Localized Regions of Early Cartilage Degeneration Compared with Adjacent Intact Cartilage
Supplemental material, CART809401_Supplemental_Material for Protein Levels and Microstructural Changes in Localized Regions of Early Cartilage Degeneration Compared with Adjacent Intact Cartilage by Bincy Jacob, Mia Jüllig, Martin Middleditch, Leo Payne, Neil Broom, Vijayalekshmi Sarojini and Ashvin Thambyah in CARTILAGE
Footnotes
Acknowledgments and Funding
The author(s) disclosed receipt of the following financial support for the research, authorship, and/or publication of this article: The authors are grateful to Arthritis New Zealand for the funding of this project.
Declaration of Conflicting Interests
The author(s) declared no potential conflicts of interest with respect to the research, authorship, and/or publication of this article.
Ethical Approval
Ethical approval was not sought for the present study because this study did not involve human data nor live animal testing. All tissues used in this study were obtained from the local meat production industry.
Animal Welfare
Guidelines for humane animal treatment did not apply to the present study because all samples were obtained from the local abattoir or meat processing plant.
Supplemental Material
Supplemental material for this article is available online.
References
Supplementary Material
Please find the following supplemental material available below.
For Open Access articles published under a Creative Commons License, all supplemental material carries the same license as the article it is associated with.
For non-Open Access articles published, all supplemental material carries a non-exclusive license, and permission requests for re-use of supplemental material or any part of supplemental material shall be sent directly to the copyright owner as specified in the copyright notice associated with the article.