
Abstract
Objective
To investigate the association of cartilage defect severity, as determined by the International Cartilage Repair Society (ICRS) grading with indentation stiffness and T2 relaxation time of magnetic resonance imaging (MRI), a biomarker for the integrity of articular cartilage.
Design
Twenty-one patients scheduled for arthroscopic were included in the study. Prior to arthroscopy, subjects underwent quantitative MRI of articular cartilage, namely T2 relaxation time mapping at 1.5 T. Within 2 months, subjects underwent arthroscopy, which also included ICRS grading and measurement of arthroscopic indentation stiffness. Arthroscopic evaluations and T2 mapping at anterior, central, and posterior medial and lateral femoral condyles were correlated using a colocalization scheme. Differences in Young’s modulus, as derived by indentation tests, and T2 times between ICRS grades were analyzed using Mann-Whitney’s U or Kruskal-Wallis H tests. The correlation between modulus and T2 times was analyzed using Spearman’s rank correlation coefficients.
Results
Modulus and T2 showed significant topographical variation. In the anterior region of interest (ROI) on the medial condyle the modulus showed a negative association with ICRS grade (P = 0.040) and the T2 times were longer in ICRS grade 2 compared with grades 0 and 1 (P = 0.047). Similar, but nonsignificant associations were found in the central ROI on the medial condyle. No significant correlations were observed between the indentation modulus and T2 times.
Conclusions
Cartilage degeneration is identified both with mechanical indentation and T2 mapping in MRI. However, in this study, indentation stiffness and T2 relaxation time in vivo, were not associated.
Introduction
Osteoarthritis (OA) is the most common degenerative joint disease, having a major impact on the quality of life, public health, and economy.1-3 OA inflicts changes on both cartilage structure and function. The earliest effects of OA on cartilage have been reported to include the decrease of proteoglycan content and alterations in collagen network. 4 These alterations together with increased water content increase the permeability and decrease the mechanical stiffness of the cartilage. 5 Softened cartilage is prone to fissures and further fibrillation as it fails to resist impact forces during normal loading. 6 The complete cause-effect chain of biomechanical, structural, and biochemical aspects of cartilage deterioration, however, remains unclear.7,8 The diagnosis of OA is traditionally based on patient’s clinical symptoms and radiographic findings. The information from this indirect investigation of joint space narrowing between articular bones represents advanced OA, where cartilage loss has already occurred. 9 The degradation of cartilage at this stage is irreversible, and thus methods for earlier detection of OA are needed.10-12 Magnetic resonance imaging (MRI) and arthroscopy provide information about the integrity of cartilage even before cartilage loss, hence these methods are suitable for early diagnostics of cartilage degeneration.13-18
During arthroscopy, the integrity and stiffness of the cartilage can be estimated. Arthroscopy allows a detailed observation of the depth and extent of the lesions and more subtle changes including cartilage softening and fibrillation can be perceived. Several practices for cartilage injury grading have been proposed, such as Collins, Outerbridge, and International Cartilage Repair Society (ICRS) hyaline cartilage lesion classification system.19-21 These methods, however, are rather qualitative by nature and lack the intra- and interobserver agreement. 22 For quantitative assessment of cartilage stiffness, arthroscopic indentation tools have been developed and validated.13,18,23-28 Moreover, the relationship between mechanical properties and the integrity of cartilage has been thoroughly investigated, suggesting that the collagen network of the cartilage primarily controls the dynamic tissue response while proteoglycans are responsible for the static mechanical properties. 29 A strong negative correlation between ICRS grade and cartilage stiffness has also been reported. 5
MRI is a noninvasive imaging modality providing high soft tissue contrast. Clinical MRI has reasonable potential for cartilage degeneration assessment, but only moderate correlation has been found between clinical MRI and ICRS grading. 30 While clinical MRI is capable of detecting advanced cartilage degeneration, its sensitivity to detect superficial lesions affecting less than half of the cartilage depth is limited (range: 46% to 74%).31,32 This is mainly due to limited spatial resolution 33 and tissue contrast. 34 With quantitative MRI, the volume, structure, composition, and even mechanical properties may be indirectly assessed. It has been shown that T2 relaxation time of MRI is associated with the orientation and integrity of the collagen network and water content of cartilage.35-39 The relationship between cartilage biomechanical properties and T2 relaxation time has also been reported in various in vitro studies.16,40-42
In this study, for the first time, quantitative MRI and cartilage mechanical properties were evaluated in reference to the arthroscopic grading system (ICRS) in vivo. For this purpose, patients with clinically suspected cartilage changes and thus referred for arthroscopy were imaged using MRI before the operation. Cartilage stiffness was determined with a handheld indentation device during arthroscopy. Our aim was to investigate, first, the relationship of qualitative ICRS grading system with quantitative stiffness measurements and, second, the connection between ICRS and quantitative MRI.
Materials and Methods
Subjects
Twenty-one consecutive patients (11 male and 10 female, mean age 37.5 years [standard deviation 10.3, range 22-58]) to whom an arthroscopic procedure was prescribed were included into the study. The indication for the procedure were clinically suspected injury of meniscus with mechanical symptoms. The study protocol was approved by the Ethical Committee of the Northern Ostrobothnia Hospital District, Oulu, Finland. Informed consent was obtained from all patients.
Magnetic Resonance Imaging
Within 2 months prior to surgery, a preoperative MRI was performed with a General Electric Signa HDx Twinspeed 1.5 T scanner (GE Healthcare, Milwaukee, IL), using an 8-channel T/R knee array by InVivo (InVivo Corporation, Orlando, FL). A sagittal 2-dimensional (2D) multislice multiecho spin echo sequence was acquired (repetition time [TR] = 1000 ms, echo time [TE] = 10-80 ms, echo train length [ETL] = 8). The data were collected with 256 × 256 matrix size in 12-cm field of view (FOV) presenting 0.47 × 0.47 mm in-plane resolution. In total, 18 to 21 slices were collected with 3-mm slice thickness and 163 Hz/pixel bandwidth covering all the joint cartilage.
Colocalization of Arthroscopic Evaluation and MRI
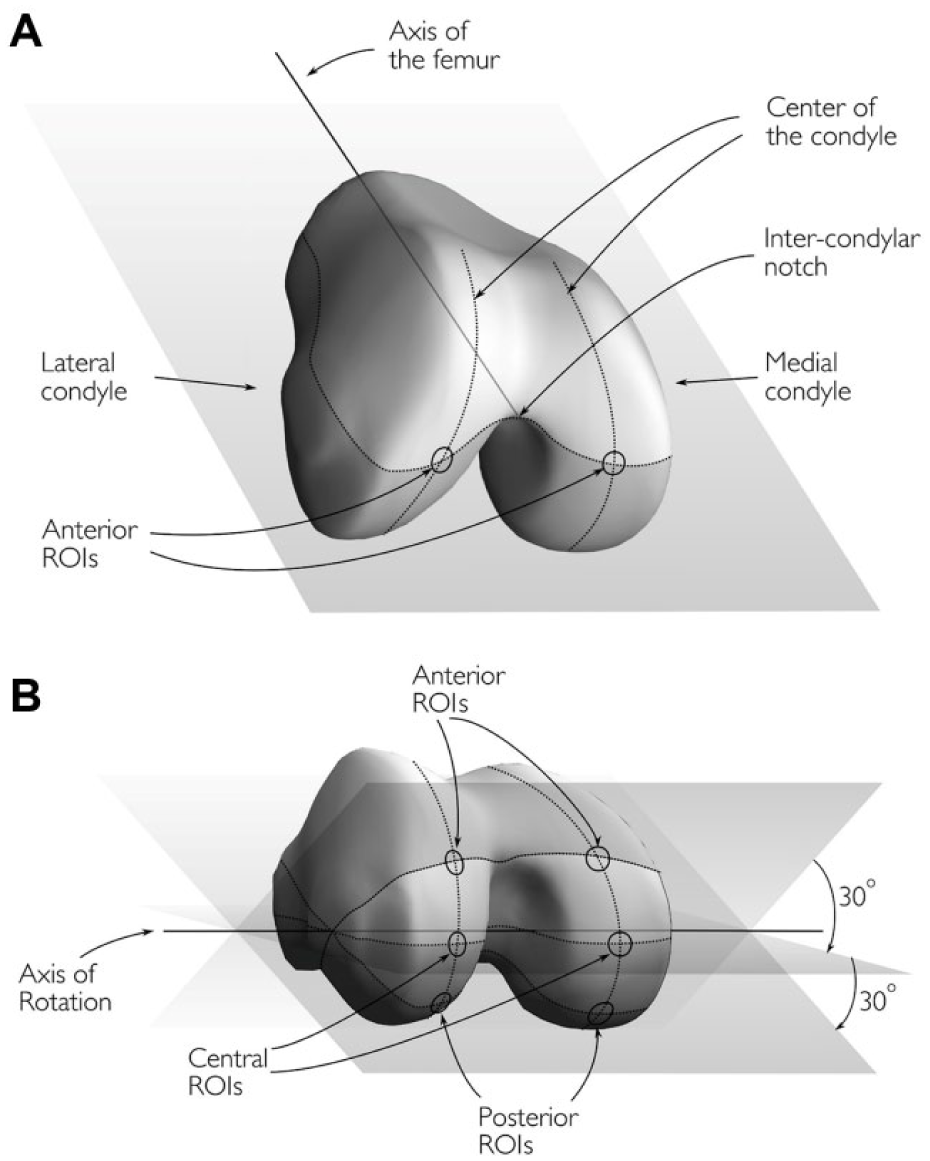
In order to achieve precise colocalization between MRI images and mechanical measurements done during arthroscopic procedure, a localization scheme was developed by the orthopedic surgeons performing arthroscopic measurements (M.L., H.P.) and the scientists performing the MRI analysis (T.S., R.O., E.L. M.N.). Six regions of interest (ROIs) were determined from each femur (3 from each condyle) as follows:
The anterior ROIs were located at the intersections of the centers of the condyles and a surface determined by the axis of femur, the line parallel to posterior heads of the condyles and the intercondylar notch of the femur ( Fig. 1A ).
The central ROIs were defined by rotating the preceding surface by 30° about the axis of rotation and the intersections of the centers of the condyles and the relocated surface was registered ( Fig. 1B ).
The posterior ROIs were defined by further rotating the surface by 30° and registering the intersections as previously described ( Fig. 1B ).
(
Segmentation and Analysis
The predefined ROIs were localized from anatomic 3D MRI sequence on a clinical image workstation. The corresponding locations were then registered automatically from the T2-mapping sequence. Eventually, the segmentation itself was performed using an in-house MATLAB application (v.7.9.0; MathWorks inc., Natick, MA, USA) from the T2-mapping slice closest to the defined ROI. Approximately 10-pixel (4.7mm) wide ROI was manually segmented ( Fig. 2B ), and each ROI was further subdivided into superficial and deep halves. The mean T2 times for bulk, superficial and deep ROIs were then determined. Furthermore, the cartilage thickness from this area was used in computation of Young’s modulus.
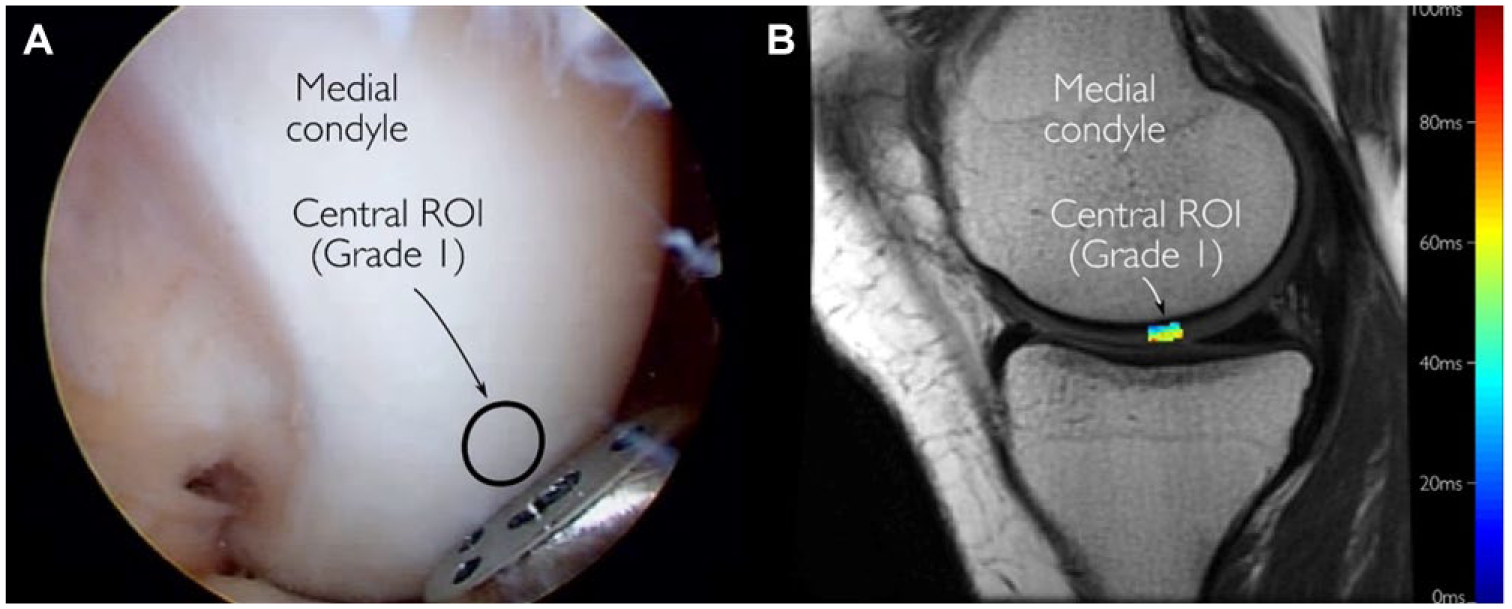
Representative images obtained during arthroscopy (
Arthroscopic Grading of Cartilage
During arthroscopy, a visual evaluation and palpation was conducted on the study regions. Cartilage at the measurement sites were graded according to the ICRS cartilage classification system scored on a scale 0 to 4, where 0 = normal cartilage; 1 = softened, fibrillated, or superficially lacerated cartilage; 2 = cartilage with defects extending not deeper than 50% of the cartilage thickness; 3 = cartilage with defects extending through 50% of the cartilage thickness, but not through the subchondral bone plate; and 4 = cartilage defects that extend into the subchondral bone. 21 The arthroscopic grading was performed prior to cartilage stiffness evaluations.
Cartilage Stiffness Measurements
Cartilage stiffness was measured during arthroscopy at the aforementioned locations using an arthroscopic indentation device (Artscan 200, Artscan Ltd, Helsinki, Finland) ( Figs. 2A and 3 ). The operating method of the device has been previously described in detail. 18 In brief, according to the in vivo measurement principle, reference plate of the device was pressed instantaneously and perpendicularly against the cartilage surface for 3 to 5 times using a force of 10 N and the instantaneous indenter force was registered. 37 Measurements with poor quality, typically indicated by low indenter forces due to nonperpendicular indentation, 37 were rejected, and systematically, the mean value of 3 highest indenter forces was determined to represent indentation stiffness. Finally, using the information on cartilage thickness from MRI, indenter radius (0.5 mm), depth (0.3 mm) and measured force, elastic modulus (ie, Young’s modulus) was determined using the isotropic, incompressible (Poisson’s ratio = 0.5), linear elastic indentation model. 43 The effective area contributing to indentation measurements was within the same order of magnitude as the ROI size.44,45
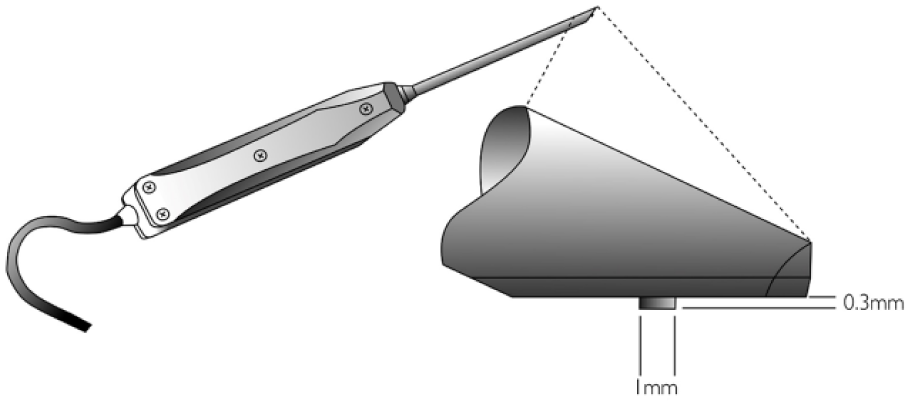
A schematic of the arthroscopic cartilage indentation device.
Statistical Analyses
Means with standard deviations (SD) were calculated for the modulus and T2 times. Differences in modulus and T2 times between the ICRS grades were analyzed using the Mann-Whitney U test or the Kruskal-Wallis H test with Benjamini-Hochberg post hoc tests. To analyze the correlation between modulus and T2 times Spearman’s rank correlation coefficients were calculated. As sensitivity analyses, the analyses were conducted also using pure stiffness data. The data from anterior, central, and posterior ROIs were pooled for further description of the data. All statistical analyses were performed using SPSS software (version 22, IBM Corp, Armonk, NY).
Results
The subjects in this study were enrolled based on the suspected cartilage changes hence a wide range of cartilage degeneration was observed during arthroscopy. At each measurement site, there were cartilages representing ICRS grades 0 and 1, and more advanced degeneration (ICRS grade 2) was found in the anterior and central ROIs on the medial condyle ( Table 1 ). Both Young’s modulus and T2 times showed considerable topographical variations for ICRS grades 0 and 1. The variation in T2 was similar in both superficial and deep cartilages, though the T2 times in the superficial cartilages were on average 17 ms longer than in the deep cartilages.
Mean Values with Standard Deviations (SD) of the Modulus and T2 Relaxation Times in Different Topographical Locations of Cartilage for Different ICRS Grades.
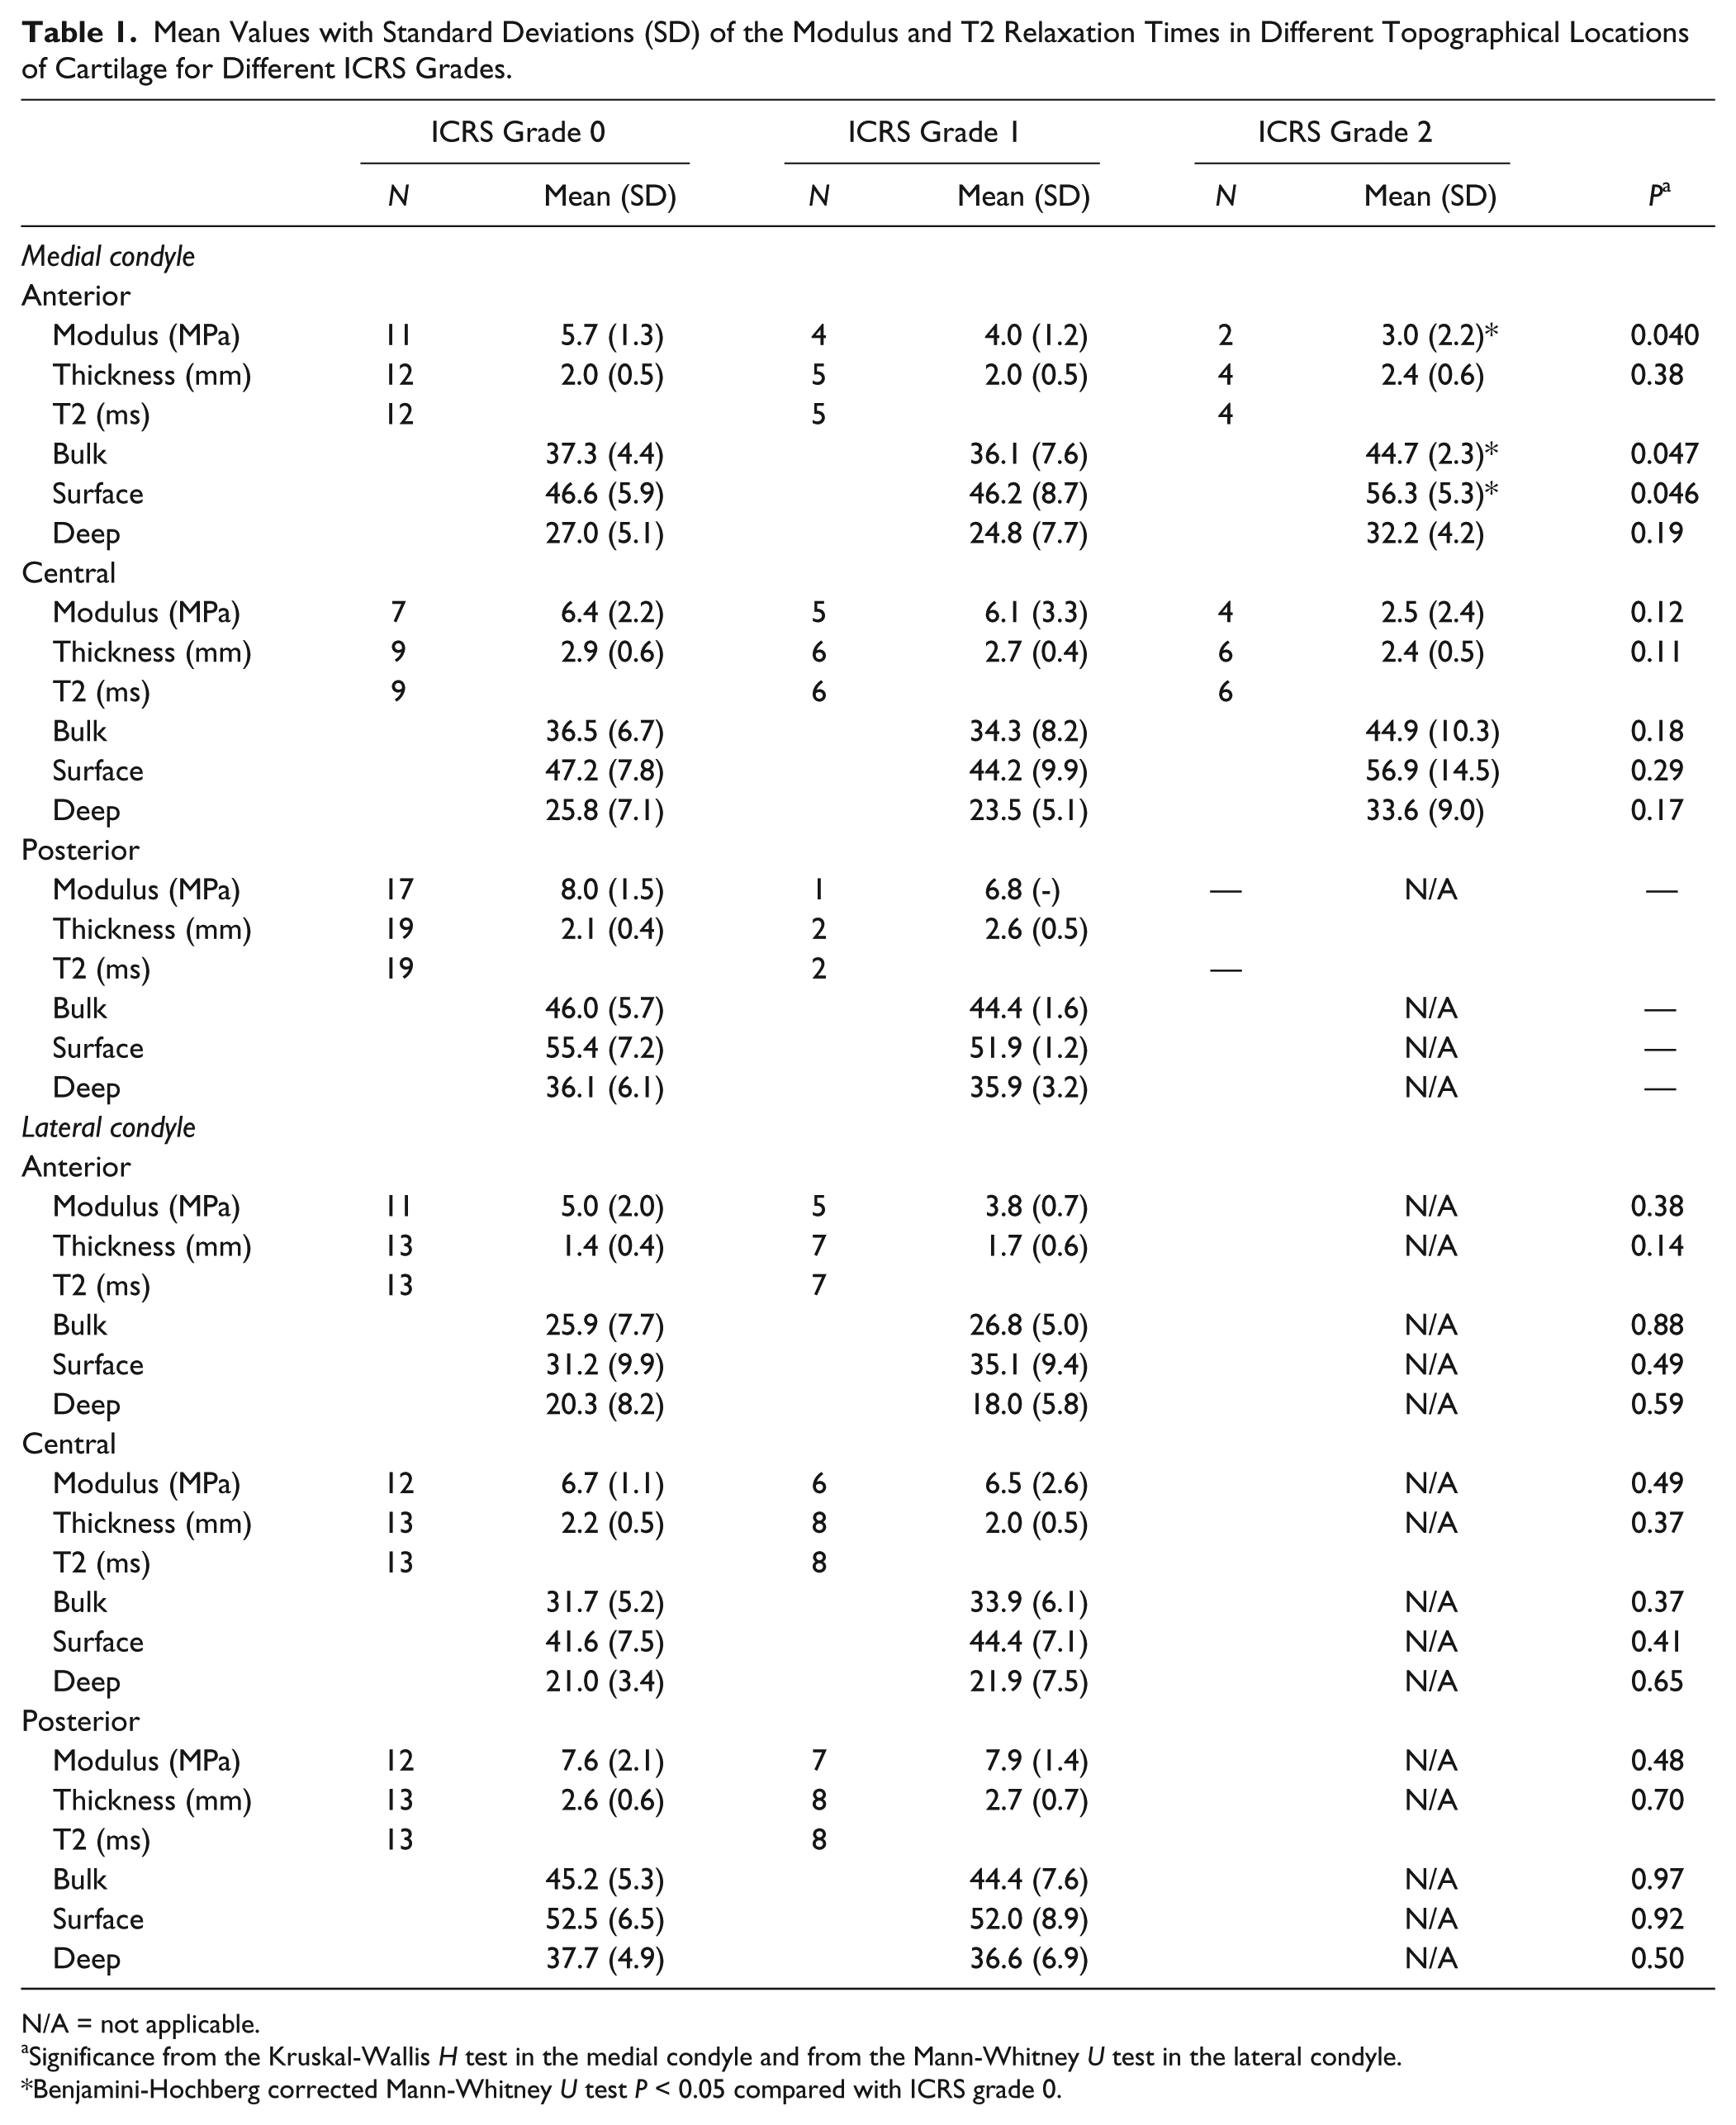
N/A = not applicable.
Significance from the Kruskal-Wallis H test in the medial condyle and from the Mann-Whitney U test in the lateral condyle.
Benjamini-Hochberg corrected Mann-Whitney U test P < 0.05 compared with ICRS grade 0.
On the medial condyle, a significant negative association was found between the modulus and ICRS grade in the anterior ROI (P = 0.040; Table 1 ) and a nonsignificant negative association in the central ROI (P = 0.12). In the anterior ROI, the T2 times were longer in ICRS grade 2 compared to grades 0 and 1 (P = 0.047). Specifically, the values were shorter in grade 2 compared with grade 0 (Benjamini-Hochberg corrected P = 0.039). Similar, but nonsignificant, associations were found in the central ROI on the medial condyle. In the anterior ROI of the lateral condyle the modulus was nonsignificantly lower in ICRS grade 1 compared with grade 0 (P = 0.38). In the lateral condyle, there were no differences in the T2 times between grades 0 and 1. No significant correlations were observed between the modulus and T2 times.
The pooled data on Young’s modulus against ICRS grade are shown in Figure 4 . Values of modulus showed a decreasing trend in the medial condyle as the ICRS grade increased (ICRS grade 0 vs. 2, P < 0.001 and 1 vs. 2, P = 0.004).
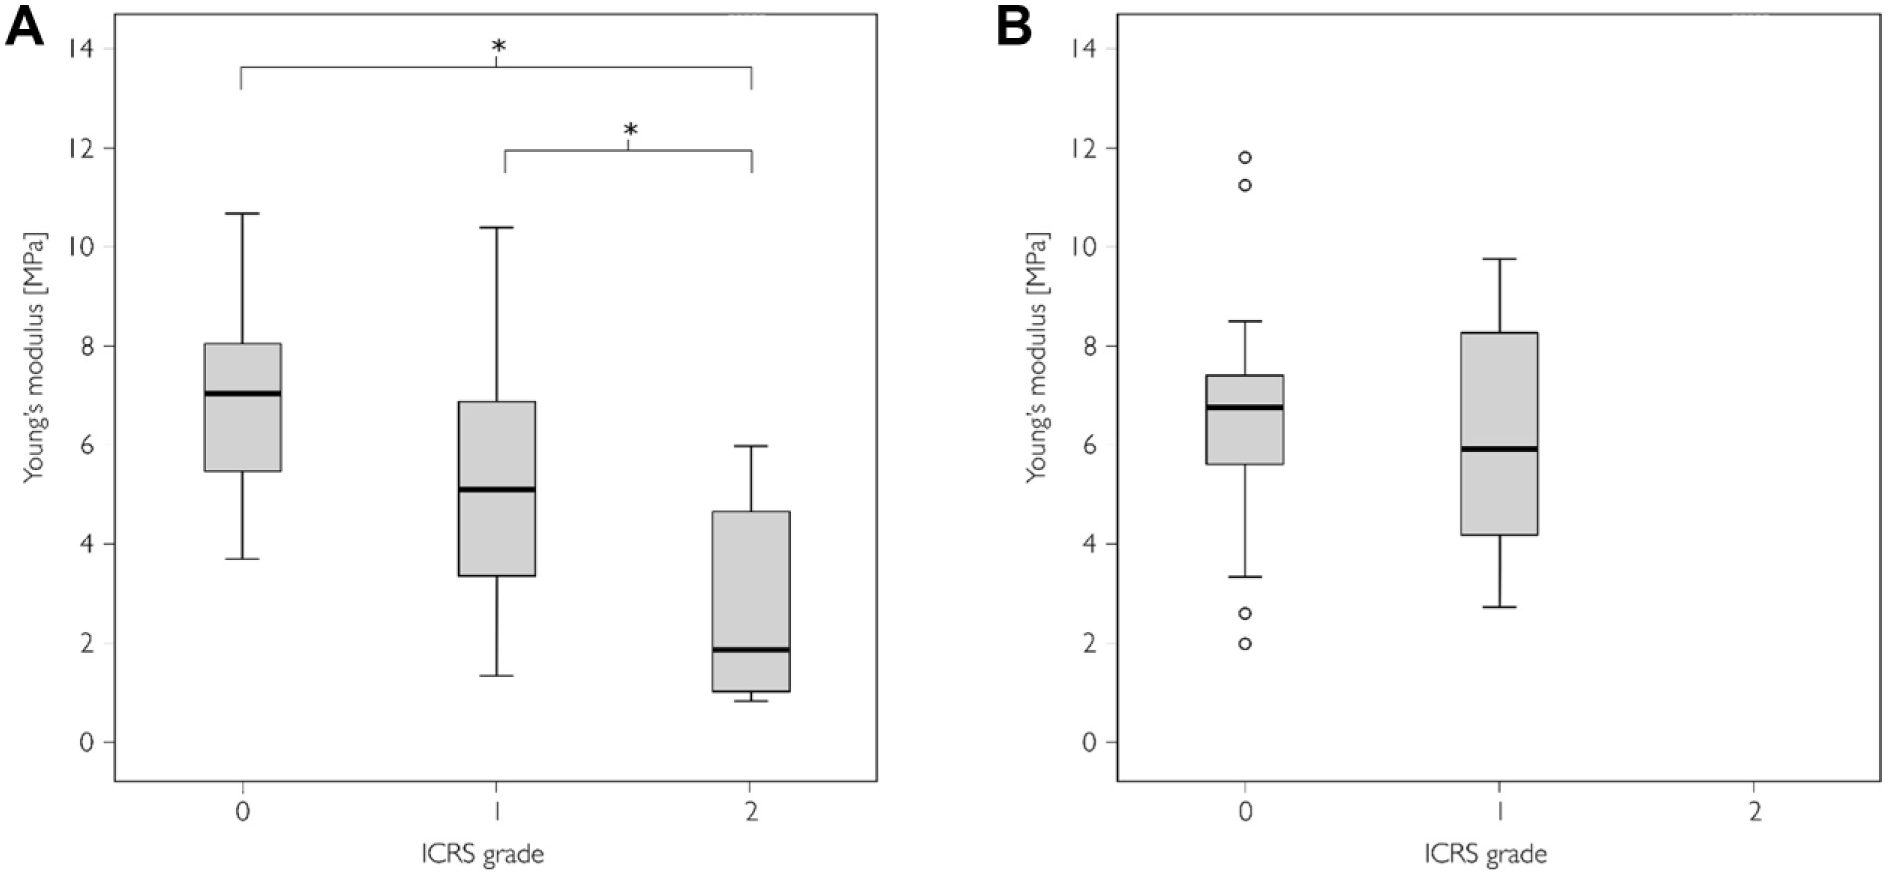
Young’s modulus in International Cartilage Repair Society (ICRS) grades 0 to 2 in the pooled (anterior, central, and posterior regions of interest [ROIs]) data. Boxplots displaying median value and interquartile range for (
The pooled data of T2 measurements against ICRS grade are shown in Figure 5 . There were no differences in T2 values between the ICRS grades.
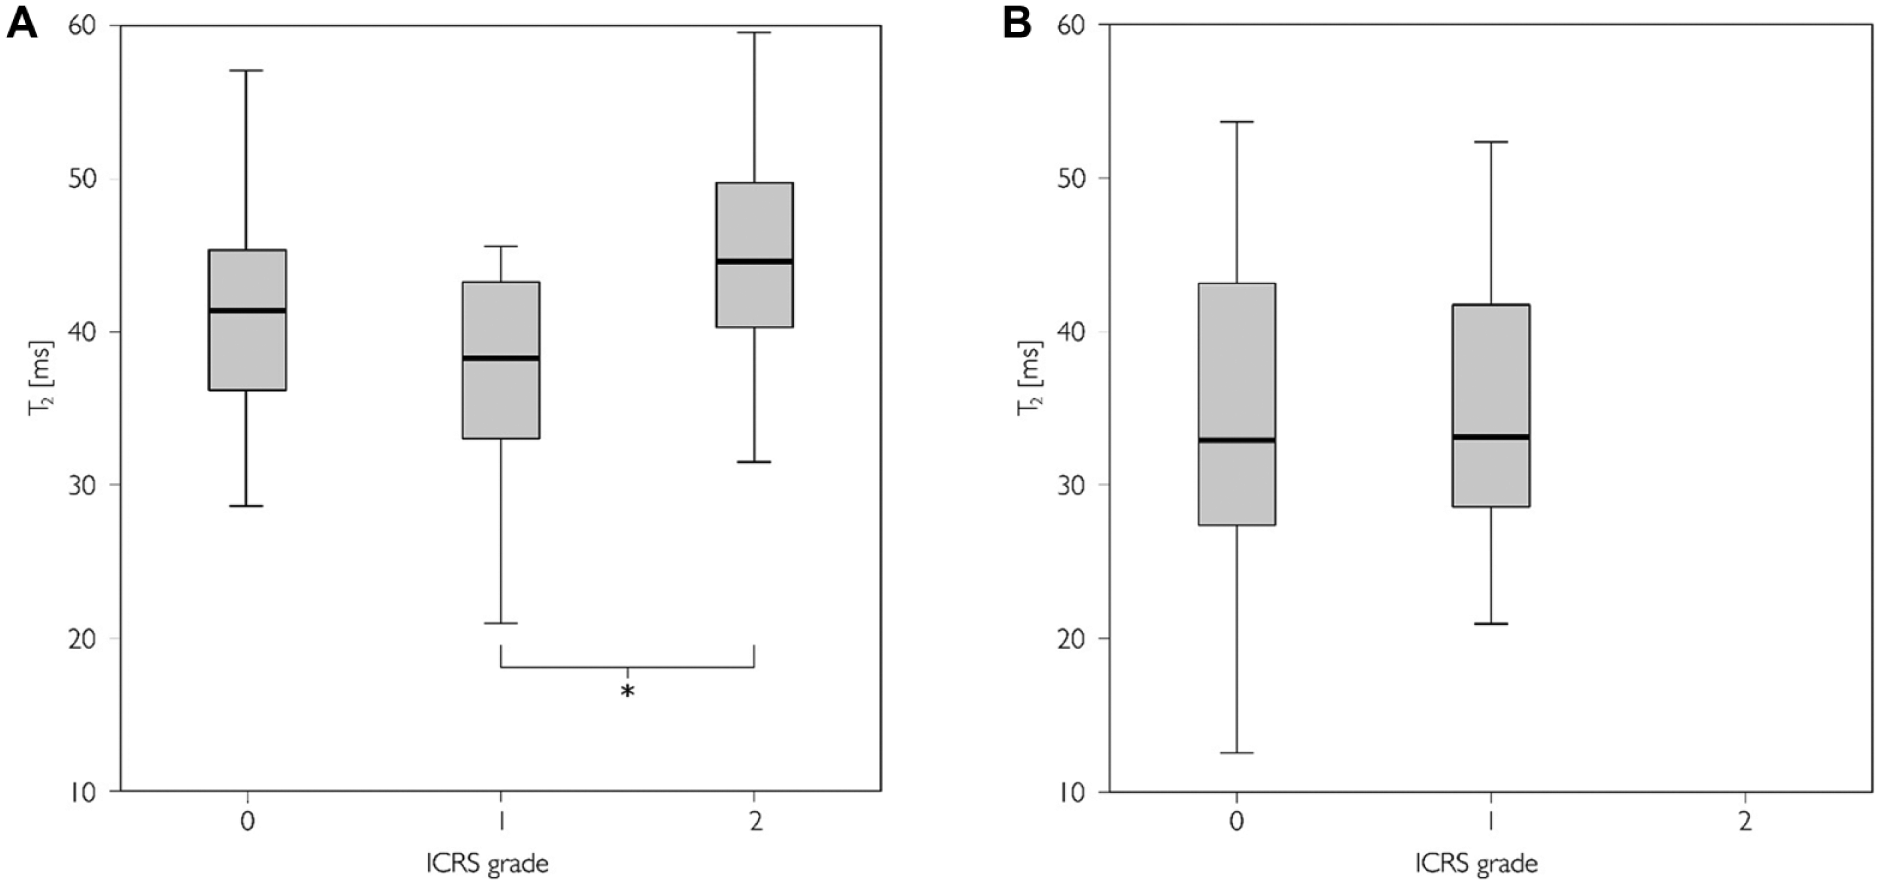
T2 times in International Cartilage Repair Society (ICRS) grades 0 to 2 in the pooled (anterior, central, and posterior regions of interest [ROIs]) data. Boxplots displaying median value and interquartile range for (
The results of pure stiffness data were concordant with the results of modulus data (data not shown).
Discussion
In this study, a variety of cartilage degeneration was observed. The degeneration was more severe in the medial condyle as all the advanced degeneration (ICRS grade 2) was observed in the medial condyle. This was expected based on previous literature. 46 The topographical variation of the data was convergent with the previous studies on mechanical properties of cartilage and T2 relaxation times.47,48
Young’s modulus, as determined by instantaneous indentation, showed a decreasing trend as the ICRS grade increased. The results are convergent with previous in vitro research studying the relationship between cartilage stiffness and Mankin score 42 and ICRS score. 5 The relationship between the ICRS grade and modulus was expected as cartilage softening is one of the definitions used in the ICRS grading of articular cartilage degeneration.
The T2 relaxation times were longer in the ICRS grade 2 compared with grade 0 or 1 cartilages. The T2 times being slightly shorter in the ICRS grade 1 compared with grade 0 cartilages is peculiar as T2 times have been generally thought to lengthen monotonously along with cartilage degeneration. Mosher et al. 49 reported increased T2 times from damaged articular cartilage while Dunn et al. 50 and Li et al. 51 reported a statistically significant elongation of T2 times from healthy to diseased knees in femoral cartilage based on Kellgren-Lawrence scoring. However, the difference between healthy and mild OA was not statistically significant in the study by Dunn et al. 50 and, similarly, in the recent study by Chu et al., 52 a trend of shortening T2 times from normal to softened cartilage was reported. It can be hypothesized that the unexpected behavior of T2 could be due to the cartilage surface to wear and tear: early OA may cause cartilage degeneration mostly in superficial tissue where the T2 relaxation times are primarily longer than in deep cartilage. Thus, wear of superficial cartilage could lead to a shortening of T2 in the analyzed ROIs: While cartilage softening is generally associated with longer T2 times this effect is revoked by the increased relative proportion of deep cartilage with shorter T2 times. However, the suggested rationale does not fully explain the observed behavior of T2 but should be taken into account in similar study designs.
Unexpectedly, no significant correlation between T2 relaxation times and indentation modulus was observed. Despite the efforts to colocalize the arthroscopic stiffness measurement and MRI segmentation, the registration presumably involves some inaccuracy. This inaccuracy between arthroscopic information and T2 measurements does not relate to the colocalization of the ICRS grading and cartilage stiffness measurements as they were performed consecutively during the arthroscopy. Accurate registration in the clinical setting would be desirable, since the cartilage stiffness measurement yields information from a rather small area, whereupon even a small deviation between measurement sites could deteriorate the anticipated correlation. Furthermore, cartilage loss, as measured by the ICRS grading, and the quality of remaining tissue may not be associated.
The measurement of cartilage stiffness with a handheld device in vivo is rather challenging. To avoid unnecessary patient burden only 2 portals for arthroscopy could be used to perform the measurements. Conduction of the measurement through a single portal per condyle successfully was demanding as the success of measurement depends on the perpendicularity of the indenter against cartilage surface. Also, occasionally the surrounding tissues induced unwanted forces on the measurement rod, which may have affected the measured stiffness values. Contrary to previous investigations, cartilage thickness information from MRI was used to compute Young’s modulus values from cartilage stiffness measurements. While the resolution of MRI, and thus the accuracy of cartilage thickness measurement, was moderate, the thickness correction enables a more realistic representation of cartilage mechanical properties. As apparent from the significant variation in cartilage thickness between ROIs, the computation of Young’s modulus, and thus accounting for cartilage thickness, was warranted.
Cartilage segmentation involves potential sources or inaccuracy. The segmentation of the cartilage surface is ambiguous in attempt to separate cartilage surface defects and synovial fluid as they both have long T2 times. The mechanism of increased T2 times in cartilage defects is also associated with increased water content, and thus the decision making in cartilage surface segmentation may be challenging.
The data in this study were also viewed in a pooled manner, that is, combining data from different anatomical locations. Though pooling gives a good overview of the data as a whole and increases statistical power of the analyses, some considerations should be taken into account. Both modulus and T2 times have been shown to show topographical variation.48,53 Consequently, pooling data from different measurement sites may not be straightforward and, thus, both location-wise and pooled data were presented in this study.
The present study was limited to a moderate population size inspected with quantitative MRI. While quantitative MRI is feasible method for revealing early cartilage lesions not visible with standard clinical MRI, it would have been beneficial to both include qualitative assessment of the MRI findings and increase the population size of this study.
In conclusion, cartilage degeneration in OA can be identified both with arthroscopic stiffness measurement and T2 mapping. However, Young’s modulus, as obtained by indentation, and T2 relaxation time in vivo were not correlated. Since a relationship between degeneration-sensitive MRI parameters and mechanical properties of cartilage is intuitively expected, similar studies should be conducted in the future using more recently developed MRI biomarkers with improved sensitivity for cartilage degeneration.
Footnotes
Acknowledgments and Funding
The work reported was done at the department of diagnostic radiology, Oulu University Hospital, Oulu, Finland. The author(s) disclosed receipt of the following financial support for the research, authorship, and/or publication of this article: The study was financially supported by the Academy of Finland (grants 128603 and 260321).
Declaration of Conflicting Interests
The author(s) declared no potential conflicts of interest with respect to the research, authorship, and/or publication of this article.
Ethical Approval
The study was approved by the Ethical Committee of the Northern Ostrobothnia Hospital District, Oulu, Finland.
Informed Consent
Written informed consent was obtained from all patients.
Trial Registration
Not applicable.