
Abstract
Objective
To identify if the time of day and pre-imaging exercise matter while performing T2* mapping of hip joint cartilage at 3 T.
Design
Nine asymptomatic healthy volunteers (mean age 27.4 ± 4.0 years) with no obvious morphological evidence of cartilage damage were enrolled. The MRI protocol included a double-echo steady state (DESS) sequence for morphological cartilage assessment and a multi-echo data image combination sequence for the T2* measurement. T2* values were obtained between 8 and 11 a.m., between 3 and 6 p.m., and after 50 knee-bends at several time points of each measurement (0, 15, 30, 45, 60 minutes).
Results
We observed no differences (P = 0.47) between the T2* values obtained in the morning (T2* = 22.9 ± 3.0 ms) and those measured in the afternoon (T2* = 23.2 ± 3.2 ms). We also observed no statistically significant differences between the T2* values at different time points (P = 0.67) or after 50 knee-bends (P = 0.43).
Conclusions
Timing of the scan and pre-imaging exercise clearly did not matter in this modality. This study consolidates the value of T2* imaging in hip joint cartilage that seems to be independent of diurnal effects and physical activity prior to MRI.
Introduction
Osteoarthritis is characterized by changes in the extracellular water content, continuous glycosaminoglycan depletion, and a progressive loss of integrity of the collagen fiber network. 1 A valid and reproducible assessment of these changes at earlier stages, which may not be easily detected by plain radiography and/or standard magnetic resonance imaging (MRI), could facilitate decision making and management with respect to joint preservation or joint replacement.
A number of biochemically sensitive MRI techniques that include the delayed gadolinium-enhanced MRI of cartilage (dGEMRIC), 2 T2 mapping, 3 and others4,5 have been documented as robust instruments regarding this early detection of subtle cartilage alterations. More specifically, the T2* mapping technique, 6 which is sensitive to the water content of articular cartilage and interactions between water molecules and collagen fibers, happens to have inherent advantages that may account for the recent emergence of this technique. These mainly include a rather simple implementation into the clinical routine, no need for special hardware components or contrast media administration, short acquisition times, and the ability of high-resolution isotropic 3-dimensional (3D) cartilage evaluation.
Biochemically, T2* values depend to some extent on the bulk water content and changes in articular cartilage hydration. It is intuitively possible that both “water content” and “articular cartilage hydration” may be affected by continuous cartilage strain over the course of the day or by temporary high levels of exercise. Although one previous study 7 did not reveal a clinically relevant difference between the T2* values measured prior to running a marathon and those measured after the marathon (T2* measurements within 48 hours prior to and following the marathon and after a period of approximately 4 weeks), we found no data related to effects of diurnal variation and cartilage strain immediately preceding the measurement.
The purpose of this study was to identify if the time of day (diurnal variation) and preimaging exercise matter while performing T2* mapping of hip joint cartilage. We hypothesized that (1) T2* values for the hip joint will demonstrate diurnal variations and (2) preimaging physical activity comprising a set of 50 squats would affect the T2* values for the hip joint from exercise-related cartilage strain. This study was performed on a 3 T system to allow for higher resolution imaging and better distinct assessment of acetabular and femoral head cartilage.
Methods
This study was approved by the local ethics committee. All procedures performed in this study were in accordance with the 1964 Helsinki declaration and its later amendments or comparable ethical standards. All subjects provided a written informed consent before participation.
Study Population
Ten asymptomatic volunteers underwent initial MRI of the left hip; 1 subject was excluded following this initial evaluation due to MRI morphological signs of bone marrow edema and femoroacetabular impingement (FAI). Therefore, 9 healthy asymptomatic participants (mean age, 27.4 ± 4.0 years; range, 23-34 years; 5 males, 4 females; mean body mass index [BMI], 22.9 ± 1.6 kg/m2) were included. None of the participants had a history of hip pain or surgery on their lower extremities, and every individual was examined prior to MRI by an orthopedic surgeon to rule out any abnormality of the hip. Of note, the pre-MRI activities of each participant were not supervised or controlled, although every subject was thoroughly reminded to keep physical activity prior to the morning MRI to a minimum and to avoid any excessive activities other than daily life activities such as running and jumping between the measurements.
Magnetic Resonance Imaging
MRI conducted on a 3 T MR scanner (Magnetom Trio, Siemens Medical Solutions, Erlangen, Germany) was performed in the morning (MRI between 8 and 11 a.m.; MRImorning), in the afternoon (MRI between 3 and 6 p.m.; MRIafternoon), and after 50 squats (subsequent to the afternoon evaluation). At these measuring points, T2* was assessed 0, 15, 30, 45, and 60 minutes after unloading in the MRI. Therefore, each participant underwent 15 measurements during the day. The MRI protocol included a gradient-echo (GRE) based 3D multi-echo data image combination (MEDIC) sequence with 6 consecutive echoes for the T2* assessment, and a double-echo steady state (DESS) sequence for morphological cartilage assessment that was performed subsequent to the T2* evaluation in the morning. To keep motion artifacts to a minimum, efforts were made to ensure the best possible patient comfort during the examination using blankets and pillows. Two sandbags were placed medially and laterally to the knee on the investigated side to promote higher stability of the leg and decrease rotation in the hip. Furthermore, a soft pillow was placed beneath the ipsilateral foot for a comfortable position and to avoid motion within the ankle during the scans. Table 1 supplies additional information on the imaging parameters employed in this study.
Imaging Parameters Utilized in This Study. a
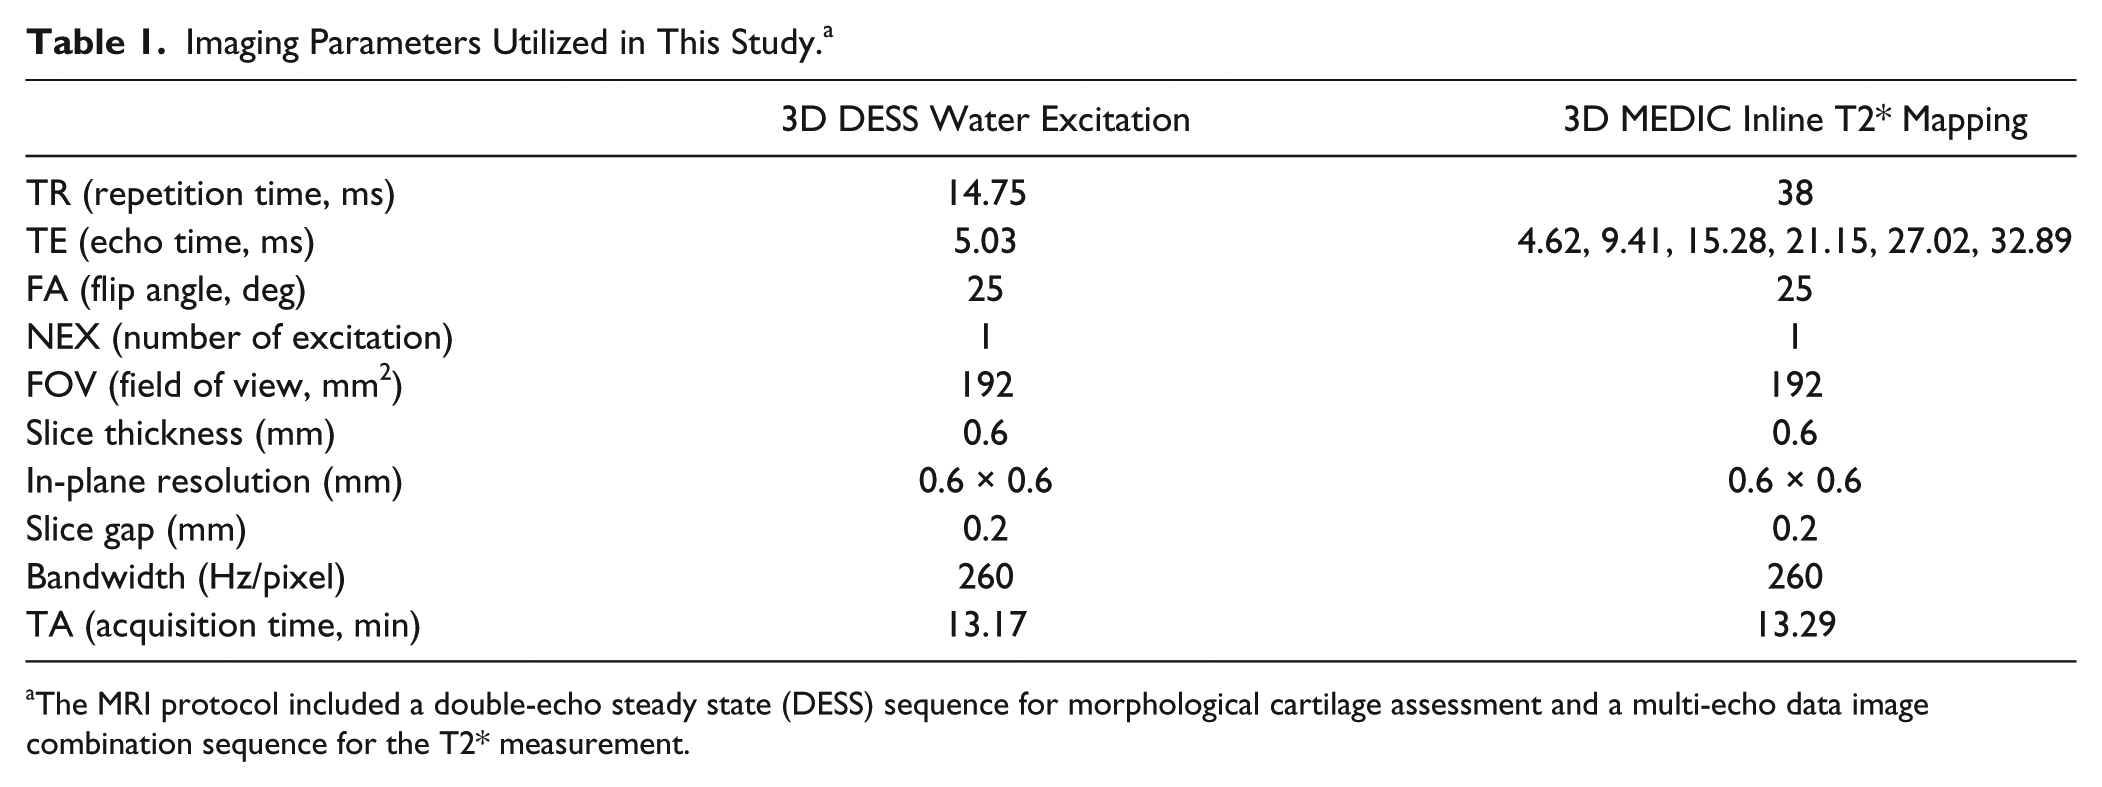
The MRI protocol included a double-echo steady state (DESS) sequence for morphological cartilage assessment and a multi-echo data image combination sequence for the T2* measurement.
Data Analysis
The 3D MRI data sets were transferred to a Leonardo workstation (Siemens Medical Solutions, Erlangen, Germany) for further assessment. Seven radial reformats with a slice thickness of 2 mm depicting the hip from anterior to superior and posterior were created using multiplanar reconstruction. Region of interest (ROI) analysis was then performed by an orthopedic surgeon (BB; 8 years of experience in MRI of hip joint cartilage including morphological and biochemical cartilage assessment) in the MRI radial reformat depicting the weight-bearing area of the hip including corresponding regions of acetabular and femoral cartilage. ROI placement in acetabular cartilage included the area between the acetabular rim and the fossa acetabuli. In femoral head cartilage, ROIs were placed between the fossa of the femoral head and the acetabular rim. An appropriate placement of marker points that delineated the ROI was conducted using corresponding DESS reformats as a reference to ensure a precise ROI placement within cartilage boundaries ( Fig. 1 ). To assess interobserver reliability, a second independent observer (TH) with 5 years of experience in biochemical cartilage imaging repeated the analysis in 5 randomly selected volunteers.
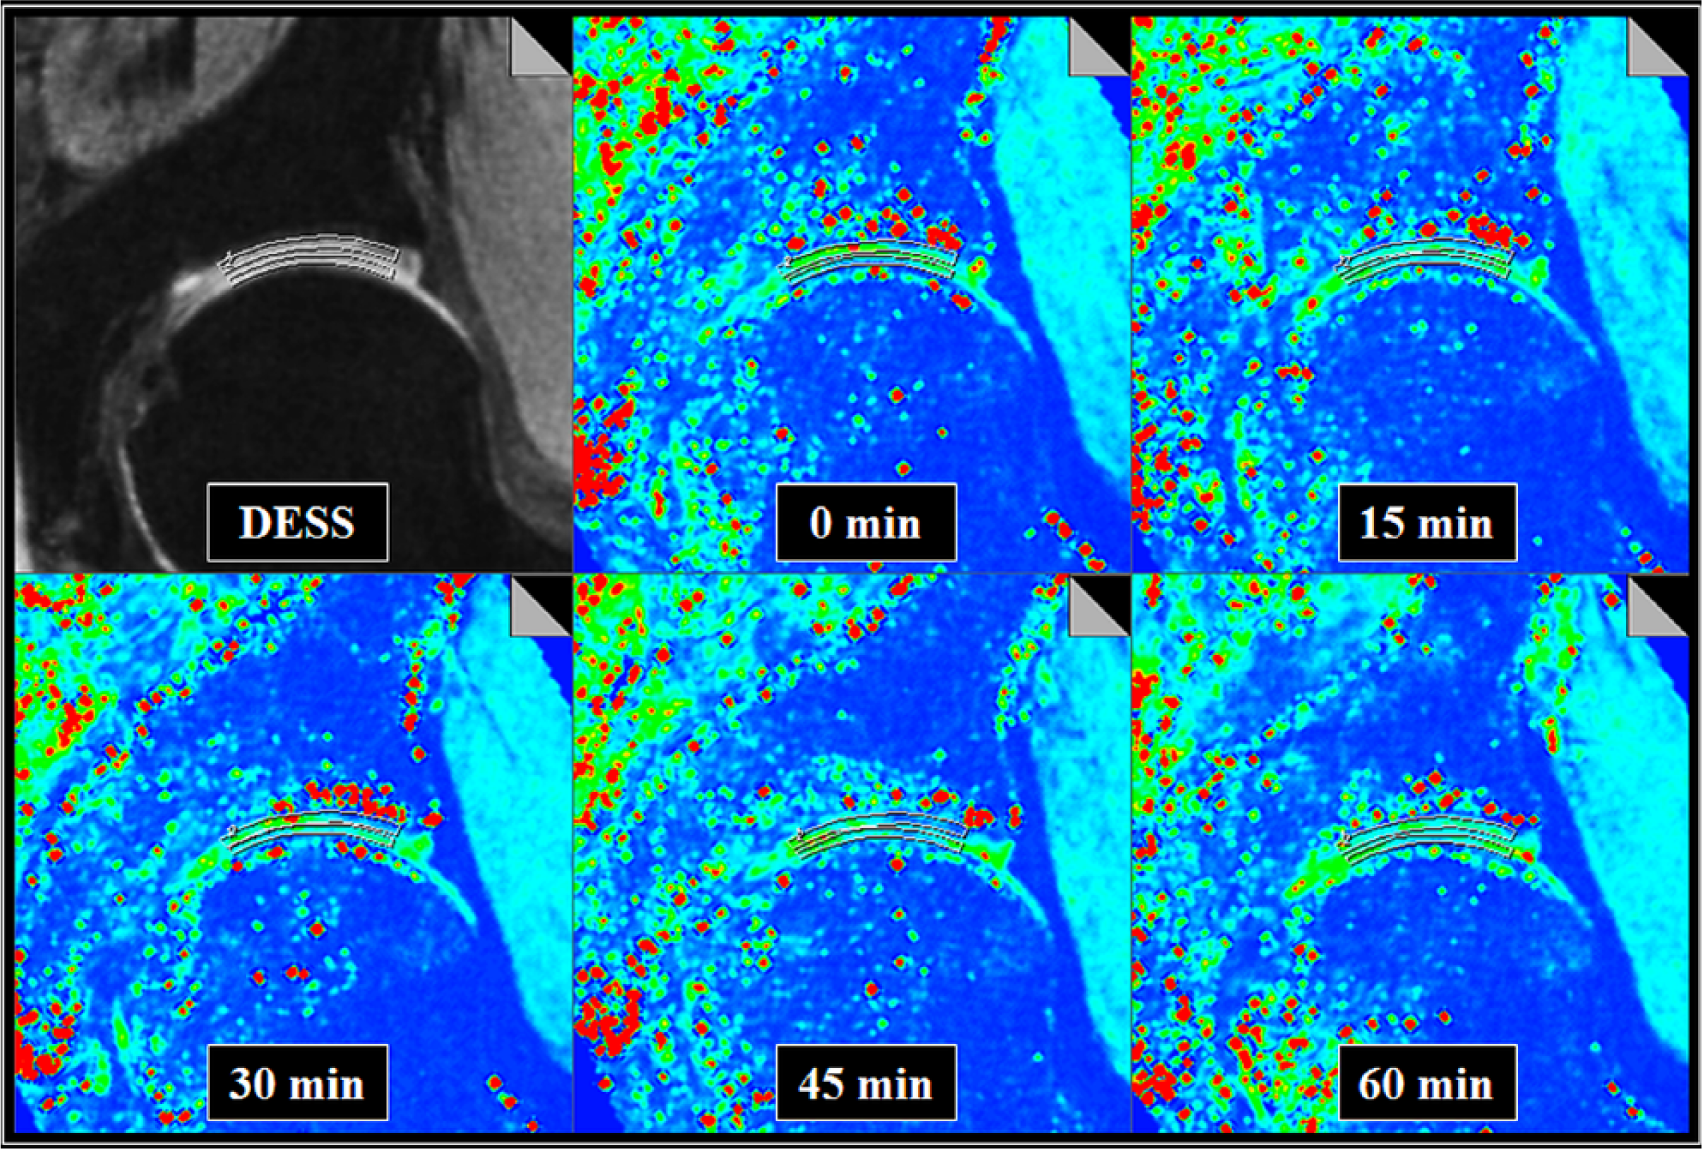
Double-echo steady state (DESS) and corresponding T2* reformats depicting the superior hip joint region at different time points of measurement. Regions of interest were defined by multiple marker points framing the acetabular and femoral cartilage from the acetabular rim to the fovea area. The corresponding morphological DESS images served as anatomical references. T2* values are illustrated in a color scale, whereby the red color represents T2* values increasing towards 100 ms and the blue color represents T2* values decreasing towards 0 ms. The green color reflects T2* values observed in healthy cartilage. Note that the T2* maps at different time points of measurement were similar.
Statistical Analysis
We used SPSS software (Version 21.0; IBM Corp, Armonk, NY, USA) for statistical analysis in this study. All T2* values in this study are referred to as mean values ± standard deviation (SD). In order to compare the T2* values at the different times of day, a paired Student’s t-test was utilized. A 1-way analysis of variance (ANOVA) with Bonferroni correction for multiple comparisons and a post hoc test were used to compare the T2* values at different time points of each measurement. Inter-observer agreement was calculated by intraclass correlation (ICC) analysis utilizing a pairwise correlation model with absolute agreement. P values less than 0.05 were considered to reveal a statistically significant difference.
Results
A total of 270 ROIs (9 volunteers, 3 measurements [morning, afternoon, after knee-bends], 2 regions [acetabular and femoral head], and 5 time points of measurement [0, 15, 30, 45, 60 minutes]) were analyzed. Of these, 4 ROIs were excluded due to MRI artifacts. The mean size of the remaining ROIs was 0.17 ± 0.07 cm2 (48 pixels), ranging from 0.08 cm2 (23 pixels) to 0.31 cm2 (87 pixels). ICC analysis indicated a high interobserver reproducibility of the T2* measurement (ICC = 0.951; 95% confidence interval, 0.907-0.972).
The T2* values measured in the morning (T2*morning, 22.9 ± 3.0 ms, range, 18.0-30.7 ms) were not statistically different (P = 0.47) from those measured in the afternoon (T2*afternoon, 23.2 ± 3.2 ms, range, 17.1-31.8 ms; Fig. 2 ). The same applies for the T2* values at different time points of each measurement (P = 0.67; Fig. 3 ) and the T2* assessment after 50 squats (T2*, 21.6 ± 2.6 ms, T2* ranging from 15.4 to 28.0 ms; P = 0.43; Fig. 4 ).
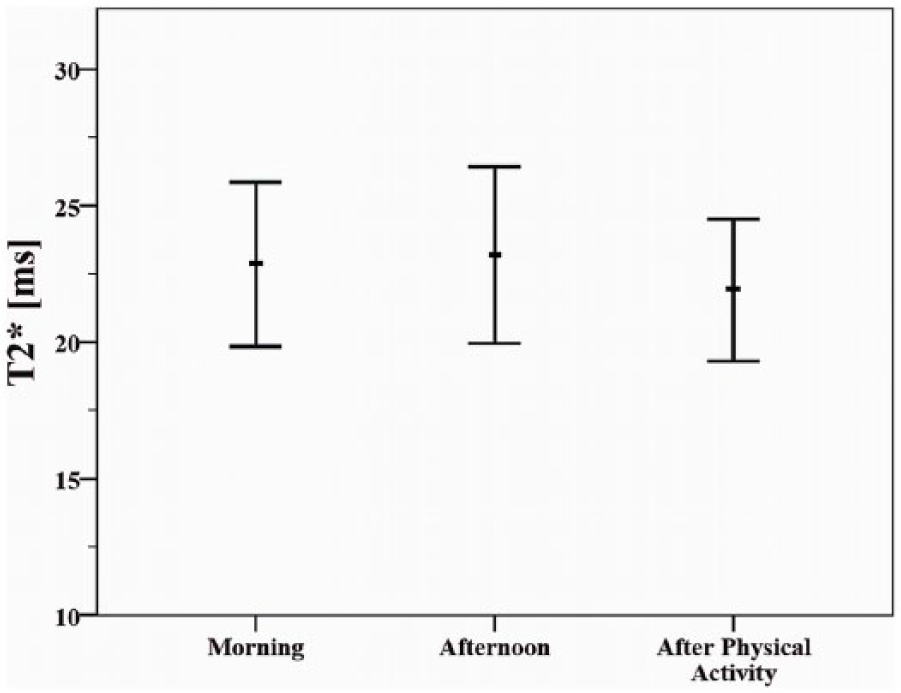
Mean T2* values ± standard deviation in the morning, in the afternoon, and after physical activity.
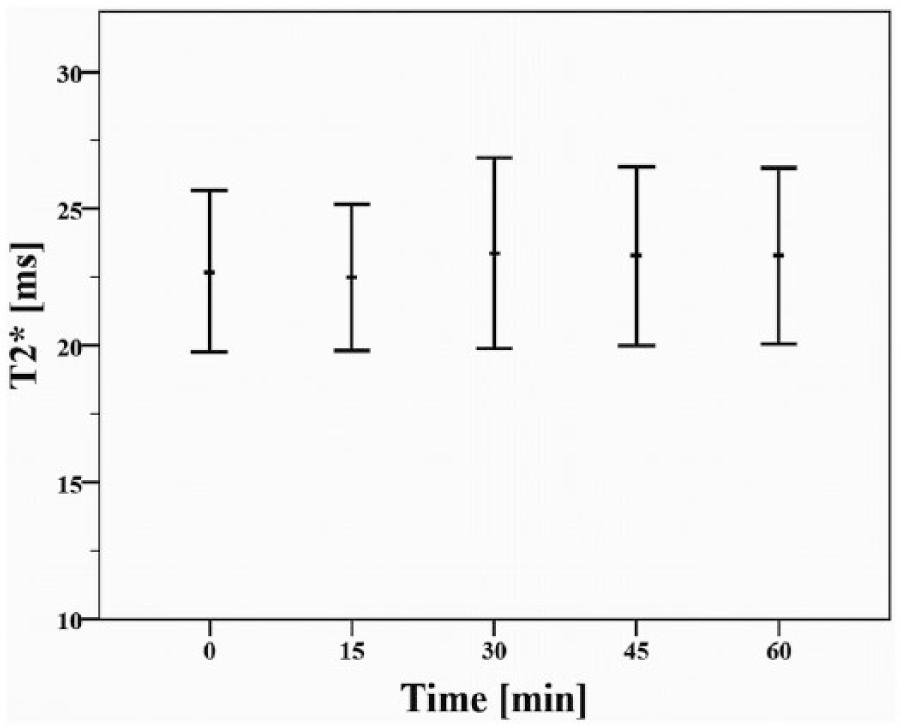
Mean T2* values ± standard deviation at 5 time points of measurement. Note that the T2* values at different time points of measurement were similar.
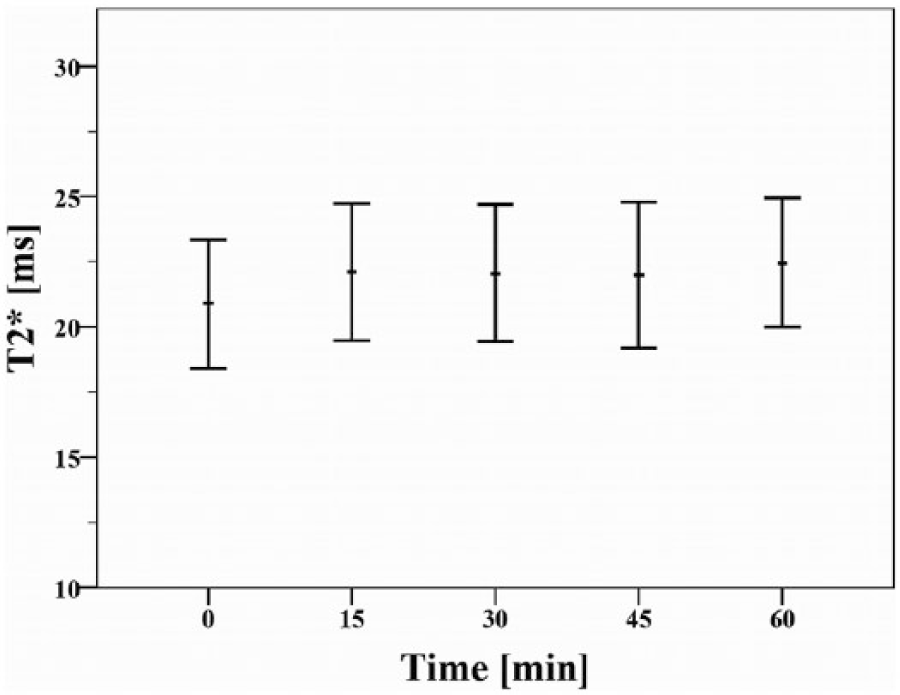
Mean T2* values ± standard deviation at 5 time points of measurement after 50 squats. Note that the marginal trend of higher T2* values after 60 minutes was not statistically significant (difference T2*0 minutes/T2*60 minutes = −1.6 ± 0.9 ms; P = 0.43).
Discussion
We analyzed diurnal effects and the impact of preimaging exercise prior to MRI on the T2* mapping values in hip joint cartilage. Our results did not reveal any statistically significant differences in the T2* values between the different time points of the day (morning and afternoon) and values obtained at different time points of measurement. After 50 squats, a marginal trend of higher T2* values was noted; however, this was not statistically significant (difference T2*0 minutes/T2*60 minutes = −1.6 ± 0.9 ms; P = 0.43).
There are few reports on the effect of various kinds of physical activities on cartilage thickness and dGEMRIC, T2, and T2* values of knee and hip joint cartilage.8-12 In the study of Widmyer et al., 13 diurnal strains on articular knee cartilage with respect to the BMI were analyzed. Aligned MR images obtained in the morning (8 a.m.) and in the afternoon (4 p.m.) of 10 obese volunteers (BMI = 25-31 kg/m2) and a control group of 10 normal-weighted (BMI = 18.5-24.9 kg/m2), age-matched, and sex-matched participants were compared. In the study group, increasing diurnal strains (decrease of cartilage thickness) were observed for the medial and lateral joint compartments. In the control group, such diurnal variations were only noted in the medial compartment. These observations run in concordance with 2 other studies on diurnal variations in knee joint cartilage where only little differences concerning amount and distribution among the joints were reported.14,15 While these studies included measurements of cartilage volume, thickness, or both, the study of Li et al. 16 analyzed diurnal effects on T1ρ and T2 values of knee joint cartilage in six healthy volunteers (age range, 22-35 years) and noted no differences for both T1ρ and T2 values between the morning (8-10 a.m.) and afternoon (5-7 p.m.) measurements (P > 0.05). An analysis of the percentage change in the T1ρ and T2 values in 5 regions of the joint (lateral femoral condyle, medial femoral condyle, lateral tibia, medial tibia, patella) revealed an increasing trend of these values for femoral than for tibial cartilage. Although these studies were obtained in the knee joint and not in the hip like the present study, the results comparable to our study show no clear diurnal effects in cartilage volume or compositional cartilage values.
In their evaluation of articular cartilage in 22 patients with FAI (mean age 28.1 years) and 27 healthy asymptomatic volunteers (mean age, 26.6 years) using T2* mapping at different time points, Apprich et al. 17 noted an increase of T2* relaxation times (T2* global, 21.75 ± 2.4 vs. 24.64 ± 3.1 ms, P < 0.05) in healthy hip joint cartilage after a period of approximately 50 minutes of unloading. Apprich et al. 17 attribute their findings to possible changes in the biochemical composition of healthy cartilage. Because T2* is sensitive to the cartilage water content, a rehydration after unloading could thus lead to superior T2* relaxation as well as to a presumable rearrangement of the collagen fiber network after unloading. Our results are somewhat contrary and as such cannot be fully explained.
Another study on 10 healthy nonprofessional marathon runners with no morphologically evident cartilage damage (mean age, 28.7 ± 3.97 years) revealed that superior levels of physical activity performed on the days prior to MRI scarcely influenced the T2* cartilage evaluation. 7 However, one has to consider that these results were obtained in knee joint cartilage, and the time span between the T2* measurements before and after the marathon was 2 to 3 days in this study, possibly limiting the comparison with the current study.
The present results were obtained in young volunteers, and the lack of diurnal effects or during loading or (afterward) unloading have to be noted with caution. There are nearly no studies on the hip joint available, and to actually assess the value of T2* mapping in the hip, volunteer studies like this are needed and somewhat critical. In the knee joint, however, available studies that mainly used standard spin-echo T2 mapping show an effect of unloading, especially in altered cartilage areas as present after cartilage repair or in osteoarthritis.18,19 The existing benefits of T2* mapping in comparison with standard T2 mapping are mentioned above. The present study shows that T2* mapping in the hip joint of volunteers is a stable parameter. Nevertheless, the mentioned limitations have to be taken into consideration.
Our study has further limitations. No in vivo studies on transchondral stress distribution in the hip joint during motion were found in current literature. Especially no previously reported data on biochemical cartilage assessment after different types of exercise is available. Thus, a safe conclusion between performing squats and joint loading cannot be drawn. In addition to the rather small study group, the daily activities of each volunteer between the MRI in the morning and the measurement in the afternoon were not supervised or documented. Therefore, differences in cartilage strain (e.g., gait pattern, frequency of joint loading) might have altered the T2* measurements. Also, our study group consisted of healthy, asymptomatic volunteers with morphologically apparent normal cartilage and, therefore, our observations may not translate to patients with some form of cartilage degeneration. As MRI scans were performed in the morning and in the afternoon but not in the evening, our results cannot exclude ongoing diurnal effects that occur with further joint loading at a later time of the day. However, the period of time between the 2 T2* measurements was at least 6 hours. It must also be outlined that each participant in this study underwent 15 scans during the day and spent approximately 240 minutes in the MR scanner. Therefore, we believe that an additional scan in the evening would not have been reasonable.
In conclusion, the timing of the scan and preimaging exercise did not matter in this imaging modality. This study consolidates the value of T2* imaging in hip joint cartilage that seems to be independent of diurnal effects and exercise prior to MRI. While aiming for a standardized imaging protocol, diurnal changes in molecular cartilage composition as well as loading conditions immediately prior to MRI do not seem to significantly alter cartilage assessment. However, ongoing studies including a standardized activity protocol and a larger study group, which enrolls patients with cartilage degeneration, may further reaffirm these findings.
Footnotes
Acknowledgments and Funding
The author(s) received no financial support for the research, authorship, and/or publication of this article.
Declaration of Conflicting Interests
The author(s) declared no potential conflicts of interest with respect to the research, authorship, and/or publication of this article.
Ethical Approval
This study was approved by the local ethics committee.
Informed Consent
Written informed consent was obtained from all subjects before the study.
Trial Registration
Not applicable.