
Abstract
Objective:
Exposure of articular cartilage to interleukin-1 (IL-1) results in increased synthesis of matrix degrading enzymes. Previously mechanical load applied together with IL-1 stimulation was found to reduce aggrecan cleavage by ADAMTS-4 and 5 and MMP-1, -3, -9, and -13 and reduce proteoglycan loss from the extracellular matrix. To further delineate the inhibition mechanism the gene expression of ADAMTS-4 and 5; MMP-1, -3, -9, and -13; and TIMP-1, -2, and -3 were measured.
Design:
Mature bovine articular cartilage was stimulated with a 0.5 MPa compressive stress and 10 ng/ml of IL-1α for 3 days and then allowed to recover without stimulation for 1 additional day. The media was assayed for proteoglycan content on a daily basis, while chondrocyte gene expression (mRNA) was measured during stimulation and 1 day of recovery.
Results:
Mechanical load alone did not change the gene expression for ADAMTS, MMP, or TIMP. IL-1 caused an increase in gene expression for all enzymes after 1 day of stimulation while not affecting the TIMP levels. Load applied together with IL-1 decreased the expression levels of ADAMTS-4 and -5 and MMP-1 and -3 and increased TIMP-3 expression.
Conclusions:
A mechanical load appears to modify cartilage degradation by IL-1 at the cellular level by reducing mRNA.
Keywords
Introduction
Articular cartilage softening and loss of mechanical function are physical characteristics of osteoarthritis (OA) resulting from proteoglycan (PG) fragmentation and loss from the extracellular matrix (ECM). Inflammatory cytokines, such as interleukin-1 (IL-1) and tumor necrosis factor-α (TNF-α), and abnormal mechanical loads (high stress, excessive duration) have been shown to increase the synthesis of matrix metalloproteinases (MMPs-1, -3, and -13) and aggrecanases (ADAMTS-4 and -5—a disintegrin and metalloproteinase with thrombospondin-like motifs)1-8, enzymes which cleave human and bovine aggrecan at similar sites within the interglobular domain (IGD) and chondroitin sulfate regions (CS-1 & -2)2,9-11. In vitro and in vivo studies have shown that aggrecanase(s) is the primary enzyme(s) responsible for aggrecan proteolysis by the chondrocytes in the early stages of cartilage degeneration, well before aggrecan and collagen cleavage by MMPs2,9,12-16. After catabolism of aggrecan by ADAMTS and MMPs, collagen type II cleavage primarily occurs by MMP-13 (collagenase-3)2,17-19.
Several in vitro studies using chondrocytes on flexible membranes or embedded in polymer gels have reported a synergistic interaction between IL-1 and mechanical stimulation, including reduction of ECM degradation by ADAMTS and MMPs and decreased synthesis of nitric oxide20-25. In a previous study 26 in which full-thickness mature bovine articular cartilage was loaded with a compressive stress of 0.5 MPa in the presence of IL-1α (10 ng/ml), we found the load caused a greater than 3-fold decrease in proteoglycan (PG) loss compared to IL-1 stimulated cartilage and that aggrecan cleavage occurred only in the IL-1 stimulated cartilage. Thus, the mechanical load appeared to modify (reduce or inhibit) the IL-1-induced ECM degradation, at least at the protein level. However, the molecular mechanisms involved in the mechanical modification of ECM degradation in response to IL-1 stimulation still needed to be investigated.
Based on our previous study 26 , we hypothesized that the mechanism responsible for this modification occurred at two different cellular levels, by down-regulation of gene expression (mRNA) for both types of enzymes (ADAMTS and MMP) and up-regulation of their natural inhibitors, TIMPs (tissue inhibitors of metalloproteinases). To test these hypotheses, we measured the mRNA expressions for ADAMTS-4 and -5; MMPs-1, -3, -9, and -13; and TIMPs-1, -2, and -3 during stimulation with IL-1 and a mechanical load. We found that the mechanical load significantly reduced the expression of MMP-1 and -3 and increased the expression of TIMP-3, indicating both mechanisms were synergistically involved. To our knowledge this is the first report of a mechanical load affecting in situ chondrocyte gene expression of both enzymes and their inhibitors.
Materials and Methods
Tissue Preparation and Mechanical Loading
As previously described 26 , full thickness (~1.5 mm) cartilage explants (7 mm diameter) were removed within 24 h postmortem from the load-bearing region of the trochlear notch of mature bovine knees (specimens pooled from 3 animals, age 18-24 mo). Each explant was then sectioned through the deep zone parallel to the articular surface to obtain a 1 mm thickness. The explants were randomly separated into 24-well plates and incubated under standard culture conditions and media (Dulbecco’s Modified Eagle’s Medium containing 1% antibiotic/antimycotic, 10 mM HEPES buffer, 50 µg/mL ascorbic acid, and 1% Inulin+ Transferin+Selenium or ITS) for 5 days (termed day -6 to day -1) as previously described 26 . The explants were incubated for 1 additional day (day -1 to day 0) in media containing no ITS, the media collected and assayed for PG loss as described below to serve as the untreated baseline PG loss (initial 24 h, day 0) for each of the treatment groups described below. In addition, at the time of removal a separate group of explants from each animal (Fresh) were immediately processed for gene expression as described below. Unless otherwise stated, all chemicals were purchased from Gibco BRL (Grand Island, NY) or Sigma (St. Louis, MO).
Four treatment groups were used: (1) Control (unloaded, no IL-1), (2) IL-1 (unloaded, 10 ng/ml of IL-1α), (3) Load (cyclic stress of 0.5 MPa at 0.5 Hz), and (4) Load + IL-1 (0.5 MPa at 0.5 Hz + 10 ng/ml of IL-1α). Load and Load + IL-1 explants were individually loaded by a plane-ended, porous load-platen (6.35 mm diameter, 35 um porosity) in confined compression using a previously described Mechanical Explant Test System (METS)26,27. The treatments were applied for 3 days (stimulation phase, days 1 to 3) followed by 1 day without load or IL-1 (recovery phase, day 4). Control and IL-1 explants were confined without the presence of the load platen. Separate sets of explants were used for PG loss (10 explants per treatment group), mRNA analysis (3-7 explants per group per day), and histological analysis (2 explants per group per day) during the stimulation and recovery phases as described below. Full details of cartilage acquisition, preparation, mechanical loading, and treatment protocols are described elsewhere 26 .
Proteoglycan Loss
Proteoglycan lost to the media on each day (days 0-4) for each explant was determined using the dimethylmethylene blue (DMMB) assay for glycosaminoglycans and expressed as ug PG/ml media 28 . The PG loss to the media 1 day prior to treatment (day 0) was used to normalize the subsequent PG loss during stimulation (days 1-3) and recovery (day 4).
Histological Analysis of Matrix Proteoglycan
Histochemical staining for proteoglycan content within the ECM was performed during stimulation (days 1-3) and after 1 day of recovery (day 4). Explants were fixed in 10% neutral buffered formalin, sectioned (6 um) through the center in the radial direction, and sequentially stained using Mayer’s Hematoxylin, Fast Green FCF Yellowish, and Safranin-O, and viewed with a light microscope (Nikon Optiphot-2, Melville, NY). Images were recorded using a color CCD camera (DXM1200, Nikon) and commercially available software (SigmaScan, SPSS, Chicago, IL).
Analysis of Gene Expression for MMPS, ADAMTS, and TIMPS
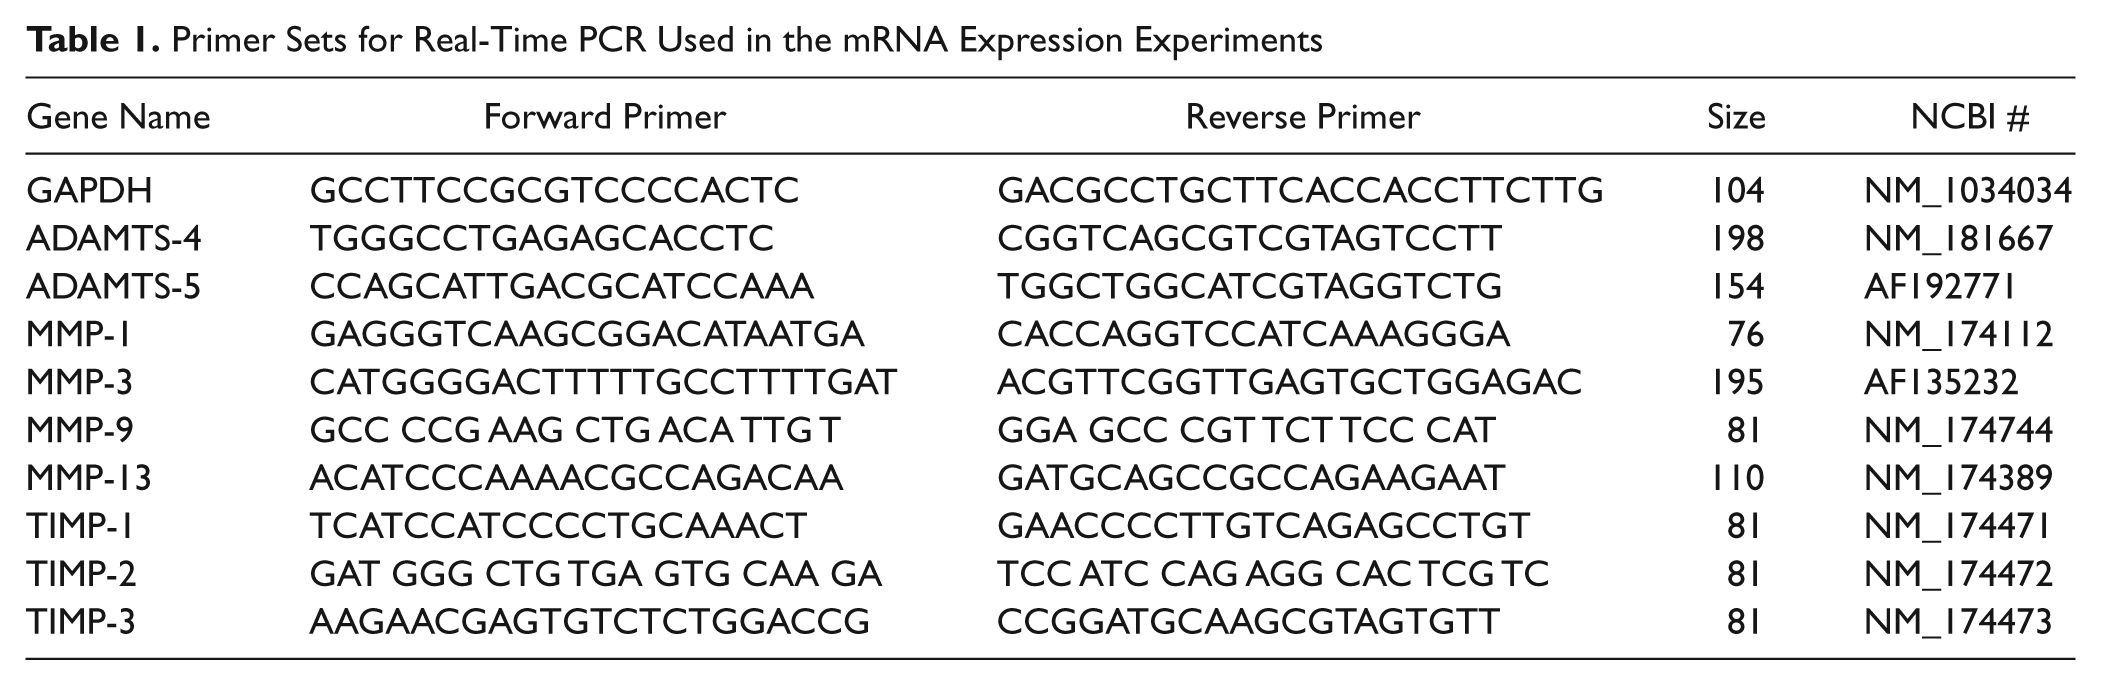
Chondrocyte gene expression (mRNA) for MMP-1, -3, -9, and -13; ADAMTS-4 and -5, and TIMP-1, -2, and -3 was measured in 6 explants per treatment group on each day of stimulation (days 1, 2, and 3) and 1 day (day 4) after the stimulations were removed. In brief, total RNA was extracted from chondrocytes after the explant was snap-frozen, powered using a freeze mill (SPEX, Metuchen, NJ), suspended in Trizol agent, and homogenized and centrifuged to remove insoluble matrix. The supernatant was then purified using RNeasy Mini kit (Qiagen, Valencia, CA) before suspended in RNase Free water 29 . Total RNA was quantified using a NanoDrop 1000 machine (Thermo Scientific, Wilmington, DE). An equal amount of mRNA from each sample was reverse transcribed into cDNA using iScript (BioRad) reverse transcriptase and ABI 7700 PCR machine (Applied Biosystems) according to specified protocols from Biorad. Real-time PCR reactions utilized the Syber Green detection method. In brief, the reactions contained cDNA derived from the reverse transcription reactions for each sample, along with the primer pairs for detecting the target transcript as listed in Table 1 and the Syber Green Master Mix (BioRad) containing the polymerase and free deoxy-nucleotides. The plus and minus reverse transcription samples were subjected to 40 cycles of PCR in the IQ-Cycler system, which contains a thermocycler, a laser excitation system, and a fiber optical network for detecting fluorescence from each well of a 96-well plate in a continuous manner. The reactions were displayed as amplification plots (fluorescence level versus cycle number) and quantified based on the cycle threshold (CT) method as described by the manufacturer (BioRad, IQ-Cycler). In order to normalize the gene expressions, we measured the expression of 3 house-keeping genes (GAPDH, β-actin, and 18S rRNA). For each gene, the final expression level was normalized to GAPDH, which was found to be least affected by the treatments of Load or IL-1. This might be due in part to the fact that cyclic compression modulates cell deformation and formation of cytoskeleton in chondrocyte, which has a direct impact on the expression of β-actin. The primer set of GAPDH also was least sensitive to the change of melting temperature (ranging from 55 °C to 70 °C) of the PCR protocol.
Primer Sets for Real-Time PCR Used in the mRNA Expression Experiments
Statistical Analyses
Proteoglycan loss on days 1-4 for each explant was normalized to the explant’s day 0 loss and averaged for each treatment (n = 10 per treatment per day). The mRNA expression for each treatment group per day (days 1-4, n = 6) was normalized to the mean mRNA of the corresponding Control group (no stimulation). Differences between groups were analyzed using unpaired Student’s t tests and analysis of variance (ANOVA) at a significance level of α = 0.05, and Turkey/Kramer post hoc tests where required (Systat 10.2, SPSS, Chicago, IL). All data are expressed as the mean ± standard deviation in the text and as the mean ± standard error of the mean (SEM) in the figures unless otherwise stated.
Results
PG Loss from the ECM Due to IL-1 Stimulation Is Reduced by Load
Cartilage explants were separated into four treatment groups and each group incubated for 1 day (day -1 to day 0) without mechanical load or IL-1 stimulation. The explants were then stimulated with either a cyclic mechanical load of 0.5 MPa (Load), 10 ng/ml of IL-1α (IL-1), or both a load and IL-1 (Load + IL-1) for 3 days (days 1-3), followed by removal of both stimulations for an additional 1 day (day 4). The Control group remained stimulation free for the entire treatment period. Each explant’s initial 24-h pre-stimulated PG loss to the media was used to normalize the subsequent PG loss on days 1-4. To ensure uniformity between the treatment groups, the PG loss during this initial 24-h interval before stimulation was used to compare the PG loss in each group. No statistical difference was found between the different treatment groups prior to stimulation on day 1 (Control = 50 ± 10 ng/ml, IL-1 = 50 ± 2 ng/ml, Load = 49 ± 15 ng/ml, Load + IL-1 = 52 ± 2 ng/ml; Fig. 1 , day 0).
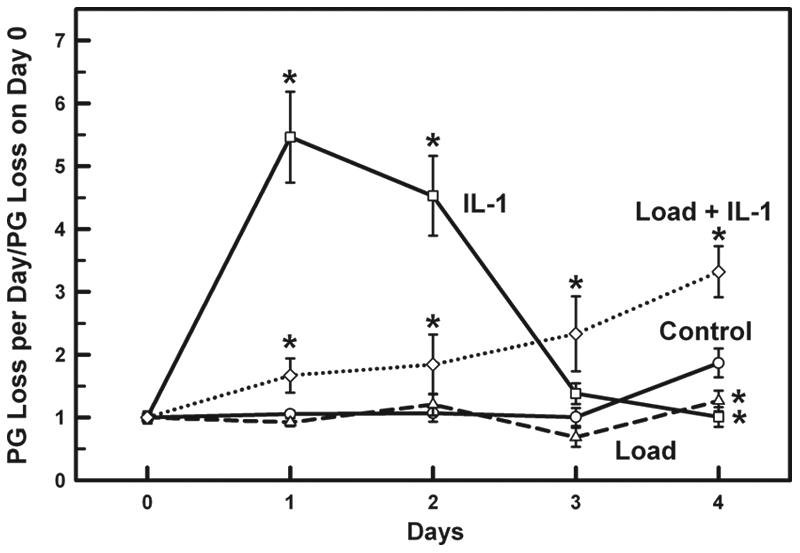
Proteoglycan loss to the media was measured for the explants in each treatment group (Control, IL-1, Load, and Load + IL-1) for 1 day without stimulation (day 0), and then stimulated with either IL-1α (10 ng/ml), load (0.5 MPa), load + IL-1α, or no load or IL-1α for 3 days (days 1-3), with the stimulations removed for an additional 1 day (day 4) of recovery. PG loss to the media per day (days 1-4) was normalized to the PG loss on day 0. IL-1 stimulation caused a significant increase in PG loss on days 1 and 2 (p < 0.0001), while load applied together with IL-1 inhibited the IL-1 induced increase in PG loss on days 1-2. Control: ○ solid line; IL-1α: □ solid line; Load: △ dashed line; Load + IL-1α: ◊ dotted line. Data are means ± SEM for n = 10 explants, *p < 0.05 versus Control.
As previously reported 26 , PG loss in the Load group did not significantly change compared to the Control group during loading, while it was slightly lower (p = 0.046) after 1 day of recovery ( Fig. 1 ). On the other hand, stimulation with IL-1α caused a significant increase in PG loss by 5.5- and 4.5-fold on days 1 and 2, while on day 3 the PG loss decreased to that of the Control (p = 0.11) and after IL-1α removal, it was below the Control (p = 0.006). When the load and IL-1α were applied simultaneously, there was a significant reduction of PG loss on days 1 and 2 by 69% and 59%, respectively (Load + IL-1 versus IL-1, Fig. 1 , p < 0.003). However, the addition of the load did not completely inhibit the IL-1α stimulation as PG loss steadily increased by 1.6-, 1.7-, and 2.3-fold compared to Control. After both stimulations were removed, the PG loss continued to increase (1.8-fold, day 4).
Mechanical Load Reduces IL-1-Induced PG Loss within the ECM
Cartilage explants from each treatment group (2 each group per day) were processed for histochemical analysis using Safranin-O staining for PG content and counter-stained for collagen using Fast green ( Fig. 2 ). No PG loss was observed within the ECM in the Control, Load, and Load + IL-1 groups during stimulation (days 1-3) or after stimulation removal (day 4). In the IL-1 group, however, there was a significant loss of PG in the superficial zone after 1 day of stimulation as compared to the uniform staining for PG throughout the ECM in the other groups. On days 2 and 3, the PG loss in the IL-1 group extended further into the explants. One day after the IL-1 was removed, the PG content appeared normal in the deeper zones, with PG loss only evident in the superficial zone. The qualitative histological findings showed that PG loss due to IL-1 begins at the articular surface and progresses deeper into the matrix with stimulation time. This also agreed with the quantitative PG loss ( Fig. 1 ) and confirmed that the mechanical load reduced the PG loss induced by the IL-1 throughout the entire ECM.
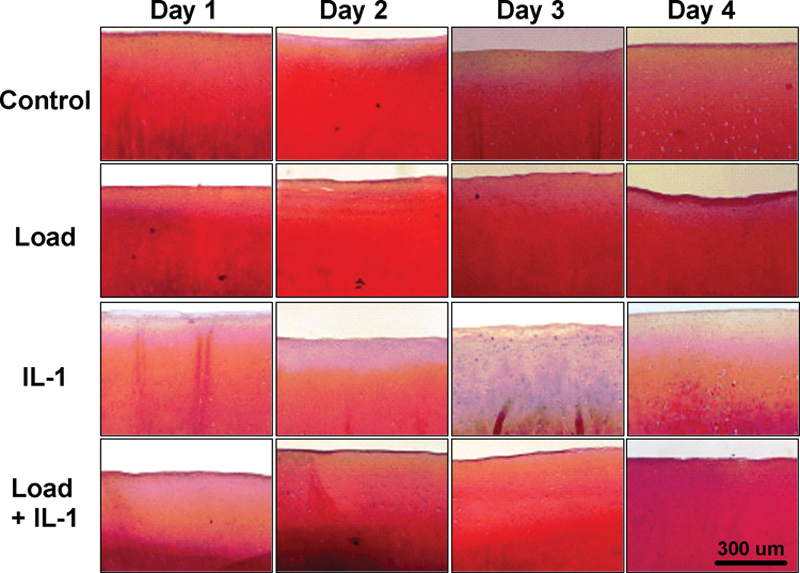
Histochemical staining of the proteoglycan (red) and collagen (green-blue) within the extracellular matrix for Control, IL-1, Load, and Load + IL-1 treatments on days 1, 2, and 3 and after treatment removal on day 4. There was no PG loss in the Control, Load, and Load + IL-1 groups. In the IL-1 group there was loss of PG in the superficial zone on day 1, which extended further into the extracellular matrix on days 2 and 3. After IL-1 removal, the PG content appeared normal in the middle and deep zones with PG loss only in the superficial zone (day 4).
Mechanical Load Modified IL-1-Induced Increased Gene Expression for ADAMTS and MMPS
The expression of mRNA for ADAMTS-4 and -5 and MMPs-1, -3, and -13 for each treatment group was measured during stimulation (days 1-3) and 1 day of recovery (day 4), while MMP-9 mRNA expression was only measured on day 1 (insufficient mRNA remaining). The mRNA level in each explant was normalized to its respective GAPDH expression level, treatment group mean mRNA levels calculated on each day (n = 6, 3, 4, and 7 explants per treatment per day for days 1, 2, 3, and 4, respectively), and the mean mRNA level per day normalized to the respective Control mean levels on that day. The normalized mean ± SEM mRNA levels for ADAMTS-4 and -5 and MMP-1, -3, -9, and -13 are reported graphically for day 1 and days 1-4 in Figs. 3 and 4 , respectively, while the normalized mRNA level for the Control group per day for each day = 1 ± SEM for comparison to the other treatment groups( Figs. 3 and 4 ).
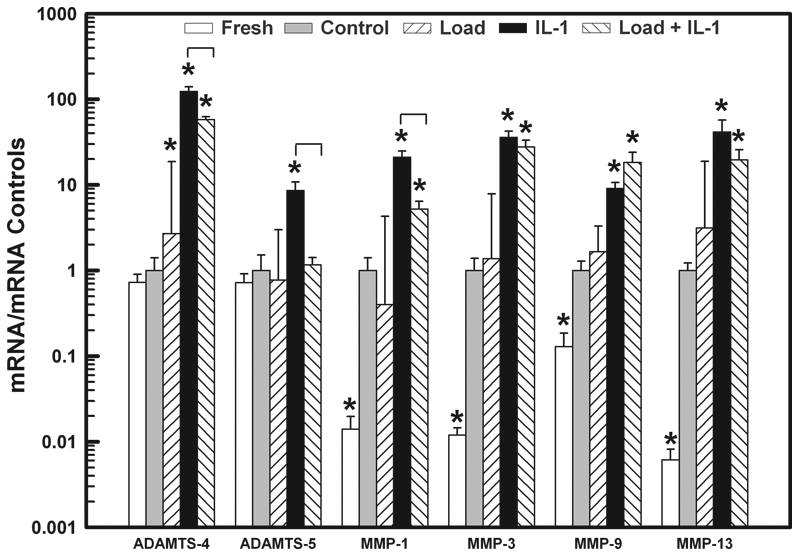
One day after treatment, the expression levels of mRNA for ADAMTS-4 and -5 and MMP-1, -3, -9, and -13 in the Load, IL-1, and Load + IL-1 groups were measured and normalized to their respective mRNA levels in the Control. The mRNA levels in explants removed from the same knee at the time of harvest (Fresh) are also shown. Treatment with IL-1α significantly increased the expression levels for all enzymes compared to the Controls (*p < 0.05). When the load was applied together with IL-1α (Load + IL-1), the expression levels for ADAMTS-4, ADAMTS-5, and MMP-1 decreased compared to the IL-1 group (⊓ p < 0.05), while only ADAMTS-5 reached the Control level. Note that the mRNA levels for all MMPs were increased compared to the Fresh levels. Data shown as means ± SEM, with n = 6 per treatment group, where the normalized mean mRNA level for the Control group per day = 1 ± SEM.
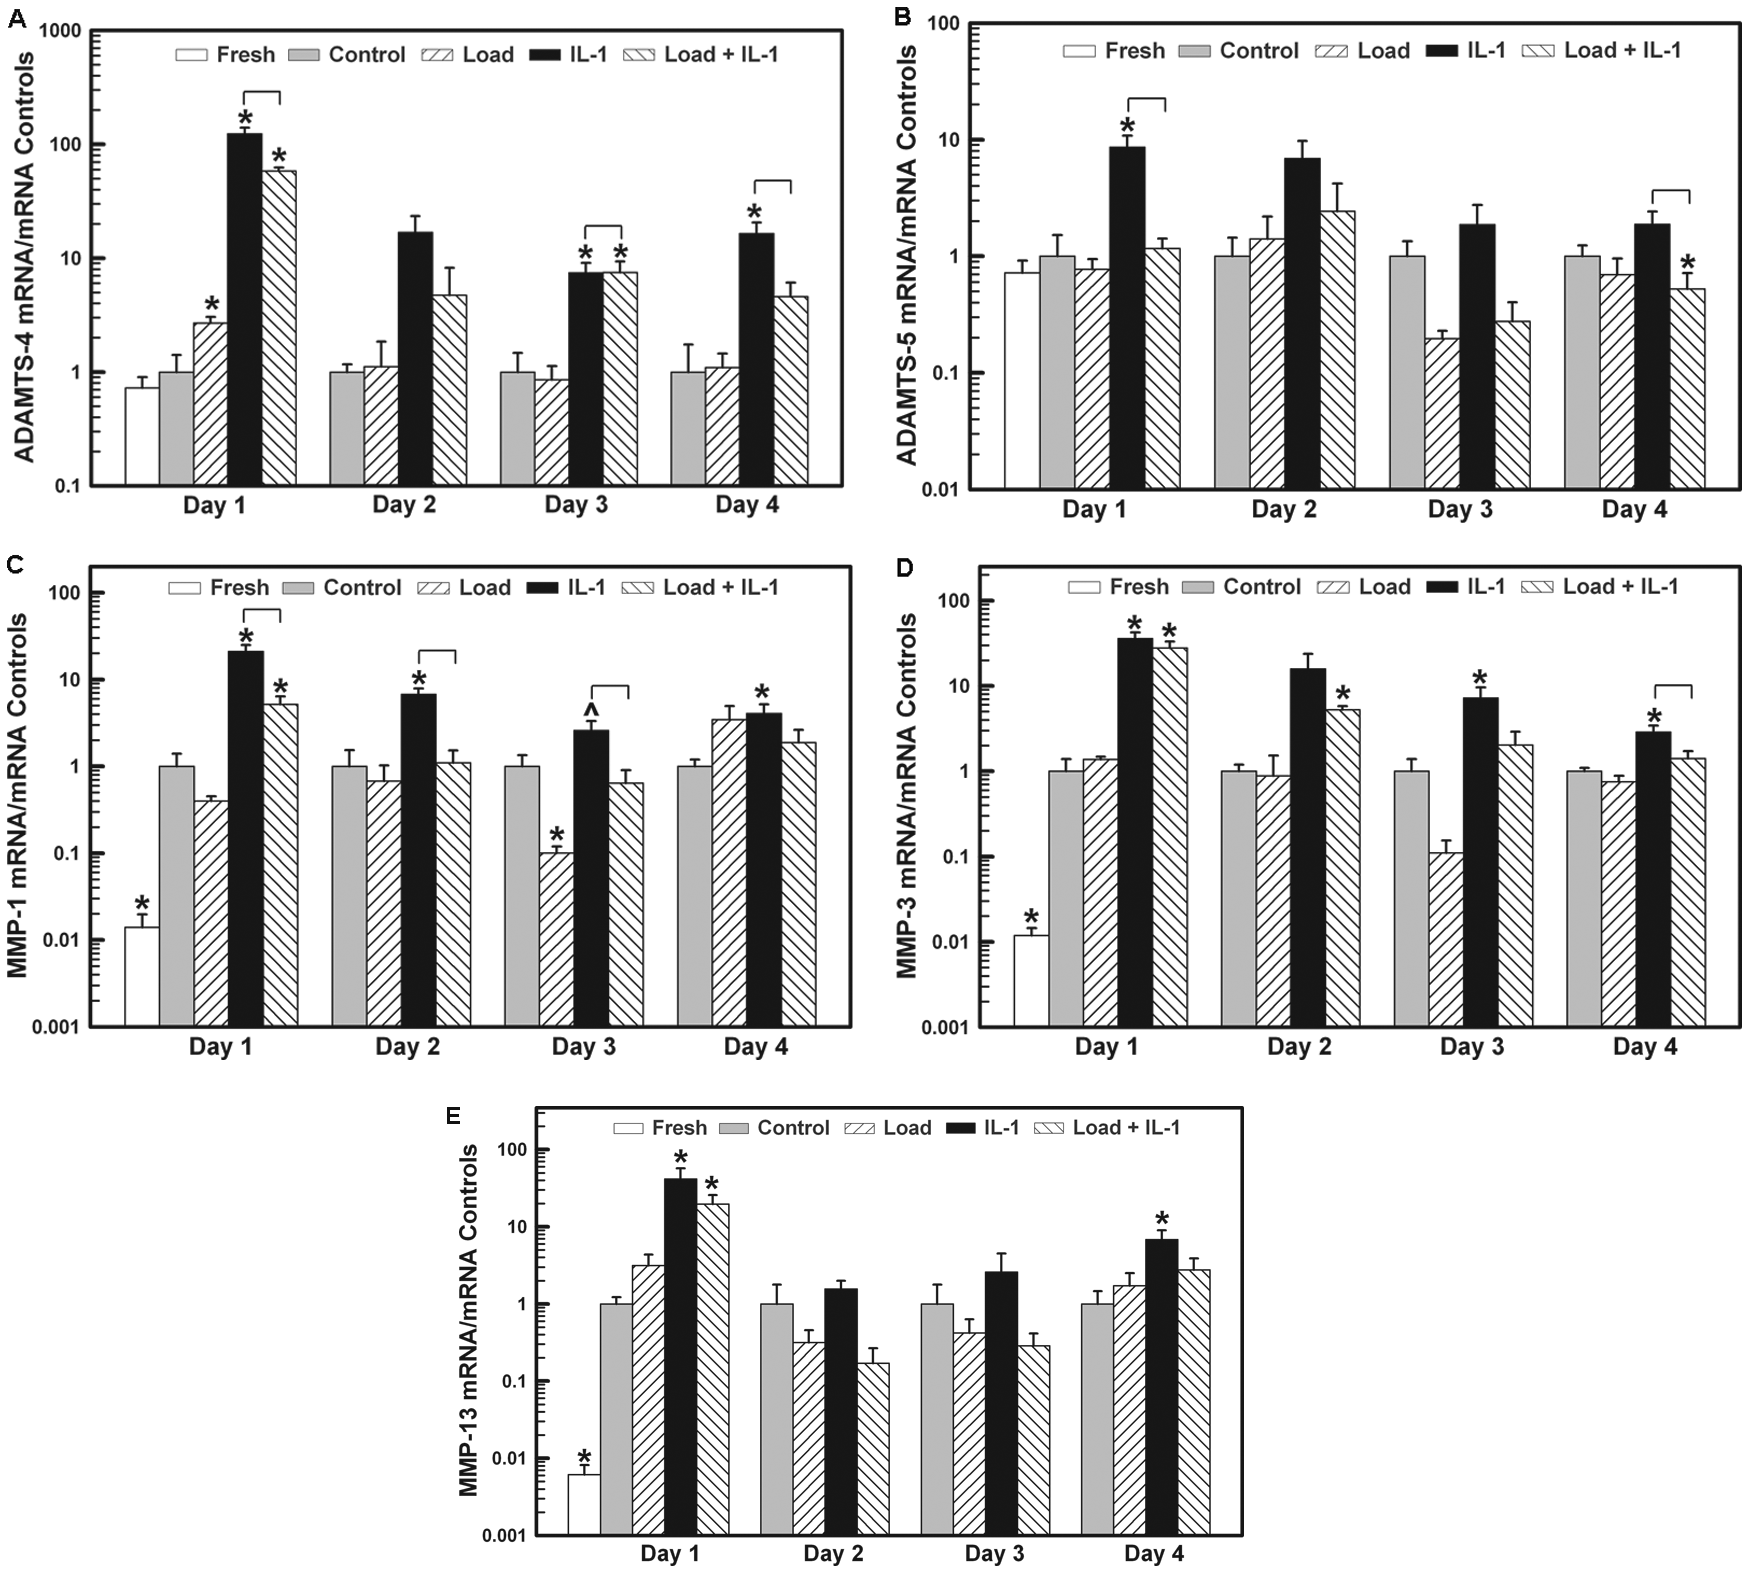
The expression levels of mRNA for ADAMTS-4 and -5 and MMP-1, -3, and -13 on all days are shown for the Fresh (day 1 only), Control, Load, IL-1, and Load + IL-1 groups. (
During the 3 days of load stimulation and after 1 day of recovery, the mRNA levels did not significantly change, nor were they different from the Control group ( Fig. 4 a - e ). With IL-1 stimulation, however, all enzyme mRNA levels were increased compared to their control mRNA levels, the mRNA expression slowing decreasing from day 1 through day 3, though not to the level of the controls, except for ADAMTS-5 and MMP-13, which reached their control levels on day 2 ( Fig. 4 b , d ). After removal of the IL-1 on day 4, the mRNA levels remained elevated for ADAMTS-4, MMP-1, and MMP-3 and at the control level for ADAMTS-5, while MMP-13 significantly increased 7-fold.
As compared to the Control mRNA expression, 1 day of loading had no effect on gene expression levels for ADAMTS-5 and MMPs-1, -3, -9, and -13 ( Fig. 3 ). However, load did cause a 3-fold increase in ADAMTS-4 mRNA expression. On the other hand, IL-1α significantly increased the expression of all enzymes, ADAMTS-4 and -5 by 123- and 9-fold, respectively, and MMP-1, -3, -9, and -13 by 21-, 36-, 9-, and 42-fold, respectively. When the load and IL-1α were applied simultaneously, there was a significant decrease in mRNA levels for ADAMTS-4 (53%), ADAMTS-5 (86%), and MMP-1 (75%) compared to the IL-1 levels, though only the mRNA levels for ADAMTS-5 were reduced to the level of the Control group (ADAMTS-4 and MMP-1 were still elevated 58- and 5-fold compared to Control). Load had no effect on the IL-1-induced increases in mRNA levels for MMPs-3, -9, and -13 (Load + IL-1 versus IL-1, Fig. 3 ).
The application of the load and IL-1 stimulations caused a significant reduction in the mRNA levels for ADAMTS-4 and ADAMTS-5 on day 1 and MMP-1 on days 1-3. For ADAMTS-5 the mRNA levels were reduced to or below their control levels on all 3 days ( Fig. 4 b ). The mechanical load had no effect on IL-1-induced mRNA levels for MMP-3 and MMP-9 on day 1. One day after load and IL-1 removal, the mRNA levels for all enzymes returned to their control levels ( Fig. 4 a - e ).
Mechanical Load Affects Gene Expression for TIMPS
The mRNA levels for TIMP-1, -2, and -3 were measured after 1 day of stimulation ( Fig. 5a ), while TIMP-1 and -3 levels were also measured on days 2-4 ( Fig. 5 b and c , respectively). Compared to the Control group, load significantly increased the mRNA levels of TIMP-1 (~3-fold) on day 1 and TIMP-3 on days 1 and 3 (~3- and 2-fold, respectively), while IL-1 stimulation had no significant effect on the expression levels.
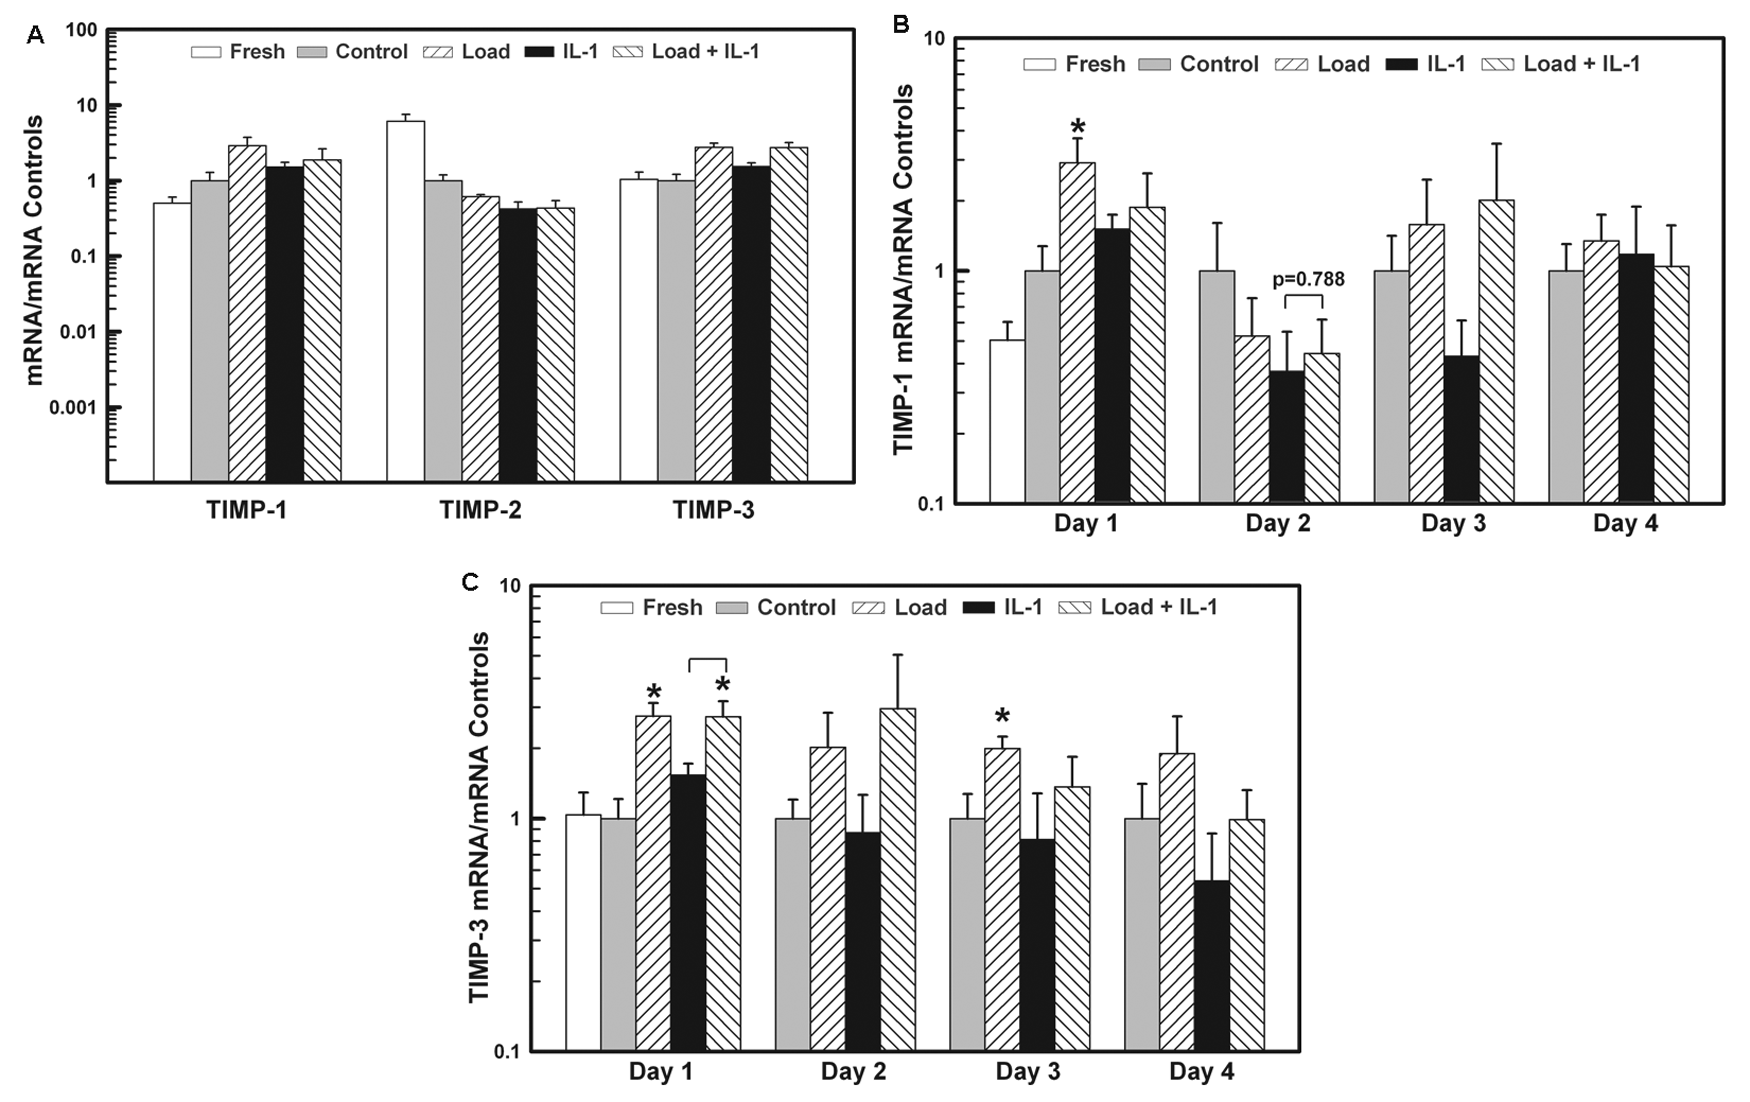
The expression levels of mRNA for TIMP-1, -2, and -3 in the Load, IL-1, and Load + IL-1 groups normalized to their respective mRNA levels in the Control (= 1 ± SEM). (
Applying the load together with the IL-1α increased the mRNA levels for TIMP-3 compared to the Control and IL-1 groups on all days ( Fig. 5c ), while not affecting the levels for TIMP-1 and -2. All three stimulations decreased the expression of TIMP-2 below the control levels on day 1 (~40%-60%, Fig. 5a ). Once the stimulations were removed, the mRNA levels for all TIMPs returned to the control levels.
Chondrocyte Gene Expression Is Affected by Culture
ADAMTS, MMP, and TIMP mRNA expression levels in all four treatment groups were measured at 24-h intervals (days 1-4) following an initial treatment-free 6 days in culture. In order to relate the effect of the treatments on the mRNA expression levels to what their levels might be in vivo, mRNA expression levels for ADAMTS-4 and -5; MMP-1, -3, -9, and 13; and TIMP-1, -2, and -3 were measured in a separate group of cartilage explants (Fresh, n = 6) immediately after removal from the same bovine knee used for the Control group. The mRNA expression for the Fresh group was statistically compared to the Control group mRNA expression on day 1 ( Figs. 3 and 5 a ). The mRNA levels for ADAMTS-4 and -5 and TIMP-1 and -3 in the Fresh group were similar to the levels in the Control group. However, the mRNA levels in the Fresh group were significantly lower for MMP-1 (0.01-fold), MMP-3 (0.01-fold), MMP-9 (0.13-fold), and MMP-13 (0.006-fold), while the mRNA level for TIMP-2 was significantly higher (6-fold).
Discussion
The etiology of the initiation and progression of osteoarthritis, in which the ECM is damaged and degraded, respectively, is most likely due to a combination of abnormal mechanical loads (e.g., excessive or reduced joint contact stresses) and an inflammatory response to the mechanical insult (e.g., IL-1-induced cellular catabolism)30,31. Both these events can occur through mechanisms associated with continuous and prolonged joint motion (e.g., wear and tear) and acute joint trauma (e.g., anterior cruciate ligament rupture). In a previous in vitro study, we found that a low load (stress = 0.2 MPa) applied to cartilage explants for 3 days caused no ECM damage, nor did it affect the IL-1-induced cellular catabolism of aggrecan and concomitant loss from the ECM 26 . When the load was increased (0.5 MPa), it again caused no ECM damage by itself, however it did reduce the IL-1-induced aggrecan cleavage and loss from the ECM. Similar to others2,10,17, we found that cartilage exposed to IL-1α (10 ng/ml) caused aggrecan cleavage within the interglobular domain (IGD), which was attributed to aggrecanase and MMP activity as assessed on Western blot analysis (cleavage at the Asn373-Ala374 and Asn341-Phe342 bonds, respectively). However, the IGD cleavage-time equivalency for aggrecanase and MMP found in our study was different from other studies in which aggrecan cleavage by aggrecanase occurred well before MMP cleavage2,3,17,18. To further evaluate the mechanisms involved in the IL-1-induced ECM degradation and its reduction by mechanical load (0.5 MPa), we analyzed chondrocyte gene expression for the two primary enzymes known to cleave aggrecan in the IGD, ADAMTS-4 and -5, and MMPs-1, -3, -9, and -13, and for their natural inhibitors TIMP-1, -2, and -3.
Application of a mechanical stress of 0.5 MPa for 3 days followed by an additional day of unloading did not affect the PG content in the ECM as measured by PG loss to the media ( Fig. 1 ) and visually by histochemical analysis of the PG content of the ECM ( Fig. 2 ). However, as expected, incubation with IL-1α (10 ng/ml) resulted in increased PG loss from the ECM. Histochemical analysis found that the PG loss started at the articular surface, within the superficial zone, and progressed deeper into the ECM during each additional day of incubation with IL-1α ( Fig. 2 ). There was little or no observable increase in PG loss from the ECM after the IL-1α was removed after 1 day. The initial PG loss at the articular surface, and the time-dependent progressive PG loss further from the surface into the ECM found in our in vitro study, is similar to that observed in vivo in the early stages of cartilage degradation in OA animal models and human OA32,33. This zonal pattern of PG loss may be attributed to our use of a confined-compression test configuration, which we believe best simulates the in vivo functional aspects of articular cartilage, where the articular surface is cyclically loaded and the ECM’s interstitial fluid, which would contain the ECM components (intact and fragments), is transported across the articular surface (exuded and imbibed) as the ECM is cyclically deformed 34 .
Applying the mechanical load together with IL-1α significantly reduced the PG loss ( Fig. 1 ). A somewhat surprising finding was a lack of observable PG loss throughout the entire ECM, either during stimulation or after removal ( Fig. 2 ). The lack of observable PG loss in the deeper zones of the ECM may be due to insensitivity of the Safranin-O staining for small decreases in PG content, especially in the SZ where the PG content is the lowest. However, there was no observable decrease in PG staining on days 1-4 in the Load + IL-1 group even though the PG loss was slowly increasing ( Fig. 1 ). One possibility was that the mechanical load stimulated PG synthesis and thus counterbalanced any PG loss by IL-1-induced chondrocyte catabolism. However, we do not think this happened for several reasons. While we did not measure PG synthesis in this study, we previously reported 27 that a continuously applied cyclic load, as used here, decreases PG synthesis, while a continuously applied cyclic deformation, as used by others 35 , increases PG synthesis. In addition, IL-1 alone has been shown to decrease chondrocyte PG synthesis36,37. Applied together both stimuli (cyclic load + IL-1) would have an additive effect to decrease PG synthesis rather than a counteractive effect to balance PG synthesis and loss. We also considered the possibility of IL-1α exclusion from the ECM during the mechanical loading, due to fluid exudation as the ECM was compressed. Based on our previous studies27,38, we estimated IL-1 transport into the ECM would reach concentration and depth equilibrium by diffusion and convection (fluid transport) in about 3 h and 30 min, respectively. We later measured the transport of fluorescent-tagged IL-1α (17 kDa) and dextran (20 kDa) into unloaded and loaded cartilage (data not shown). After 24 h both solutes were uniformly and equally distributed throughout the entire depth of the ECM in the unloaded and loaded cartilage (data not shown), thus eliminating this possibility.
Other possibilities for the decreased PG loss might be attributed to the porous load platen restricting PG transport through the articular surface and the mechanical load compressing the ECM to restrict PG transport. However, data from our previous study 26 indicated that the porous platen did not restrict PG transport as the application of a 0.2 MPa mechanical load applied together with the IL-1α did not decrease or inhibit the increased PG loss due to IL-1α. On the other hand, we did previously find that mechanical load can reduce PG loss, independent of chondrocyte catabolism, by compacting and reducing the porosity of the articular surface and ECM to effectively entrap the PGs within the ECM 39 . While this purely mechanical mechanism might have contributed to the overall decrease in PG loss from the ECM at the higher 0.5 MPa load, we don’t believe it is the primary mechanism for the reduced PG loss when applied together with the IL-1α. This we attribute to mechanical load inhibition of aggrecan cleavage by aggrecanases and MMPs, as previously reported 26 . In a later unpublished study using even higher loads of 1 and 3 MPa, we again found inhibition of aggrecan cleavage and PG loss, where the absence of aggrecan cleavage was found both within the ECM and the media. Thus, the primary mechanism appears to be at the cellular level where the mechanical load inhibits the IL-1α-induced chondrocyte catabolism of the aggrecan.
We measured chondrocyte mRNA expression levels for ADAMTS-4 and -5; MMP-1, -3, -9, and -13; and TIMP-1, -2, and -3 during and after load and IL-1α stimulation. Stimulation with IL-1α caused a significant increase in the mRNA expression for all enzymes on day 1 (p < 0.05), which continued thereafter through day 4 except for MMP-13, which was increased only on day 4 (MMP-9 not measured). The addition of the mechanical load had a small or negligible effect on reducing ADAMTS-4 gene expression (0.05 < p ≤ 0.10, n = 13), while for ADAMTS-5 and MMP-1 the load significantly decreased the expression of both enzymes to that of the controls (p < 0.05) starting on day 1 and continuing through day 4. Load started to reduce the IL-1α-induced increase in MMP-3 expression on days 1-2 and reached the control levels on day 3 (0.05 < p ≤ 0.10) and day 4 (p < 0.05). Load had no effect on IL-1α on day 1 for MMP-9 and MMP-13. Finally, IL-1α and load stimulations both affected TIMP mRNA expression levels on day 1. TIMP-1 expression increased with load, while TIMP-2 decreased and TIMP-3 increased with Load, IL-1α, and Load + IL-1α.
As reported in our previous study 26 and by others2,17,18,19,40 aggrecan cleavage and loss from the ECM in response to IL-1 stimulation preceded collagen loss from the ECM. In our previous study we found increased collagen loss with IL-1α stimulation only, and only after IL-1α removal on day 4 when the PG loss returned to control levels 26 . This finding is interesting since the mRNA expression levels for MMP-1, MMP-3, and MMP-13 were also significantly increased on day 4 (4-, 3-, and 7-fold, respectively), especially for MMP-13 since the expression was not affected by IL-1α or load on days 2 and 3. This result gives further validation, on both the mRNA and protein levels, of a delayed degradation and loss of collagen from the ECM relative to that of the PG component. However, this delayed mechanism will need further investigation since we did not assess MMP activity or concentration or whether the released collagen was intact or cleaved.
An unexpected finding was the differences and similarities in some of the gene expression levels between the Fresh group and the day 1 Control group (day 0 mRNA level was not measured). The Fresh and Control groups’ mRNA levels were similar for ADAMTS-4 and -5 and TIMP-1 and -3, while the Fresh group had lower mRNA levels for MMP-1, -3, -9, and -13 and a higher mRNA level for TIMP-2. Clearly these differences must be attributed to the pre-incubation of the explants, such that care must be taken when interpreting each treatment group’s mRNA expression levels to in vivo levels and relative to the Control group, which may not be representative of in vivo levels on any post-harvest day.
Our findings indicate that cyclic mechanical loading of joints, as might occur during normal physiological activities, will attenuate or possibly inhibit the degradation of articular cartilage caused by the inflammatory cytokine interleukin-1. In our in vitro studies, we found this effect to occur only when both stimulations (mechanical load and IL-1) were simultaneously applied. This was confirmed at the protein level as the mechanical load was found to inhibit aggrecanase and MMP cleavage of aggrecan and reduce the PG loss from the ECM 26 and also at the cellular level where the load down-regulated the gene expressions for ADAMTS-4, ADAMTS-5, and MMP-1 and up-regulated the expressions for TIMP-1 and TIMP-3. However, the mechanical load did not significantly affect the gene expression for MMP-3, MMP-9, or MMP-13, all of which were elevated within the first 24 h of stimulation by IL-1α with or without the mechanical load. Further studies will need to be conducted to confirm these results under differing loading and cytokine stimulations.
Footnotes
Acknowledgments and Funding
Support for this study was made possible by Grant Number
Declaration of Conflicting Interests
The authors declared no potential conflicts of interests with respect to the authorship and/or publication of this article.