
Abstract
Cutaneous fatty acid–binding protein (C-FABP), a cancer promoter and metastasis inducer, is overexpressed in the majority of prostatic carcinomas. Investigation of molecular mechanisms involved in tumor-promoting activity of C-FABP has established that there is a fatty acid–initiated signaling pathway leading to malignant progression of prostatic cancer cells. Increased C-FABP expression plays an important role in this novel signaling pathway. Thus, when C-FABP expression is increased, excessive amounts of fatty acids are transported into the nucleus where they act as signaling molecules to stimulate their nuclear receptor peroxisome proliferator-activated receptor gamma (PPARγ). The activated PPARγ then modulates the expression of its downstream target regulatory genes, which eventually lead to enhanced tumor expansion and aggressiveness caused by an overgrowth of cells with reduced apoptosis and an increased angiogenesis.
Introduction
Cutaneous fatty acid–binding protein or C-FABP (also known as E-FABP, PA-FABP, or FABP5) is a 15 kDa cytosolic protein of the fatty acid–binding protein family that binds with high affinity to long-chain fatty acids. C-FABP expression was detected in endothelial cells of the placenta, heart, skeletal muscle, small intestine, renal medulla, and in Clara and goblet cells of the lung.1-4 C-FABP was also identified as a molecule involved in malignant progression of prostate and breast cancer cells, and its increased expression was able to induce metastasis in the benign rat Rama 37 model cells. 5 Suppression of C-FABP expression in highly malignant PC-3M prostatic cancer cells inhibited significantly their tumorigenicity.6-8 Overexpression of C-FABP was also detected in malignant tumors of the urinary bladder, pancreas, breast, and oral squamous carcinomas.9-13 Therefore, C-FABP may play an important role in development and metastasis of cancers originating from the prostate and other organs. Recently, C-FABP has been demonstrated to be a prognostic marker for predicting patient outcome and a target for tumor suppression of prostatic cancer. 7 Despite the increasing importance of C-FABP in cancer development, molecular mechanisms involved in the tumor-promoting function of C-FABP are not fully understood.
Previous studies on rat model cells suggested that C-FABP may stimulate the expression of the vascular endothelial growth factor (VEGF) gene and promote angiogenesis to facilitate tumor formation and metastasis.14,15 It was observed that suppressing C-FABP in highly malignant prostatic cancer cells reduced the level of VEGF expression and suppressed angiogenesis of the resultant cancer cells,6,7 but it is not known whether increased expression of C-FABP in weakly malignant prostatic cancer cells can upregulate VEGF expression. Thus, it is not yet certain whether C-FABP facilitates tumorigenicity by promoting angiogenesis and, if it does, whether this is the only mechanism involved in its tumor-promoting activity? Since the common biological function of FABPs, including C-FABP, is to bind and transport extracellular fatty acids into cells, it is reasonable to explore whether the tumor-promoting function of C-FABP is related to its fatty acid transporting activity.
In C-FABP itself, there are 3 key amino acids (Arg109, Arg129, and Tyr131) that are conserved among the FABP family of proteins, and which are suggested to be responsible for binding to the carboxylate group of fatty acids. 16 Replacing 1 or 2 of these 3 key amino acids can either partially or completely deprive C-FABP of its fatty acid–binding ability. To investigate whether binding to fatty acids is essential for C-FABP to promote cancer growth, 1 and 2 site-directed point mutations were introduced into the region of C-FABP cDNA containing this fatty acid–binding motif to generate mutant cDNAs. The wild type and mutated C-FABP cDNAs were either transformed into Escherichia coli cells to produce recombinant proteins or transfected separately into the LNCaP prostatic cancer cells, which did not express C-FABP prior to transfection. The effect of wild type and mutant C-FABPs on their ability to bind to fatty acids and on the tumorigenicity of the transfected cells was investigated and compared to the controls to assess the molecular mechanisms involved in the tumor-promoting activity of C-FABP.
Fatty acids have been identified as signaling molecules, 17 which can be recognized by their nuclear peroxisome proliferator-activated receptors (PPARs); these are transcription factors that can bind to DNA and regulate transcription in a ligand-dependent manner.18,19 PPARs consist of 3 main subtypes: PPARα, PPARβ/δ, and PPARγ. PPARα is highly expressed in tissues with a high rate of mitochondrial fatty acid oxidation, such as liver, muscle, heart, kidney, and cells of arterial walls.20,21 PPARα regulates expression of the genes involved in lipoprotein metabolism and thus raises the level of apolipoprotein. PPARβ/δ is found in most tissues and is only weakly activated by fatty acids. 22 PPARγ is highly expressed in adipose tissues, it is a critical regulator of adipocyte differentiation, and is implicated in a variety of neoplastic processes. 23 PPARα is unlikely to be related to the biological activity of C-FABP since it is not expressed in prostate. 24 Our separate work (under the process of preparation for publication) completed recently suggests that increased nuclear expression of PPARβ/δ is not significantly correlated with increased cytoplasmic C-FABP, indicating that elevated PPARβ/δ may not be directly related to fatty acid stimulation in prostatic cancer cells. Thus, PPARγ rather than PPARβ/δ is more likely to be the fatty acid receptor in prostatic cancer cells. In this work, PPARγ has been studied to assess its possible role in fatty acid–initiated tumorigenicity in prostatic cancer cells.
Results
Production and Purification of Wild Type and Mutant C-FABPs in E. coli Cells
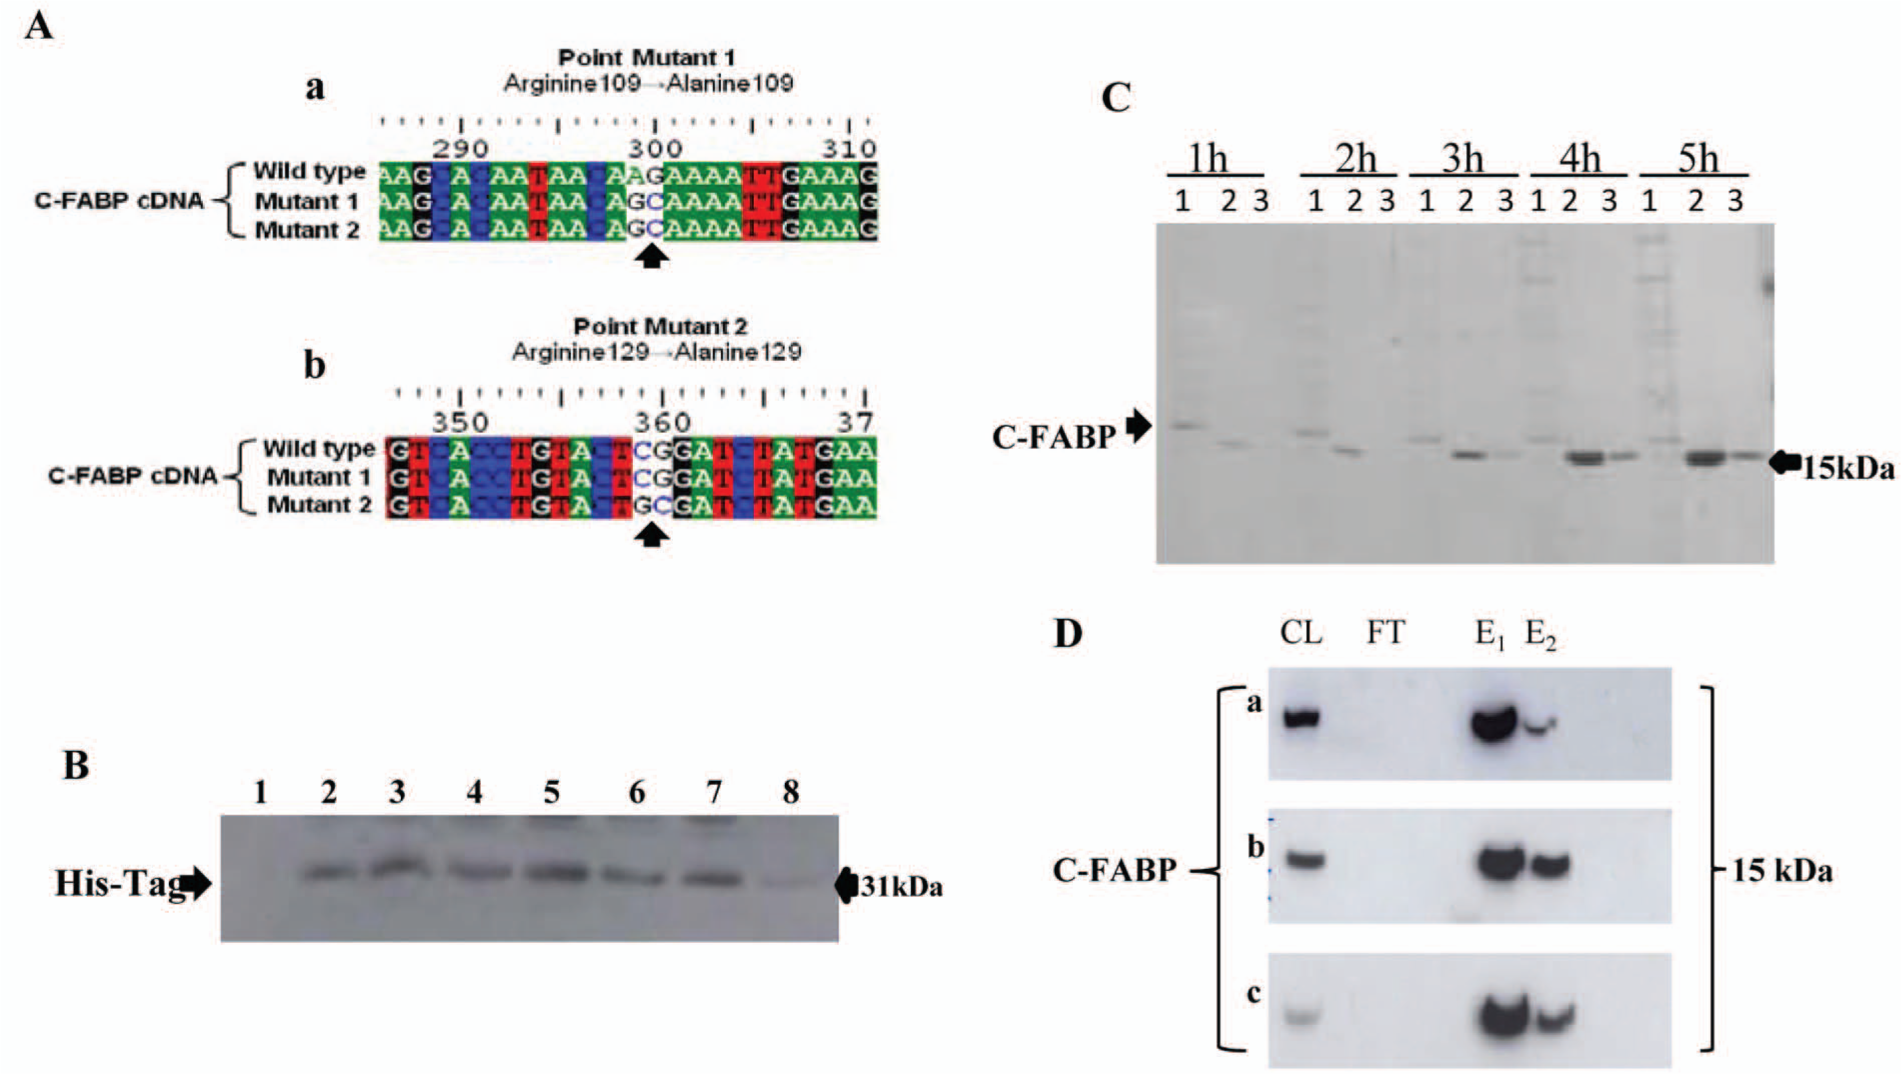
To produce recombinant mutant types of C-FABP, site-directed mutagenesis was conducted on C-FABP cDNA (Fig. 1A). First the nucleotide sequence of the C-FABP cDNA region containing the first mutation site was altered by converting the codon for Arginine 109 to that for Alanine 109, that is, the triplet AGA was changed into GCA (Fig. 1A, a). Second, the triplet CGG was changed into GCG in the second mutation site by replacing the codon for Arginine 129 with that for Alanine 129 (Fig. 1A, b). Thus, in the cDNA for C-FABP-109A, only one potential amino acid was changed in the first mutation site and no change was made in the second mutation site. In the cDNA for C-FABP-109/129A, potential amino acids in both mutation sites were changed. Nucleotide sequence analysis confirmed these changes. Thus, 3 constructs (including the wild type cDNA) were established and these were used to transform bacterial DH5α E. coli cells to form 3 separate pools of bacterial cells for protein production. After the IPTG induction, samples of bacteria harboring the 3 different DNA constructs and the control cells harboring only the plasmid were removed every hour for 8 hours. Western blots showed that no recombinant protein was produced in the control, but a very similar pattern in protein levels was observed in recombinant wild type (Fig. 1B) and the 2 mutant C-FABPs (not shown). Using the Penta-His antibody, 6×His-tag-bound C-FABP protein was visualized from the second hour of IPTG induction of experimental cultures. The level of the recombinant protein produced in bacteria increased with incubation time and reached a peak at 5 hours. Then the level started to decline after 6 hours and was almost completely degraded by 8 hours. Thus, the optimal time for protein production was 5 hours after IPTG induction. The bacterial samples taken from 1 to 5 hours were lysed and subjected to purification by affinity chromatography on a Ni-NTA column. Cell lysates, the first and second eluates originating from each sample, were subjected to Western blot. As shown in Figure 1C, reactive bands were detected not only by the Penta-His antibody but also by a monoclonal anti-human C-FABP antibody, indicating the successful production of C-FABP inside the bacterial cells. Large-scale production of recombinant proteins, termed C-FABP-WT, and C-FABP-R109A, C-FABP-R109/129A, which represented wild type C-FABP and C-FABPs with 1 or 2 mutations, respectively, was made in bacterial cells. Cell pellets were lysed and proteins purified. Western blots with a monoclonal anti-human C-FABP antibody of wild type and mutant C-FABP proteins purified from bacterial cells showed that the purity of all 3 products obtained was more than 95% (Fig. 1D).
Production and purification of wild type and mutant C-FABPs in E. coli cells. (
Fatty Acid–Binding Abilities of Recombinant C-FABPs
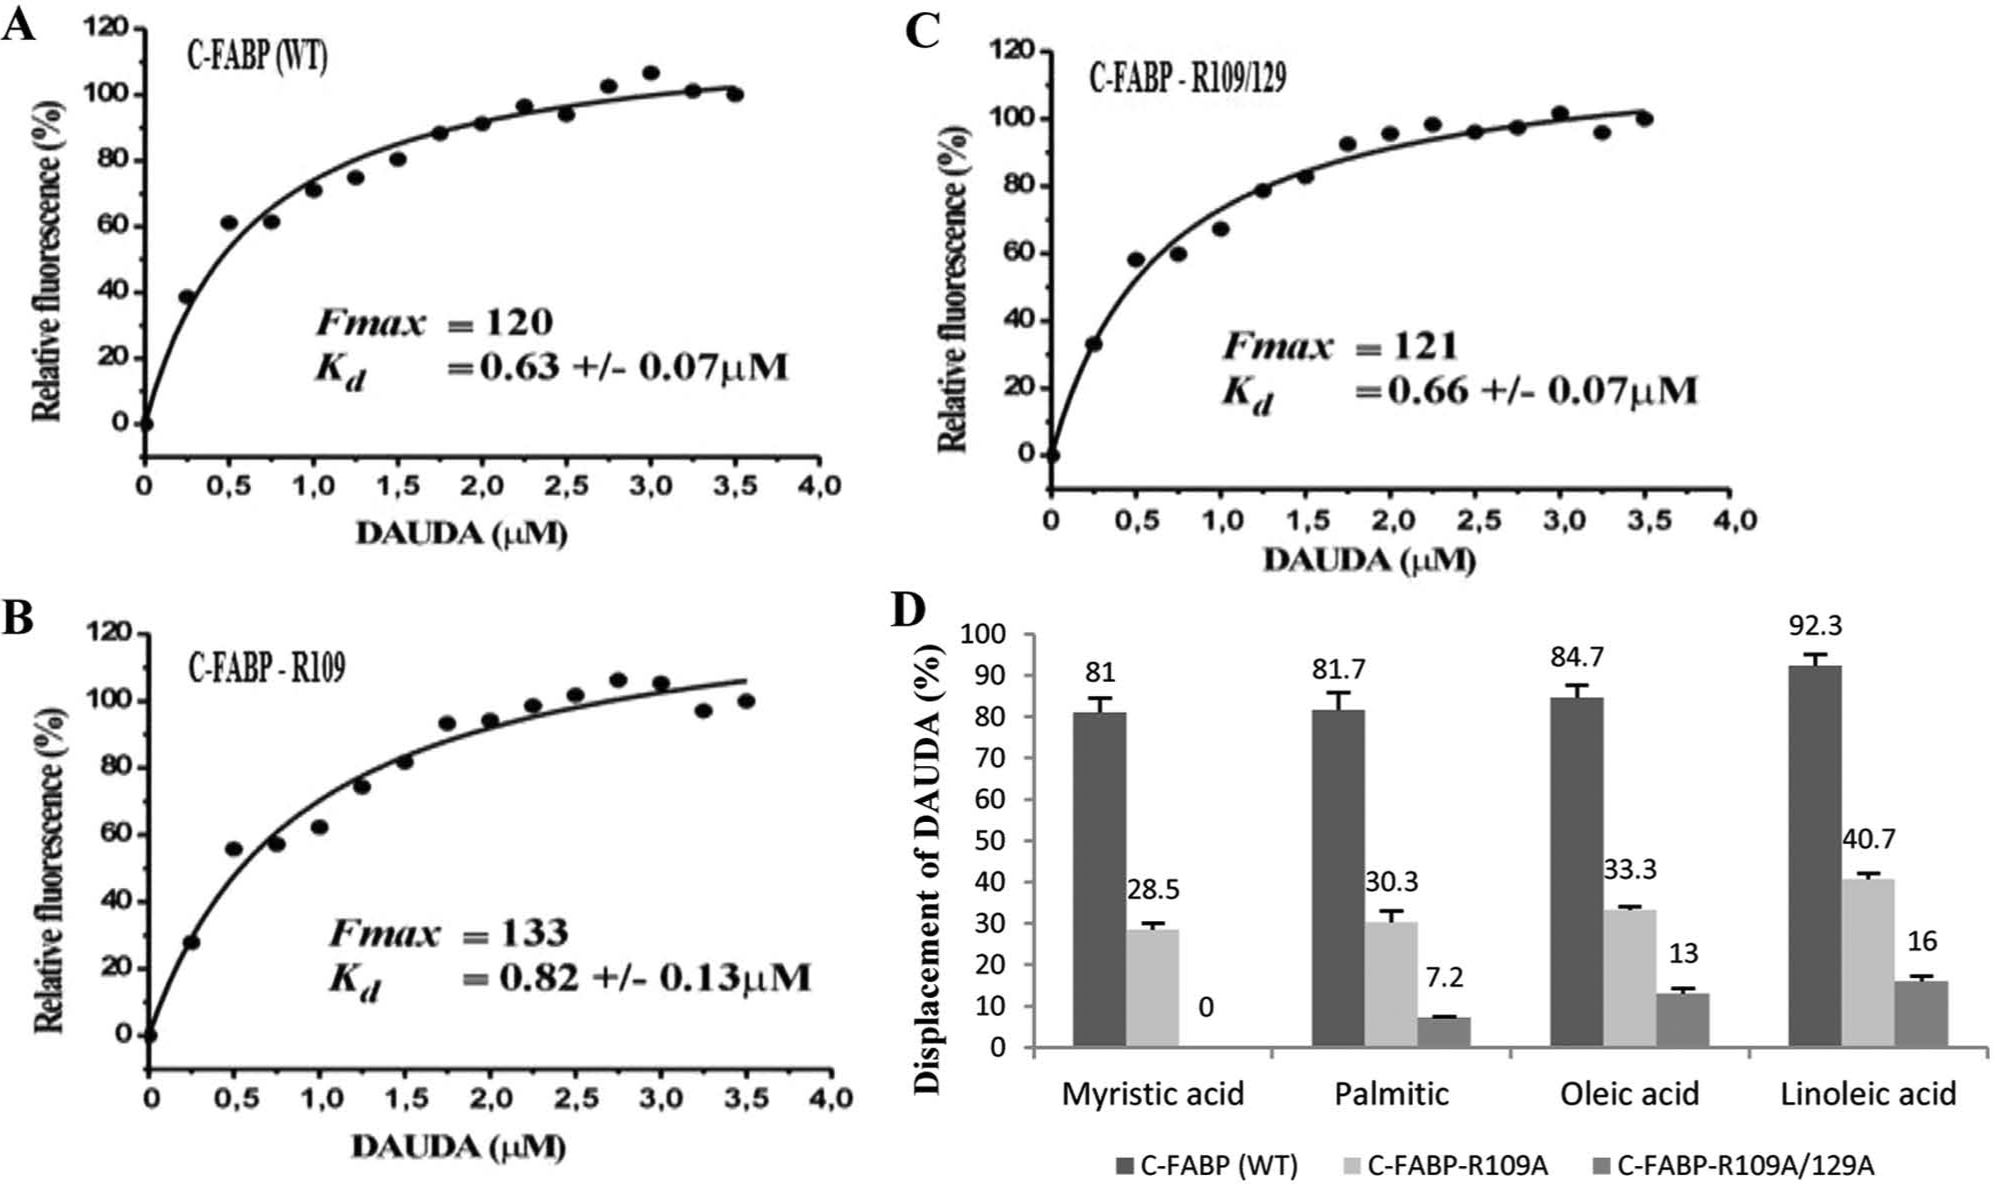
Fatty acid–binding capability of the 3 FABPs was examined by a replacement assay using the environment-sensitive fluorescent fatty acid analogue DAUDA [11-(Dansylamino) undecanoic acid] that alters its fluorescence emission spectra and intensity on specific binding to proteins. The DAUDA fluorescence maximum was shifted from 542 to 537, 529, and 527 nm for C-FABP-WT, C-FABP-R109A, and C-FABP-R109/129A, respectively (results not shown), and the increase of its fluorescent emission are both indicative of the entry of DAUDA into a more polar environment and confirmed that the fluorescent fatty acid was successfully bound to the 3 C-FABPs. Interestingly, the maximum fluorescences (Fmax) were similar (120, 133, and 121 nm for C-FABP-WT, C-FABP-R109A, and C-FABP-R109/129A, respectively) and the dissociation constants (Kd) for DAUDA binding to the 3 C-FABPs were also similar (0.63, 0.82, and 0.66 for C-FABP-WT, C-FABP-R109A, and C-FABP-R109/129A, respectively) (Fig. 2A, B, and C). Competitive inhibitor assays, using DAUDA as a tracer and natural fatty acids as competitors, were performed to investigate possible differences in the binding affinities of the 3 C-FABP proteins to other fatty acids. The addition of myristic (C14), palmitic (C16), oleic (C18), and linoleic acids (C20) indeed revealed a diverse affinity of the wild type and mutants C-FABPs. The efficiency of each fatty acid to displace DAUDA from the C-FABP proteins’ binding pocket is shown in Figure 2D. C-FABP-WT had the highest affinity for DAUDA displacement and binding to natural fatty acids (81%, 81.7%, 84.7%, and 92.3% for myristic, palmitic, oleic, and linoleic acids, respectively). If the relative binding ability of the C-FABP-WT to each of the 4 natural fatty acids was set at 1, the fatty acid binding ability of C-FABP-R109A to each of these 4 fatty acids was significantly reduced to 0.35, 0.37, 0.39, and 0.43, respectively (Student’s t-test, P < 0.005); and the fatty acid binding ability of C-FABP-R109/129A to each of the 4 fatty acids was further significantly reduced to 0, 0.08, 0.15, and 0.17, respectively (Student’s t-test, P < 0.001). Thus, the ability of binding to the natural fatty acids was reduced by 2.3 to 2.9 times for C-FABP-R109A and by 5.9 to 12.5 times (to 3 fatty acids) for C-FABP-R109/129A, in comparison with that of C-FABP-WT. For one fatty acid tested (myristic acid), C-FABP-R109/129A completely lost binding ability.
Measurements of fatty acid–binding abilities of recombinant wild type and mutant C-FABPs by DAUDA fluorescence displacement assay. The enhancement of DAUDA fluorescence on binding to different C-FABPs was obtained by subtracting the fluorescence of the same concentration of DAUDA measured in the absence or presence of the protein (
Establishment of Transfectants and Measurement of Their Ability to Take Up Fatty Acids
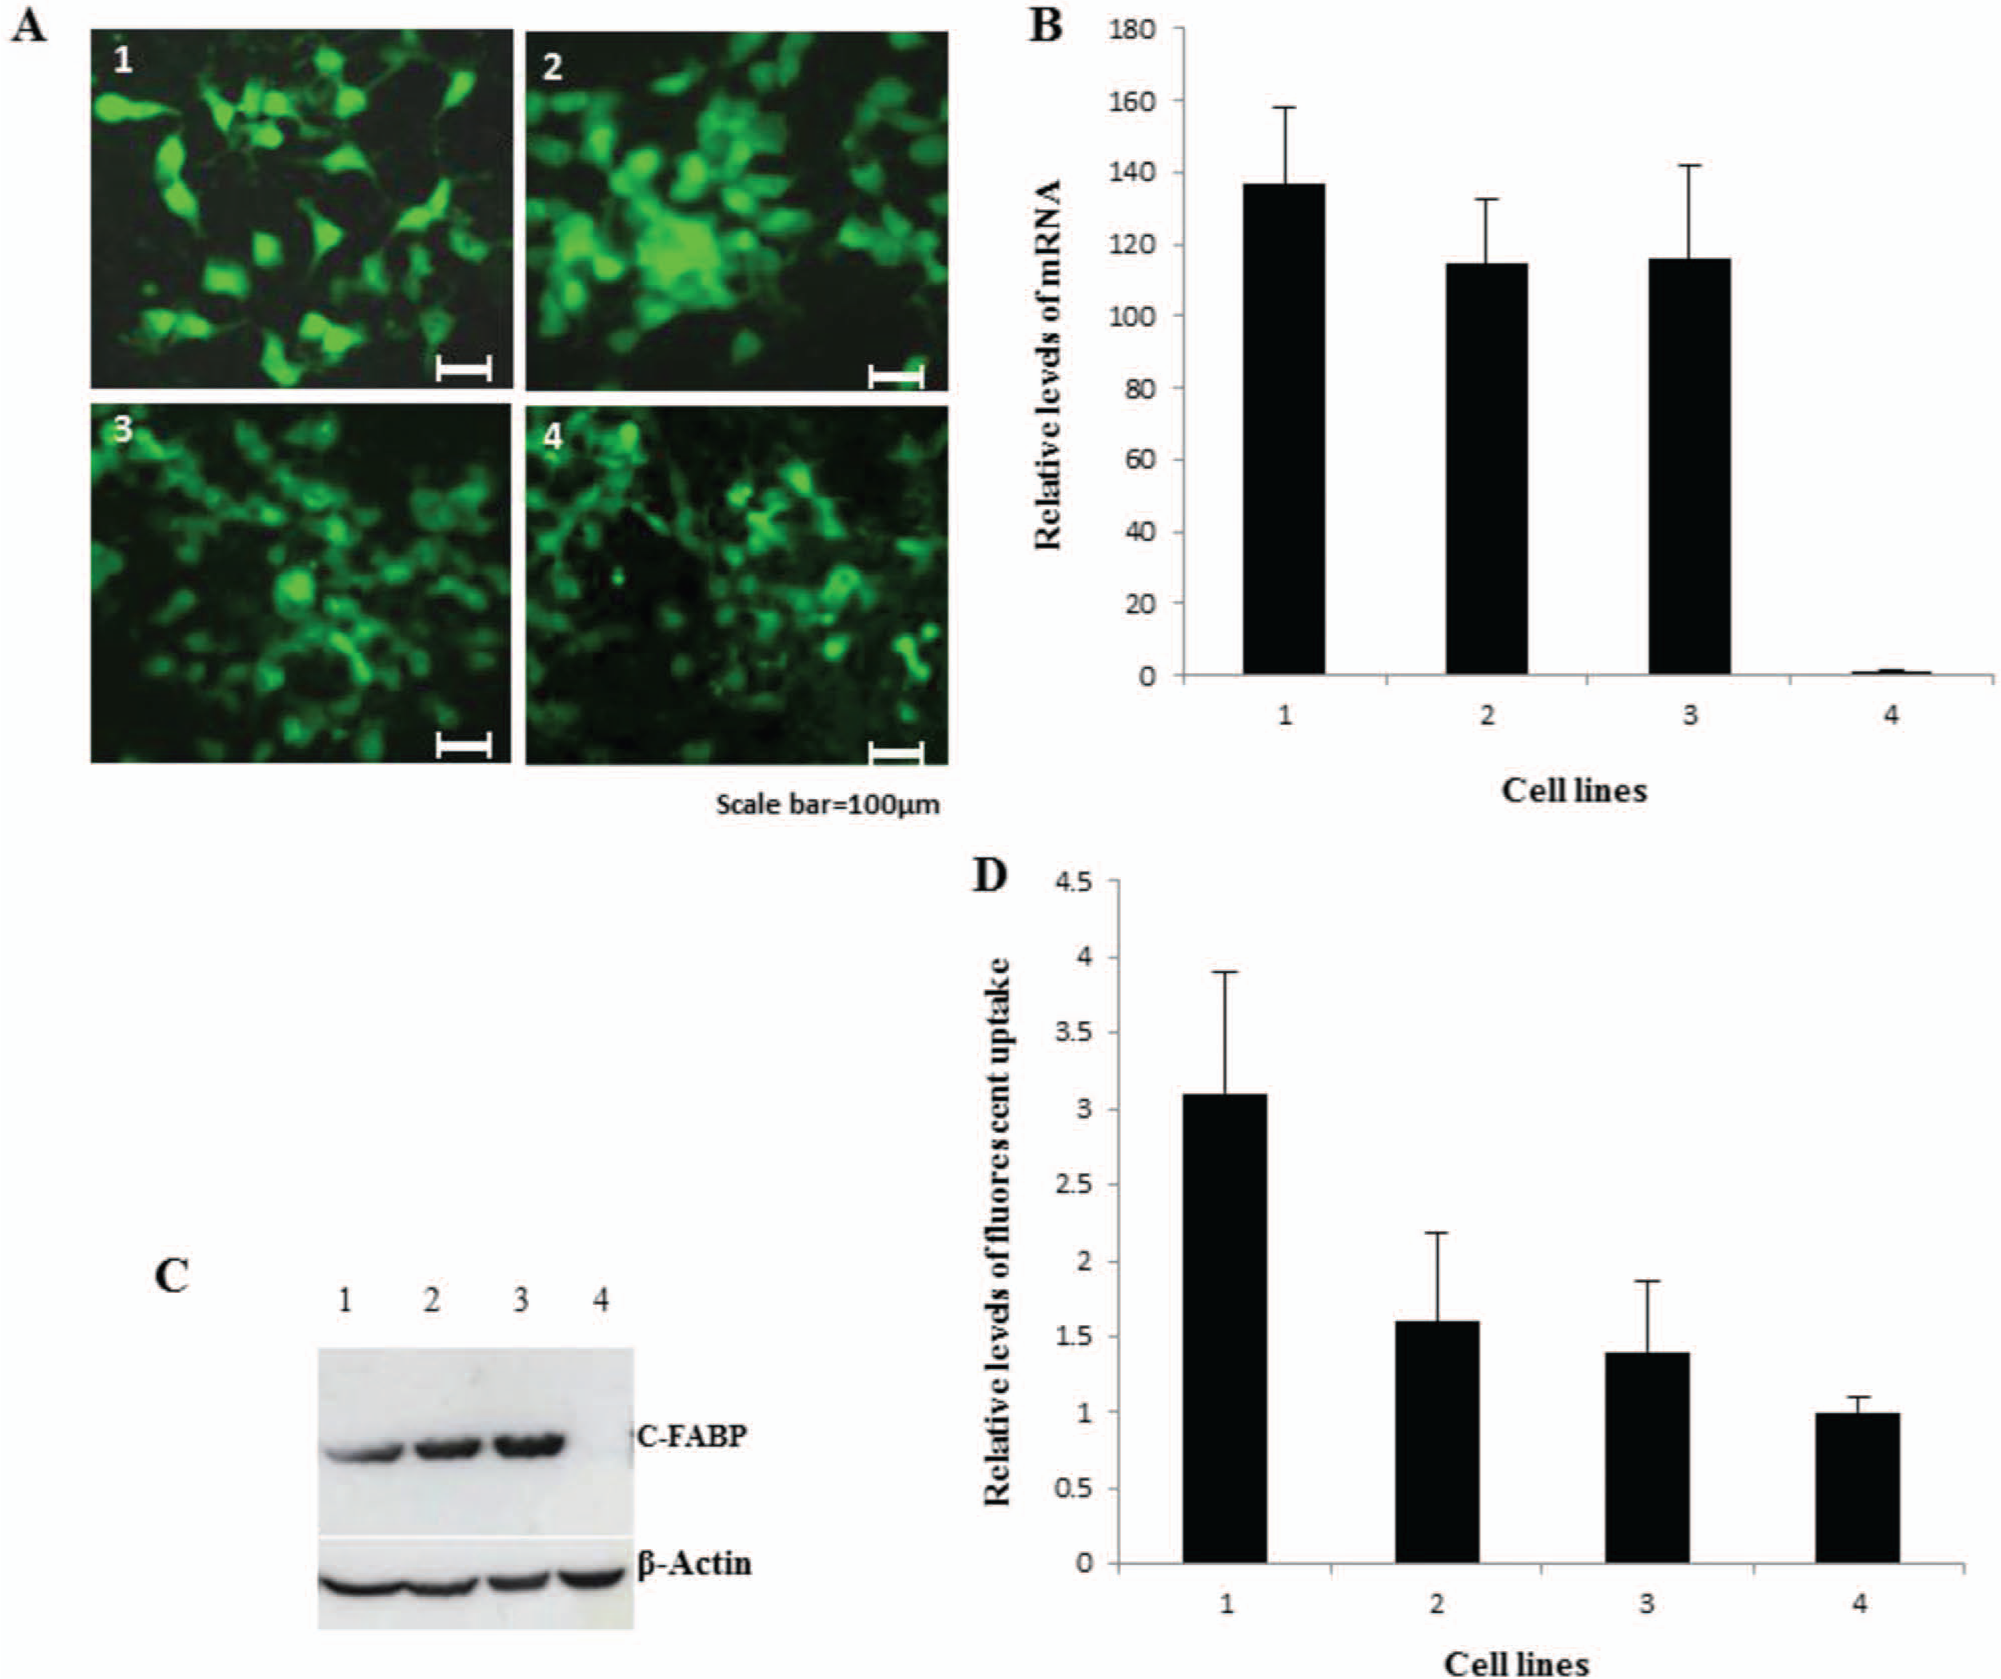
The wild type C-FABP cDNA, the mutant cDNA containing 1 mutation, and the mutant cDNA containing 2 mutations were cloned individually into the pIRES2-EGFP vector (BD Biosciences Clontech, Mountain View, CA) and transfected into the weakly malignant prostatic cancer cell line LNCaP to form 3 transfectant pooled cell lines designated as LNCaP-WTC-FABP, LNCaP-MC-FABP1, and LNCaP-MC-FABP2; they expressed high levels of wild type C-FABP and C-FABP containing 1 or 2 mutations, respectively. In addition, a pool of transfectants was generated by plasmid DNA alone to form control transfectant LNCaP-vector. Fluorescent images produced by the green fluorescent protein encoded in the vector were detected in all 4 transfectant cell lines (Fig. 3A), confirming that the vector constructs were successfully integrated into the genome of the recipient cells. When the relative C-FABP mRNA levels were measured by real-time PCR (Fig. 3B), similarly high levels of expression were detected in all transfectant lines, but the level expressed in the control was barely detectable. When the C-FABP mRNA level in LNCaP-vector was set at 1, the level increased by 137 ± 20 fold in LNCaP-WTC-FABP, 115 ± 17 fold in LNCaP-MC-FABP1, and 116 ± 26 fold in LNCaP-MC-FABP2 cells. At the protein level, the pattern of expression in all 4 cell lines was similar to that detected at the mRNA level (Fig. 3C). Western blot analysis showed that levels of H-FABP or A-FABP were detectable neither in the parental LNCaP cells nor in any of the 4 C-FABP transfectant lines (results are not shown), indicating C-FABP transfection did not cause changes on 2 other FABPs that were shown recently to be expressed in prostate carcinomas. 25 To measure and compare the fatty acid uptake, an orange-red fluorescent fatty acid BODIPY 558/568 C12 was added to each transfectant cell line (Fig. 3D). When the level of fatty acid uptake in LNCaP-vector was set at 1, levels in LNCaP-WTC-FABP, LNCaP-MC-FABP1, and LNCaP-MC-FABP2 were 3.1 ± 0.8, 1.6 ± 0.6, and 1.4 ± 0.5, respectively. In comparison with the control, the fatty acid uptake by LNCaP-WTC-FABP cells was significantly higher (Student’s t-test, P ≤ 0.006). However, neither the differences between LNCaP-MC-FABP1, LNCaP-MC-FABP2, and the control (Student’s t-test, P ≥ 0.217, P ≥ 0.157) nor that between LNCaP-MC-FABP1 and LNCaP-MC-FABP2 (Student’s t-test, P ≥ 0.685) was significant.
Establishment of LNCaP-derived transfectants expressing wild type and mutant C-FABPs and their fatty acid uptakes in the presence of fluorescently labeled long-chain fatty acids (LCFA). Four cell lines named LNCaP-WTC-FABP, LNCaP-MC-FABP1, LNCaP-MC-FABP2, and LNCaP-vector (control) are shown as 1, 2, 3, and 4, respectively. (
Growth, Invasion, and Tumorigenicity of Cells In Vitro
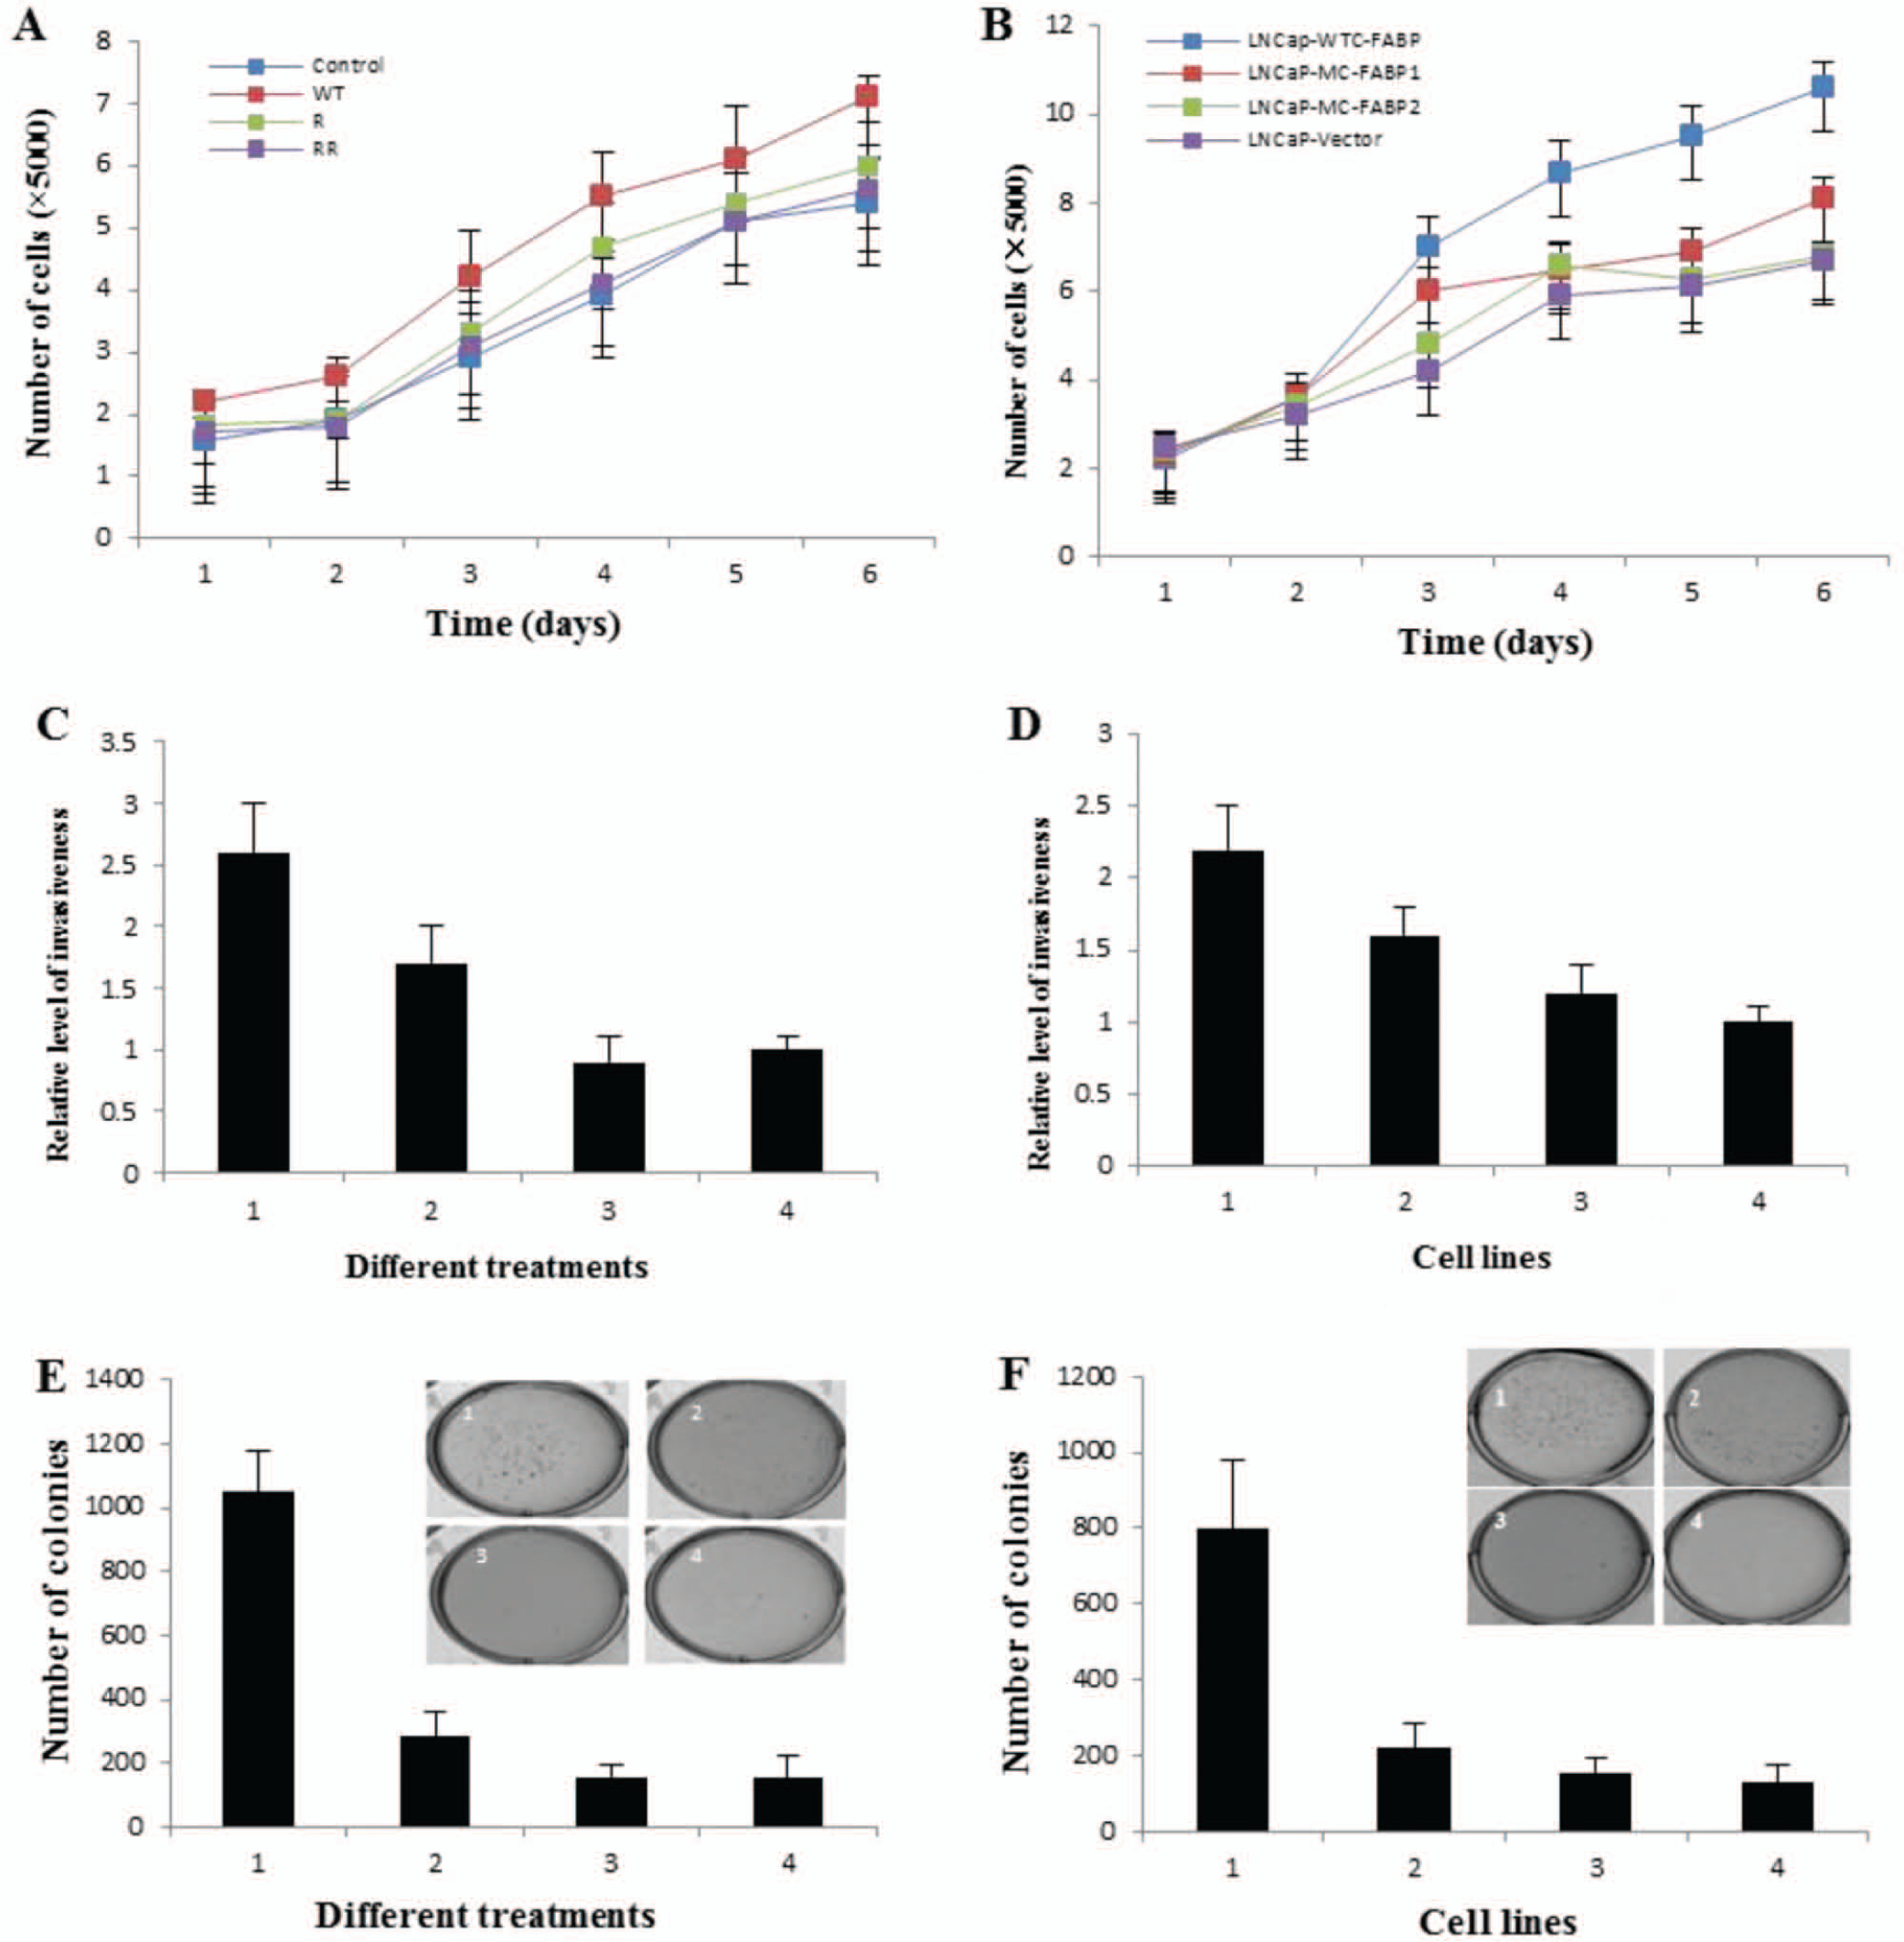
During the first 2 days of the cell proliferation assay, cell numbers among all 4 recombinant protein-stimulated cell lines (Fig. 4A) or among all 4 transfectants (Fig. 4B) were similar. The proliferation rates of C-FABP-WT stimulated LNCaP cells and LNCaP-WTC-FABP cells were significantly higher than those of the control (Student’s t-test, P ≤ 0.002; P ≤ 0.025) (Fig. 4A and B). The numbers of C-FABP-R109A stimulated cells and LNCaP-MC-FABP1 cells were significantly higher than those of the control (Student’s t-test, P ≤ 0.02; P ≤ 0.04), but significantly lower than those of C-FABP-WT stimulated cells and LNCaP-WTC-FABP cells (Student’s t-test, P ≤ 0.001; P ≤ 0.04). No significant difference was found between numbers of C-FABP-R109/129A stimulated cells or LNCaP-MC-FABP2 cells and the control cells (Student’s t-test, P ≤ 0.084; P ≤ 0.059).
Bio-assay analyses of the effects of recombinant and internally expressed C-FABPs on cell growth, invasiveness, and tumorigenicity of LNCaP prostatic cancer cells. (
Chemotactic migration through a membrane layered with Matrigel was used to measure the invasiveness of recombinant protein-stimulated cells (Fig. 4C) and the transfectants (Fig. 4D). All invasive cells remained attached to the lower surface of the membrane and no cells were found in the culture medium of the lower chamber. When the number of invaded cells from the control was set at 1 (±0.1), the relative numbers from C-FABP-WT, C-FABP-R109A, and C-FABP-R109/129A stimulated cells were 2.6 ± 0.4, 1.7 ± 0.3, and 0.8 ± 0.2, respectively (Fig. 4C). When the number of the invasive cells from LNCaP-vector was set at 1 (±0.1), the relative numbers of invasive cells from LNCaP-WTC-FABP, LNCaP-MC-FABP1, and LNCaP-MC-FABP2 were 2.2 ± 0.3, 1.6 ± 0.2, and 1.2 ± 0.2, respectively (Fig. 4D). Thus, the number of invasive cells from C-FABP-WT stimulated cells and LNCaP-WTC-FABP cells were significantly higher than those from controls (Student’s t-test, P ≤ 0.002, P ≤ 0.002, respectively). The invasiveness of C-FABP-R109A stimulated cells and LNCaP-MC-FABP1 were significantly higher than that of control cells (Student’s t-test, P ≤ 0.031, P ≤ 0.003, respectively), but were significantly lower than those of C-FABP-WT stimulated cells and LNCaP-WTC-FABP (Student’s t-test, P ≤ 0.035, P ≤ 0.045, respectively). The invasiveness of C-FABP-R109/129A stimulated cells and LNCaP-MC-FABP2 were not significantly different from those of the controls (Student’s t-test, P ≥ 0.4, P ≥ 0.20, respectively).
The tumorigenicity of the recombinant C-FABPs stimulated cells and transfectants were tested by examining their anchorage-independent growth in soft agar (Fig. 4E and F). Representative plates are shown above each figure. The number of colonies produced in soft agar by C-FABP-WT, C-FABP-R109A, C-FABP-R109/129A stimulated cells and the control cells were 1050 ± 132, 283 ± 76, 157 ± 38, and 155 ± 68, respectively. At the same time points, the number of colonies produced in soft agar by LNCaP-WTC-FABP, LNCaP-MC-FABP1, LNCaP-MC-FABP2, and LNCaP-vector cells were 798 ± 181, 220 ± 66, 157 ± 38, and 130 ± 48, respectively. In comparison with the controls, the number of colonies produced by C-FABP-R109A and C-FABP-R109/129A stimulated cells were increased by 45% and 2%, respectively, and by LNCaP-MC-FABP1 and LNCaP-MC-FABP2 transfectants were increased by 69% and 21%, respectively. The most significant changes were observed in C-FABP-WT stimulated cells and LNCaP-WTC-FABP transfectants, which produced more than a 6.7-fold and 6.1-fold increases, respectively, in numbers of colonies formed in soft agar in comparison to controls (Student’s t-test, P < 0.001, P < 0.003).
Nude Mouse Assay and Effect of PPARγ Inhibitor on Tumorigenicity
To test the possible differences in tumorigenicity of the transfectant lines in vivo, cells were injected into nude mice and tumor incidence, size and weight were measured or recorded at autopsy. A representative tumor from each of the 3 transfectant groups is shown in Figure 5A. The size of tumor produced by LNCaP-WTC-FABP cells in mice was much larger than those produced by the other transfectant cells. The latent periods varied among the different mice ranging from 13 to 25 days, but no significant differences were found in average latent periods among different groups. Only 3 out of 8 (37.5%) mice inoculated with LNCaP-MC-FABP2 and LNCaP-vector cells produced visible tumors, whereas 7 out of 8 (88.9%) mice inoculated with LNCaP-WTC-FABP cells developed solid tumors. The average volume of tumors produced by the 4 groups of mice gradually increased with time after inoculation as shown in Figure 5B. The average volume of tumors produced in the mice inoculated with LNCaP-WTC-FABP cells was significant greater than those produced by the mice inoculated with LNCaP-MC-FABP1, LNCaP-MC-FABP2, and LNCaP-vector cells (Student’s t-test, p < 0.03, P < 0.03, P < 0.02, respectively). At autopsy 9 weeks after inoculation, the average weight of tumors produced by LNCaP-WTC-FABP was 2.83, 10.35, and 13.15 times greater than those produced by LNCaP-MC-FABP1, LNCaP-MC-FABP2, and LNCaP-vector cells, respectively (Fig. 5C). While the average weight of tumors produced by mice inoculated with LNCaP-MC-FABP2 was not significantly increased, the average weight of tumors produced by the LNCaP-WTC-FABP and LNCaP-MC-FABP1 cells was significantly (Student’s t-test, P < 0.01, P < 0.02, respectively) greater than that produced by LNCaP-vector cells (Fig. 5C).
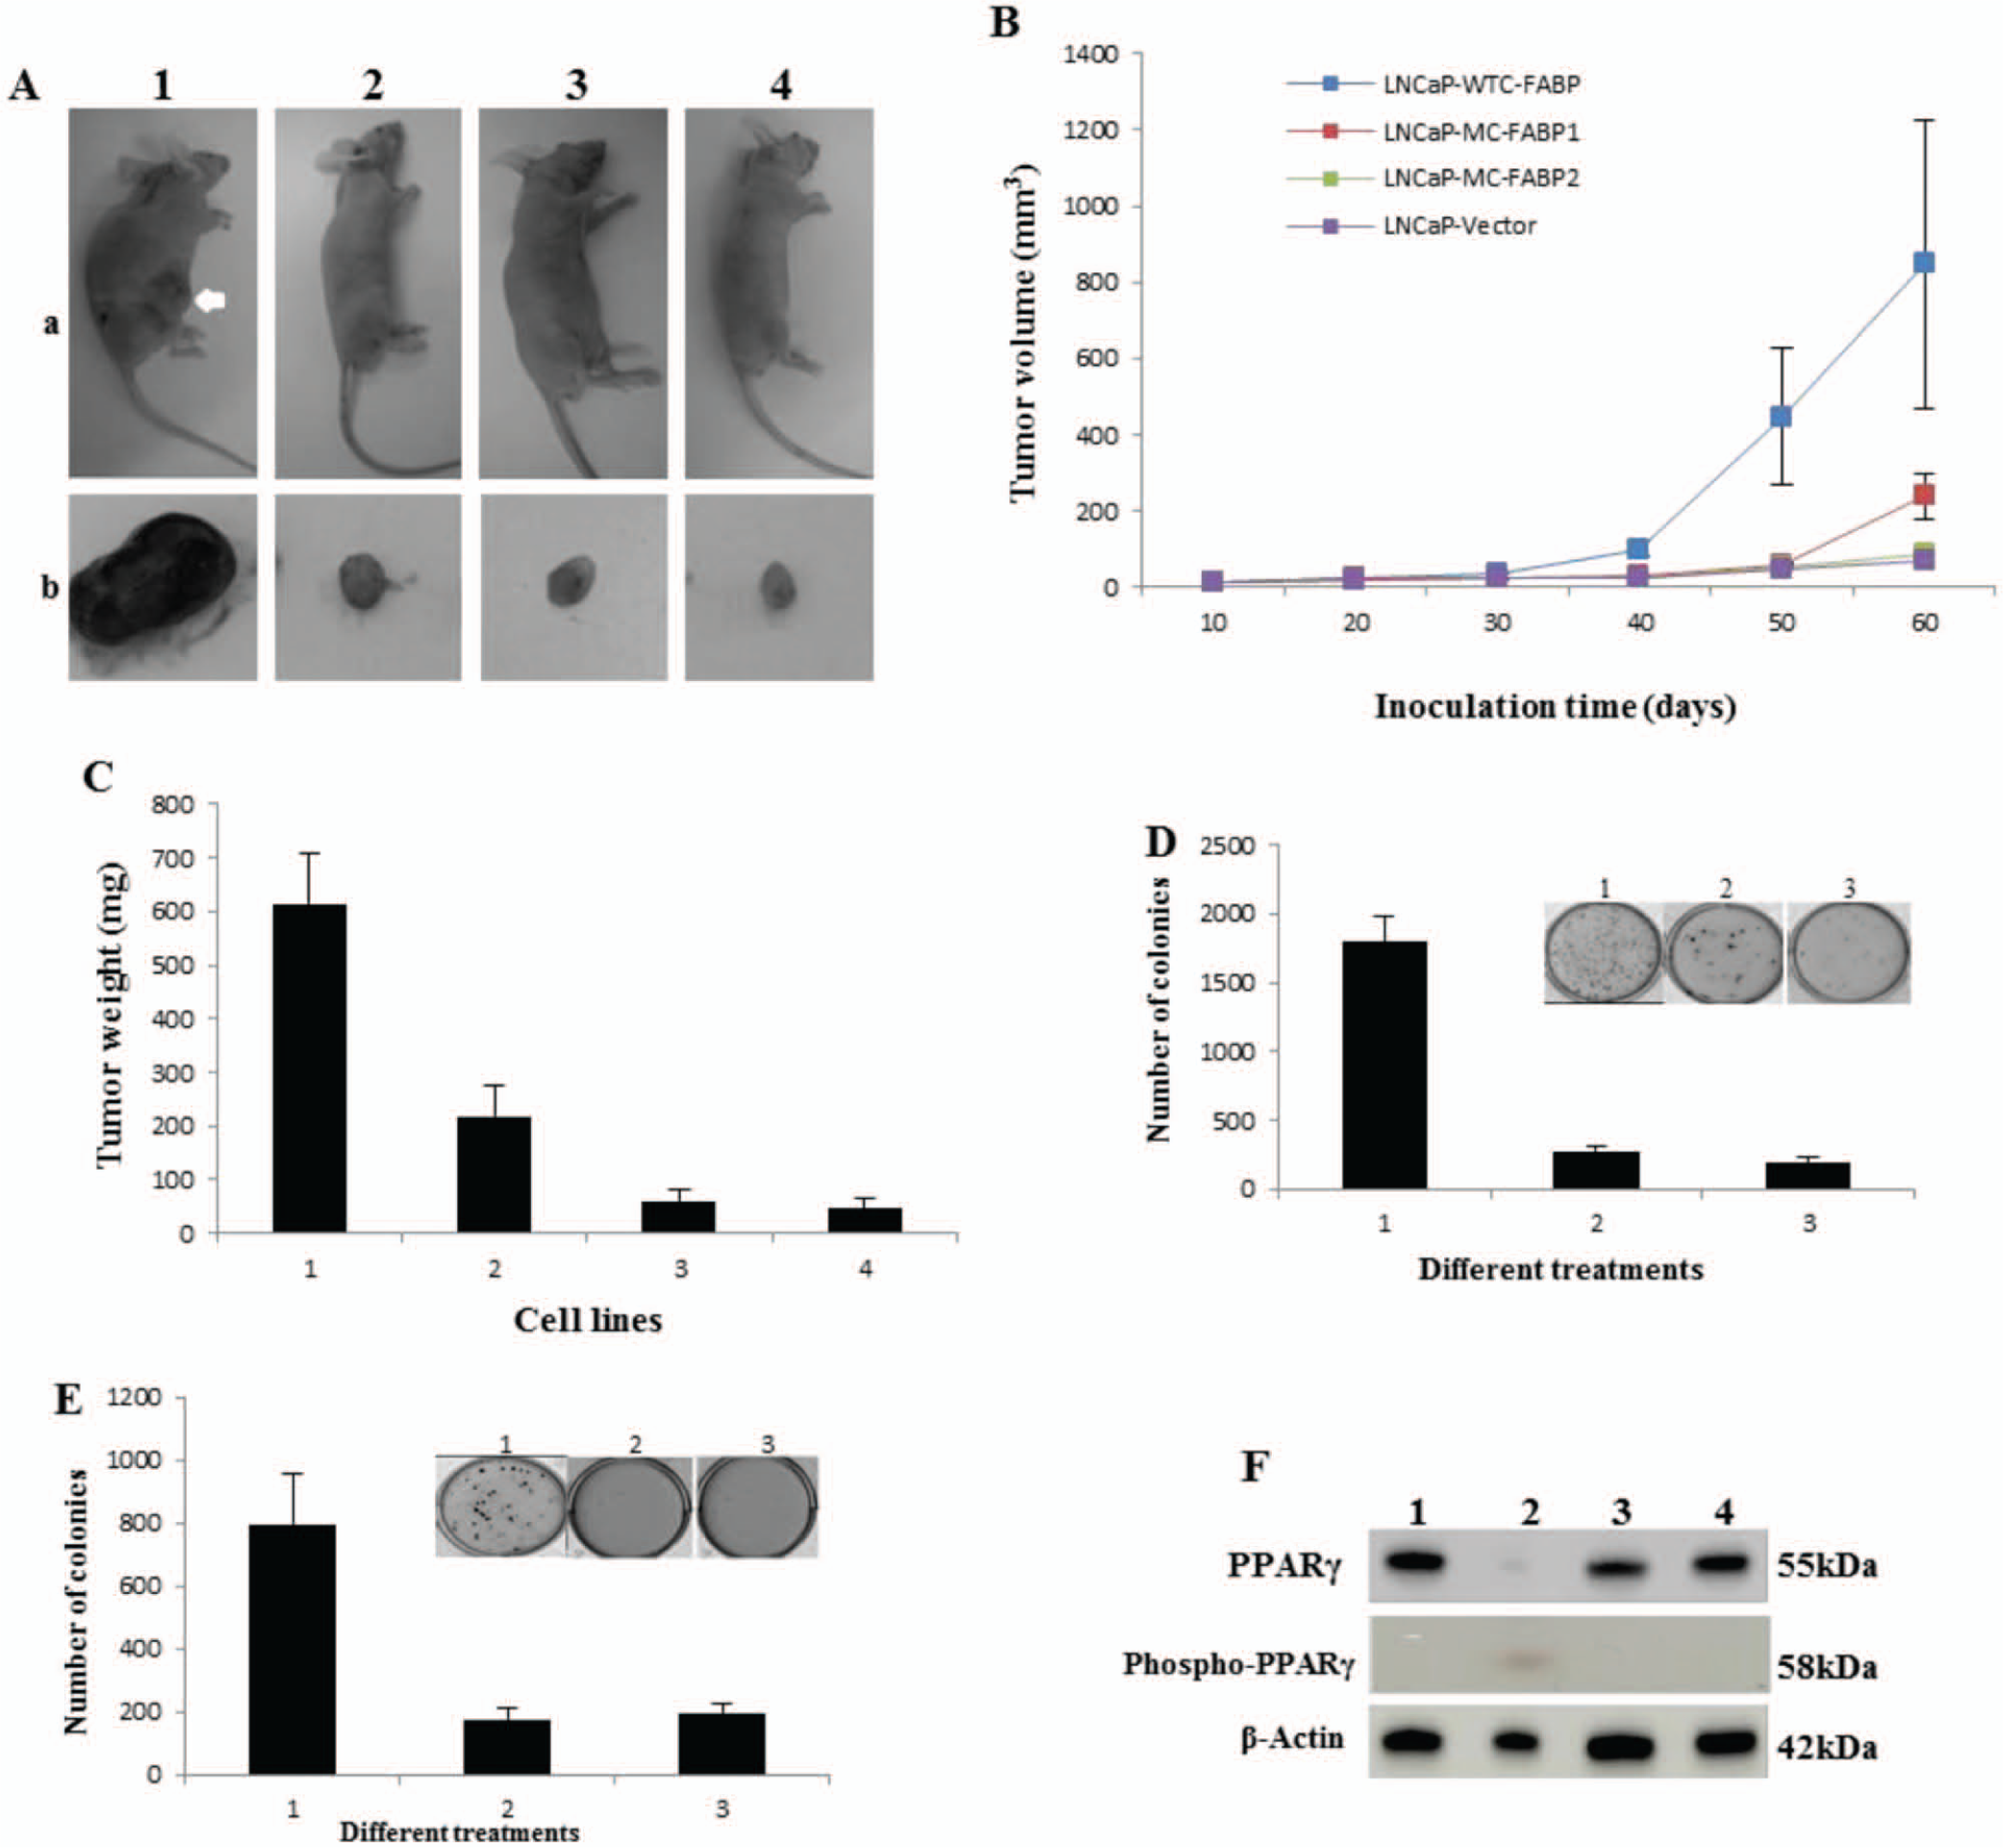
Tumorigenicity of different transfectant cells in nude mice and the effect of the PPARγ inhibitor GW9662. (
The effect of the PPARγ inhibitor GW9662 on tumor-promoting activity of C-FABP was tested in soft agar. While only 200 ± 30 colonies were produced by the control cells, more than 1,800 ± 190 colonies were formed in soft agar when LNCaP cells were stimulated with C-FABP-WT. Interestingly, when the PPARγ inhibitor GW9662 was added with C-FABP-WT, the number of colonies produced was reduced to a similar level to that of the control (Fig. 5D). Similar experiments were performed with LNCaP-WTC-FABP cells. While the number of colonies produced by LNCaP-WTC-FABP cells was 800 ± 160, that produced by LNCaP-vector control cells was less at 200 ± 36. However, when LNCaP-WTC-FABP cells were treated with the PPARγ inhibitor GW9662, the number of colonies produced was greatly reduced to only 180 ± 30 (Fig. 5E). Further analysis on PPARγ expression in different transfectants (Fig. 5F) showed that the level of PPARγ expressed in LNCaP-WTC-FABP cells was reduced by nearly 5-fold when compared with that in LNCaP-vector; but levels in LNCaP-MC-FABP1 and in LNCaP-MC-FABP2 were similar to that in the control. When the antibody against the phosporated PPARγ was used, a band representing biologically active PPARγ was detected only in LNCaP-WTC-FABP, not in any of the other 3 cell lines. This indicated that part of the PPARγ was transferred into the biologically active form as the increase on C-FABP level.
The Effect of C-FABP on Cell Apoptosis and Its Abrogation by PPARγ Inhibitor
The effect of increased C-FABP on cell apoptosis of weakly malignant prostatic cancer cells was investigated in the LNCaP-derived transfectants (Fig. 6A). While the proportion of apoptotic cells in LNCaP-WTC-FABP cells was 3.5 ± 0.3%, those in LNCaP-vector, LNCaP-MC-FABP1, and LNCaP-MC-CFABP2 cells were 7.7 ± 0.8%, 6.1 ± 0.6%, and 7.9 ± 1.1%, respectively, about twice that in LNCaP-WTC-FABP cells. When induced by different doses of camptothecin, the percentage of cells undergoing apoptosis in LNCaP-WTC-FABP cells was increased to 7.9 ± 1.0%; those in the other 3 cell lines were increased up to an average of more than 17%. Interestingly, in GW9662-treated LNCaP-WTC-FABP cells, the apoptotic cell population was increased by addition of camptothecin to a similar level in the other 3 cell lines. In comparison with that in the untreated LNCaP-WTC-FABP cells, the average number of apoptotic cells in GW9662-treated LNCaP-WTC-FABP cells with different doses of camptothecin was significantly (nearly 2-fold) higher (Student’s t-test, P < 0.001), but it was not significantly different from those in the other 3 cell lines (Student’s t-test, P > 0.21).
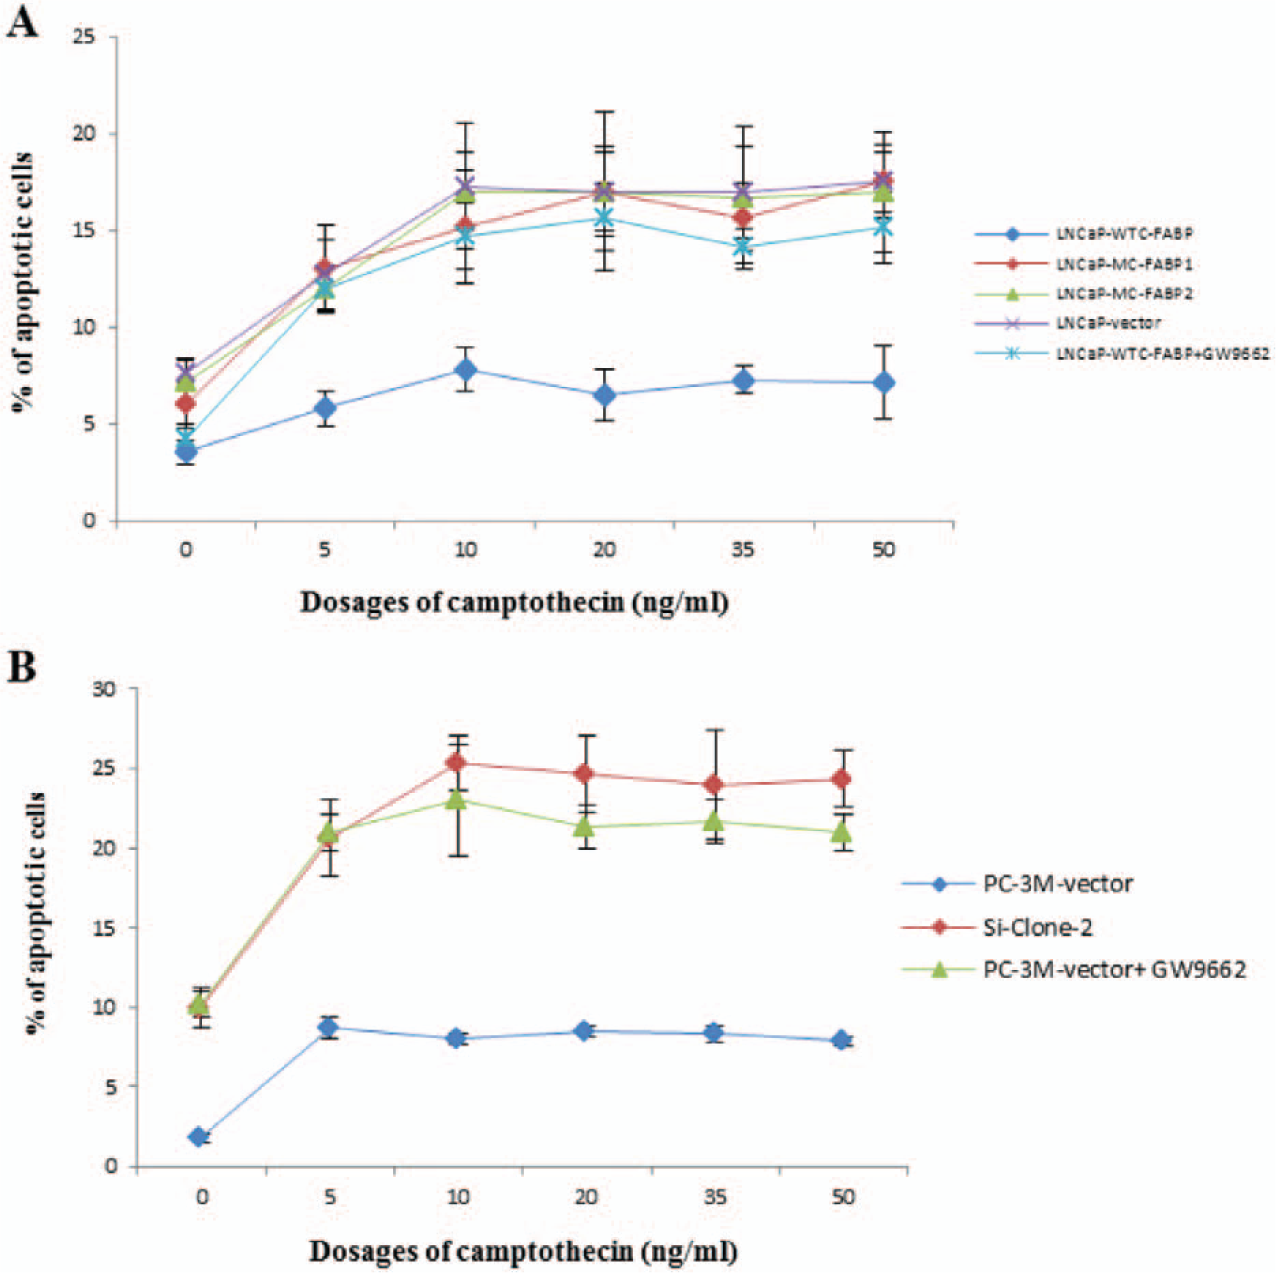
Effect of C-FABP and the PPARγ inhibitor GW9662 on induction of apoptosis in prostatic cancer cells. The surface of cells undergoing apoptosis was stained with antibodies to annexin-V (bound to phosphatidylserine, which translocates from the inner plasma membrane to the cell surface at an early stage of apoptosis) and was measured by flow cytometry of intact cells. The results are the mean ± SD from 3 separate measurements. (
To investigate the effect of suppressing expression of C-FABP on cell apoptosis in the highly malignant prostatic cancer cells, the percentage of cells undergoing apoptosis was compared between the control PC-3M-vector cells and the C-FABP-suppressed cell line, Si-clone 2. This cell line was established by transfecting siRNA against C-FABP into the highly malignant PC-3M cells, which expressed high levels of C-FABP prior to the transfection. 7 For the cultured control PC-3M-vector cells, in which C-FABP was highly expressed, only 1.8 ± 0.2% of the cell population underwent apoptosis (Fig. 6B). In cultured Si-clone 2 cells, in which the expression of C-FABP was suppressed by about 30 times, 10.0 ± 1.1% of the cell population underwent apoptosis. However, when the PPARγ inhibitor GW9662 was added to the culture of control PC-3M-vector cells, the proportion of apoptotic cells was increased to a level (10.1 ± 1%) similar to that of the Si-clone 2 cells. Although treatment with different concentrations of the apoptosis-inducer camptothecin increased the percentages of the apoptotic cells in both the control PC-3M-vector and Si-clone 2 cells, the level of increments was different. The maximum percentage of apoptotic cells (8.8 ± 0.6%) in the control PC-3M-vector cells was achieved at a concentration of 5 µg/mL camptothecin. For the Si-clone 2 cells and the GW9662-treated PC-3M-vector cells, the maximum percentages of apoptotic cells of 25 ± 1.5% and 23 ± 3%, respectively, were achieved at a concentration of 10 µg/mL camptothecin. Although the proportion of apoptotic cells in the control PC-3M-vector cells was more than 3-fold lower than that of the Si-clone 2 cells, this proportion increased to a similar level to that in Si-clone 2 cells when treated with different doses of GW9662. Thus, compared to that in the untreated control PC-3M-vector cells, the average number of apoptotic cells in GW9662-treated PC-3M-vector cells with different concentrations of camptothecin was significantly 2.8-fold higher (Student’s t-test, P < 0.001), but this percentage was not significantly different from that in Si-clone 2 cells (Student’s t-test, P > 0.1).
Effect of Wild Type and Mutant C-FABPs on VEGF and Angiogenesis
Western blots showed that VEGF protein was expressed in all 4 LNCaP-derived cell lines (Fig. 7A). Results of further quantitative analysis of VEGF levels (Fig. 7B) showed that VEGF expression in LNCaP-WTC-FABP was significantly higher compared to the rest of the transfectant cell lines (Student’s t-test, P < 0.05). When the level of VEGF in LNCaP-vector cells was set at 1, the level of VEGF in LNCaP-WTC-FABP was significantly increased by 3.48 ± 0.35 fold. LNCaP-MC-FABP1 exhibited a higher level of VEGF (1.71 ± 0.6) than the control, but the difference was not significant (Student’s t-test P > 0.05). The VEGF level in LNCaP-MC-FABP2 of 0.9 ± 0.15 was not significantly different from that of the LNCaP-vector cells (Student’s t-test P > 0.05). Levels of VEGF secreted into the media by transfectant cells are shown in Figure 7C. The amount of VEGF protein produced by LNCaP-vector cells in 100 µL conditioned medium (96.0 ± 23.7 pg) was almost the same as that produced by LNCaP-MC-FABP2 (93.3 ± 5.2 pg). The amount of VEGF protein produced in the same period by LNCaP-MC-FABP1 of 109.3 ± 31.4 pg was slightly higher than that of LNCaP-MC-FABP2 or LNCaP-vector cells but was not statistically significant (Student’s t-test, P > 0.05). However, the amount of VEGF protein produced by LNCaP-WTC-FABP of 452.7 ± 44.1pg was 4.1, 4.9, and 4.7 times greater than that secreted by LNCaP-MC-FABP1, LNCaP-MC-FABP2, and LNCaP-vector cells, respectively (Student’s t-test, P < 0.05). Moreover, the relative difference of VEGF protein expression in the conditioned medium was greater than that in the cell lysate, but it exhibited a similar pattern (not shown). Immunohistochemical analysis for C-FABP, VEGF, and CD34 on tumors developed in nude mice (Fig. 7D) showed that all 7 (100%) tumors produced by LNCaP-WTC-FABP were positively stained with C-FABP antibody. All tumors from the 3 transfectant cell lines were stained moderately or strongly positive with C-FABP antibody, but tumors produced by LNCaP-vector cells were unstained. When incubated with anti-VEGF antibody, all 7 (100%) tumors produced by LNCaP-WTC-FABP were positively stained. For tumors produced by LNCaP-MC-FABP1 cells, 3 out 4 were stained (75%) weakly positively and 1 was moderately positively stained. For tumors produced by LNCaP-MC-FABP2 and LNCaP-vector cells, all samples (100%) were stained weakly positively. When incubated with an antibody against CD34-related antigen, the greatest number of vessels was seen in tumors produced by LNCaP-WTC-FABP cells. The results on microvessel density are shown in Figure 7E. When the microvessel density per field in tumors produced by LNCaP-vector cells was set at 1, the relative microvessel density in tumors produced by LNCaP-WTC-FABP was significantly (Student’s t-test, P < 0.05) increased by 7.0 ± 1.7 fold. The relative vessel density in tumors produced by LNCaP-MC-FABP1 and LNCaP-MC-FABP2 was also slightly increased by 2.5 ± 1.7 and 2.0 ± 0.9 fold, respectively, but these were not statistically significant when compared to that in tumors produced by LNCaP-vector cells (Student’s t-test, P > 0.05).
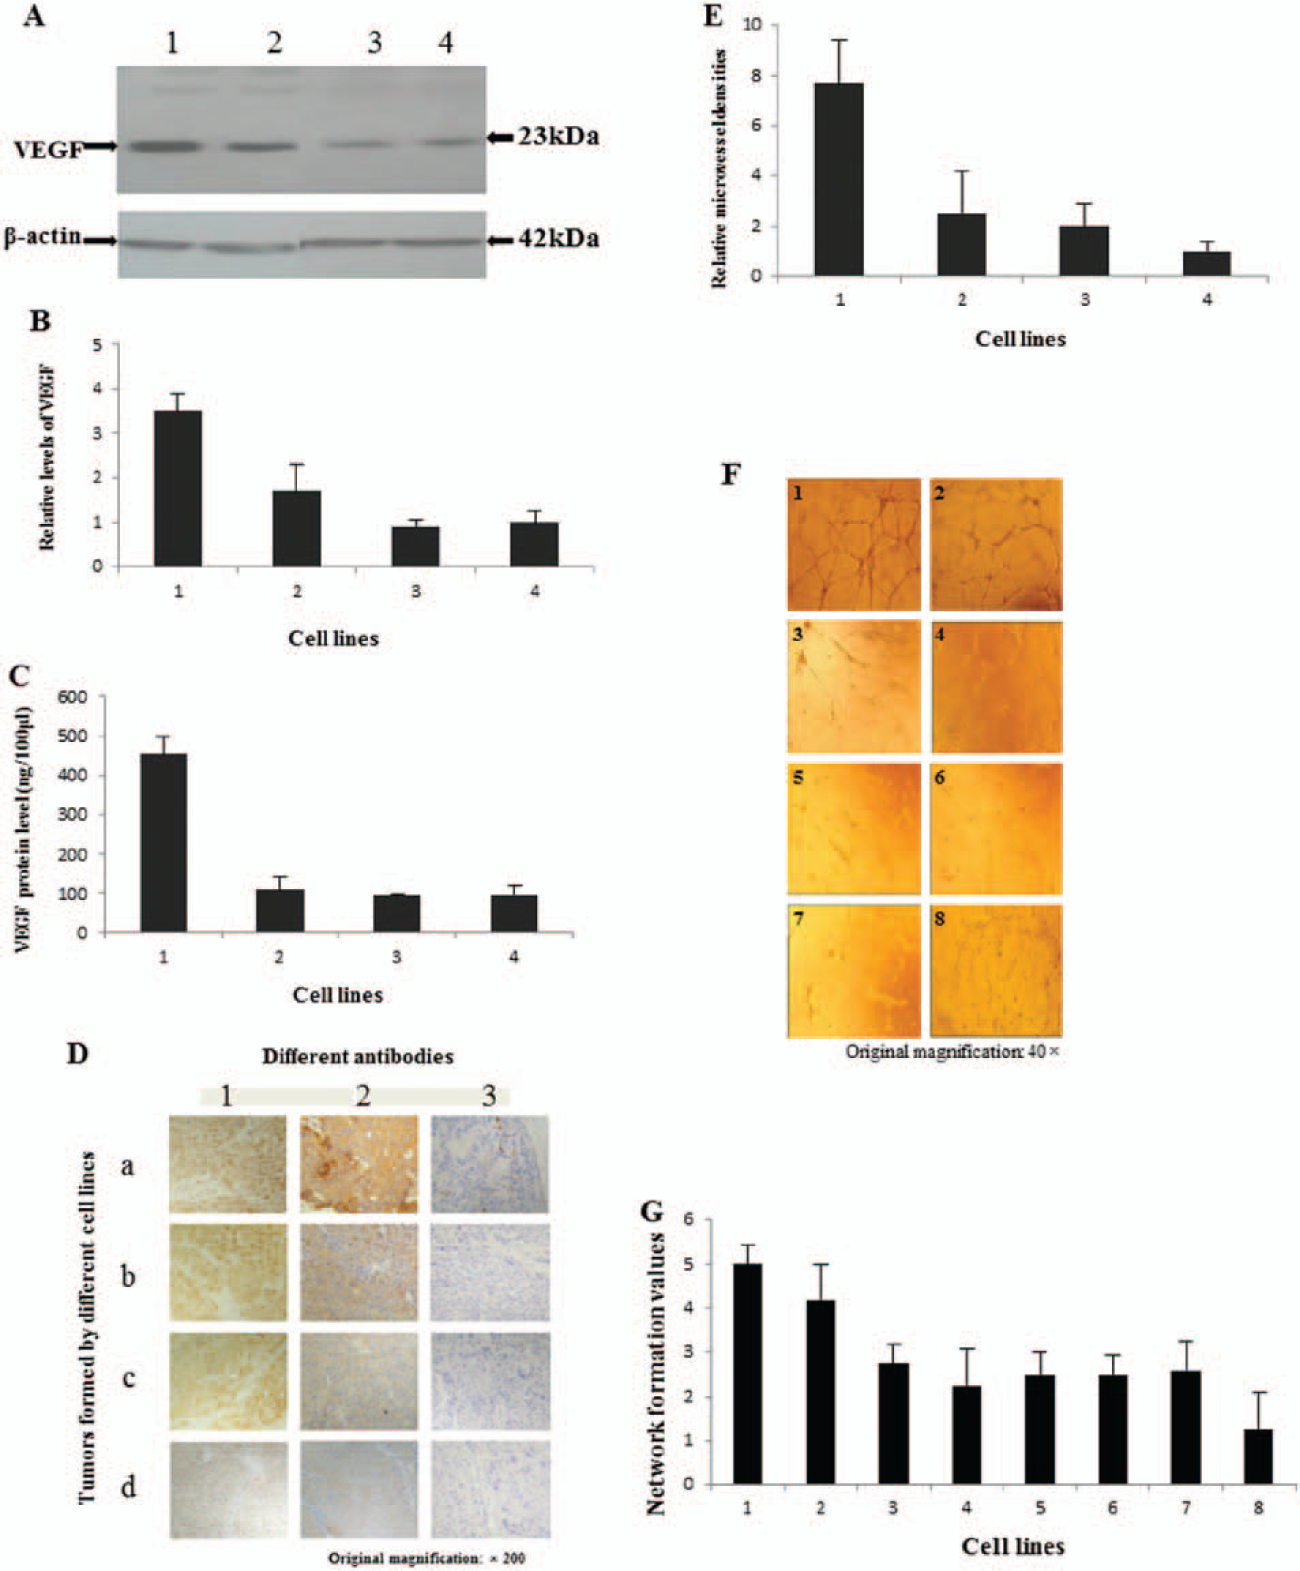
Increased C-FABP expression upregulates VEGF and promotes angiogenesis in prostatic cancer cells. (
Biological activity of VEGF produced and secreted into the media by wild type and mutant C-FABP transfectant cells was measured on HUVEC endothelial cells and shown in Figure 7F and G. For the positive control and LNCaP-WTC-FABP group, the average numerical value associated with the pattern of vessel formation was 5 and 4.2 ± 0.8, respectively. In contrast, the HUVEC cells remained randomly separated without any sign of organization and unable to complete tubule formation when the culture medium alone was applied (negative control). For this negative control, the average numerical value associated with the pattern of tubule formation was 1.25 ± 0.83. The HUVEC cells began to migrate and some of them were able to formed capillary tubules with conditioned medium from LNCaP-MC-FABP1, LNCaP-MC-FABP2, and LNCaP-vector control cells, but no closed polygonal patterns were observed. For LNCaP-MC-FABP1, LNCaP-MC-FABP2, and LNCaP-vector cell lines, the average numerical value associated with the pattern of tubule formation was 2.75 ± 0.44, 2.25 ± 0.83, and 2.5 ± 0.50, respectively. After treatment with conditioned medium from LNCaP-WTC-FABP cells, formation of the HUVEC cell network was significantly increased by 1.5-, 1.9-, 1.7-, and 3.4-fold, respectively, in comparison with that obtained by treatment with media from LNCaP-MC-FABP1 cells, LNCaP-MC-FABP2, LNCaP-vector, and negative control cells (Student’s t-test, P < 0.05). Differences of pattern of HUVEC cells’ tubules either between LNCaP-MC-FABP1 and LNCaP-vector or between LNCaP-MC-FABP2 and LNCaP-vector were not significant (Student’s t-test, P > 0.05). It is interesting to notice that when either anti-VEGF antibody or PPARγ antagonist GW9662 was added to the assay, the angiogenic effect of the conditional medium was almost completely neutralized.
Discussion
In this work, we have investigated the relationship between the tumor-promoting function of C-FABP and its ability to take up fatty acids into cells. We first established different transfectant cell lines expressing wild type and mutant C-FABPs with potentially different abilities to bind to and to transport fatty acids, and then correlated their cellular uptake of fatty acids with their tumor-promoting activity. It was suggested that FABP family proteins, including C-FABP, may bind to fatty acids through a binding motif that consists of 3 key amino acids (Arg109, Arg129, and Tyr131) and this motive is conserved among all proteins in this family.26,27 Although the structural importance of this binding motif to fatty acid–binding function has been observed for some other proteins of this family, 26 direct evidence of the consequence of changing this motif on fatty acid–binding ability of C-FABP has not been previously addressed. To obtain recombinant wild type and 2 mutant proteins in this binding motif, C-FABP cDNAs were cloned into the expression vector pQEs to form 3 constructs that expressed C-FABP-WT, C-FABP-R109, and C-FABP-R109/129A. The reduction in amount of synthesized protein after IPTG induction (Fig. 1B and C) could be due to either the cessation of production inside E coli cells or the degradation of the completely synthesized proteins. After purification, all 3 C-FABPs yielded single bands on Western blots (Fig. 1D).
To find out whether the recombinant proteins produced were biologically active, we tested the fatty acid–binding ability of wild type and mutant C-FABPs and showed that changing 1 amino acid in the motif by site-directed mutagenesis significantly reduced the fatty acid binding ability, and changing 2 amino acids almost completely deprived the fatty acid–binding ability of C-FABP. These results showed that fatty acid–binding ability of C-FABP depends on the structural integrity of the binding motif, confirming results found for other FABP family proteins. 26 Bio-assay results showed that growth on plastic, invasiveness, and growth in soft agar (Fig. 4C) of the weakly tumorigenic LNCaP cells were significantly increased when treated with recombinant C-FABP-WT, but not with either C-FABP-109A or C-FABP109A/129A (Fig. 4A, B, and C). These results showed that recombinant C-FABP can greatly increase the tumorigenicity of the weakly malignant prostatic cancer cells LNCaP, but this ability can be partially or completely abrogated by deprivation of its fatty acid-binding motif.
Cellular fatty acid uptake is a regulated process and is related to the levels of certain FABPs in LNCaP cells. 28 In this work, when the LNCaP-derived transfectant cells were tested for their fatty acid uptake, quantitative assessment (Fig. 3D) showed that increasing wild type C-FABP mRNA expression by 138 times results in an increase in fatty acid uptake of 3.1-fold over the control, whereas either 1 or 2 mutations to the 3 key amino acids in the fatty acid–binding motif of C-FABP caused a reduction in its fatty acid uptake by 72% and 81%, respectively. As observed in the fatty acid–binding abilities of recombinant wild type and mutant C-FABPs, results in these transfectant cells suggested that the ability of C-FABPs produced by these cell lines to bind to and to transport intracellular fatty acids into the cells closely depends on the structural integrity of its fatty acid–binding motif.
Results from bio-assays (Fig. 4D and E) also showed that growth on plastic, invasiveness, and growth in soft agar of the LNCaP-WTC-FABP cells, which expressed a high level of wild type C-FABP and which were capable of taking up a high level of fatty acids, were significantly higher than those of the control cells; there were no significant increases in LNCaP-MC-FABP1 and LNCaP-MC-FABP2 cells. These results confirmed that increased levels of C-FABP produced by the LNCaP cells themselves were able to promote properties associated with tumorigenicity in vitro in cells that did not express C-FABP prior to transfection, and the tumor-promoting activity exerted by C-FABP was closely related to its ability to bind to and to transport fatty acids. In vivo results from the nude mouse assay (Fig. 5A, B, and C) showed that not only did the wild type C-FABP-expressing cells LNCaP-WTC-FABP produce more but also larger tumors than those cells expressing either no C-FABP or mutated C-FABPs, which were much less capable of transporting fatty acids. Thus, the increased uptake of fatty acids we showed played a key role in promotion of tumorigenicity in vivo as well as in vitro. Moreover, our previous work demonstrated that suppressing expression of C-FABP by either antisense mRNA or RNA interference in the highly malignant prostatic cancer cell line PC-3M greatly inhibited its ability to form tumors in nude mice.6,7 Thus, the results of both our current and previous work in nude mice demonstrate clearly that C-FABP can promote malignant progression of prostatic cancer and the work here shows that it probably occurs by increased binding to and transportation of extracellular fatty acids into the cancer cells.
In this work, the effect of PPARγ inhibitor GW9662 on in vitro tumor-promoting activity of C-FABP was tested in the soft agar assay. When either C-FABP-WT was added to or produced within LNCaP cells, addition of PPARγ inhibitor reduced the number of colonies to a similar level to that of the control cells (Fig. 5D and E). These results suggested that the tumor-promoting activity of C-FABP can be blocked by the PPARγ inhibitor GW9662. Furthermore, it was observed that only the increased wild type C-FABP, not the mutant FABPs, stimulated PPARγ into its biologically active form (Fig. 5F). Taken together, these results suggested that the excessive amount of fatty acid signaling molecules transported by C-FABP were delivered to their receptor PPARγ and activated it. The activated PPARγ then triggered a chain of molecular events that lead to an enhanced tumor-promoting property of the cancer cells. This result was partly supported by the recent discovery that greatly enhanced PPARγ expression was found in highly advanced prostatic cancer. 29
One of the possible changes in prostatic cells caused by stimulating PPARγ is the rate of apoptosis, which is an important hallmark of cancer. 30 In this work, the proportion of apoptotic cells in LNCaP-WTC-FABP cells was around 50% of those in LNCaP-MC-FABP1, LNCaP-MC-CFABP2, and LNCaP-vector cells (Fig. 6A), and this 50% reduction was maintained in the presence of the apoptotic-inducing agent camptothecin. However, when LNCaP-WTC-FABP cells were treated with the PPARγ inhibitor plus camptothecin, the apoptotic cell population was increased to a similar level seen in the mutant and vector alone transfectant cell lines. These results suggest that the increased C-FABP expression in weakly prostatic cancer cells promotes tumorigenicity, in part, by reducing the apoptotic cell population or inhibiting sensitivity of cells to apoptotic induction signals, and these effects may be achieved through modulation of PPARγ. These results were confirmed by the use of siRNA to C-FABP in cultured PC-3M-vector control cells, which express high levels of C-FABP (Fig. 6B). Thus, it is possible that the changed C-FABP expression may affect the binding of fatty acids to PPARγ, which may then triggered an as yet unknown mechanism to promote tumorigenicity, in part, by altering the percentages of cells undergoing apoptosis.
Angiogenesis is another important hallmark of cancer cells,30,31 as it promotes endothelial cell proliferation, invasion, and capillary differentiation.32,33 It has been reported that the pathological surrogate for angiogenesis (microvessel density) was correlated with malignancy of prostatic cancer, 34 although more specifically designed original studies are required to establish the prognostic value of the increased levels of VEGF in prostatic cancer. 35 Results in our work showed that increased expression of C-FABP caused upregulation of VEGF, and this upregulation may also be due to increased fatty acid signaling, since it occurred only in wild type transfectants, but not in control and mutant transfectants (Fig. 7A, B, and C). The increased levels of C-FABP were not only accompanied by elevated levels of VEGF but also by increased microvessel densities (Fig. 7D, E, and F). The fact that increased angiogenesis was suppressed by the anti-VEGF antibody (Fig, 7F and G) confirmed that it was VEGF, and no other factors, that was responsible for enhanced angiogenesis. These results demonstrate that increased C-FABP expression can increase tumorigenicity, in part, by promoting angiogenesis through upregulation of VEGF expression, confirming our previous work which demonstrated that suppression of C-FABP expression was able to inhibit the level of VEGF and to reduce angiogenesis.6,7 Our present work combined with results of previous studies suggests that the elevated expression of C-FABP may give rise to an increased total uptake of fatty acids and thereby enhance any possible fatty acid signaling activity. Thus, it may be possible that excessive levels of fatty acids may be transported by C-FABP into the nucleus of the cancer cells to activate PPARγ, which can then upregulate the expression of VEGF.
For a long time, high dietary fatty acids and foods enriched in saturated fats have been positively associated with the risk of prostatic cancer.36,37 The remarkable increase of fatty acid synthesis 38 and the fatty acid transporter C-FABP in highly malignant prostatic cancer cells6,7 clearly indicates that the malignant progression of prostatic cancer cells is closely accompanied by increased fatty acid synthesis and consumption. However, the possible promoting role of fatty acids on tumorigenicity of prostatic and other cancers has not been decisively demonstrated by some epidemiological studies.39,40 In fact, results in some studies on cancer risk factors related to high energy intake, such as obesity and high dietary fatty acids, have been inclusive. Polyunsaturated n-6 fatty acids, especially linoleic acid, which reproducibly enhances tumor incidence and growth in animal models, do not appear to have the same effect in humans. The roles played by different fatty acids in cancer development have been contradictory.39-42 While some of these results may merely reflect the complicated roles the different fatty acids play in promoting tumorigenicity of cancer cells, others may due to methodological shortages in the design of the dietary questionnaire. The discovery of the C-FABP-related signaling pathway in this study suggests that enhanced malignant progression can be caused by increases in cellular fatty acid uptake. Further investigations are required to ascertain exactly which fatty acids that are transported by C-FABP are responsible for signaling malignant progression.
Results from this present work have revealed a novel fatty acid–initiated signaling pathway leading to enhanced malignant progression in prostatic cancer cells. Thus, as illustrated in Figure 8, the elevated expression of C-FABP in prostatic cancer cells may give rise to an increased total uptake of fatty acids. The excessive levels of fatty acids transported by C-FABP to the nucleus of the cancer cells will activate their receptor PPARγ. This receptor can then initiate a chain of molecular events that ultimately lead to upregulation of VEGF and other unknown “cancer-promoting genes,” eventually resulting in malignant progression by enhancing angiogenesis, suppressing apoptosis, and increasing invasion. Further investigations are needed at the molecular level to find out how PPARγ can accomplish these different cellular events.
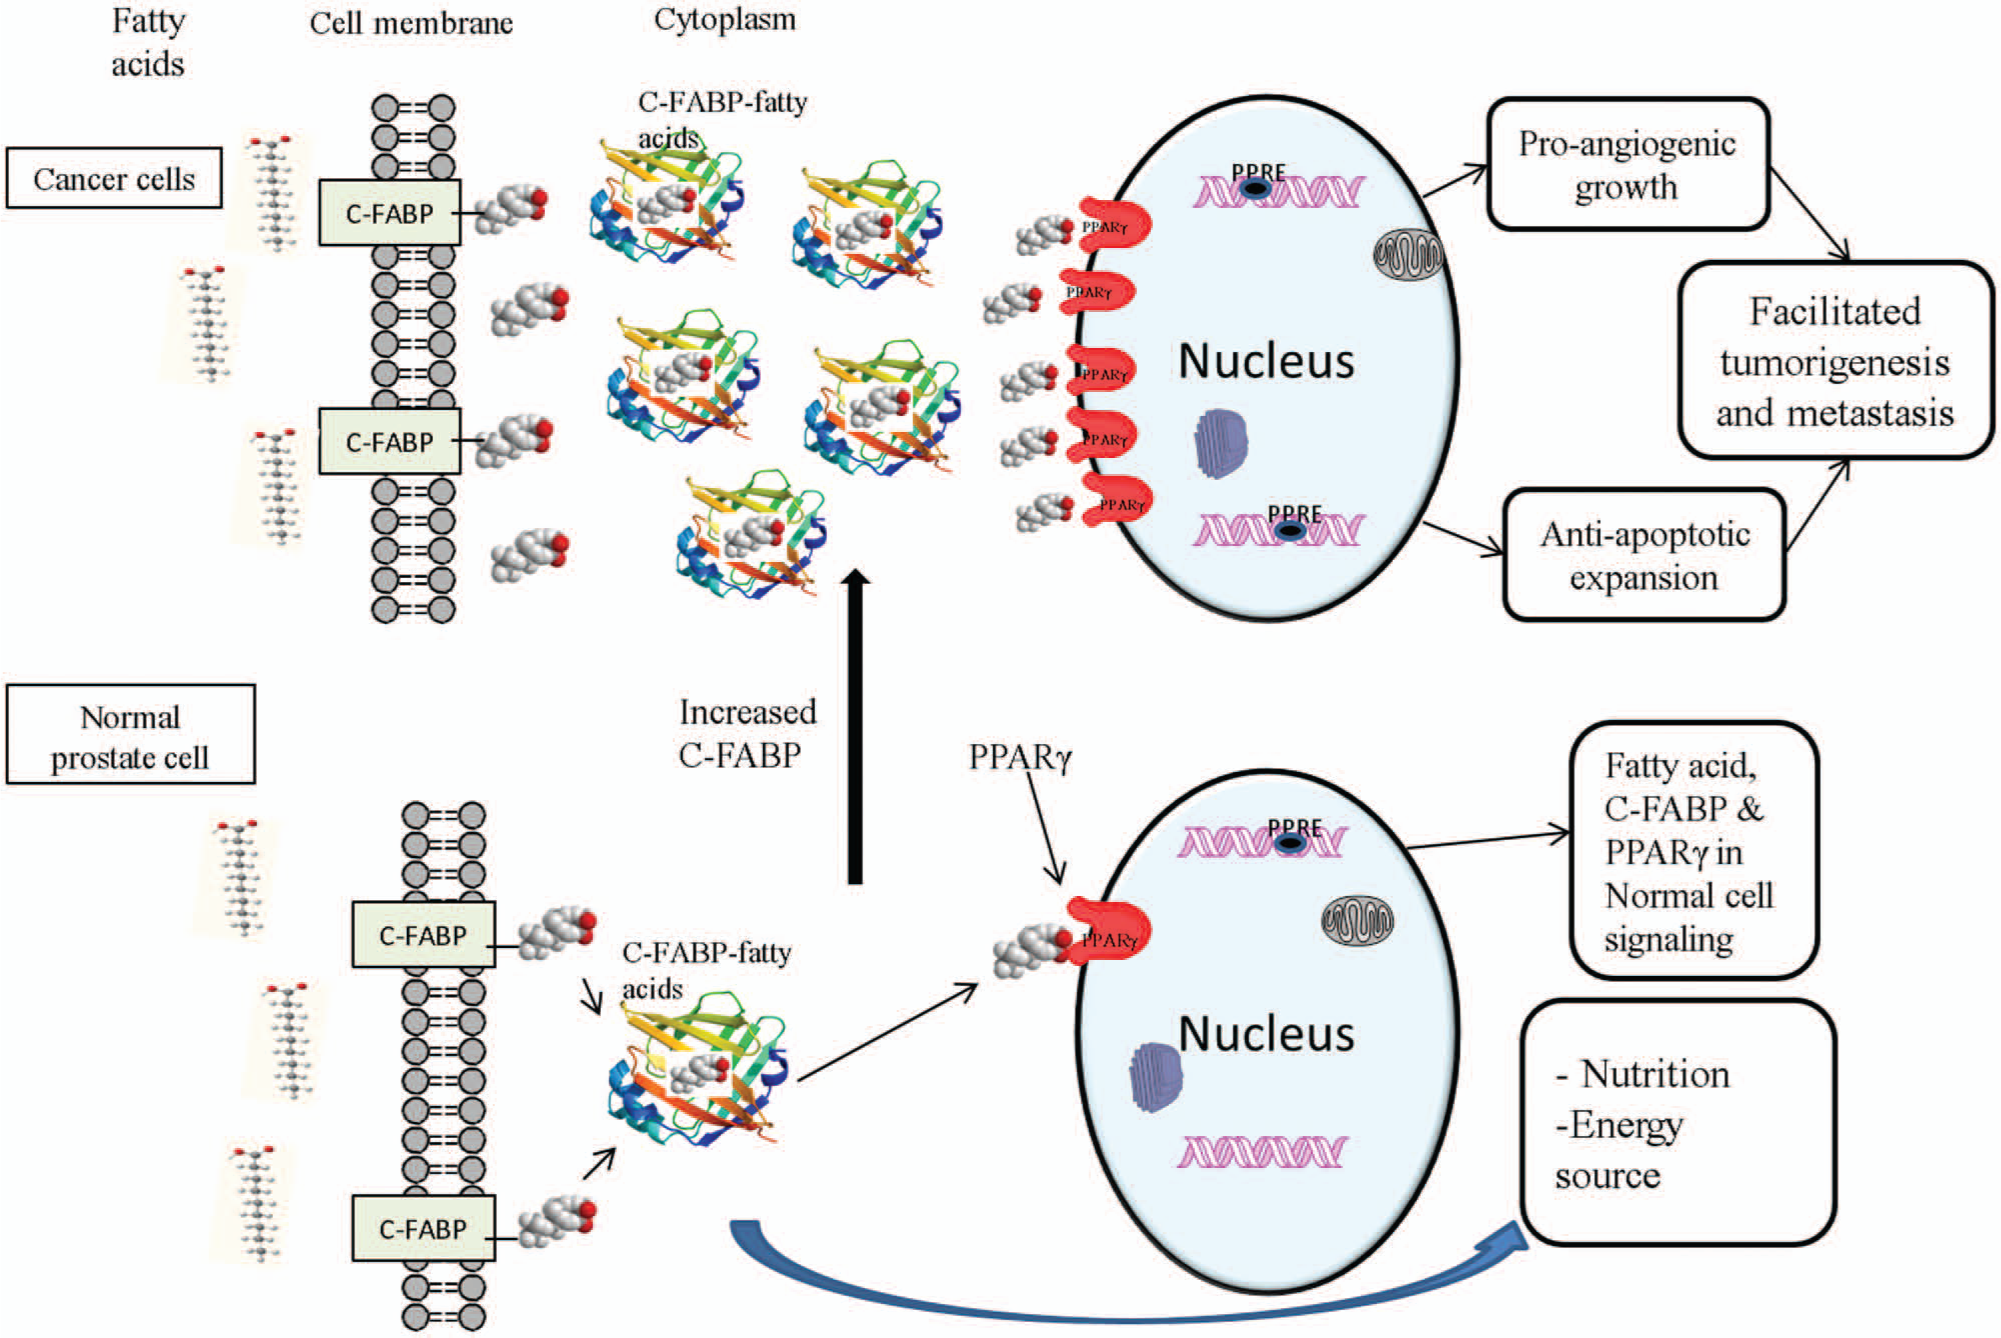
Schematic illustration of a possible C-FABP-related signaling pathway that may lead to malignant progression in prostatic cancer cells. In normal prostatic cells, intracellular fatty acids transported by C-FABP can be used as nutritional sources to generate energy. The balance between the number of cells newly generated and numbers of cells eliminated by programmed cell death is well maintained when the frequency of signals produced by fatty acids is normal. In highly malignant prostatic cancer cells, high levels of C-FABP transport excessive amounts of fatty acids into cells and activate the cognate nuclear receptor, PPARγ. The activated PPARγ may then initiate, through its peroxisome proliferative responsive element (PPRE), a chain of molecular events that leads to enhance anchorage independent growth, reduced apoptosis, enhanced invasion, and neoangiogenesis and ultimately facilitate tumorigenicity and malignant dissemination of the cancer cells.
Materials and Methods
Cell Lines and Culture Conditions
LNCaP, PC-3M, Si-Clone 2, which was established by suppressing C-FABP expression in PC-3M cells, 7 and other transfectant cells were grown in monolayer culture in RPMI-1640 (PAA Labs, Pasching, Austria) supplemented with 10% (v/v) fetal bovine serum (Biosera, UK), L-glutamine (20 mM), penicillin (100 U/ml), and streptomycin (100 U/ml); 5 µg/mL sodium pyruvate was added to LNCaP cells only. All cells were maintained in a humidified incubator (model TC2323, Borolabs, Basingstoke, UK) at 37°C with 5% (v/v) CO2. For transfected cells, geneticin G418 (PAA Labs GmbH) was added to the culture medium at a concentration of 1 mg/mL during and after the selection process.
Generation of Mutations in C-FABP cDNA
Oligonucleotide-directed mutagenesis was employed to introduce mutations into the C-FABP cDNA, using the Transformer Site-Directed Mutagenesis Kit (Clontech, Mountain View, CA) following the manufacturer’s instructions. Two oligonucleotides were synthesized, one contained a single base mutation (the codon for Arg109 was changed to Ala109, or “AGA” to “GCG”) and the other contained double base mutations (codons for Arg109 and Arg129 were changed to those for Ala109 and Ala129, or “AGA” and “CGG” were changed to “GCA” and “GCG”). They were hybridized to templates containing wild type C-FABP cDNA and extended with Taq DNA polymerase to form 2 heteroduplex molecules containing 1 or 2 mismatches. The mutations were then “fixed” on repairing of the mismatches in E. coli cells and isolated by molecular cloning. The fatty acid–binding regions of the wild type C-FABP cDNA, mutant 1 cDNA containing a single mutation, and mutant 2 cDNA containing double mutations were confirmed by DNA sequence analysis. The pBluescript II SK vectors containing wild type, single-mutated, and double-mutated C-FABP cDNA were transformed into DH5α E. coli competent cells for amplification. The plasmid vectors isolated from DH5α cells and the presence of mutations were confirmed again by nucleotide sequence analysis of PCR amplified DNA using specific C-FABP cDNA forward (5′-ACCATGGCCACAGTTCAGCA-3′) and reverse (5′-CCTGTCCAAAGTGATGATGGAA-3′) primers. The construct harboring wild type of C-FABP cDNA was designated as C-FABP-WT. Those containing the single- and double-mutated C-FABP cDNAs were denoted as C-FABP-109A and C-FABP-109/129A, respectively. The wild type and mutant C-FABP cDNAs were cloned into the pIRES2-EGFP vector to form 3 constructs that can express wild and 2 mutant types of C-FABPs. Automatic nucleotide sequence analyses (provided by Cogenics Technolgies, Essex, UK) on insert and plasmid junction regions and the entire C-FABP cDNA were performed again to confirm the correct insertion and the correct mutations in the fatty acid–binding motif.
Establishment of Transfectants
The wild type and 2 mutant types of C-FABP cDNAs were cloned into the pIRES2-EGFP vector (BD Biosciences Clontech) to form 3 constructs harboring wild type cDNA, mutant 1, and mutant 2 cDNAs. These 3 constructs were transfected separately into prostatic cancer cell line LNCaP to form 3 groups of transfectants. The “ring cloning” method was used to separate 5 clones from each transfection. After measuring C-FABP mRNA by real-time PCR and confirming that the levels of expression among the clones were very similar, each of the 5 clones was pooled together to form 1 group of transfectants. In a separate transfection performed with the vector DNA alone, the transfectants were pooled together and used as control. Three transfectant lines established from the transfection were designated, respectively, as LNCaP-WTC-FABP, expressing wild type C-FABP; LNCaP-MC-FABP1, expressing mutant C-FABP with 1 amino acid changed; and LNCaP-MC-FABP2, expressing C-FABP with 2 amino acids changed. The control transfectants were designated LNCaP-vector.
Production and Purification of Wild Type and Mutant Recombinant C-FABPs
N-Terminus pQE 30 series vectors (Qiagen, Crawley, UK), which provide multiple cloning sites for all 3 reading frames, were used to express a high level of N-terminally 6×His-tagged recombinant C-FABPs in DH5α E. coli cells. To generate complimentary restriction sites at both ends of the inserts, the C-FABP-cDNAs were first excised from pIRES2-EGFP with restriction enzymes XhoI and PstI and inserted into cloning vector pBluescript, which contains the multiple restriction sites KpnI and PstI. The C-FABP cDNAs were then excised from the pBluescript vector with KpnI and PstI and inserted into the expression vector pQEs to form 3 constructs that expressed C-FABP-WT, C-FABP-R109, and C-FABP-R109/129A. After these constructs were transformed into DH5α E. coli cells to form 3 separate bacterial pools, expression of wild type and mutant C-FABPs were induced by adding 1 mM of IPTG. Samples of bacteria harboring each plasmid were collected at different times of incubation to identify the optimal time point at which the maximum amount of protein was produced. These 6×His-tagged recombinant C-FABPs produced in E. coli cells were purified by gravity-flow chromatography on a Ni-NTA agarose column (Qiagen, Crawley, UK). After extensive washing with a denaturing buffer (pH 6.5), bound 6×His-tagged proteins were eluted with denaturing elution buffer (pH 4.5) and 2 elution fractions were collected in separate tubes. Proteins in the first and second elution fractions were analyzed by SDS-PAGE (followed by Coomassie Blue staining) and Western blot. A monoclonal anti-β-actin (Sigma, St. Louis, MO) antibody was used to correct for possible loading errors in all Western blot analyses.
In Vitro Assays
Cell growth assay
The assay was performed in 96-well culture plates in triplicate. The number of cells at the start of the assay in each single well was 5,000. The procedures for this assay were the same as those described previously. 6
Invasion assay
The invasiveness of different transfectants was measured in a Boyden chamber 43 with some modifications. 44 The assay was performed in a transwell plate (BD Biosciences) with a polycarbonate membrane coated with Matrigel (BD Biosciences). Cells (2 × 10⁴) were seeded onto the upper compartment filled with 100 µL routine culture medium with 2% (v/v) FCS. The lower compartment was filled with 500 µL routine medium with 10% (v/v) FCS. The invasive cells that crossed the membrane in a 24-hour period were fixed, stained with a Crystal Violet Reagent (Sigma), and counted under a light microscope.
Soft agar colony-formation assay
Soft agar assay was performed to test the anchorage-independent growth of cells as an indication of their tumorigenicity in vitro. The protocol used was very similar to those used previously.7,45,46
Fatty acid binding assay
The fatty acid dissociation constant of 3 recombinant C-FABP proteins was determined by measuring the changes in fluorescence by increasing concentrations of the fluorescent fatty acid analogue 11-(dansylamino) undecanoic acid (DAUDA). 47 The excitation wavelength used was 345 nm. Fluorescence data were subtracted from the blank values (sample without proteins) and fitted by standard nonlinear regression techniques (ORIGIN software version 6.1, Origin Lab Corporation, Cambridge, MA) to a single noncompetitive binding model to estimate the apparent dissociation constant (Kd) and maximum fluorescence intensity (Fmax). Competitive experiments were designed to reveal a possible difference in affinity of the 3 C-FABPs for various natural fatty acids and myristic, palmitic, oleic, and linoleic acids to displace DAUDA. Binding of 2 µM DAUDA to 2 µM proteins was performed in the presence or absence of 2 µM of each fatty acid.
Fatty acid uptake assay
Fluorescently-labeled 0.25 µL 4,4-difluoro-5-(2-thienyl)-4-bora-3a,4a-diaza-s-indacene-3-dodecanoic acid (BODIPY 558/568C12) (Invitrogen, Carlsbad, CA) was added to the cultured cells (1 × 10⁶ cells) seeded in routine medium (2 mL/well) in a 6-well plate and incubated at 37°C for 10 hours. After replacing the medium with a solution containing 25 µg BODIPY fatty acid in 200 µL BSA/PBS, the cells were incubated again for 30 minutes at 37°C. The fatty acid uptake was stopped by removal of the BODIPY fatty acid solution followed by addition of 3 mL of an ice-cold stop solution (PBS containing 0.5% [w/v] BSA). The stop solution was removed after 2 minutes, and the culture plates were washed 3 times more with fresh ice-cold stop solution. The cells were detached using 2.5% (v/v) trypsin/versene at 4°C and the fluorescent intensity of each cell line was measured with an EPICS XL Cytometer (Beckman Coulter, Miami, FL) at 570 nm. The fluorescence intensity from cells before and 30 minutes after adding labeled BODIPY to each cell line was measured to assess fatty acid uptake.
Measurement of apoptotic cells
Cells growing in culture medium were treated (or not treated) with different concentrations of camptothecin to induce apoptosis. Those cells undergoing apoptosis were stained by annexin-V (combined to phophatidylserine, which translocates from the inner plasma membrane to the cell surface at an early stage of apoptosis) and measured by flow cytometry. The rate of apoptosis was expressed as the percentage of cells undergoing apoptosis in culture.
Nude Mouse Assay
In vivo tumorigenicity of transfectant lines was explored using male Balb/c immuno-incompetent nude mice (4-6 weeks old). The experiments were carried out using 4 groups of mice (8 animals in each group) to assess the level of tumorigenicity of LNCaP-derived transfectants generated with cDNAs for wild type C-FABP, 2 mutant C-FABPs, and the pIRES2-EGFP vector only. The cells for the in vivo tumorigenic assay were grown up to ~80% confluence in 175 cm2 flasks and detached with trypsin/versin solution. Cells were then centrifuged at 900 rpm for 3 minutes and resuspended in PBS at a concentration of 1 × 10⁷/mL. The cell suspension was mixed with Matrigel in a ratio of 1:1 and kept on ice during transport to the animal unit. Cells were inoculated subcutaneously into the right flank of the nude mice at 2 × 10⁶ in 200 µL PBS/Matrigel (1:1) mixture using a 1-mL syringe. Tumor size was obtained by measuring 3 diameters at right angles every 3 days, and tumor volume was calculated by the following formula: length × width × height × 0.523648; the tumor mass was taken as the weight at autopsy. Tumors were fixed in formaldehyde and processed for histological examination and for immunohistochemical staining. All animal work was conducted in accordance with UKCCCR guidelines under Home Office Project License PPL40/2963 to Professor Y. Ke.
Human VEGF ELISA
Quantitative measurements of human VEGF protein in LNCaP transfectants were performed using the human VEGF ELISA kit (RayBiotech, Norcross, GA), following the manufacturer’s instructions. This ELISA assay employed an antibody specific for human VEGF coated on a 96-well plate. After standards and samples were pipetted into the wells and VEGF was bound to the wells by the immobilized antibody, the wells were washed and incubated with biotinylated anti-human VEGF antibody. After washing away unbound biotinylated antibody, HRP-conjugated streptavidin was added to bind to the secondary antibody. Then, 3,3′,5,5′-tetramethylbenzidine was pipetted into the wells; the color develops in proportion to the amount of VEGF bound. The level of VEGF protein secreted in the conditioned medium for each cell line was quantified using a standard curve to obtain the concentration of VEGF (pg/mL).
Immunohistochemical Staining of Tumor Tissues
Tumor tissues fixed in formalin were embedded in paraffin wax and histological sections (4 µm) were cut and mounted on to slides as described previously. 49 The tissue sections were incubated at 37°C overnight prior to staining with hematoxylin and eosin using an automated Varistain 24-4 machine (Thermo Scientific, Waltham, MA). Immunohistochemical staining for detection of C-FABP (Hycult Biothech, Uden, the Netherlands), VEGF (LEICA, Wetzlar, Germany), and CD-34 (DAKO, Glostrup, Denmark) was performed in a similar way to that described previously. 50 Slides were incubated with anti-human C-FABP, anti-VEGF, and anti-CD34 at dilutions of 1:500, 1:40, 1:50, respectively. Bound antibodies were detected by 30-minute incubation with horseradish labeled peroxidase polymer using an Envision System kit (Dakocytomation, Ely, UK) and visualized by a 10-minute exposure to 100 µL of 3,3′-diaminobenzidine (DAB). The slides were counterstained blue with hematoxylin solution and mounted on cover slips with DPX synthetic resin. The staining results were classified according to both the intensities of staining and the percentages of cells stained, as described previously. 51 The cases were classified into negative or unstained (−) and positively stained. The latter was further divided into weakly (+), moderately (++), and strongly (+++) positive. The microvessel density was expressed as the average microvessel number of 10 random fields counted at 40× magnification.
In Vitro Angiogenesis Assay
Biological activity of VEGF in conditioned medium from each tansfectant was assayed using the Millipore in vitro angiogenesis assay kit, which provided a time-saving method for evaluation of tubule formation by endothelial cells. When cultured on an EC Matrix, a solid gel of basement membrane proteins prepared from the Engelbreth-Holm-Swarm (EHS) mouse tumor cells, these endothelial cells could achieve fully developed tubular structures between 4 and 8 hours after adding pro-angiogenic factors to the medium. EC Matrix was thawed on ice overnight prior to the in vitro angiogenesis assay and then mixed with 10× dilution buffer in a sterile microfuge tube. The diluted EC Matrix (50 µL) was transferred to each well of a 96-well tissue culture plate. The EC Matrix-coated plate was incubated at 37°C for 2 hours to allow the matrix solution to solidify. Human umbilical vein cells (HUVEC) grown to 60% to 80% confluence were harvested and resuspended in EndoGRO basal medium containing 5% charcoal-stripped FCS (v/v). Then, 100 µL of 1 × 10⁴ HUVEC were seeded onto the surface of the polymerized ECMatrix of each well followed by addition of 100 µL of conditioned medium from each transfected cell line. The assay plate was incubated at 37°C, in 5% CO2 (v/v), for 6 hours. Cell tubules were visualized by adding 50 µL of crystal violet at room temperature for 10 minutes and quantified using a light microscope at 40× magnification. Measurement of tubule formation was achieved using the pattern recognition quantitation method. A numerical value for each pattern was allocated as 0 to 5 (0, individual cells; 1, cells begin to migrate and align; 2, capillary tubule visible, no sprouting; 3, sprouting of new capillary tubules; 4, closed polygons begin to form; 5, complex mesh-like structures develop). Five random fields of view per well were examined and the values averaged.
Statistic Methods
Student’s t-test was used to compare any differences observed between each experimental group and the control group. All Student’s t-tests were calculated by an online calculator (http://www.graphpad.com/quickcalcs/ttest1.cfm), and P-value less than 0.05 was defined as statistically significant.
Footnotes
Acknowledgements
We would like to thank Mrs. C. Beesley, Mr. T. Dickinson, and Mrs. P. Gerard for their excellent assistance.
Declaration of Conflicting Interests
The author(s) declared no potential conflicts of interest with respect to the research, authorship, and/or publication of this article.
Funding
The author(s) disclosed receipt of the following financial support for the research, authorship, and/or publication of this article: This work was supported by several research project grants (to Y. Ke) from North West Cancer Research Fund (CR787, CR901) and small part of consumable costs was met by a grant from Prostate Cancer UK (G2008/03).