
Abstract
Maspin is an epithelial-specific tumor suppressor gene. Previous data suggest that maspin expression may redirect poorly differentiated tumor cells to better differentiated phenotypes. Further, maspin is the first and only endogenous polypeptide inhibitor of histone deacetylase 1 (HDAC1) identified thus far. In the current study, to address what central program of tumor cell redifferentiation is regulated by maspin and how tumor microenvironments further define the effects of maspin, we conducted a systematic and extensive comparison of prostate tumor cells grown in 2-dimensional culture, in 3-dimensional collagen I culture, and as in vivo bone tumors. We showed that maspin was sufficient to drive prostate tumor cells through a spectrum of temporally and spatially polarized cellular processes of redifferentiation, a reversal of epithelial-to-mesenchymal transition (EMT). Genes commonly regulated by maspin were a small subset of HDAC target genes that are closely associated with epithelial differentiation and TGFβ signaling. These results suggest that a specific endogenous HDAC inhibitor may regulate one functionally related subset of HDAC target genes, although additional maspin-induced changes of gene expression may result from tumor interaction with its specific microenvironments. Currently, EMT is recognized as a critical step in tumor progression. To this end, our current study uncovered a link between maspin and a specific mechanism of prostate epithelial differentiation that can reverse EMT.
Introduction
Since the first evidence in 1994 that maspin acts as a tumor suppressor gene, 1 close to 500 articles published to date have led to the following consensus. Maspin expression is restricted to epithelial tissues. 1 In tumor progression, maspin expression is associated with a better differentiated phenotype and better prognosis 2 but is down-regulated, with a few exceptions,3,4 at the step of tumor invasion and metastasis.5-7 The differential expression of maspin in tumor progression may be mediated by, but not limited to, p53, AP1, Ets, and IKK-α.8-13 In addition, in reproductive organs such as the breast and prostate, maspin expression may also be regulated by hormone receptors.14-17
Maspin belongs to clade B of the serine protease inhibitor (serpin) superfamily and is also known as SerpinB5. Maspin knockout in mice is embryonically lethal, 18 demonstrating a critical biological function that cannot be compensated or substituted by other members of the same family. Phylogenetic analysis further suggests that the sequence of maspin is one of the most evolutionarily conserved. 19 Interestingly, several unique features of maspin deviate significantly from the structure of a typical inhibitory serpin, which would predict that maspin cannot directly inhibit a serine protease target.20-23 Several candidate maspin targets have been identified under various experimental conditions, including histone deacetylase 1 (HDAC1), 24 pro-urokinase type plasminogen activator (pro-uPA), 25 and single-chain tissue-type plasminogen activator (sc-tPA). 26 In addition, interferon regulatory factor 6 (IRF6), 27 β1-integrin,28-30 collagen I, 31 and glutathione S-transferase (GST) 32 were identified as maspin-associated proteins. It is noted that pro-uPA, HDAC1, and sc-tPA share a common feature, an uncommitted protease-like domain. 33 Therefore, maspin is likely to act as a serpin-like inhibitor of serine protease–like targets, and this biochemical property may be fine-tuned by its associated proteins in different molecular and cellular contexts.
Maspin is correlated with better differentiated phenotypes in human cancer specimens.5-7 Consistently, expression of recombinant maspin or down-regulation of endogenous maspin in established cancer cell lines demonstrated a link between maspin and epithelial differentiation, albeit to various extents. The most reproducible biological activities of maspin in experimental models of tumor progression include the inhibition of tumor cell motility, invasion, and metastasis.34,35 Maspin has also been shown to sensitize tumor cells to drug-induced apoptosis 36 and is correlated with better drug response. 37 The most striking evidence that maspin leads to prostate carcinoma cell redifferentiation in vivo came from the study of Cher et al. 38 in which maspin-transfected cells formed glandular acini in the human bone microenvironment. Together, these data suggest that the loss of maspin, at the step of tumor invasion and metastasis, may be a prerequisite for epithelial-to-mesenchymal transition (EMT).39-41 It is intriguing to hypothesize that re-expression of maspin in certain tissue microenvironments may render invasive and metastatic tumors dormant. Indeed, a study of metastatic breast cancer specimens showed that maspin is re-expressed in a fraction of cancer cells that have been reverted to better differentiated phenotypes. 42
The various biological activities of maspin may each represent a different aspect of its role in the maintenance or restoration of epithelial differentiation. To test this possibility, we established a collagen I 3-dimensional (3-D) culture model to better recapitulate the full spectrum of the biological activity of maspin under controllable experimental conditions. By comparing this model with the cells grown in monolayer cell culture (2-dimensional [2-D]) and as in vivo tumors, we identified common maspin-mediated epigenetic changes that provide novel insights into how maspin reprograms carcinoma cells for redifferentiation under various tissue microenvironments.
Results
Maspin induces epithelial differentiation of DU145 cells in vivo and in collagen type I
Maspin expression is down-regulated, to various extents, in prostate cancer cell lines DU145, LNCaP, and PC3. Maspin was also down-regulated in human prostate cancer bone metastasis and in the prostate cancer cell lines LNCaP C4-2B and LuCaP 23.1, which are both shown to form intraosseous tumors in xenograft mouse models (Suppl. Fig. S1).43,44 The DU145 cell line, which expresses negligible amounts of endogenous maspin, was stably transfected for maspin overexpression. 45 Earlier, we showed that in vivo growth of maspin-transfected DU145 cells (M clones M3, M7, and M10) was inhibited in the SCID-Hu mouse model for prostate cancer bone metastasis. 38 In addition, 9 weeks after implantation, the maspin-transfected cells formed acini-like structures. We further characterized the bone tumors derived from the M clones and mock-transfected cells (Neo). As shown in Figure 1A, bone tumor of the M7 clone featured E-cadherin in epithelial acini with polarized positive staining, whereas bone tumor of Neo cells expressed E-cadherin uniformly throughout the tumor mass. The M clones were associated with decreased cell proliferation and increased apoptosis, as shown by the representative Ki67 staining and TUNEL staining, respectively. As compared to the bone tumors of Neo cells, which formed lung metastasis in 40% of the mice, none of the bone tumors generated by the M clones gave rise to lung metastasis (H&E).
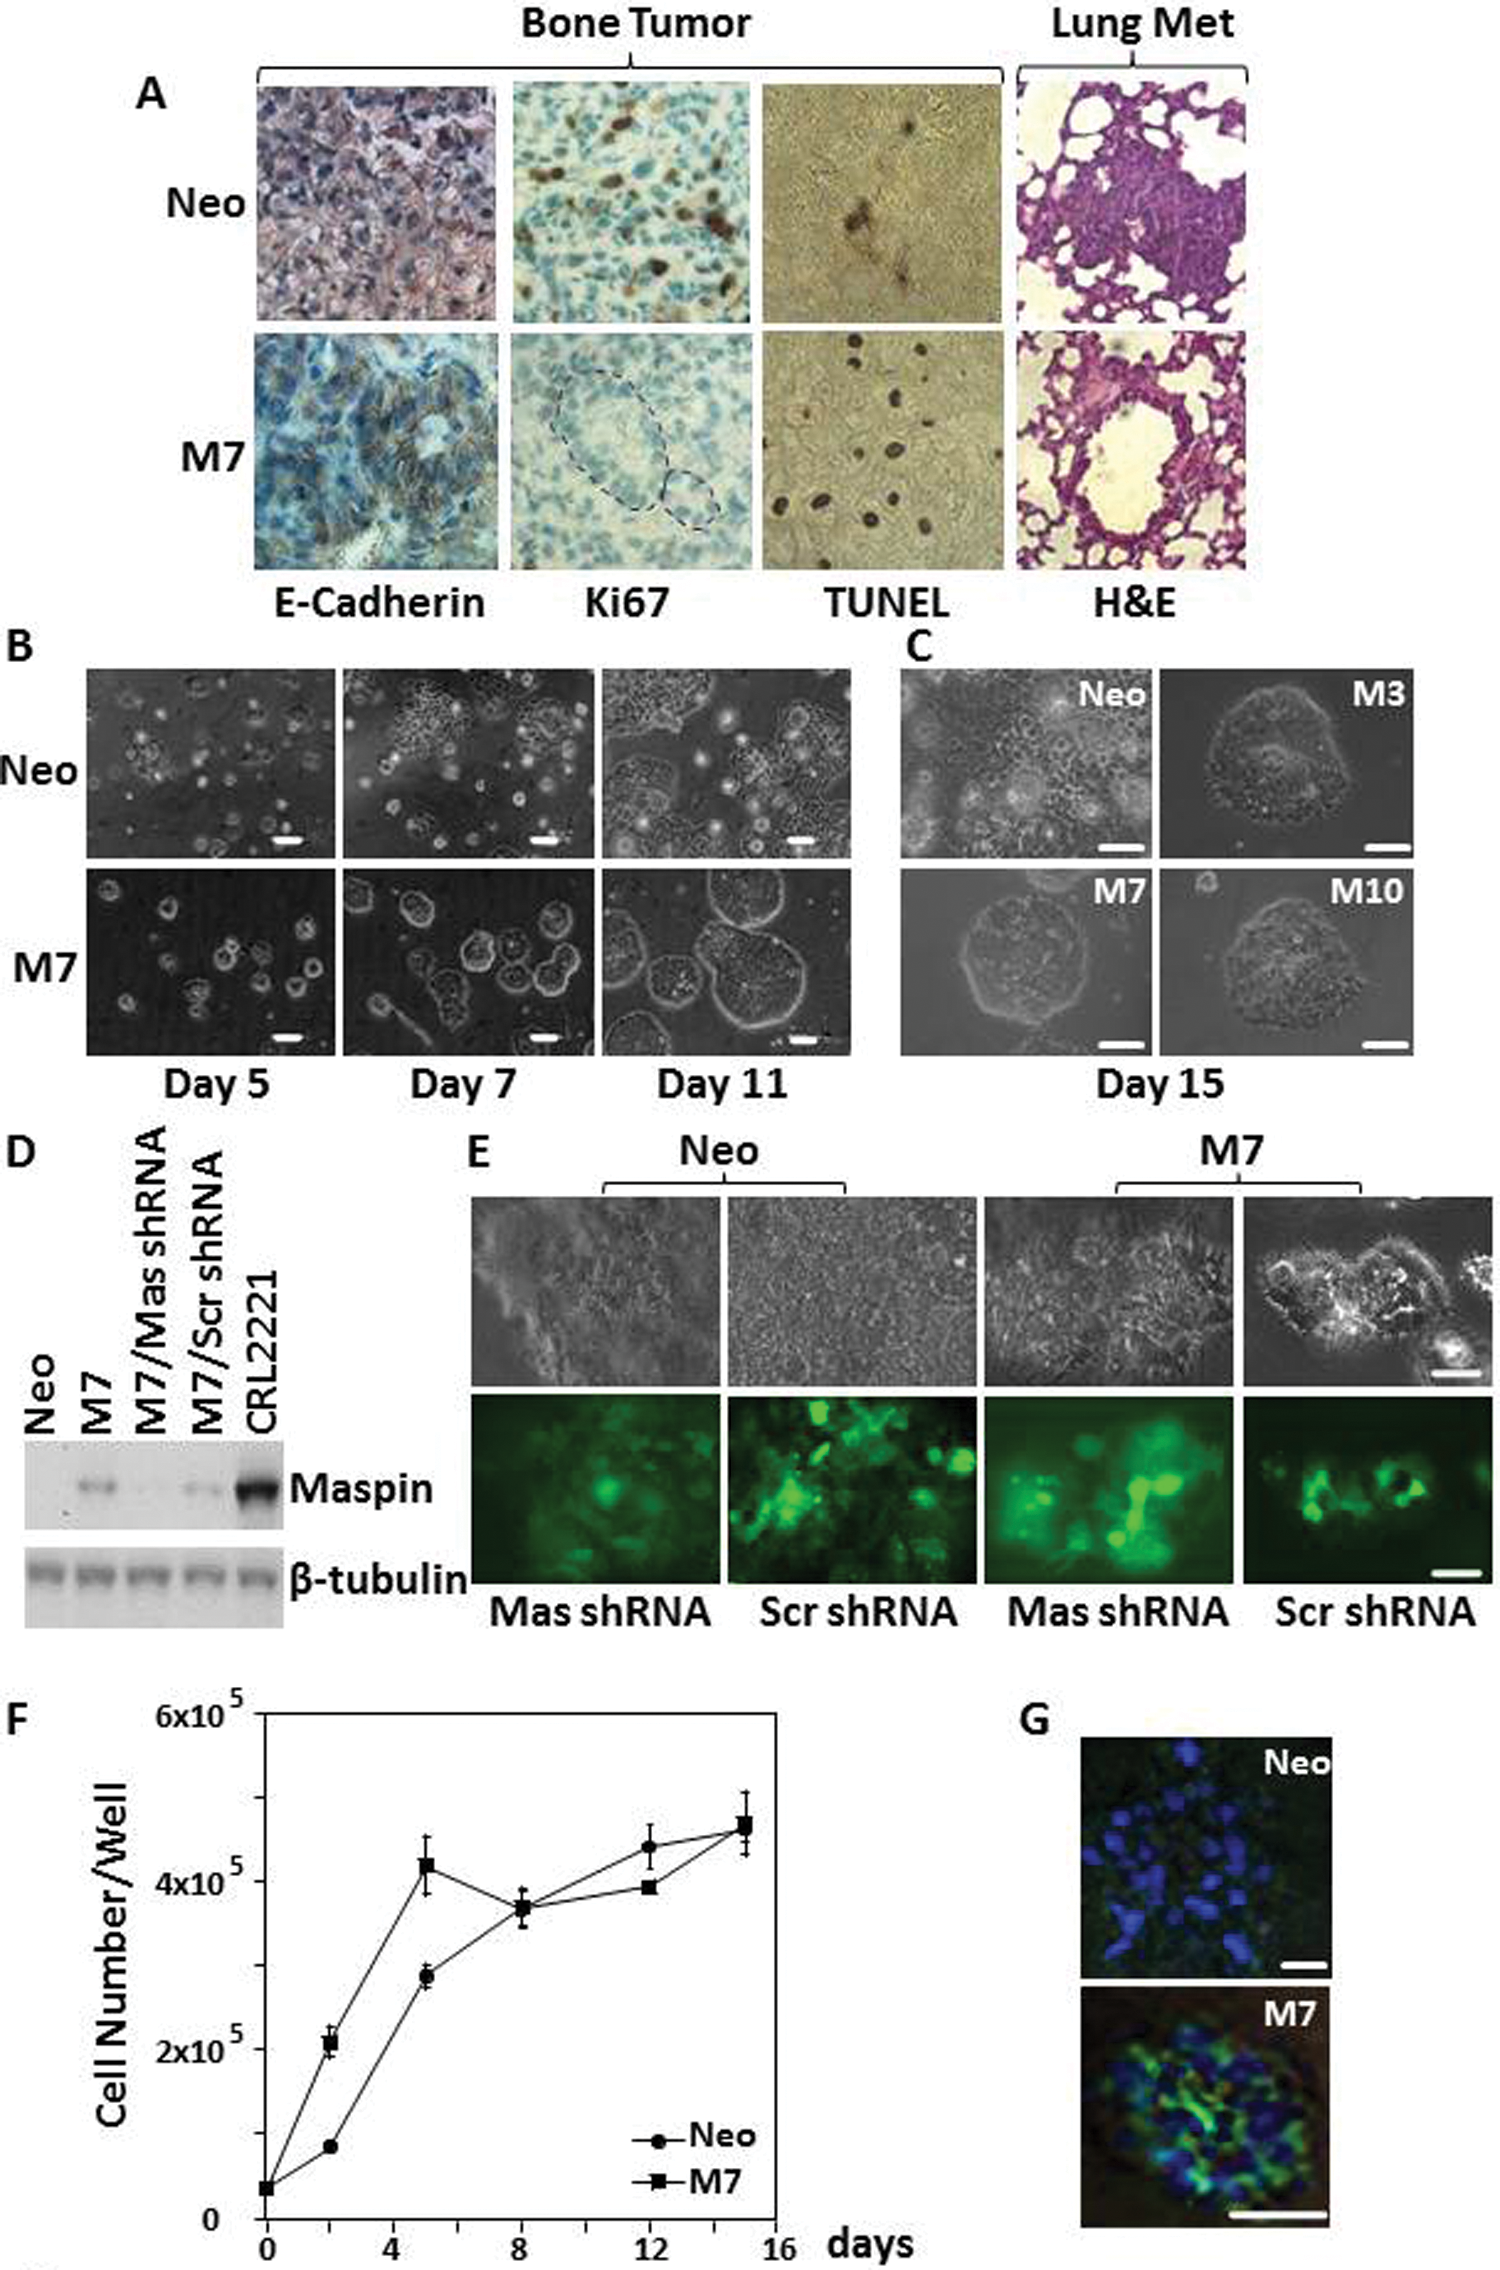
Maspin induces redifferentiation of DU145 cells in vivo and in 3-dimensional (3-D) collagen I. (
The redifferentiation of maspin-expressing prostate tumor cells, such as that observed in xenograft tumors, has not been observed in 2-D culture. To test whether the redifferentiation of maspin-expressing clones was supported by an in vivo–like 3-D growth environment, M clones and Neo cells were embedded in collagen type I, the most abundant nonmineralized matrix in bone. 46 As shown in Figure 1B and 1C, in a 15-day period, M clones gradually grew into nearly symmetrical spheres, whereas the Neo cells grew into tumor sheets that extended in random directions. To confirm the role of maspin in this morphological change, M7 cells were transduced by lentivirus-expressing maspin-specific shRNA (Mas shRNA) or shRNA of a scrambled sequence (Scr shRNA) (Fig. 1D). As shown in Figure 1E, maspin knockdown abolished the ability of M7 cells to form spheres but did not affect the morphology of Neo cells. Conversely, M7 cells transduced by Scr shRNA–expressing lentivirus retained their capacity to form spheres. M7 and Neo cells grown in 3-D collagen I were removed from the matrix and counted at the indicated time points (Fig. 1F). Over a 15-day period, the gross increase of cell numbers was similar with Neo and M7 cells. However, as compared with the growth curve of Neo cells, which has a typical exponential pattern, the growth curves of M7 cells appeared to be a mixture of distinct phases. Notably, in the period between day 4 to day 8, the total number of M7 cells decreased, while the number of Neo cells increased. By the end of day 15, the number of cells of these cell lines was similar. On day 5, M7 cells, but not Neo cells, were associated with a high level of apoptotic activity largely in the center of the spherical organization, as shown by the positive immunostaining of activated caspase-3 (Fig. 1G).
Interestingly, M7 and Neo cells grew in a similarly disorganized mass either as monolayer on a culture dish or in 3-D Matrigel (Fig. 2A). To test whether the morphological differences between maspin-transfected cells and the Neo cells in 3-D culture were due to their distinct interaction with collagen I, cells cultured in collagen I for 11 days were stained for β1 integrin, which is required for integrin binding to collagen I. As shown by the selected Z-stack confocal images in Figure 2B and 2C, M7 cells featured β1 integrin staining in a highly polarized manner, predominantly along the basolateral surface but not along the cell-cell adhesion interface or the apical surface of the cells. In the middle of the acinar structures, cells in uniform size were aligned in a monolayer. In contrast, the β1 integrin staining of the Neo cells fully encircled the cells and was more closely associated with the cell membrane processes at the invading front. These data should at least support that the maspin effect depends on the specific tumor cell interaction with collagen I.
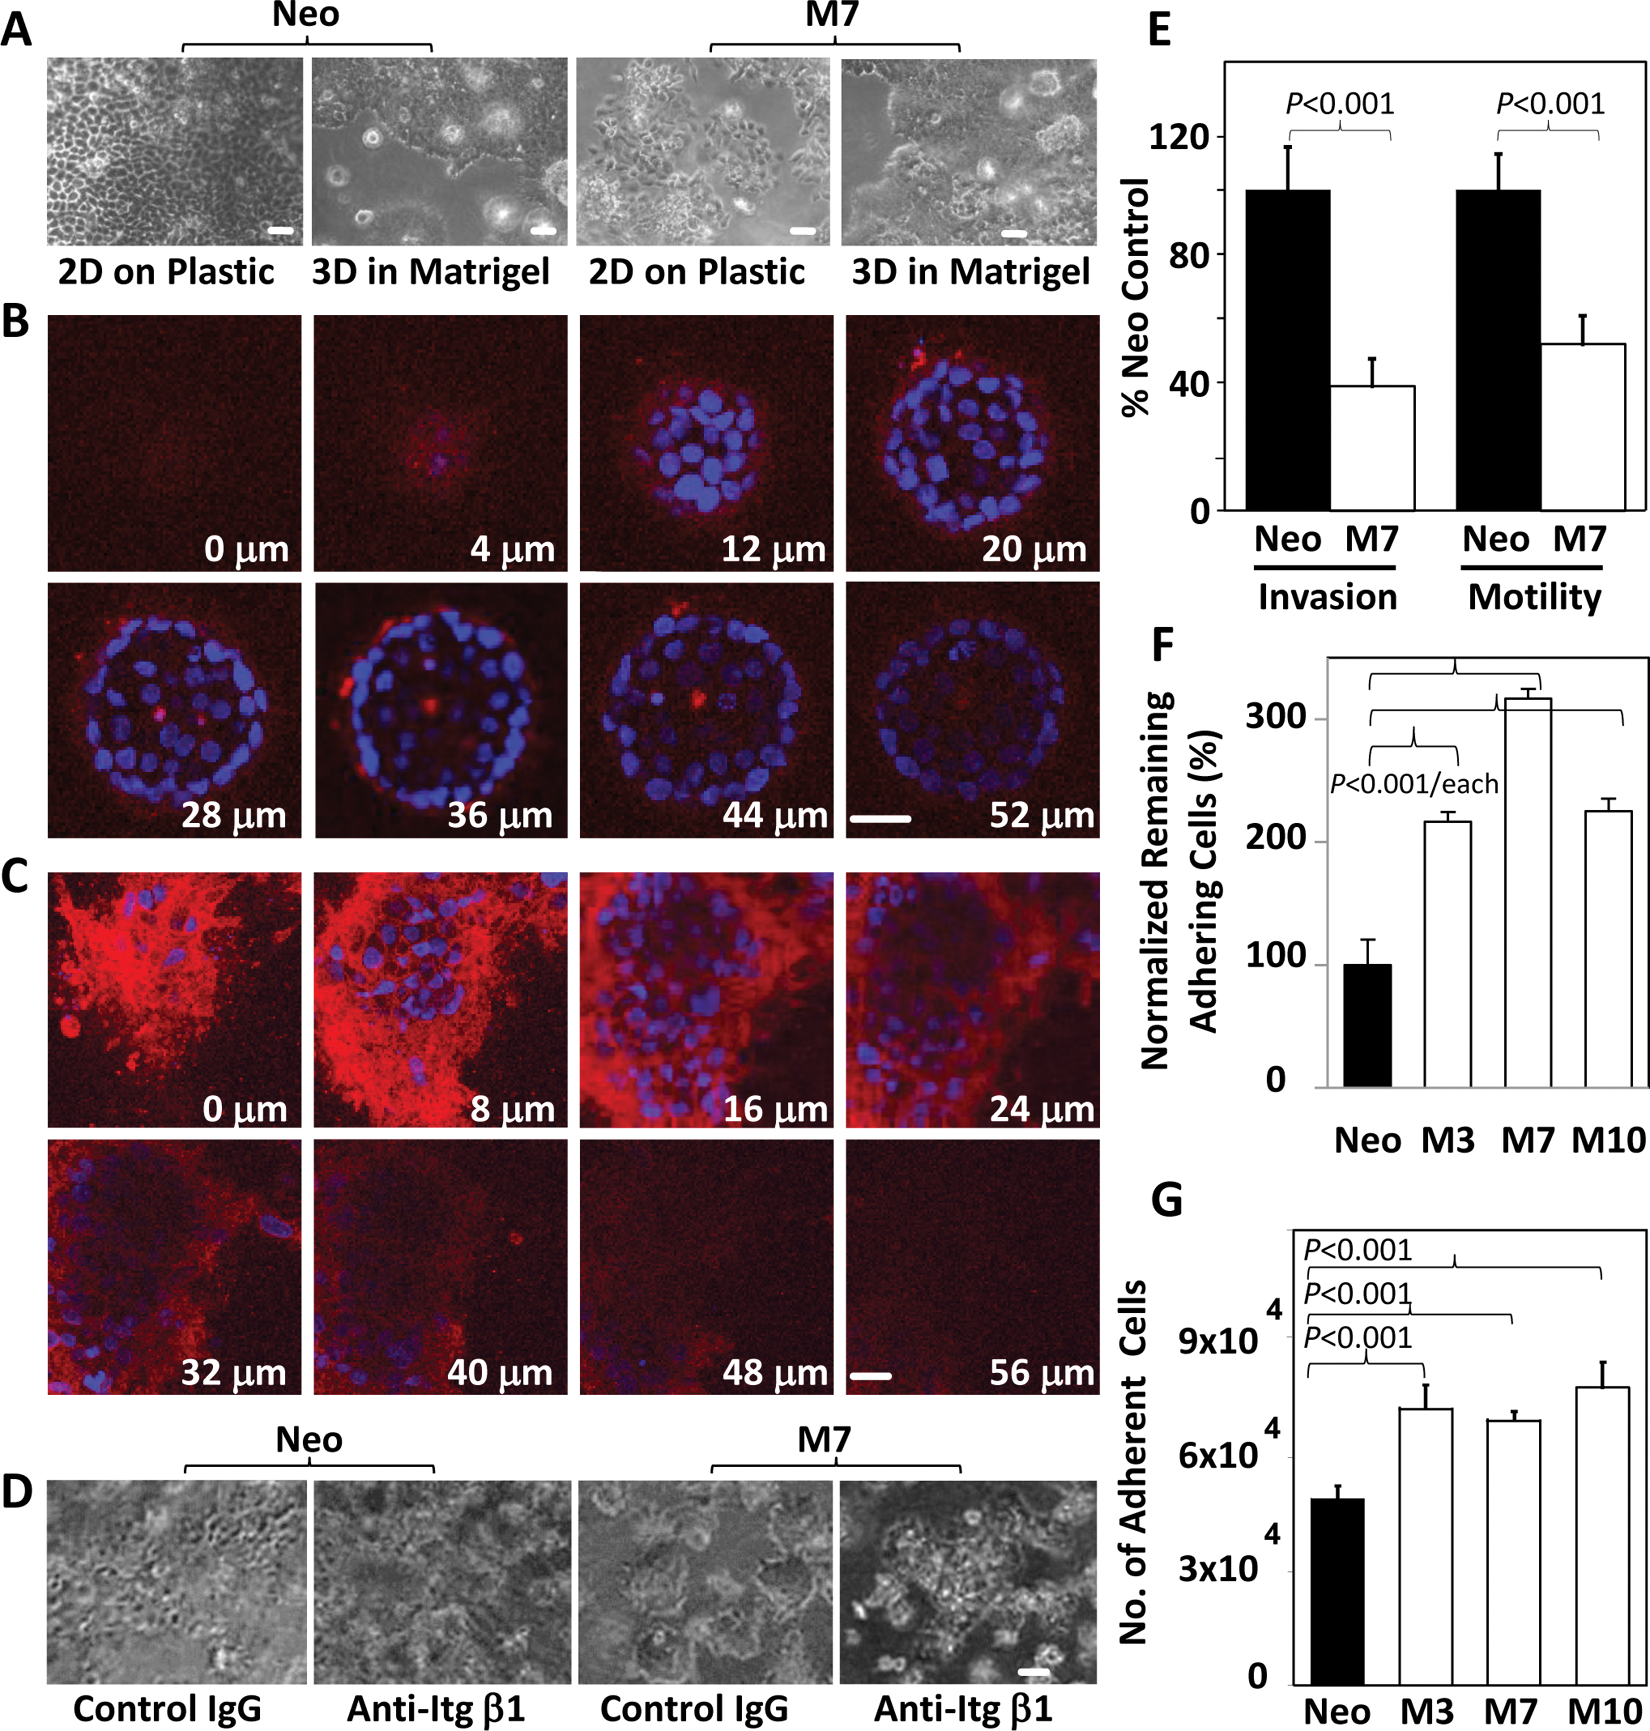
Tumor-suppressive properties of maspin are supported by cell interaction with collagen I. (
As shown in Figure 2D, a β1 integrin–neutralizing antibody abolished the acinar morphology of M7 cells but had little effect on the organization of Neo cell morphology. Based on the polarized interaction between M7 cells and collagen I, it was likely that these cells were confined by collagen I rather than stimulated to migrate along or invade through the matrix. To test this possibility, in vitro invasion and motility assays were performed. As shown in Figure 2E, the migration and invasion of M7 cells through collagen I were significantly inhibited. To examine how maspin affected cell interaction with collagen I during cell migration, cell detachment and attachment assays were performed. Consistent with our earlier report, 25 maspin-transfected clones were dramatically inhibited in detachment from collagen I (>200%) (Fig. 2F). In addition, maspin-transfected cells were more adherent to collagen I (~25%) (Fig. 2G). This initial adhesion advantage may explain the earlier growth enhancement shown in Figure 1F.
Maspin reprograms gene expression profiles in favor of prostate cancer cell redifferentiation
Genome-wide RNA microarray was performed using Agilent platforms (Santa Clara, CA) with M7 and Neo cells in 3 experimental systems: 2-D culture, 3-D collagen I, and in vivo bone tumors. Differentially expressed genes (P < 0.001) were selected and separated based on up- or down-regulation in each comparison. As listed in Supplementary Table S3, a total of 31 genes were commonly up-regulated, whereas a total of 29 genes were commonly down-regulated by ≥2-fold in M7 cells (v. Neo cells) in all 3 experimental systems. The differential expression of most of these genes was examined and verified by real-time PCR (q-RT-PCR). The q-RT-PCR verification of 6 genes (vimentin, caveolin 1, uPA, uPAR, TGFB2, and GLRX) is shown in Supplementary Figure S2A.
Based on the current literature and Oncomine database, 47 among the 31 commonly up-regulated genes, 15 have been shown to be tumor suppressive or correlated with better cancer prognosis (Suppl. Table S3A). Eleven genes have been implicated in differentiation, developmental morphogenesis, and/or inhibition of tumor EMT. Considering that the DU145 parental cell line was derived from human prostate cancer metastasis, it is not surprising that maspin expression also led to the up-regulation of 6 genes that are implicated in sex hormone regulation and function. Among the 29 genes commonly down-regulated (Suppl. Table S3B), 21 have been shown to promote carcinogenesis or tumor progression. Eighteen genes have been implicated in supporting EMT or stem cell phenotypes. Two genes have been shown to act as either oncogenic factors or tumor suppressors depending on the tissue or the stage of tumor progression. Among these 29 genes that are commonly down-regulated in maspin-transfected cells, the down-regulation of 8 genes may each down-regulate the expression or activity of a TGFβ family member. We found that BMP5 and TGFβ2 were both commonly down-regulated, which may help explain, in part, the down-regulation of 16 TGFβ target genes. It is important to note that, consistent with our earlier evidence that maspin acts as an endogenous HDAC1 inhibitor, 24 18 of the 31 commonly up-regulated genes have been shown to be repressed by HDAC. Consistently, maspin knockdown in PC3 cells 48 led to the opposite change in the expression of 6 of these genes (AKRIC2, FST, GLRX, KCNK1, LANCL1, and TM4SF2) (Suppl. Fig. S2C).
The maspin effects sustain cell redifferentiation in different tumor microenvironments
Additional maspin-induced changes in gene expression specifically associated with the experimental conditions (Suppl. Tables S4-S6) may provide valuable insights into how maspin-expressing cells maintain better differentiated phenotypes in different tumor microenvironments. As summarized in Supplementary Table S4, maspin-induced up-regulation of 149 genes and down-regulation of 124 genes were shared between the 3-D collagen I and 2-D cultures; maspin-induced up-regulation of 14 genes and down-regulation of 8 genes were shared between the 2-D culture and the in vivo bone tumors, and maspin-induced up-regulation of 16 genes and down-regulation of 21 genes in M7 cells were shared between 3-D collagen I and in vivo bone tumors. The results of q-RT-PCR verification of the differential expression of 6 genes (MMP9, cathepsin K, IL-6, cytokeratin 18, E-cadherin, and β-catenin) are shown in Supplementary Figure S2B. Interestingly, E-cadherin was down-regulated more in M7 cells grown in 2-D culture than in 3-D collagen I, and it was up-regulated in bone tumors. The expression of β-catenin, an E-cadherin–associated molecule in the epithelial cell adhesion complex,49,50 was elevated in M7 cells in 2-D culture but down-regulated in 3-D collagen I and in bone tumors. The expression of cathepsin K, a cysteine protease involved in osteoclast-mediated bone remodeling, 51 was down-regulated in M7 cells only in bone tumors.
Neo cells exhibited a high basal level of E-cadherin expression. Interestingly, when grown in 2-D culture, the M clones expressed significantly lower levels of E-cadherin as shown by q-RT-PCR, immunofluorescence staining, and Western blotting (Fig. 3A-C). E-cadherin protein was predominantly membranous and localized at the sites of cell-cell adhesion in Neo cells, whereas in M7 cells, it was detected in the cytosol. In line with the reports that E-cadherin may be regulated by differential DNA methylation, 52 E-cadherin expression increased in M7 and Neo cells upon treatment with methyl transferase inhibitor 5-Azacytidine (5-Aza), HDAC inhibitor M344, or both (Fig. 3C). It is worth noting that M7 cells, which expressed E-cadherin at a reduced level in 2-D culture, were inhibited in invasion and motility assays (Fig. 2E). Interestingly, a progressive increase in the ratio of E-cadherin mRNA expressed by M7 cells to that by Neo cells was observed in 2-D culture, 3-D collagen I, and bone tumor (Suppl. Fig. S2B). As shown by immunostaining, E-cadherin in Neo cells in 3-D collagen I was predominantly on the cell membrane including the sites of cell-cell adhesion. E-cadherin in M7 cells was also membranous and was almost exclusively localized toward the basolateral side of the acinar structures (Fig. 3B and Suppl. Fig. S3). The subcellular localization patterns of E-cadherin in M7 and Neo cells in 3-D collagen I were similar to those found in their corresponding bone tumors (Fig. 1A).
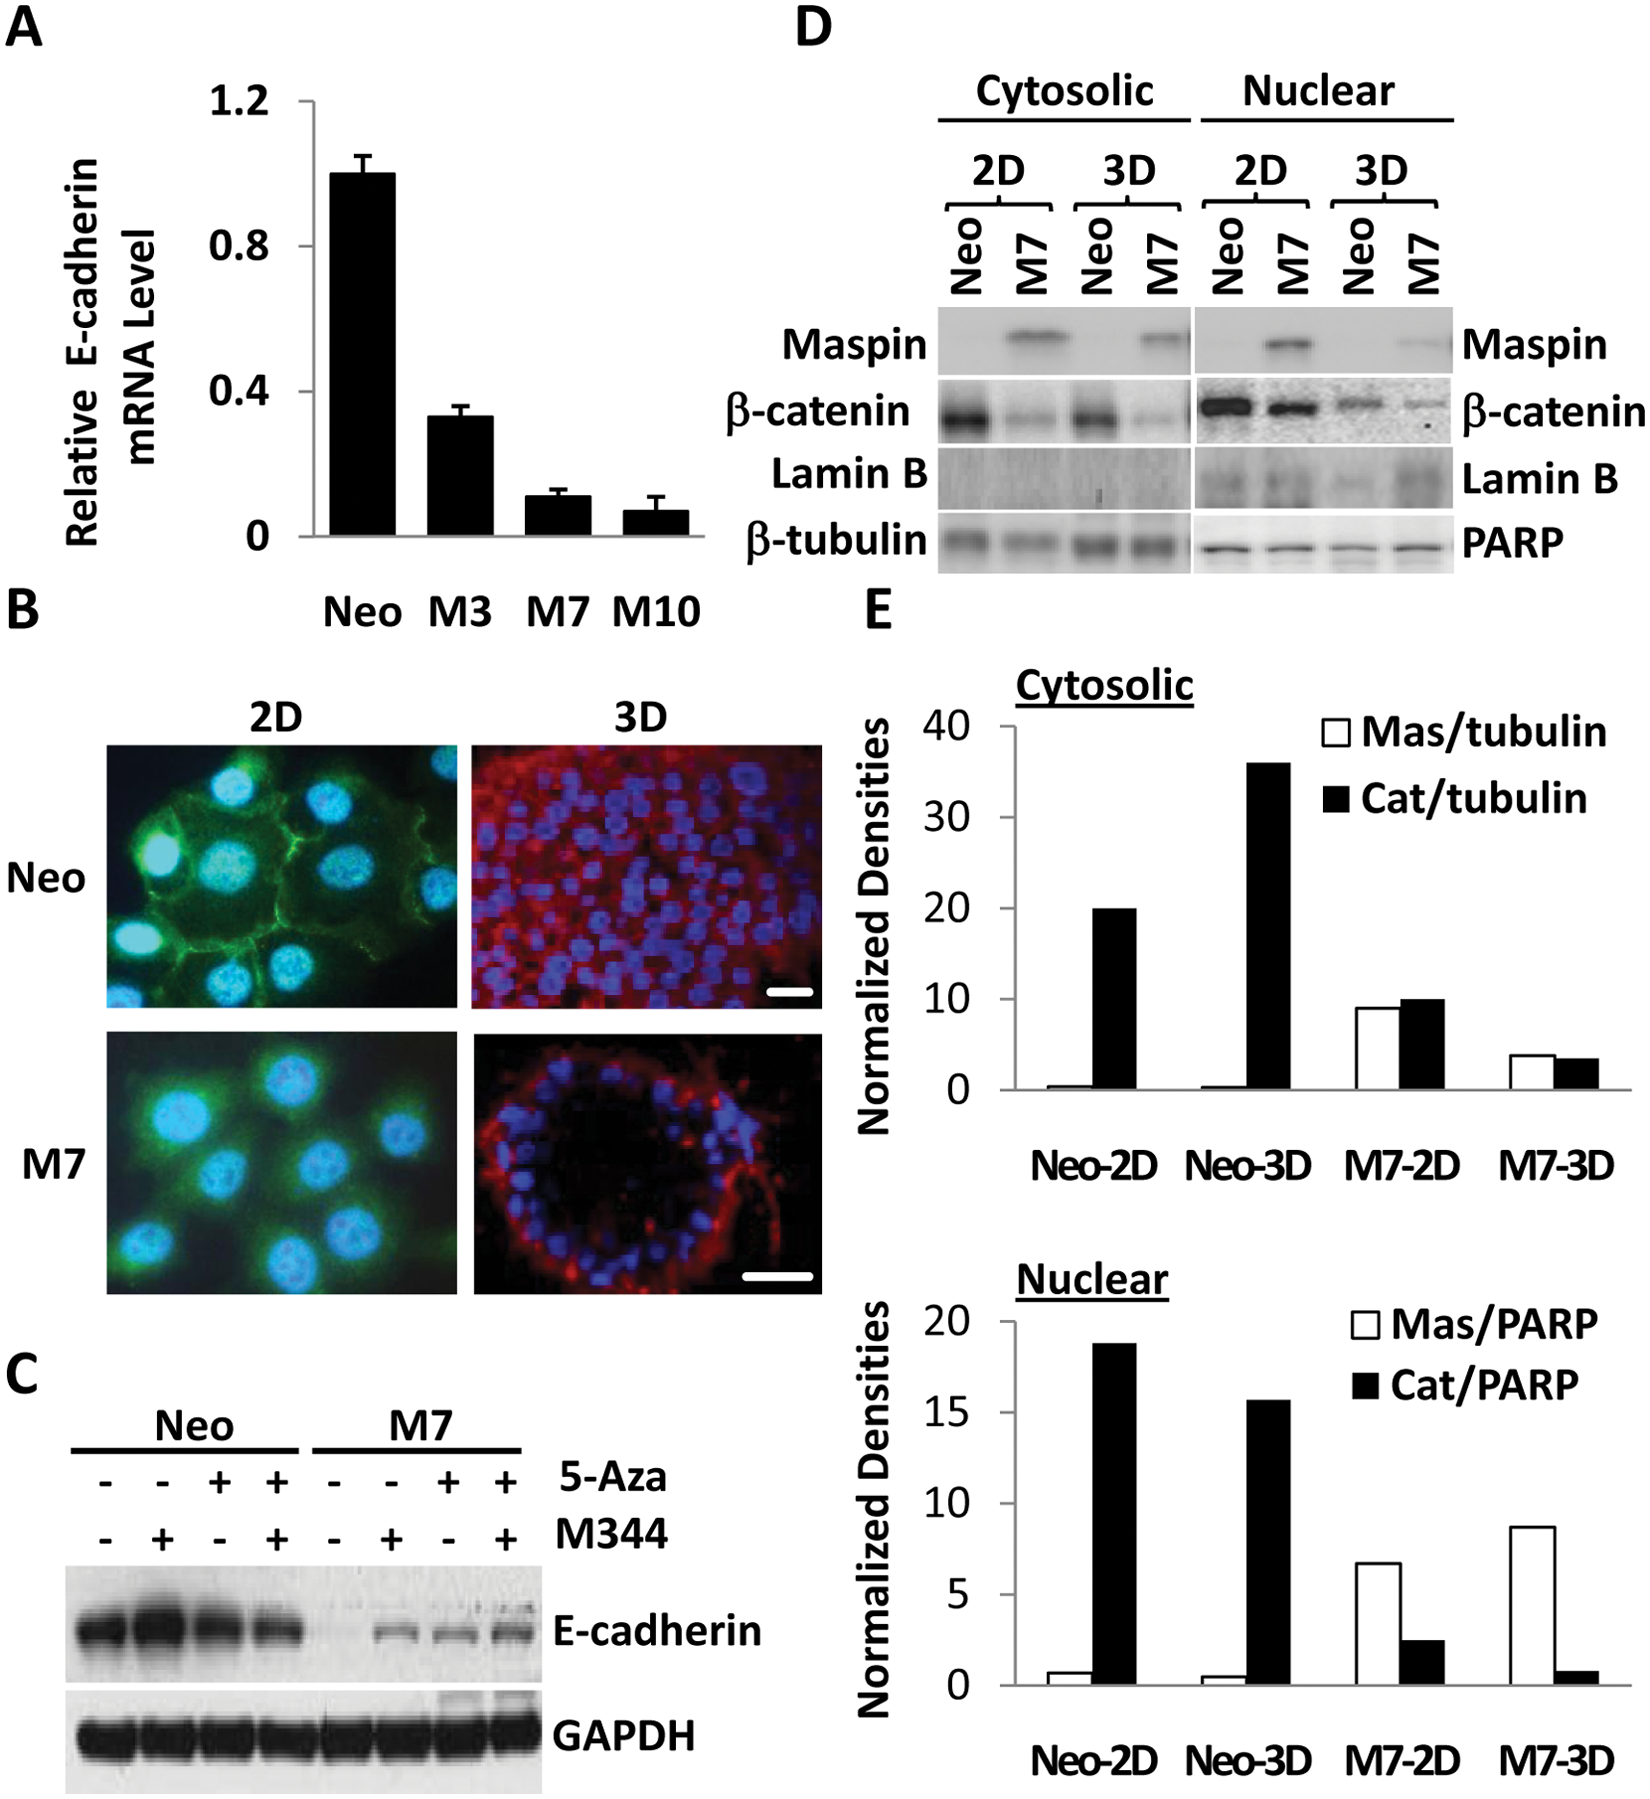
Maspin regulates E-cadherin but does not depend on E-cadherin for its tumor-suppressive activity. (
E-cadherin mediates cell-cell adhesion through assembly on the cytoplasmic side of the protein complex involving β-catenin, which otherwise may be acting as a transcription factor in the nucleus to drive EMT.49,50 As shown in Figure 3D and 3E, nuclear β-catenin was decreased in 3-D collagen I cultures of both Neo and M7 cells as compared to the corresponding 2-D cultures. The level of cytosolic β-catenin in M7 cells was also lower in 3-D collagen I than in 2-D culture. In parallel, maspin in M7 cells was primarily localized in the cytosol when cells were grown in 2-D culture and became more nuclear in cells in 3-D collagen I. These data support the notion that the collagen I matrix provided a more favorable environment to facilitate the tumor-suppressive function of maspin, particularly in the nucleus.
Maspin concertedly regulates extracellular matrix (ECM) remodeling
Maspin-transfected cells were associated with increased fibrosis encircling the acinar structure of M7 cells in bone tumor (Fig. 4A). Similar fibrotic alignment on the acinar basolateral surface was observed with M7 cells, but not Neo cells, in 3-D collagen I (Fig. 4B). Of note, purified collagen I matrix was uniformly polymerized in 3-D culture. The intensified fibrillar alignment under the basolateral surface of the 3-D structure of M7 cells suggests increased new fibril assembly. To examine the effect on ECM degradation, we added fluorogenic DQ-collagen I to the 3-D collagen I cell culture. Based on the confocal fluorescence imaging (Fig. 4C and Suppl. S4A and S4B) and the quantification of the DQ-collagen I–derived green fluorescence (Fig. 4D), Neo cells were more active than M7 cells in degrading the ECM. It was further noted that while Neo cells degraded DQ-collagen I uniformly across the cell mass, the acinar structure of M7 cells was associated with polarized DQ fluorescence on the periphery.
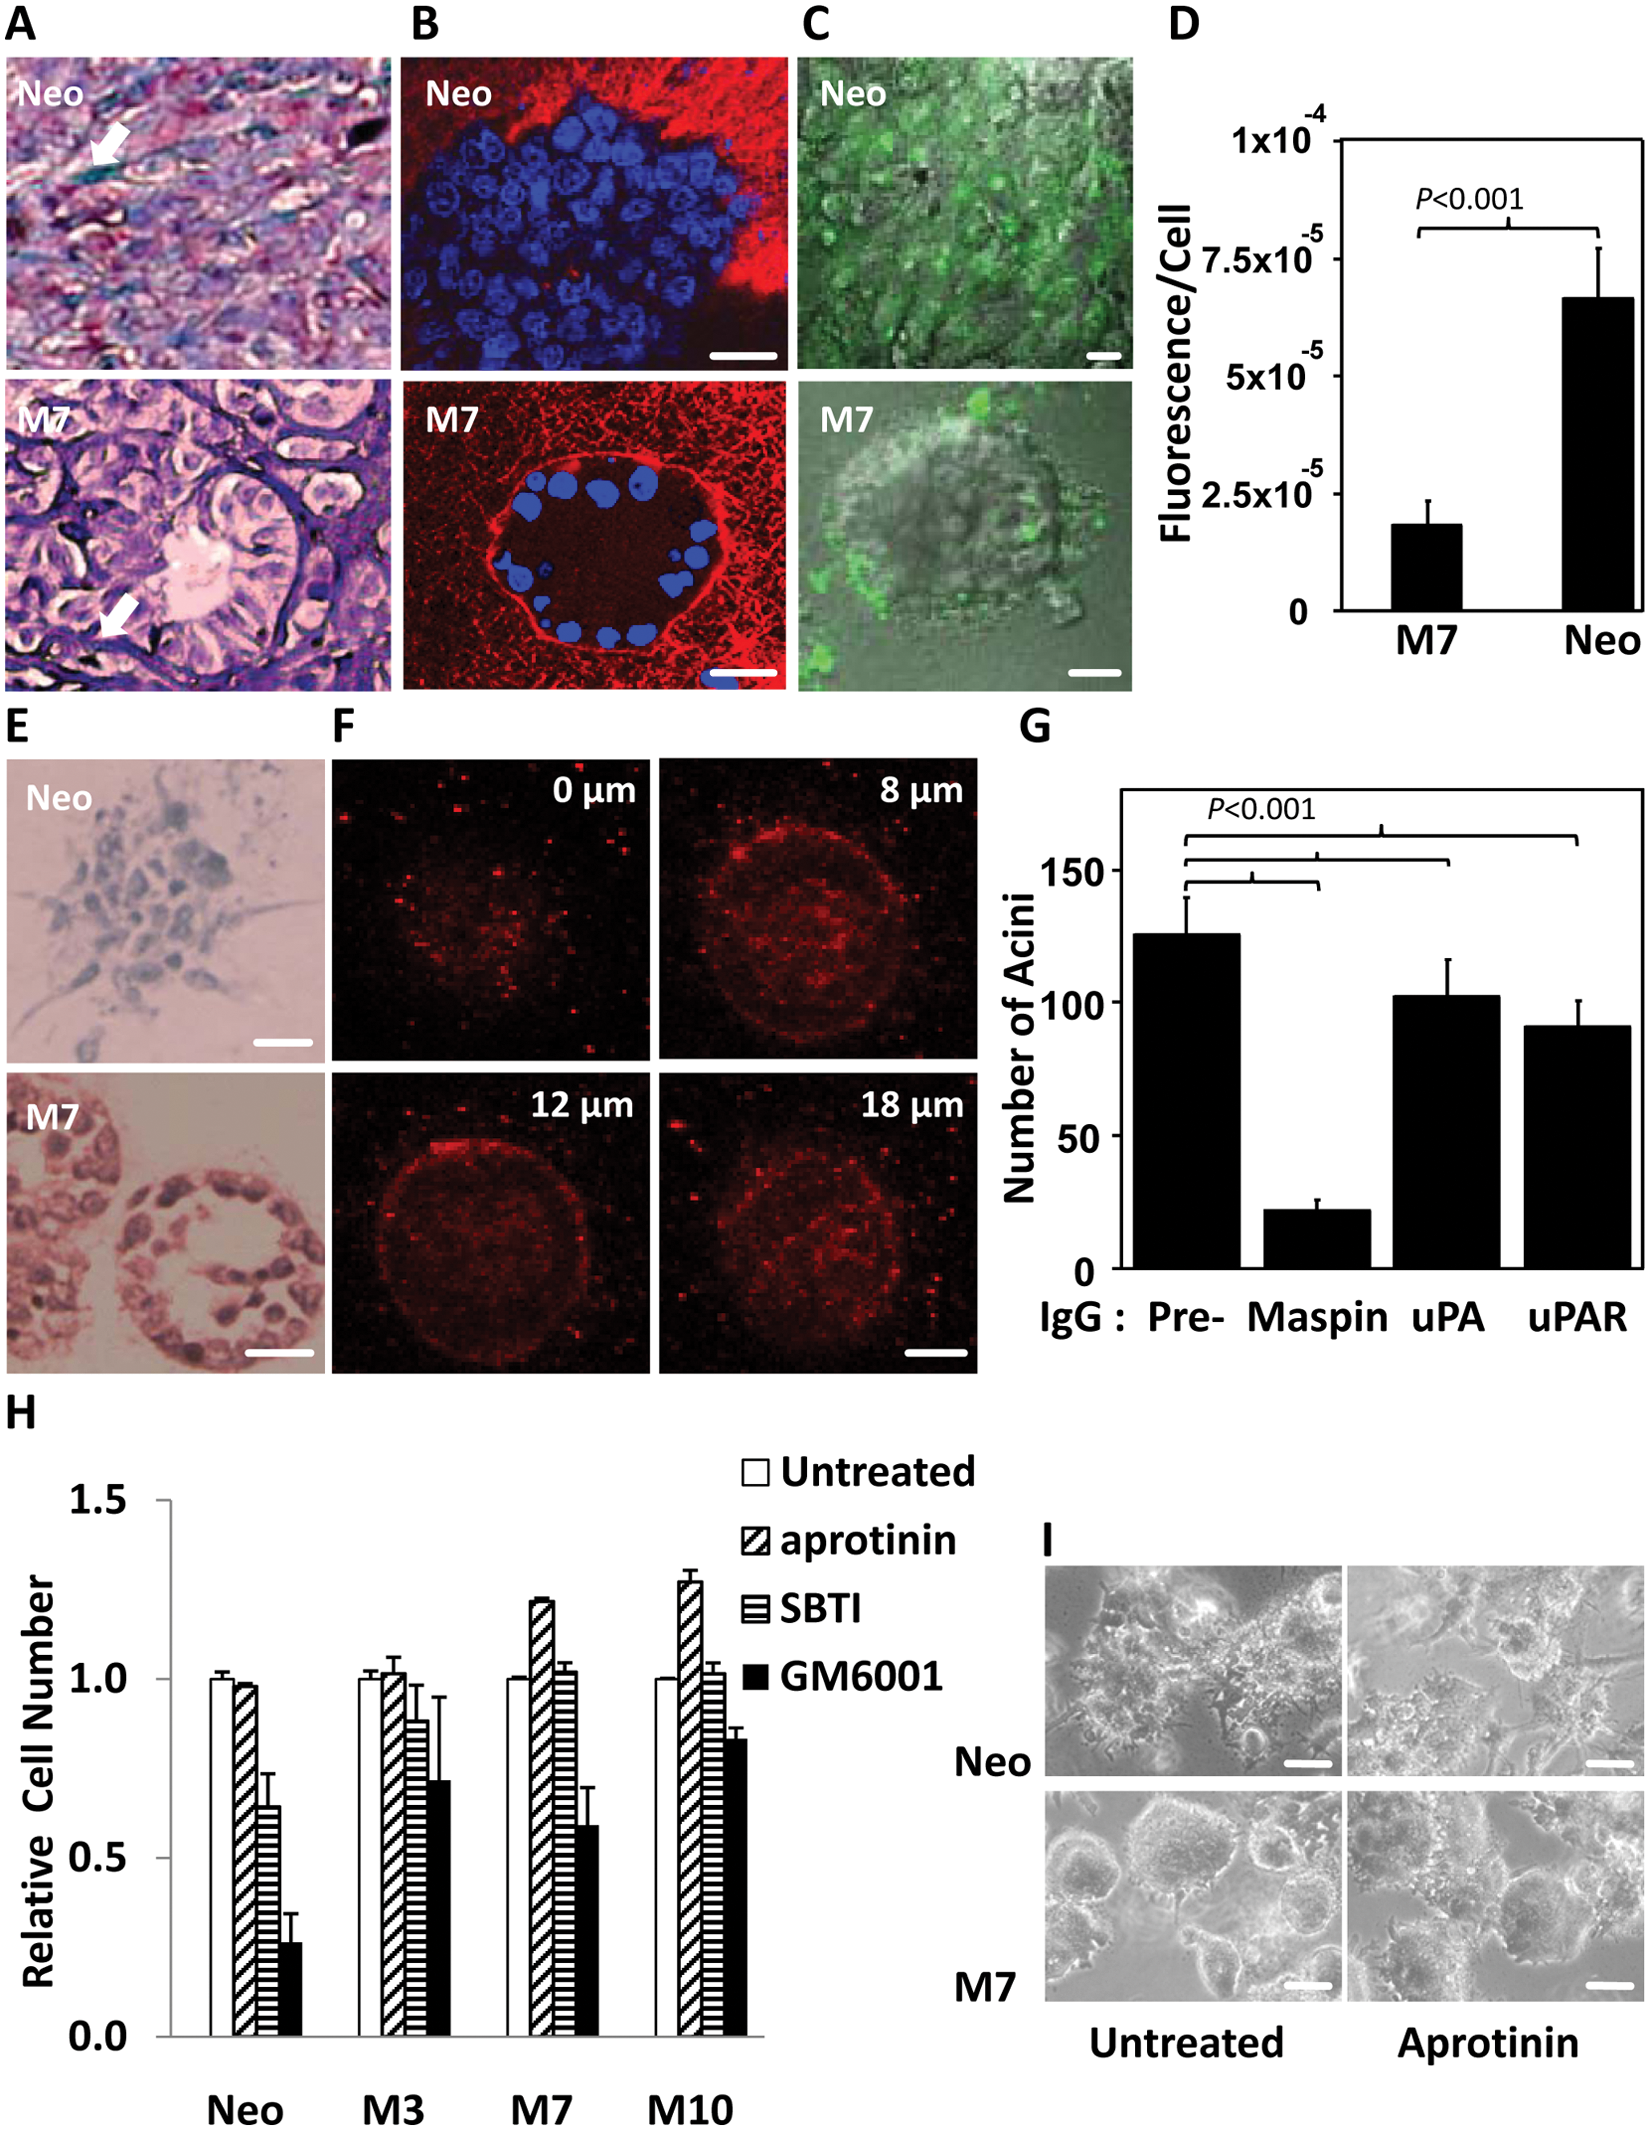
Maspin-mediated prostate carcinoma cell redifferentiation is associated with concerted extracellular matrix remodeling. (
While intracellular maspin was both a nuclear and a cytosolic protein in M7 cells in 3-D collagen I (Fig. 4E), extracellular maspin was detected at the basolateral surface of the acinar structure of M7 cells (Fig. 4F) as well as in the conditioned culture media (confirmed by immunoprecipitation followed by mass spectrometry) (data not shown). Considering the significant down-regulation of uPA and uPAR in maspin-transfected cells (Suppl. Fig. S2A), it is likely that cells expressing maspin would no longer depend on uPA and uPAR for ECM degradation. To test this possibility, 3-D collagen I cultures of Neo and M7 cells were treated with neutralizing antibodies of maspin, uPA, and uPAR, respectively. As shown in Figure 4G, maspin-neutralizing antibody was the most effective in blocking the formation of M7 acini, whereas the neutralizing antibodies against uPA and uPAR only marginally inhibited the formation of M7 acini. Consistently, 2 small molecular weight serine protease inhibitors, aprotinin and SBTI, known to inhibit plasmin, did not further perturb the effects of maspin nor exerted a maspin-like effect on Neo cell redifferentiation (Fig. 4H and 4I). On the other hand, it is known that collagen I is sensitive to the degradation by matrix metalloproteinases (MMPs). 53 It was not surprising that the synthetic MMP inhibitor GM6001 inhibited cell growth in 3-D collagen I (Fig. 4H). However, Neo cells were inhibited more than the M clones, suggesting that Neo cells were more dependent on MMPs for tumor cell local expansion and ECM degradation.
Maspin negatively regulates TGFβ signaling
Our DNA microarray analysis suggests that TGFβ signaling and its downstream network may be inhibited by maspin. We further investigated this possibility. As shown in Figure 5A, upon TGFβ treatment, the phosphorylation of Smad2 (a major TGFβ downstream effector) was significantly lower in M7 cells than in Neo cells. The conditioned media of cells treated with TGFβ were analyzed by gelatin zymography to detect the level of secreted MMP9. As shown in Figure 5B, the level of MMP9 secretion increased in a time-dependent fashion in Neo cells but remained undetected in M7 cells. When DU145 cells were transiently transfected with a vector that encoded Flag-tagged maspin (Flag-Maspin) or the empty vector (Flag-EV), the expression of Flag-Maspin, but not Flag-EV, dramatically inhibited the TGFβ-induced production of MMP9 (Fig. 5C). Thus, maspin may specifically block TGFβ-stimulated MMP9 secretion.
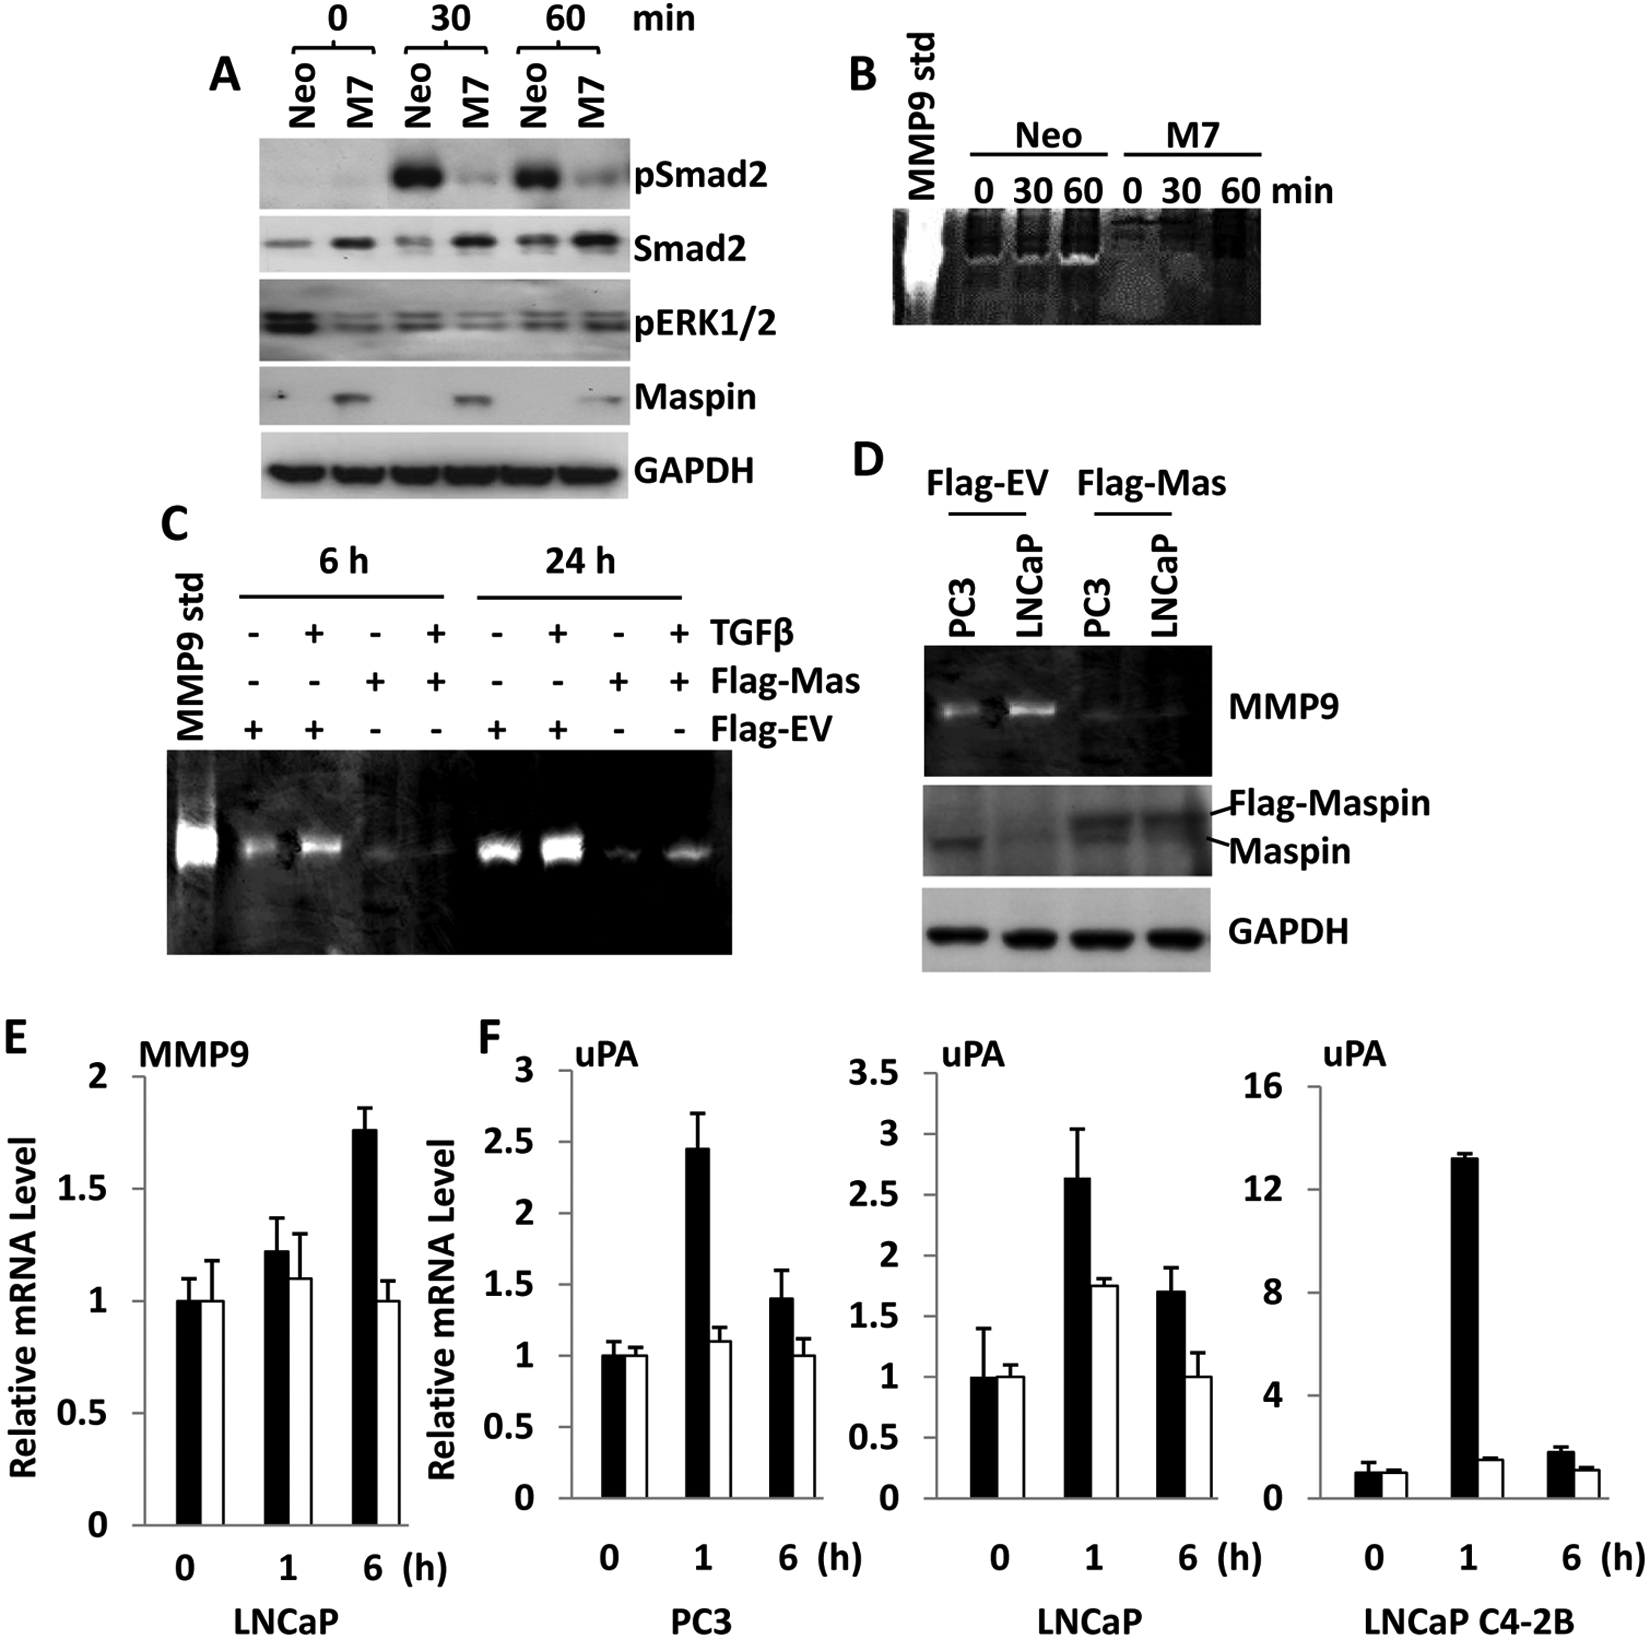
Maspin blocks TGFβ1-stimulated expression of MMP9 and uPA. (
To test whether the effect of maspin on cellular response to TGFβ was cell line specific, PC3 and LNCaP prostate cancer cell lines were transiently transfected with Flag-Maspin and Flag-EV vector DNA, respectively. As shown in Figure 5D, the basal level of secreted MMP9 was significantly reduced only by Flag-Maspin transfection. q-RT-PCR further confirmed that Flag-Maspin blocked TGFβ-induced MMP9 transcription in transiently transfected LNCaP cells (Fig. 5E). Because maspin expression led to the down-regulation of both uPA and uPAR in all 3 experimental systems, we tested whether maspin could also suppress the TGFβ-induced uPA and uPAR expression in 3 other prostate cancer cell lines: PC3, LNCaP, and LNCaP C4-2B. These cells were transiently transfected with Flag-Maspin and Flag-EV plasmids, respectively, and subsequently treated with TGFβ. As shown in Figure 5F, induction of uPA was blocked in all 3 cell lines transfected with Flag-Maspin vector but not with Flag-EV vector.
Discussion
In our effort to examine how maspin induces redifferentiation of prostate cancer cells as that observed in the SCID-Hu xenograft model for prostate cancer bone metastasis, we provide the first evidence that maspin can induce the redifferentiation of prostate carcinoma cells in 3-D collagen I matrix. Furthermore, the maspin-induced gene expression profiles confirmed our earlier report that maspin acts as an endogenous HDAC1 inhibitor. 24 HDAC1 is the most abundant class I HDAC known to deacetylate histones in the nucleus. 54 Our data do not clearly exclude the possibility that maspin may target multiple HDACs. However, the current evidence seems to support a more specific interaction between maspin and HDAC1. Despite the evidence that HDAC1 and HDCA2 are structurally similar, highly abundant, and can be pulled down by pharmacological inhibitors such as SAHA with similar affinity, 55 maspin only interacted with HDAC1 in yeast 2-hybrid screening 32 and immunoprecipitation. 24 Interestingly, HDAC1 and HDAC2 have been reported to dimerize. 56 It is intriguing to speculate that maspin may bind only the HDAC2-free HDAC1. This may in part explain why maspin only regulates a subset of HDAC1 target gene expression. Accumulated evidence suggests that HDAC1 overexpression plays a key role in cell dedifferentiation and may underlie the increased oncogenic cellular response to EMT-stimulating factors in the tissue microenvironment.57-60 Maspin, on the other hand, is localized predominantly in the nuclei of benign human prostate epithelial cells. 61 Recently, we reported the first evidence that nuclear maspin correlated with better prognosis of early stage lung cancer. 2 Consistently, bioengineered maspin with a nuclear exclusion signal exhibited a significantly diminished inhibitory effect on the growth and metastasis of the breast cancer cell line MDA-MB-231-D3H2-Lnluc. 62 In addition, our evidence suggests that endogenous inhibition of HDAC1 by maspin may control the balance between differentiation and dedifferentiation.
Compared to the large number of genes that can be induced by pharmacological HDAC inhibitors, 63 the number of HDAC target genes that were up-regulated by maspin is relatively small. We speculate that because maspin is an epithelial-specific protein, 1 these HDAC target genes that are sensitive to maspin regulation may be particularly important in the regulation of epithelial differentiation. On the other hand, maspin has multifaceted tumor-suppressive effects that may be biologically context dependent. The striking maspin-induced tumor cell redifferentiation, as judged by the formation of acinar structures, ECM remodeling in concert with polarized cell anchorage, and increased sensitivity to spatial-specific anoikis, clearly involved a temporal and spatial continuum of complex biological events. Earlier, maspin was shown to be temporally and spatially regulated in a model for mammary gland development. 64 Although the ultimate loss of maspin expression correlates with higher tumor grades and tumor invasion, maspin may also be localized in the cytosol and pericellular space during tumor progression. To date, the regulation of maspin trafficking is unknown. Maspin may also target the extracellular uPA/uPAR complex25,65 and β1 integrin28-30 and bind to intracellular GST 32 and IRF6. 27 While further studies are needed to elucidate how maspin may coordinate systematic interactions with additional proteins in different subcellular compartments, the inhibitory activity against a common tumor-promoting factor such as HDAC1, combined with the ability to interact with or target other molecules involved in epithelial homeostasis, helps explain why maspin exerts a general tumor-suppressive effect on prostate cancer cell lines of different genetic and epigenetic backgrounds.
The genes down-regulated by maspin were mostly oncogenic. Of particular note, many of these genes, such as TGFβ, have been implicated in EMT39-41,66 as well as in the vicious cycle of tumor interaction with its microenvironment. 67 Based on the literature, down-regulation of TGFβ may be the reason for the down-regulation of other genes such as vimentin, uPA, MMP9, and IL-6 (Suppl. Fig. S2A and S2B). We showed that maspin blocked the TGFβ-induced expression of MMP9 in multiple prostate cancer cell lines, at least in part, by inhibiting TGFβ signaling. This activity of maspin may be highly relevant in vivo when the inflammatory interaction between tumor cells and the stroma is propelled by paracrine cytokines. 66 In tumor bone metastasis, TGFβ released from bone stroma may initiate the vicious cycle of tumor/bone interaction by stimulating the stromal production of RANK and RANKL, 67 which leads to bone remodeling and increased tumor cell colonization and survival.
The notion that maspin activates and sustains a redifferentiation program, rather than a reaction or pathway, helps to put into a new perspective the paradoxical evidence that E-cadherin expression was decreased in M7 cells in 2-D culture. This evidence, when considered alone, might have been the opposite to the expectation based on the prodifferentiation effects of maspin. However, increasing evidence suggests that the relationship between E-cadherin and the differentiation states of carcinoma cells may be complex. Considering the fact that the DU145 cells originated from human prostate cancer brain metastasis and considering the evidence that E-cadherin in brain tumors is associated with poor prognosis, 68 it is possible that DU145 tumor cells have acquired brain mimicry and become dependent on E-cadherin for survival. While E-cadherin down-regulation in M7 cells may not contradict the tumor-suppressive activities of maspin as observed in the biological assays with 2-D culture (Fig. 2E-G), the level of E-cadherin in M7 cells was up-regulated, as the cells were cultured in 3-D collagen I and in vivo bone tumor. On the other hand, emerging evidence suggests that cadherin switching may occur to facilitate tumor cell interaction among themselves or with mesenchymal cells. 69 We showed that under the 3-D collagen I condition, less β-catenin was translocated in maspin-transfected cells as compared to the Neo cells. In addition, mRNA microarrays revealed that both P-cadherin and osteoblast cadherin were down-regulated in M7 cells when grown as in vivo bone tumors. Interestingly, P-cadherin and its downstream partner p120-catenin, but not E-cadherin, were shown to be tumor suppressive in DU145 cells. 70 On the other hand, E-cadherin has been shown to be inversely correlated with osteoblast cadherin in bone metastasis of breast and prostate cancer.71,72 The complex regulations of E-cadherin and its associated molecules in M7 cells may reflect the capacity of the maspin-mediated redifferentiation program to adapt to and sustain in different tumor microenvironments.
The choice of collagen type I as the 3-D culture matrix is of biological relevance because collagen I is the most abundant ECM protein in bone, 46 which is the most common site of prostate tumor metastasis. 67 We showed that the redifferentiation program manifested by maspin-transfected cells in 3-D collagen I closely resembles that observed in bone tumors. We noted that, when cultured in 3-D collagen I or grown as in vivo bone tumors, maspin-transfected cells were wrapped concentrically by collagen fibrils. Based on our earlier evidence that maspin increased the formation of mature focal adhesion contacts, 25 maspin-transfected cells may recruit more ECM to the basolateral surface of the cells. In the meantime, based on the reduction of ECM-degrading enzymes by M7 cells, newly deposited ECM by the tumor cells may be allowed to complete the assembly process to form a fibrillar tissue barrier. Ultimately, the polarized fibrosis in M7 3-D acini may directly confine tumor cells into a restricted space and render them dormant. Recently, Härmä et al. analyzed the phenotype and gene expression profiles of 29 different prostate epithelial cell lines grown embedded in Matrigel 73 and showed that DU145 was not induced to form well-differentiated round spheroids. In our hands, neither Neo nor M7 cells formed acini in 3-D Matrigel. Perhaps tumor-derived Matrigel may be particularly supportive to stem cell characteristics, that is, self-renewal and differentiation of both transformed and nontransformed cells.62,74,75 In comparison, a simple collagen I matrix may be a supportive anchor without adverse stimulatory activities.
It is known that prostate epithelial cells express the androgen receptor (AR) and are sensitive to hormone regulation. 16 This is the basis for the current prostate cancer castration therapy. Interestingly, maspin overexpression in AR-negative DU145 cells up-regulated genes that are involved in AR function or regulation: HOXA13, AKR1C2, and NROB1. HOXA13 is the only gene in its homeobox family that is negatively regulated by androgen and can be up-regulated by androgen withdrawal. 76 AKR1C2 has been shown to cooperate with 5-α/5-β-steroid reductases to catalyze the inactivation of the most potent androgen 5-α-DHT to 3-α-diol. 77 NROB1, on the other hand, plays a role in embryogenesis and the maintenance of embryonic stem cell pluripotency and has been shown to reduce AR activity. 78 Thus, maspin may reduce the specific effects of AR on tumor progression and metastasis. A recent report suggests that androgen deprivation–resistant prostate cancer cells may bypass cell death via increased TGFβ signaling and EMT. 79 In light of the evidence that maspin expression in prostate tumor cells down-regulates TGFβ signaling, maspin-expressing prostate tumor cells may develop resistance to castration resistance. Moreover, because maspin may generally sensitize tumor cells to drug-induced apoptosis,36,80 maspin expression may additionally increase the sensitivity of castration-resistant prostate cancer cells to drugs that exert cytotoxic effects via androgen- or AR-independent mechanisms. These possibilities need to be addressed in future studies.
In summary, our current study uncovered a link between maspin and a specific mechanism of prostate epithelial differentiation that can reverse EMT. We established a 3-D culture in collagen I that recapitulated the biological effects of maspin in potentiating a profound redifferentiation program in cancer cells. The 3-D culture model established in this study may prove to be highly useful for biological mechanistic studies of maspin. We also identified key epigenetic changes induced by maspin and provided independent evidence that maspin acts as an endogenous HDAC inhibitor. Further, maspin may regulate the expression of only a small set of functionally related HDAC target genes. The new molecular insights described in this study help explain why maspin-expressing tumor cells either are inhibited in tumor invasion and metastasis or adopt a “revertant” phenotype at the sites of distal metastasis. Furthermore, emerging evidence suggests that chromatin modification with pharmacological HDAC inhibitors can induce tumor dormancy and convert a drug-tolerant cancer subpopulation to become drug sensitive. 81 Currently, many cancer clinical trials are underway, testing different pharmacological HDAC inhibitors. To this end, maspin is the only endogenous polypeptide HDAC1 inhibitor identified thus far. A better understanding of the molecular interaction between maspin and HDAC1 may lead to the development of more specific HDAC1 inhibitors that simulate the full spectrum of maspin function with little or no adverse side effects.
Materials and Methods
Cell culture and reagents
Cell culture reagents were from Invitrogen (Carlsbad, CA). The following reagents were used: TUNEL staining kit (Roche, Indianapolis, IN), Cultrex rat collagen I (Trevigen, Gaithersburg, MD), Matrigel (BD Biosciences), collagenase (Clostridium histolyticum) (Sigma-Aldrich, St. Louis, MO), DQ-collagen I and Hoechst 33342 (Molecular Probes, Invitrogen), Costar Transwell inserts (Corning, Corning, NY), Diff-Quik cell staining kit (Dade Behring, Newark, DE), serine protease inhibitors aprotinin and soybean trypsin inhibitor (SBTI) (Sigma-Aldrich), metalloprotease inhibitor GM6001 (Millipore, Billerica, MA), and TGFβ1 (R&D, Minneapolis, MN). The methyl transferase inhibitor 5-Azacytidine (5-Aza) and the HDAC inhibitor M344 were described by Li et al. 48 The antibodies, and the corresponding dilutions used, are listed in Supplementary Table S1.
The immortalized human normal prostate epithelial cells CRL2221 and the human prostate carcinoma cell lines DU145, PC3, and LNCaP (American Type Culture Collection [ATCC], Manassas, VA) were cultured as described.25,48 LNCaP C4-2B was generously provided by Dr. Leland K. Chung (Cedars-Sinai Medical Center, Los Angeles, CA). 82 The prostate cancer cell line LuCaP 23.1 was a gift from Dr. Robert L. Vessella (University of Washington, Seattle, WA).43,44 DU145 cells stably transfected with maspin (M clones M3, M7 and M10) or empty vector (Neo) were generated and cultured as described. 45 DU145, PC3, LNCaP, and LNCaP C4-2B were also transiently transfected with Flag-Maspin or Flag-EV plasmid DNA as described. 32 Maspin knockdown PC3 cells were described by Li et al. 48
To establish stable Neo or M7-derived cell lines with maspin knockdown, the pGIPZ shRNAmir lentivirus system (Thermo Scientific, Asheville, NC) was used according to the manufacturer’s instructions. The maspin shRNA clone RHS4430-09905314 was selected for its high efficiency in knocking down maspin expression. In parallel, shRNA clone RHS4346 with a scrambled sequence was used as a control. The cells were maintained in RPMI 1640 medium containing 5% FBS and 0.5 µg/mL puromycin.
3-D cell culture
In general, for collagen I embedding, the collagen I solution was diluted to a concentration of 3 mg/mL with phosphate buffered saline (PBS) according to the manufacturer’s instructions and transferred to 12-well plates (0.250 mL/well). Cells were added (1 × 10⁵ cells/well) to the wells, mixed with collagen I, and incubated at 37°C for 20 minutes to allow the collagen to polymerize. The maintenance cell culture medium was added and replenished every other day. For Matrigel (BD Biosciences) embedding, cells were seeded in Matrigel at a cell density of 1 × 10⁵ cells/well, in 12-well plates containing 300 µL of cold Matrigel per well. Matrigel polymerization occurred after incubating the cells for 20 minutes at 37°C. To monitor cell growth kinetics in collagen I, cells were embedded in collagen I at a density of 1 × 10⁴ cells/well in 48-well plates in quadruplicate. At the time point cell viability was evaluated, collagen I was removed by digestion with collagenase (10 U/2 µL/15 min/37°C). The cells were suspended in maintenance medium, centrifuged and resuspended in 100 µL of serum-free phenol red–free medium, and transferred to a 96-well plate. Cell viability was assessed with WST-1 (Roche) according to the manufacturer’s instructions. The absorbance values were converted into cell numbers using standard curves established in parallel using the corresponding cells exponentially grown in 2-D culture, the number of which was predetermined by particle counting using the Coulter Z1 particle counter (Beckman Coulter, Brea, CA).
Tissue sections and immunohistochemical staining
The bone tumor and lung tissues derived from the SCID-Hu mouse model 38 were formalin-fixed, paraffin-embedded, and prepared as 5-µm-thick sections. These sections were subjected to immunohistochemical staining of E-cadherin and Ki67 as described, 2 TUNEL staining, H&E, and Masson’s trichrome staining according to the manufacturer’s instructions. The 3-D collagen I cell cultures were dehydrated by immersion in solutions containing increasing percentages of ethanol, followed by xylene treatment. The cells were then paraffin-embedded, mounted, and sectioned. The 1-µm sections were deparaffinized and subjected to immunostaining using the monoclonal anti-maspin antibody. Detection was carried out as described. 2
Immunofluorescence staining and confocal imaging of cells in 3-D collagen I
Immunofluorescence staining of E-cadherin in 2-D culture (Fig. 3C) was performed as described. 25 For immunofluorescence staining of 3-D collagen I cultures, the embedded cells were washed with PBS plus 0.5 mM CaCl2 and 1 mM MgCl2 (PBS-CM), fixed with methanol precooled to −20°C, and followed by 4% of p-formaldehyde in PBS. The cells were then permeabilized with 0.5% Triton X-100, washed with PBS-Gly (PBS containing 100 mM glycine), and blocked immunofluorescence buffer 83 supplemented with 5% (v/v) of normal serum of the secondary antibody host. The cells were incubated with the primary antibody, or isotype IgG as a control, overnight at 4°C. After several washes, the cells were incubated for 2 hours with the appropriate fluorescence-labeled (Alexa Fluor) secondary antibody, washed with immunofluorescence buffer and incubated for 10 minutes with Hoechst dye (0.05 µg/mL) in PBS. Confocal imaging was performed using a Zeiss LSM 510 confocal microscope (Oberkochen, Germany) equipped with dipping lenses (20× or 40×). The integrated fluorescence across image stacks was measured using Metamorph software (Molecular Devices, Sunnyvale, CA). 3-D image reconstruction and animation were carried out using Volocity software (Perkin Elmer, Waltham, MA). ECM fibrils were visualized by second harmonic generation with the Zeiss LSM 510 confocal microscope, using the Chameleon Coherent Ti Sapphire laser (Coherent Laser Group, Santa Clara, CA) tuned to 885 nm at 57% output. The nuclei of the cells in the same focal plane, stained by Hoechst dye, were visualized at λex of 745 nm. The confocal work was done at the Microscopy, Imaging and Cytometry Resources Core at Wayne State University School of Medicine.
DQ-collagen I–based proteolytic activity assay
Cells in 3-D collagen I were washed with warm PBS and incubated overnight at 37°C in serum-free phenol red–free RPMI 1640 supplemented with antibiotics and L-glutamine, in the presence or absence of 10 µg/mL DQ-collagen I. The fluorescence resulting from DQ-collagen I cleavage was visualized with the Zeiss LSM 510 confocal microscope, whereas the fluorescence in the corresponding conditioned medium was measured using a Gemini Spectramax fluorescence plate reader (Molecular Devices), at excitation and emission wavelengths of 485 and 515 nm, respectively.
RNA extraction and analyses
The RNA from tumor tissues and cells cultured in 2-D and 3-D collagen I was extracted (RNeasy Mini kit, Qiagen, Valencia, CA) and reverse-transcribed (iScript cDNA synthesis kit, Bio-Rad, Hercules, CA). q-RT-PCR analysis was performed as described. 32 The sequences of the primers are listed in Supplementary Table S2.
The microarray procedure was previously described 84 with the following modifications. Briefly, after verifying the quality of total RNA, 500 ng of RNA was used to produce Aminoallyl-aRNA using the TargetAMP 1-Round Aminoallyl-aRNA Amplification Kit 101 (Epicentre, Madison, WI). The resulting Aminoallyl-aRNA was reverse-transcribed with SuperScript III Reverse Transcriptase (Invitrogen) and labeled with Alexa Fluor 555 or Alexa Fluor 647 (Molecular Probes). Subsequently, the Agilent 60-mer oligo microarray (Whole Human Genome Arrays 4x44K p/n G4112F) processing protocol was followed.
Locally weighted linear regression (LOWESS) normalization was applied to remove signal intensity–dependent dye bias for each array using the R program (Bioconductor, Seattle, WA). The normalized data were analyzed by the mixed-model SAS 9.1.3 program (SAS Institute Inc., Cary, NC). An approximate F test on least-square means was used to estimate the significance of difference for each gene in each comparison, where P < 0.001 was considered to be statistically different. The false discovery rate (Q value) was calculated for each P value using the R program according to the Storey and Tibshirani method. 85
Miscellaneous procedures
Cell attachment assays were performed based on the previously described method 25 with the following modifications. Cells were seeded at 1 × 10⁵ cells/well in maintenance medium (100 µL/well) on top of polymerized collagen I (100 µL/well) in 96-well plates and incubated for 2 hours at 37°C. After the floating cells were removed, the attached cells were washed with PBS and separated from the collagen matrix as described in the 3-D cell culture section and counted. Invasion and motility assays were performed as described. 86 The motility and invasiveness of M7 cells were normalized against the corresponding Neo control in each assay. Subcellular fractionation and Western blotting analyses were carried out as described. 24 Cells cultured in 3-D were collected after collagen I digestion with collagenase and subjected to cell fractionation and Western blotting analysis. Zymography was performed using an established protocol. 87 For statistical analyses, 1-way analysis of variance (ANOVA) was performed when more than 2 sets of data were analyzed, whereas Student t tests were performed for paired data sets, using SigmaPlot software (Chicago, IL). P values less than 0.001 were considered significant.
Footnotes
Acknowledgements
The authors thank Dr. Rafael Fridman for his generous gift of purified MMP9 and constructive suggestions. They also thank Dr. Erik Sahai for kindly providing the second harmonic generation microscope settings. They further thank Mr. Miao Wu and Mr. Chandra S. Chimakurthy for their critical proofreading of the article.
Declaration of Conflicting Interests
The author(s) declared no potential conflicts of interest with respect to the research, authorship, and/or publication of this article.
Funding
The author(s) disclosed receipt of the following financial support for the research, authorship, and/or publication of this article: This work was supported by the National Institutes of Health (grants CA127735 and CA084176 to S. Sheng), the Fund for Cancer Research (to S. Sheng), and the Ruth Sager Memorial Fund (to S. Sheng).
References
Supplementary Material
Please find the following supplemental material available below.
For Open Access articles published under a Creative Commons License, all supplemental material carries the same license as the article it is associated with.
For non-Open Access articles published, all supplemental material carries a non-exclusive license, and permission requests for re-use of supplemental material or any part of supplemental material shall be sent directly to the copyright owner as specified in the copyright notice associated with the article.