
Abstract
Increasing evidence suggests that the disruption of androgen-mediated cellular processes, such as cell proliferation and cell differentiation, contributes to the development of early-stage androgen-dependent prostate cancers. Large-scale mRNA profiling experiments have paved the way in identifying androgen-regulated gene networks that control the proliferation, survival, and differentiation of prostate cancer cells. Despite these extensive research efforts, it remains to be determined whether all androgen-mediated mRNA changes faithfully translate into changes in protein abundance that influence prostate tumorigenesis. Here, we report on a mass spectrometry–based quantitative proteomics analysis that identified known androgen signaling pathways and also novel, androgen-sensitive microsome-associated proteins and protein networks that had not been discovered by gene network studies in human LNCaP prostate cancer cells. Androgen-sensitive microsome-associated proteins encoded components of the insulin growth factor-1 (IGF-1), phosphoinositide 3-kinase (PI3K)/AKT, and extracellular signal–regulated kinase (ERK)/mitogen-activated protein kinase (MAPK) signaling pathways. Further bioinformatic analyses showed most of the androgen-sensitive microsome-associated protein networks play roles in cell proliferation and differentiation. Functional validation experiments showed that the androgen-sensitive microsome-associated proteins Janus kinase 2 (JAK2) and I-kappa B kinase complex-associated protein (IKAP) modulated the expression of prostate epithelial and neuronal markers, attenuated proliferation through an androgen receptor–dependent mechanism, and co-regulated androgen receptor–mediated transcription in LNCaP cells. Further biochemical analyses showed that the increased proliferation in JAK2 knockdown cells was mediated by activation of the mammalian target of rapamycin (mTOR), as determined by increased phosphorylation of several downstream targets (p70 S6 kinase, translational repressor 4E-BP1, and 40S ribosomal S6 protein). We conclude that the expression of microsome-associated proteins that were previously implicated in the tumorigenesis of prostate epithelial cells is strongly influenced by androgens. These findings provide a molecular framework for exploring the mechanisms underlying prostate tumorigenesis and how these protein networks might be attenuated or potentiated in disrupting the growth and survival of human prostate cancers.
Introduction
Androgens are the primary sex hormones required for normal development, maintenance, and differentiation of the male phenotype. Acting through the androgen receptor (AR), a member of the nuclear hormone receptor family, they influence gene expression programs that are coupled to the differentiation of cells and the development of tissues and organs. 1
The pathological actions of AR in men are best characterized with respect to the development and progression of human prostate cancer. 2 Landmark studies have shown that a substantial proportion of localized prostate cancers contain gene fusions. Specifically, approximately 50% of prostate cancers harbor gene fusions that place the ETS family transcription factors under the control of androgen-regulated genes,3-6 in many cases generating truncated ETS fusion proteins that facilitate cell migration and invasion when overexpressed in primary or immortalized benign human prostate epithelial cells.7-8 Recent work has suggested that the development of prostate cancer can also be facilitated by molecular signals that disrupt the androgen-mediated differentiation of prostate epithelial cells. For example, specific fusions juxtaposing sequences from the androgen-regulated transmembrane protease serine 2 protein with the ETS family member transcription factor ERG (TMPRSS2-ERG fusions) were shown to promote the lineage-specific dedifferentiation of human prostate epithelial cells by activating the H3K27 methyltransferase EZH2 polycomb group protein. 9 In a similar vein, a study in mice recently showed that simultaneous overexpression of the c-SRC tyrosine kinase and AR induces undifferentiated invasive prostate cancer, which is characterized by increased expression of markers of the epithelial-mesenchymal transition (EMT). 10
How androgens control cell proliferation, survival, and differentiation in the context of prostate cancer tumorigenesis has been addressed by a multitude of experiments that have profiled expression, primarily at the mRNA level.11-20 Moreover, the list of androgen-regulated genes that play roles in prostate cancer has continued to expand since high-throughput genomic sequencing technologies became available. 21 Thus, it could be argued that the molecular characterization of gene networks that are regulated by androgens at the mRNA level in the context of human prostate cancer has reached saturation. 21 Unfortunately, this depth of molecular analysis has not been attained at the protein level. Indeed, the molecular effects of androgen activity, with respect to both acute and chronic responses, on proteins expressed in human prostate cancer cells remain poorly defined. 21 For example, it remains to be determined if the androgen-regulated gene networks defined at the mRNA level control changes in protein abundance in prostate cancer cells. This concern has particular significance in light of a recent study demonstrating that, in mammalian cells, cellular protein abundance is controlled predominantly at the level of translation. 22 For example, androgen-regulated protein networks may encode novel regulators of prostate tumorigenesis that are under translational control. Thus, a full molecular-level understanding of how androgens influence tumorigenesis within the prostate will require the comprehensive identification of androgen-sensitive proteins and of the protein networks involved in androgen-mediated cell proliferation, survival, and differentiation.
Multiple studies have already identified androgen-sensitive proteins and pathways in human prostate cancer cells.21,23-30 For example, androgens were recently shown to regulate the expression of aminoacyl tRNA synthetases involved in protein biosynthesis, suggesting that this pathway is dysregulated in prostate cancer. 25 Another proteomic study of microsomes from LNCaP prostate cancer cells showed that androgens co-regulate the protein networks involved in mitochondrial and RNA metabolism; 27 this was the first proteomic study to provide biochemical evidence that androgens control cellular processes by coordinating the expression of protein modules. However, a major limitation of this analysis was that a large number of proteins involved in acute or chronic membrane and membrane-associated signal transduction pathways went undetected. To expand upon those initial findings, we have carried out a replicate proteomic analysis on LNCaP cells, with the aim of defining a broader spectrum of androgen-sensitive microsome-associated proteins involved in the proliferation, survival, and differentiation of human prostate cancer cells. Here, we report the identification of novel androgen-sensitive proteins in LNCaP cells, in this case linked to cell proliferation and differentiation, through proteomic profiling of sodium carbonate–extracted microsomes. We found that proteins involved in insulin growth factor-1 (IGF-1), phosphoinositide 3-kinase (PI3K)/AKT, and extracellular signal–regulated kinase (ERK)/mitogen-activated protein kinase (MAPK) pathways are androgen-sensitive targets in LNCaP-derived microsomes. Our bioinformatic analyses highlighted key regulatory proteins and identified the molecular architecture of protein networks that are linked to the androgen-mediated proliferation and differentiation of prostate cancer cells. Functional analyses showed that, in LNCaP cells, the novel androgen-sensitive proteins Janus kinase 2 (JAK2) and I-kappa B kinase complex-associated protein (IKAP) modulated androgen-mediated AR-dependent proliferation as well as the expression of prostate epithelial and neuronal epithelial markers and acted as co-regulators of AR-mediated transcription. Furthermore, JAK2 antagonized androgen-mediated proliferation through the mTOR pathway, thus establishing a new link between JAK2 and mTOR cellular growth pathways in LNCaP cells. Lastly, the androgen-sensitive tyrosine kinases c-SRC and c-YES were found to co-regulate AR-mediated transcription. Our proteomic findings identify membrane-associated proteins and protein networks that likely contribute to both the physiological and pathophysiological actions of androgens on androgen-sensitive human prostate cancers.
Results
Identification of membrane-associated androgen-sensitive proteins in prostate cancer cells
A previous study in LNCaP cells showed that androgens coordinately control networks of membrane-associated proteins that are critical to cellular metabolism (e.g., mitochondrial metabolism, RNA processing). 27 We sought to extend these findings by establishing whether androgens can modulate the expression of a broader spectrum of membrane-associated proteins that have not been implicated in the proliferation, survival, and differentiation of human prostate cancer cells. To this end, we profiled LNCaP cells under the growth-inhibitory state resulting from androgen deprivation, and in the context of exposure to high concentrations of androgen, replicating the exact experimental conditions of the original study.
Crude microsomes were isolated from LNCaP cells after a 72-hour incubation in either androgen-depleted (AD) growth medium (e.g., 10% charcoal-depleted fetal bovine serum [FBS]) or androgen-stimulated (AS) growth medium (e.g., 10% charcoal-depleted FBS supplemented with 10 nM synthetic androgen R1881). Because our goal was to profile proteins beyond those involved in RNA and mitochondrial metabolism, 27 the crude AD and AS microsomal pellets were subjected to a single wash with sodium carbonate buffer (pH 11.5), which facilitates the differential extraction of peripheral and integral membrane proteins. 31 The sodium carbonate–extracted proteins were subjected to isotope-coded affinity tag (ICAT) labeling (AD d0 reagent, light ICAT reagent; AS d8 reagent, heavy ICAT reagent) and analyzed by microcapillary liquid chromatography tandem mass spectrometry (µLC-MS/MS) (Fig. 1A) exactly as reported previously. 27 This experiment resulted in the quantification of 1,406 ICAT-labeled proteins (ProteinProphet score [http://proteinprophet.sourceforge.net/] = 0.9; false discovery rate [FDR] <5%) (Fig. 1B and Suppl. Table S1), an increase of 342 quantified proteins over the number identified in the original study. 27
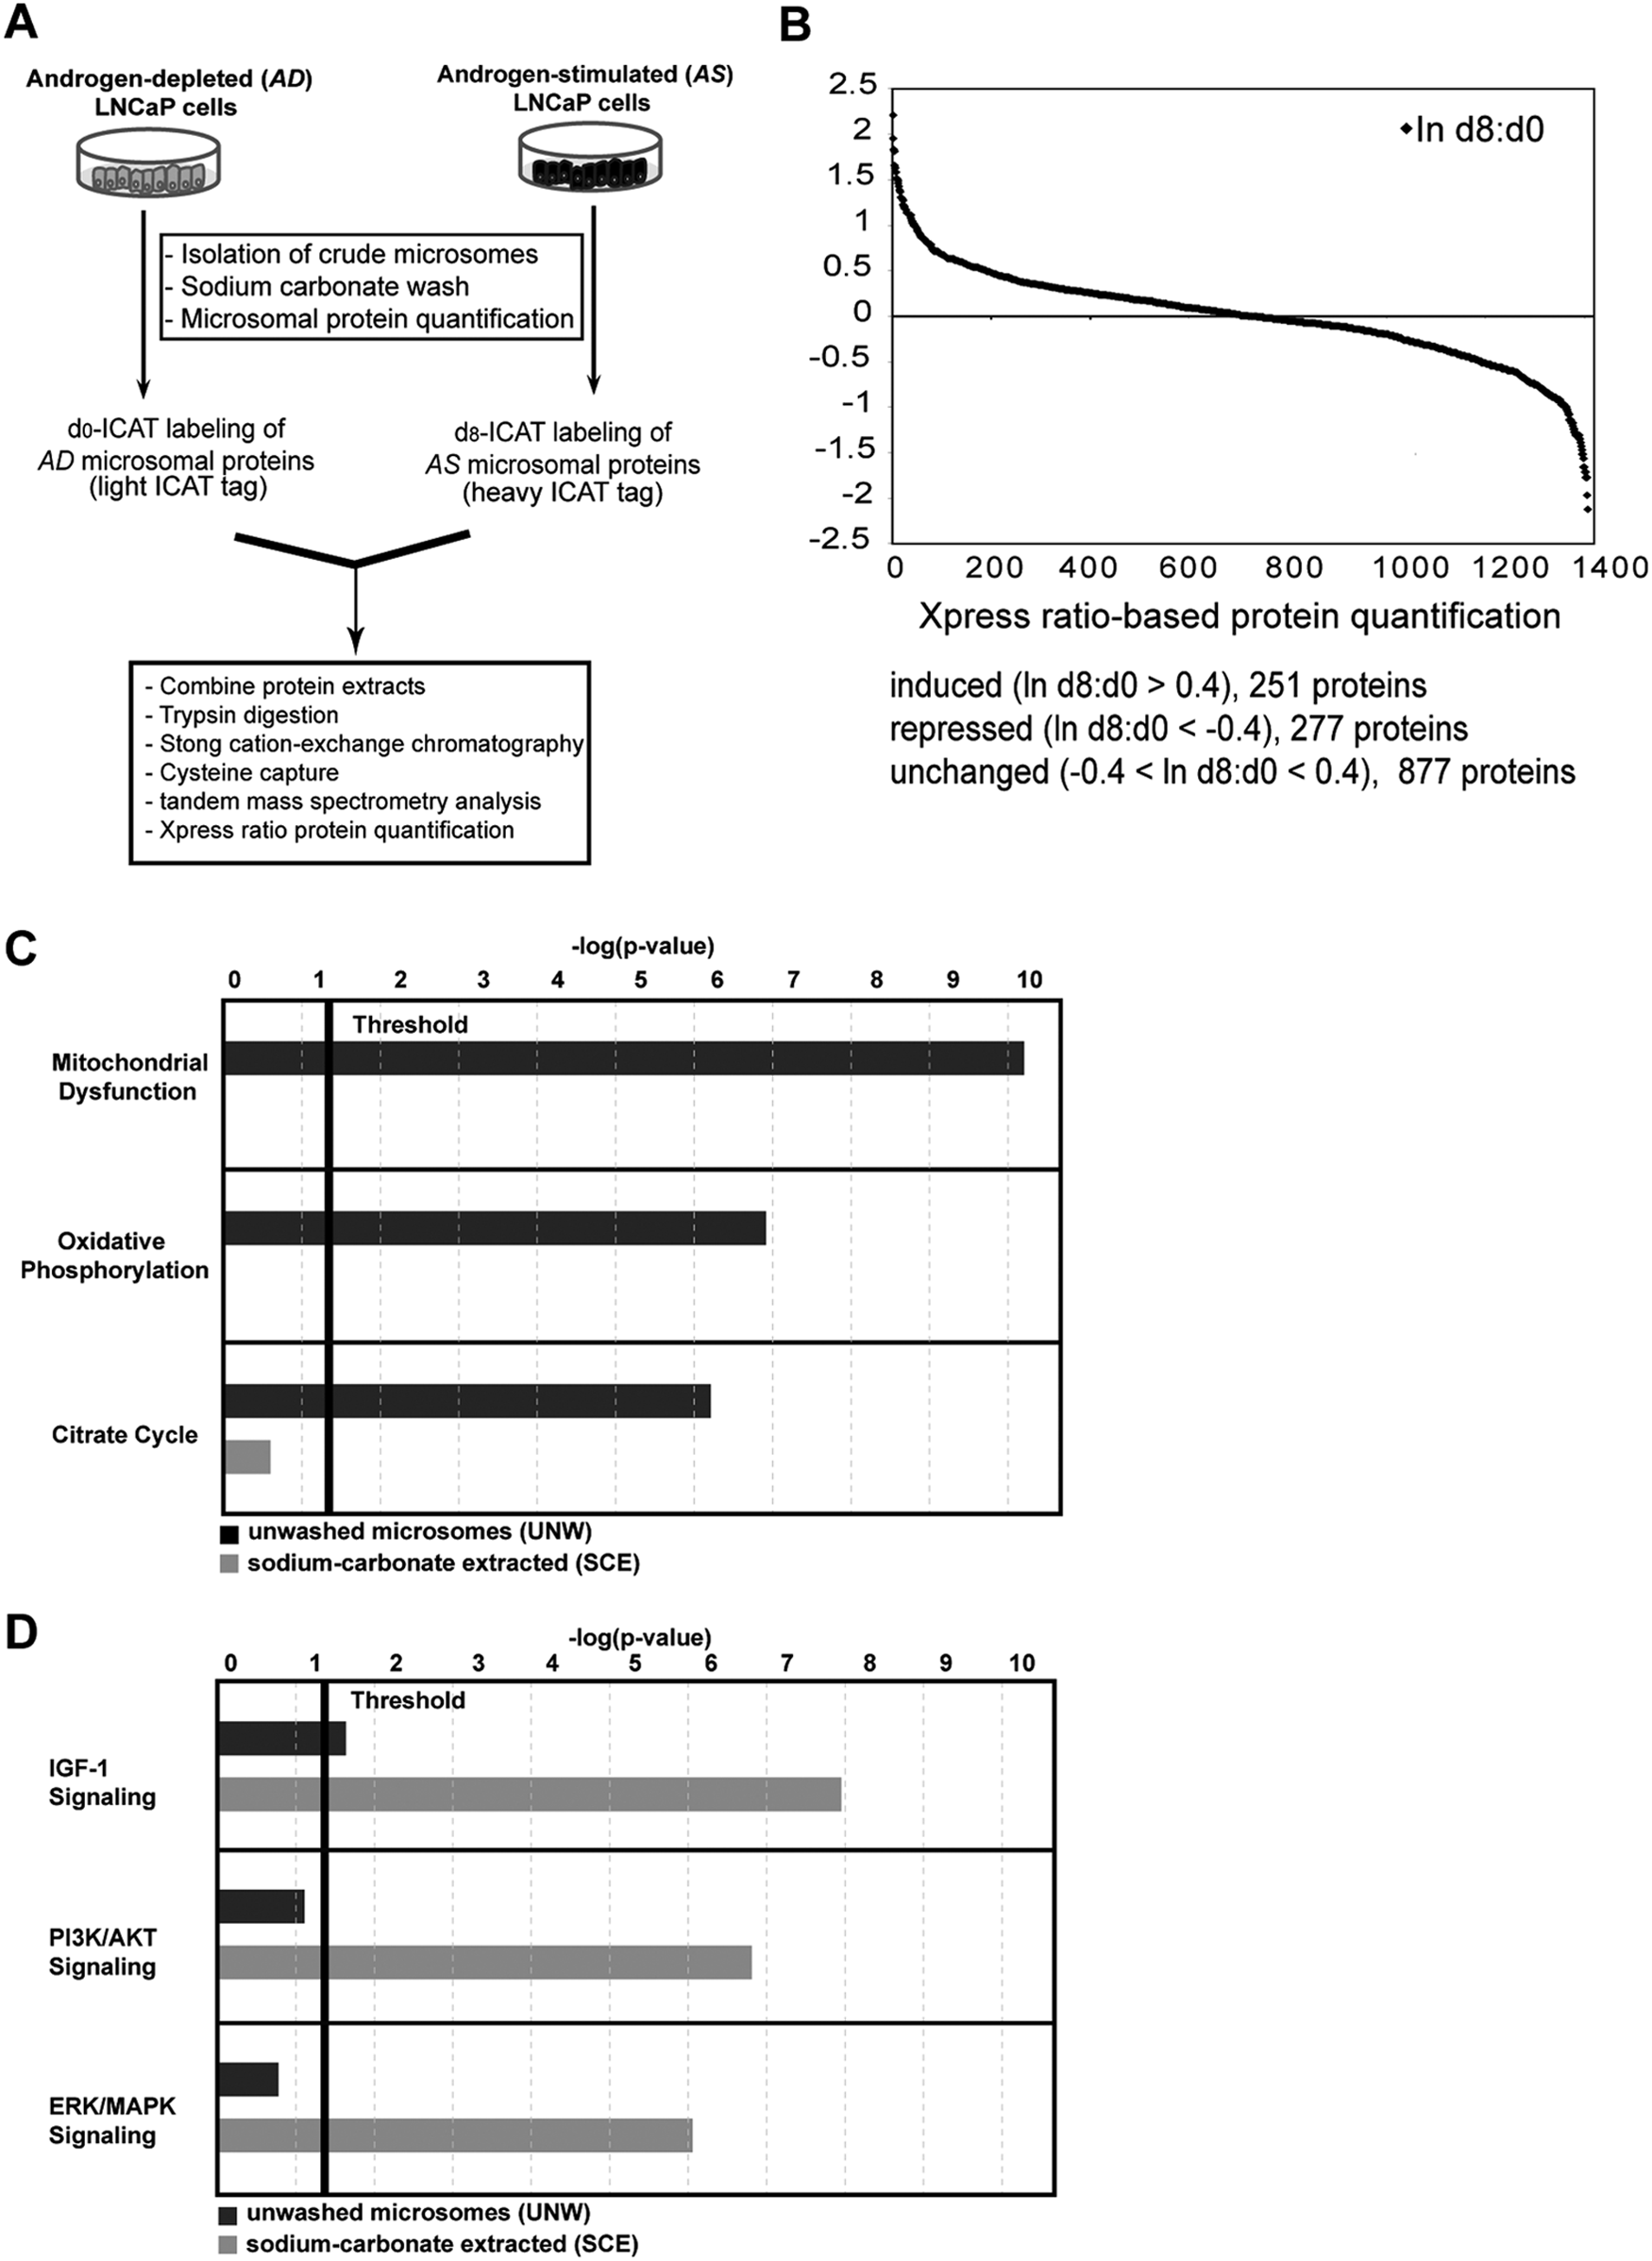
Molecular analysis of androgen-sensitive microsome-associated proteins in LNCaP prostate cancer cells. (
Next, we wanted to compare the degree of overlap between the protein datasets obtained from the sodium carbonate–extracted (SCE) and unwashed (UNW) microsomes. This analysis would address several issues. Firstly, it would establish whether the proportion of proteins involved in cellular metabolism (e.g., RNA and mitochondrial metabolism) was reduced in the SCE versus the UNW dataset. Secondly, it would make it possible to compare the compositions of specific protein networks in the SCE and UNW datasets. Lastly, it would establish how congruent or incongruent androgen-mediated changes in protein expression were between the SCE and UNW datasets.
In total, 441 proteins were found to be common to the SCE and UNW datasets (Table 1), demonstrating that proteomic overlap between the experiments was considerable. Statistically overrepresented protein networks in the SCE and UNW datasets were identified using the Ingenuity Pathway Analysis (IPA) bioinformatics software program (Ingenuity Systems, Redwood City, CA). As we had suspected, the 3 top-ranked protein networks in the UNW dataset are related to mitochondrial dysfunction, oxidative phosphorylation, and the citrate cycle (Fig. 1C and Suppl. Fig. S1), and these particular networks were nearly undetectable in the SCE dataset (Fig. 1C and Suppl. Fig. S1). Moreover, the 3 top-ranked protein networks in the SCE dataset were the canonical PI3K, AKT, and IGF-1 signaling pathways (Fig. 1D and Suppl. Fig. S1), and of these, only the IGF-1 pathway was detected at statistically significant levels in the UNW dataset (Fig. 1D). Therefore, even though the UNW and SCE datasets shared considerable proteomic overlap (Table 1), the SCE dataset indeed included a smaller proportion of proteins involved in cellular metabolism (Fig. 1D and Suppl. Fig. S1).
Expression of Microsome-Associated Proteins
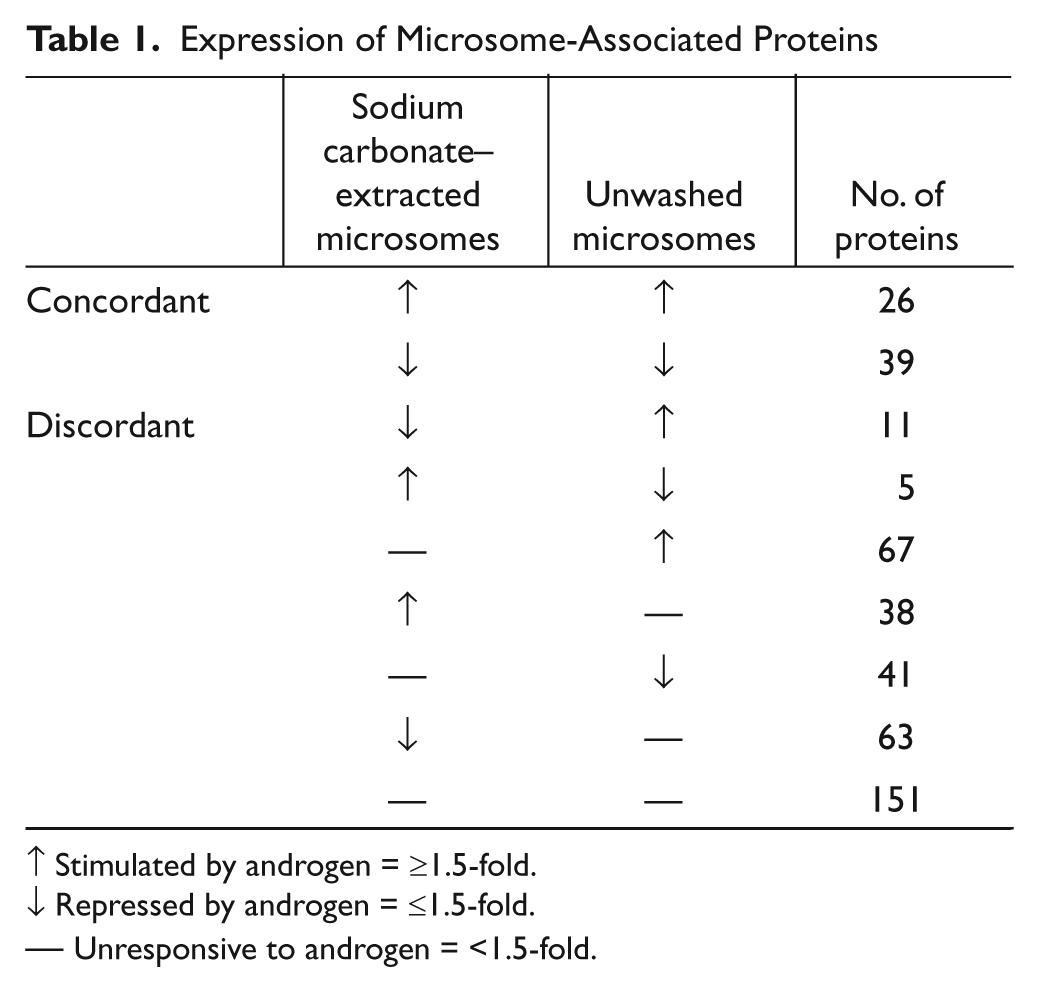
↑ Stimulated by androgen = ≥1.5-fold.
↓ Repressed by androgen = ≤1.5-fold.
— Unresponsive to androgen = <1.5-fold.
To determine whether changes in androgen-mediated protein expression between the UNW and SCE datasets are congruent, we annotated proteins in both datasets as androgen sensitive based on an arbitrarily assigned threshold of a 1.5-fold change in expression. Reassessment of the UNW and SCE datasets in this way defined 81 androgen-sensitive proteins as overlapping (Table 1). Congruent changes in expression were observed for approximately 80% (65/81) of these proteins (Table 1), revealing that androgen-mediated changes in protein expression between the SCE and UNW datasets were largely conserved. In summary, the sodium carbonate wash specifically reduces the proportion of membrane-associated proteins that are involved in cellular metabolism, making it possible to identify and characterize an expanded spectrum of signal transduction networks over that identified in UNW microsomes. 27
Network analyses of androgen-sensitive proteins in prostate cancer cells
Next, we set out to characterize the physical relationships among androgen-sensitive proteins at the molecular level and to determine if specific protein modules in the SCE dataset were androgen co-regulated. Therefore, we used the GeneGo network algorithm (St. Joseph, MI) to generate protein-protein interaction (PPI) networks of androgen-sensitive proteins. The PPI graph that was generated identified 2 populations of androgen-sensitive proteins: one with a low degree of connectivity (Suppl. Fig. S2) and a second with a high degree (Fig. 2). Notably, the AR, c-SRC tyrosine protein kinase, and β-catenin hubs were the most highly connected in this network. Moreover, in the cases of many interacting proteins, expression or activity was directly controlled by AR, c-SRC, and β-catenin (Fig. 2). These findings were not completely unexpected, as multiple studies of prostate cancer cells have demonstrated crosstalk among the 3 signaling pathways represented by these proteins.10,32-44 Moreover, c-SRC and β-catenin interact with many partner proteins, and thus, both molecules have been implicated in a number of signal transduction pathways at the molecular level.45-48 Lastly, concordant changes in expression were observed for many of the hubs (e.g., 3-4 PPIs), suggesting that androgens contribute to their expression in LNCaP cells (Fig. 2).
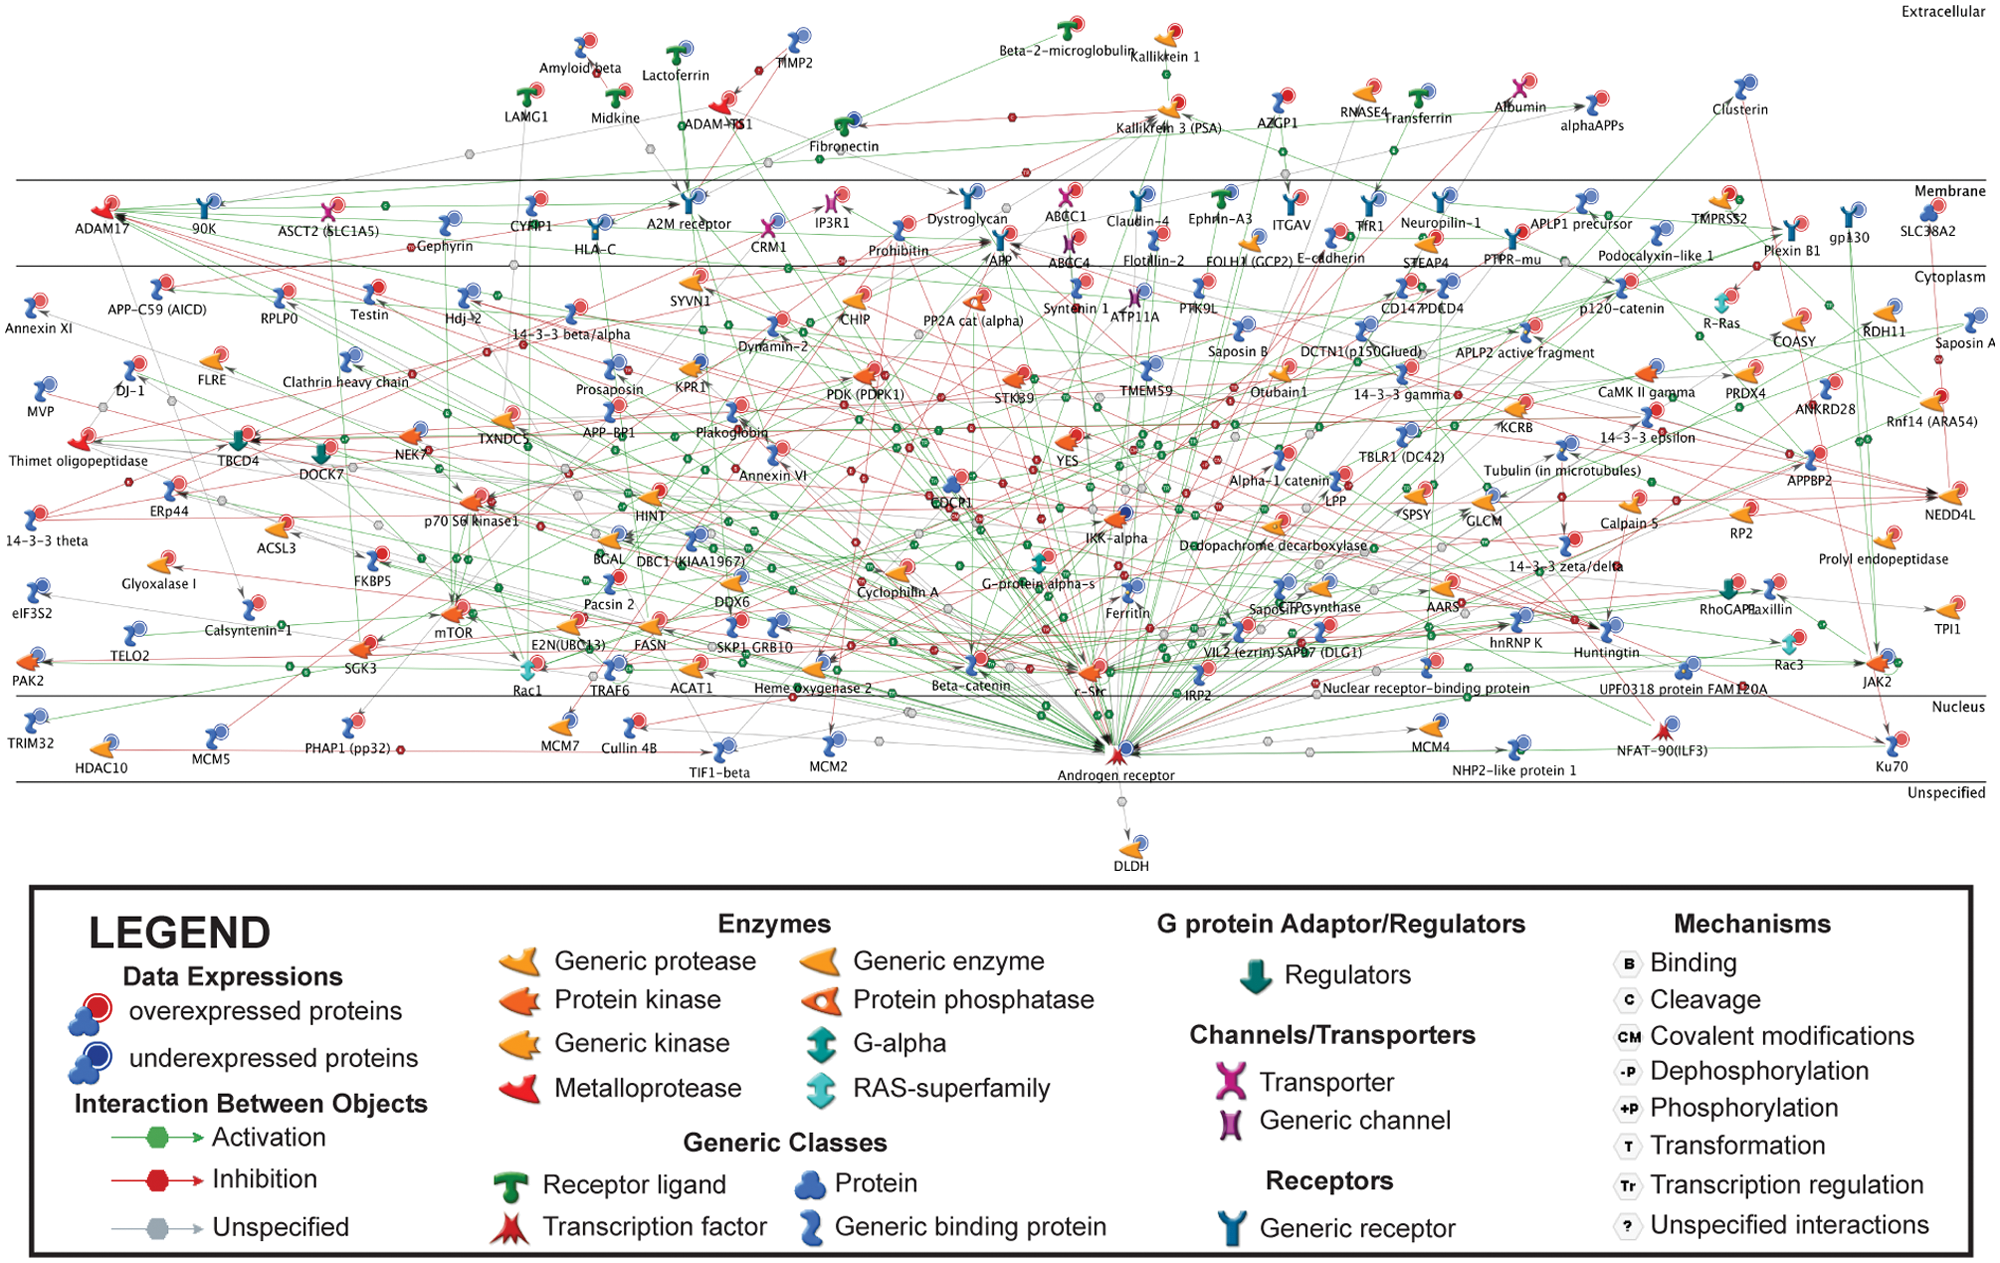
Protein-protein interaction network of androgen-sensitive microsome-associated proteins in LNCaP cells. Androgen-sensitive microsome-associated proteins were uploaded into the GeneGo bioinformatics software program. Protein-protein interactions annotated in the literature are depicted based upon the cellular (or extracellular) sites in which they occur. Red and blue nodes/objects represent androgen-sensitive microsome-associated proteins whose expressions are increased (AS) or decreased (AD), respectively, in sodium carbonate–extracted (SCE) microsomes. The network edges or colored arrows represent the directionality, effect, and mechanism underlying the interactions between proteins (red = inhibitory, green = activating, and gray = unspecified).
Given that androgens directly influence the proliferation, survival, and differentiation of human prostate cancers, we wanted to identify androgen-sensitive protein networks that might influence these biological processes in LNCaP cells. To this end, we again uploaded androgen-sensitive proteins identified in the SCE dataset into the GeneGo network algorithm SCE and then used the GO function to identify the processes in which the top-ranked protein networks are involved. For the first-ranked network, these included regulation of cell proliferation, regulation of cell cycle, regulation of mitotic cell cycle, positive regulation of cell proliferation, and the cellular response to organic substances (Table 2). The root node proteins that formed this network included AR, c-SRC, Janus protein kinase 2 (JAK2), prohibitin, and p70 S6 kinase 1 (Table 2). Notably, AR was identified as a central hub in the network that transcriptionally controlled the expression of multiple proteins linked to cell proliferation (Fig. 3); similarly, c-myc was a central hub in the network that transcriptionally controlled cell cycle and cell proliferation (Fig. 3). The GO processes of the second-ranked protein network were morphogenesis, neurogenesis, organization of cell junctions, cell development, and the movement of cellular components. The GO processes of the third-ranked protein network included disassembly of the extracellular matrix, cell spreading (substrate adhesion dependent), assembly of hemidesmosomes, assembly of cell-substrate junctions, and the synaptic transmission involved in micturition (Table 2). In LNCaP cells, androgens are known to activate AR and promote secretory epithelial differentiation; without androgens, a neuroendocrine transdifferentiation program is activated.49,50 Thus, the observed enrichment for protein networks involved in cellular remodeling provided further biochemical evidence that androgens have a strong influence on cell differentiation programs in human prostate cancer cells. Notably, none of these networks was among the top-ranked androgen-sensitive networks identified in the UNW dataset (Suppl. Table S2), an observation that highlights the qualitative differences in the signaling proteins in the SCE and UNW datasets. These in silico results strongly suggest that AR and c-myc co-regulate protein networks involved in androgen-triggered proliferation of LNCaP cells. Moreover, they suggest that other androgen-sensitive regulatory molecules (e.g., c-SRC, Rac1) have roles in the differentiation of human prostate cancer cells.
Top-Ranked Androgen-Sensitive Protein Networks
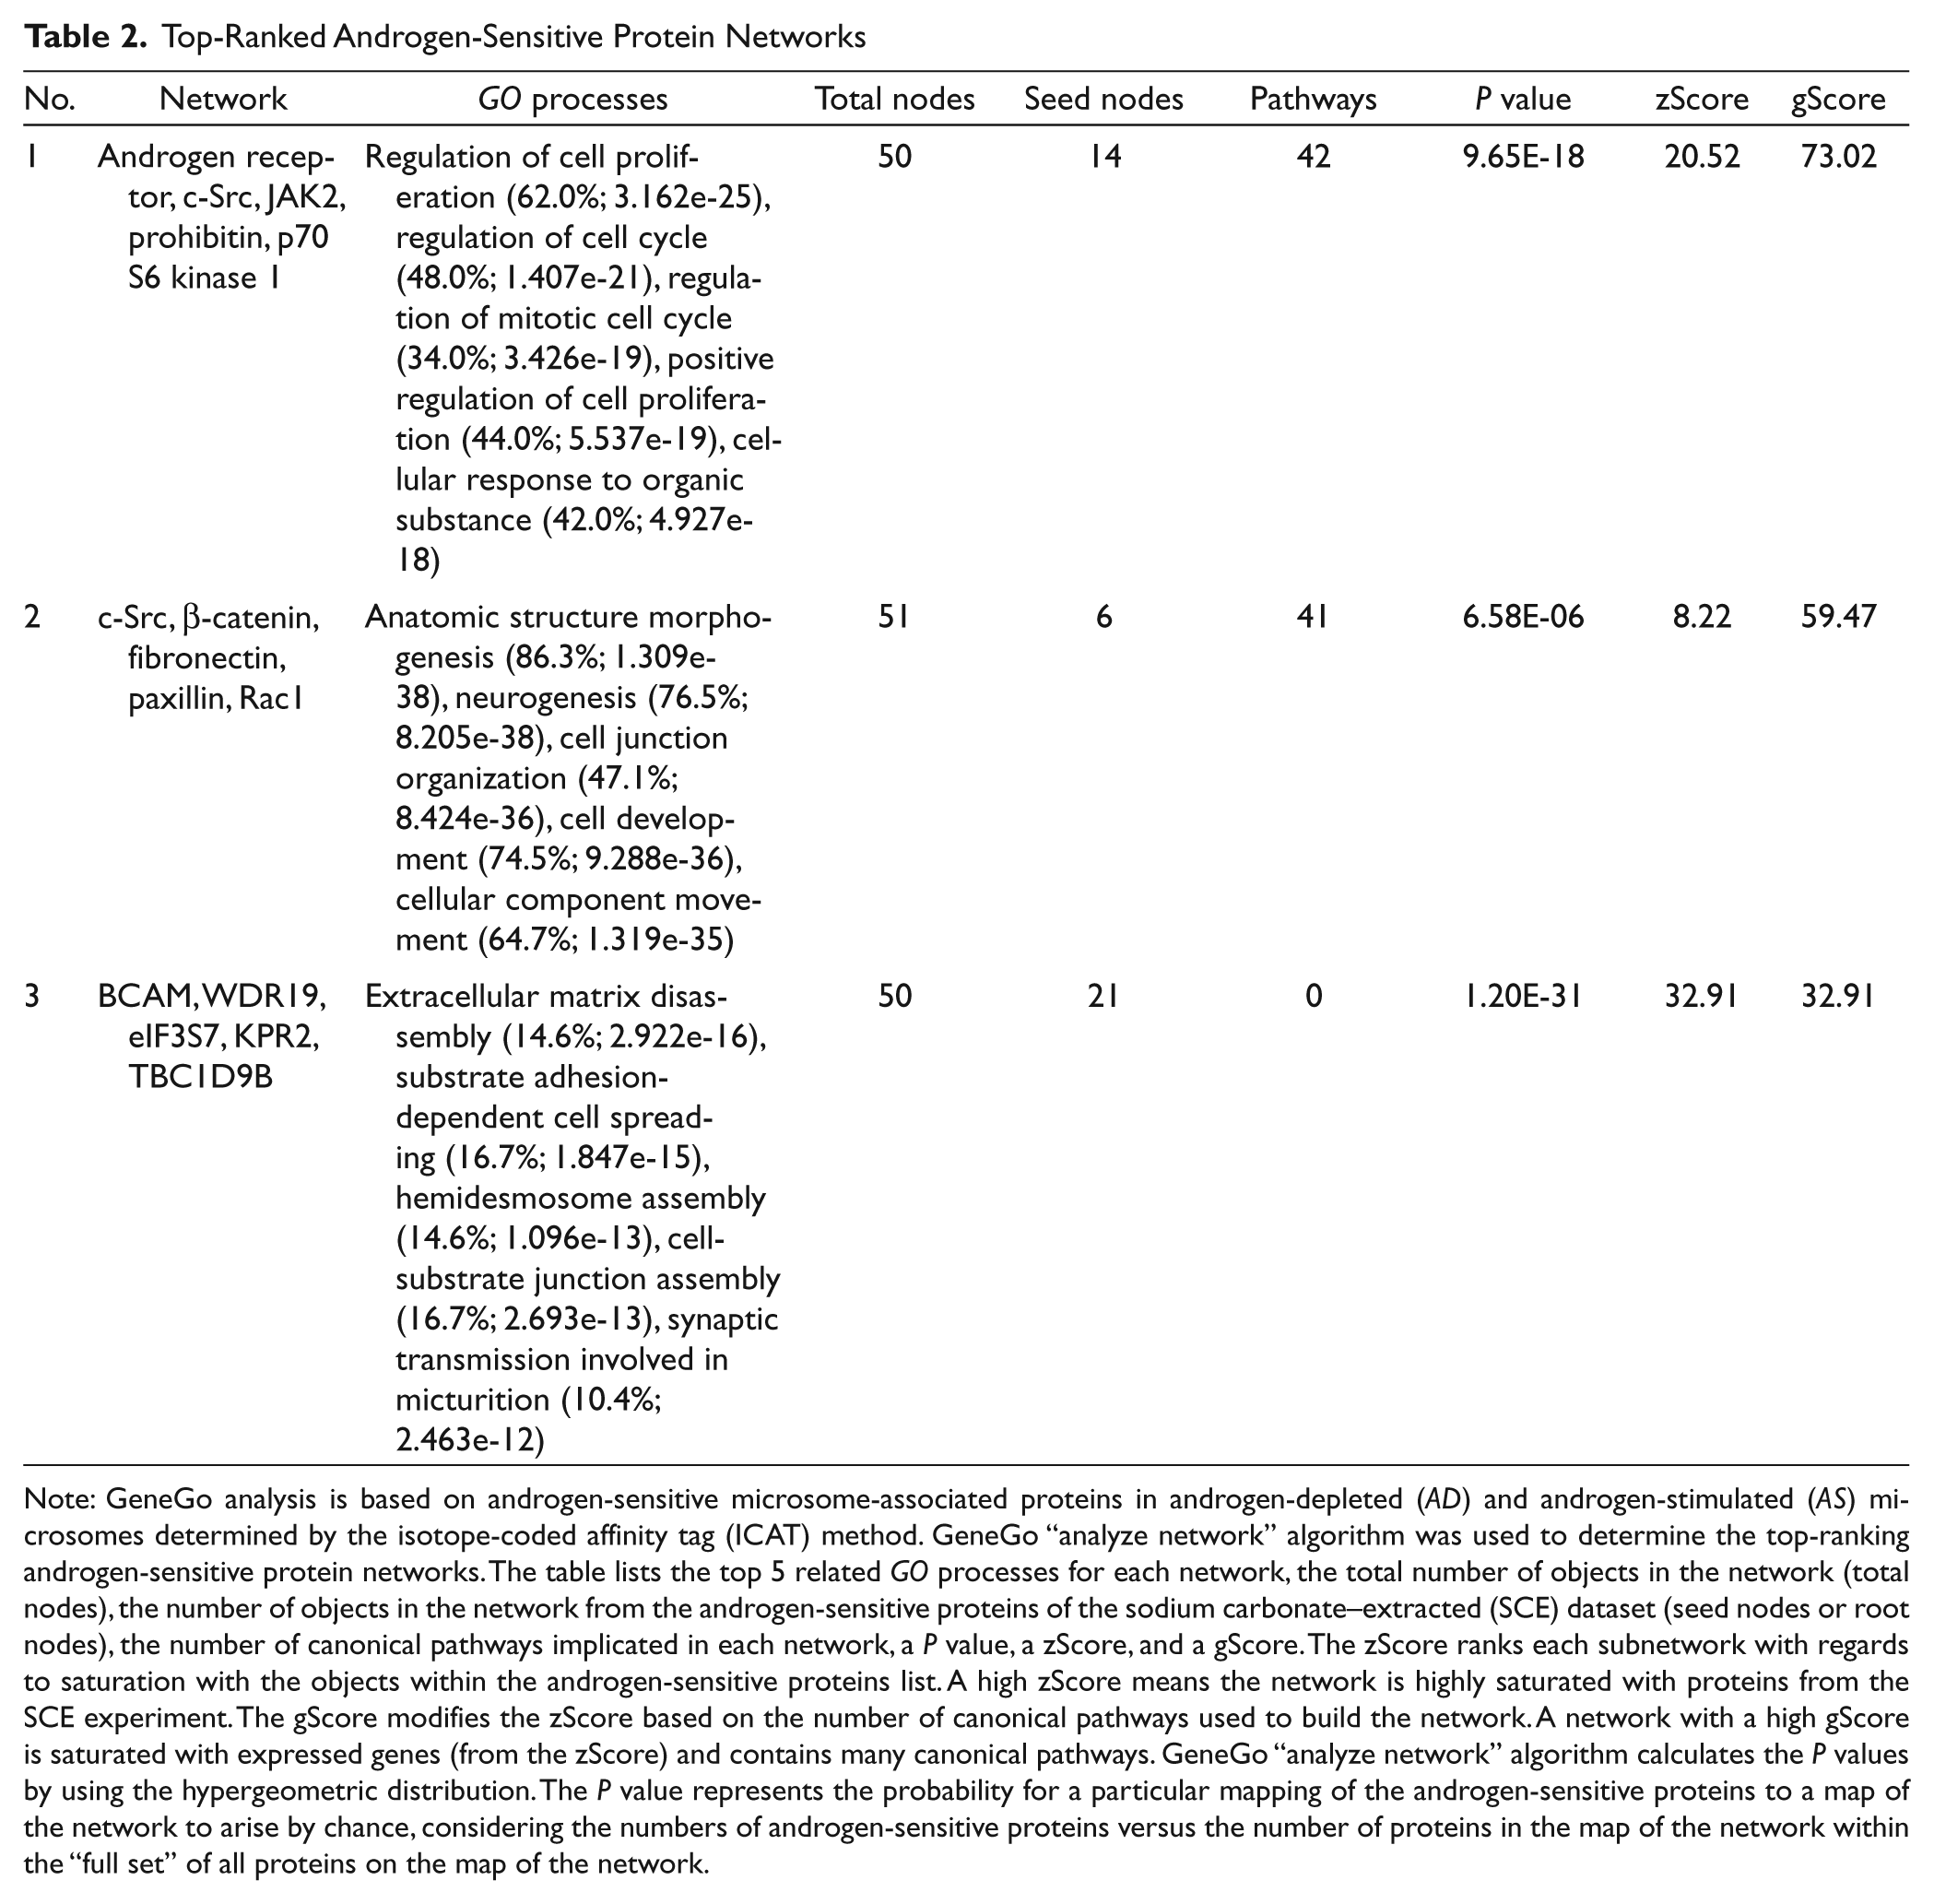
Note: GeneGo analysis is based on androgen-sensitive microsome-associated proteins in androgen-depleted (AD) and androgen-stimulated (AS) microsomes determined by the isotope-coded affinity tag (ICAT) method. GeneGo “analyze network” algorithm was used to determine the top-ranking androgen-sensitive protein networks. The table lists the top 5 related GO processes for each network, the total number of objects in the network (total nodes), the number of objects in the network from the androgen-sensitive proteins of the sodium carbonate–extracted (SCE) dataset (seed nodes or root nodes), the number of canonical pathways implicated in each network, a P value, a zScore, and a gScore. The zScore ranks each subnetwork with regards to saturation with the objects within the androgen-sensitive proteins list. A high zScore means the network is highly saturated with proteins from the SCE experiment. The gScore modifies the zScore based on the number of canonical pathways used to build the network. A network with a high gScore is saturated with expressed genes (from the zScore) and contains many canonical pathways. GeneGo “analyze network” algorithm calculates the P values by using the hypergeometric distribution. The P value represents the probability for a particular mapping of the androgen-sensitive proteins to a map of the network to arise by chance, considering the numbers of androgen-sensitive proteins versus the number of proteins in the map of the network within the “full set” of all proteins on the map of the network.
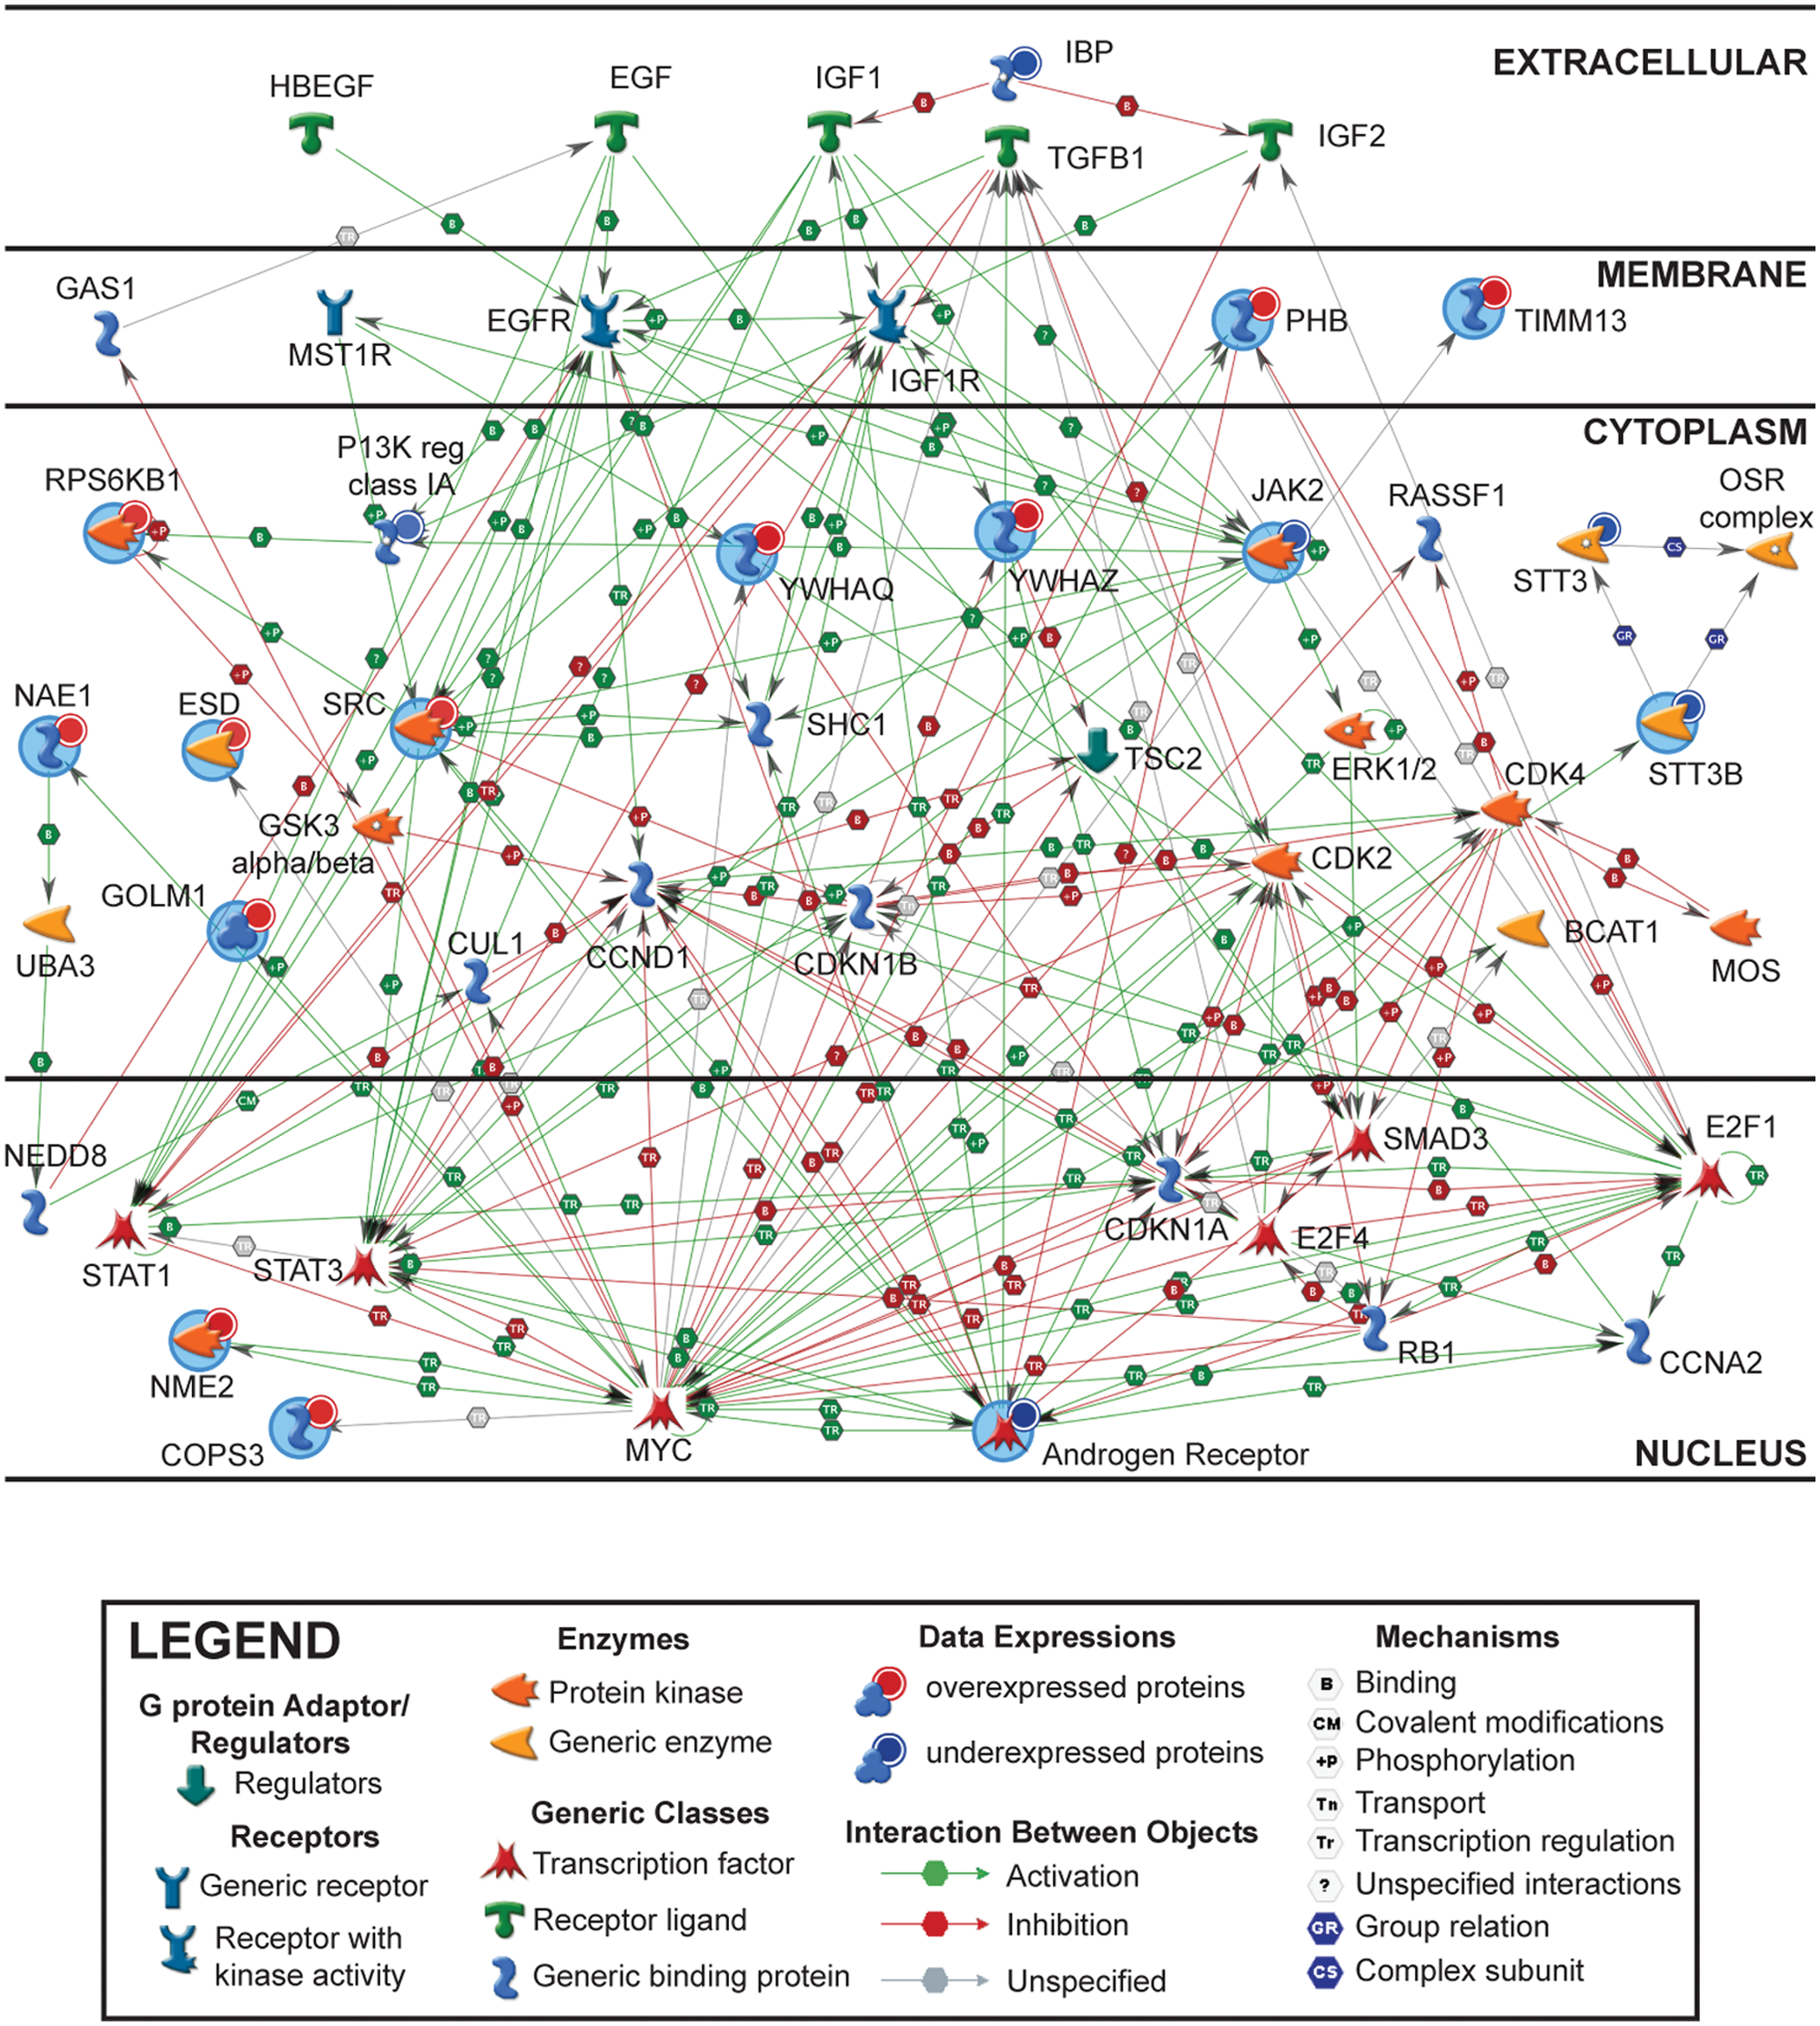
Top-ranked protein network of androgen-sensitive microsome-associated proteins in LNCaP cells. Androgen-sensitive microsome-associated proteins were uploaded into the GeneGo bioinformatics software program to identify the statistically overrepresented biological networks in androgen-depleted (AD) and androgen-stimulated (AS) sodium carbonate–extracted (SCE) microsomes. Protein-protein interactions are depicted based upon the cellular (or extracellular) sites in which they occur. The colored arrows represent directionality, effect, and mechanisms underlying the interaction between proteins (red = inhibitory, green = activation, and gray = unspecified). Proteins highlighted with the light blue circle are those that were assigned as a root node or starting terminal by the GeneGo “analyze network” algorithm. Red and blue nodes/objects represent androgen-sensitive microsome-associated proteins whose expressions are increased (AS) or decreased (AD), respectively, in SCE microsomes.
Because AR-mediated transcription is the primary mechanism by which androgens control a broad spectrum of biological processes and cellular responses in human prostate cancer cells, we tested the possibility that auxiliary transcription factors can co-regulate the expression of androgen-sensitive proteins in LNCaP cells. Specifically, the GeneGo network algorithm was used to identify androgen-sensitive subnetworks centered on transcription factors. This analysis identified the top 10 transcription factors in the rank order of specific protein 1 (SP1), hepatocyte nuclear factor alpha (HNF4-α), c-myc, AR, p53, estrogen receptor alpha (ESR1), transcription factor AP-1, early growth response protein 1 (EGR1), cyclic AMP-responsive element-binding protein 1 (CREB1), and nuclear factor-kappa B (NF-KB) (Table 3, top 5 depicted). Notably, a subpopulation of androgen-sensitive proteins in the top-ranked SP1 network appeared to be transcriptionally co-regulated by SP1 and AR (Suppl. Fig. S3). This cohort of proteins included the multidrug resistance-associated protein 1 (ABCC1), disintegrin and metalloproteinase domain-containing protein 17 (ADAM17), fatty acid synthase (FASN), PSA, serine threonine 39 (STK39), transmembrane serine protease 2 (TMPRSS2), and ezrin (VIL2) (Suppl. Fig. S3 and Suppl. Table S3). To a lesser extent, AR co-regulation of androgen-sensitive proteins was also observed between HNF4-α, c-myc, p53, and ESR1 (Suppl. Table S4 and Suppl. Figs. S4-S7). Moreover, because many of the androgen-sensitive proteins displayed concordant expression patterns in the AR transcription factor network, we suspect that changes in protein expression were regulated at the level of transcription (Fig. 4). In summary, these in silico analyses suggest that ancillary transcription factors have the potential to co-regulate AR-mediated transcriptional responses in LNCaP cells.
Top-Ranked Transcription Factor Networks
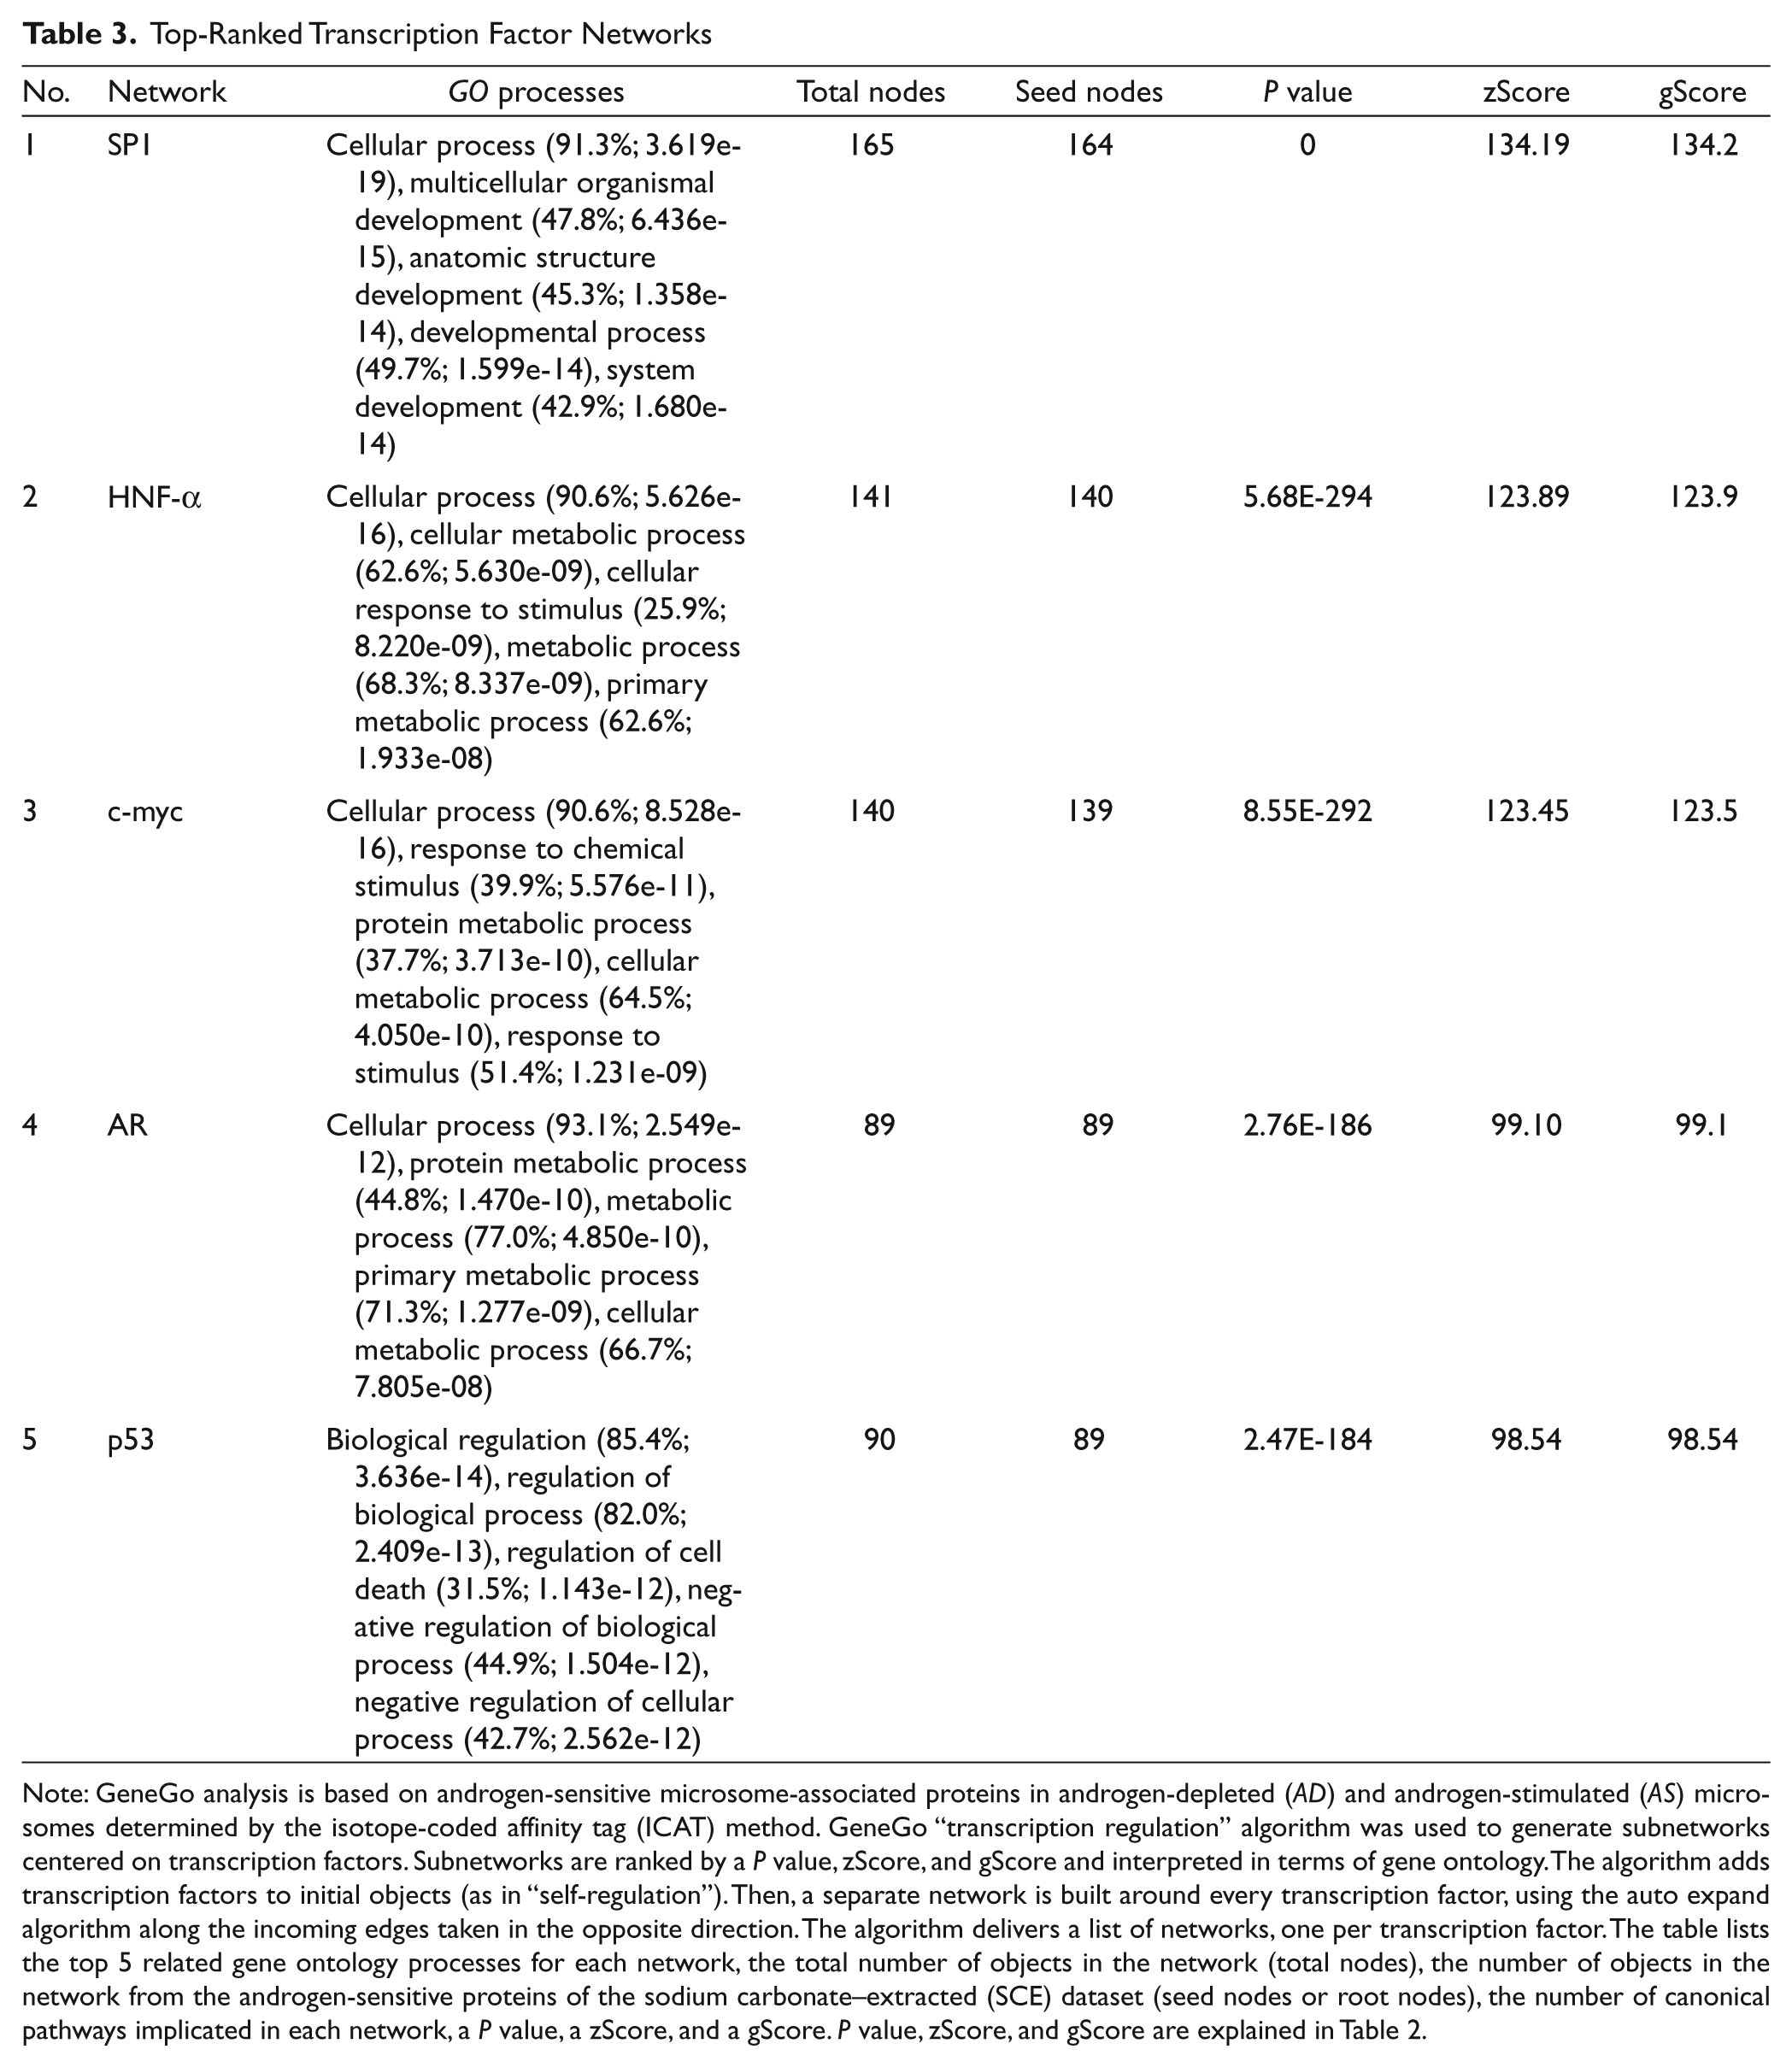
Note: GeneGo analysis is based on androgen-sensitive microsome-associated proteins in androgen-depleted (AD) and androgen-stimulated (AS) microsomes determined by the isotope-coded affinity tag (ICAT) method. GeneGo “transcription regulation” algorithm was used to generate subnetworks centered on transcription factors. Subnetworks are ranked by a P value, zScore, and gScore and interpreted in terms of gene ontology. The algorithm adds transcription factors to initial objects (as in “self-regulation”). Then, a separate network is built around every transcription factor, using the auto expand algorithm along the incoming edges taken in the opposite direction. The algorithm delivers a list of networks, one per transcription factor. The table lists the top 5 related gene ontology processes for each network, the total number of objects in the network (total nodes), the number of objects in the network from the androgen-sensitive proteins of the sodium carbonate–extracted (SCE) dataset (seed nodes or root nodes), the number of canonical pathways implicated in each network, a P value, a zScore, and a gScore. P value, zScore, and gScore are explained in Table 2.
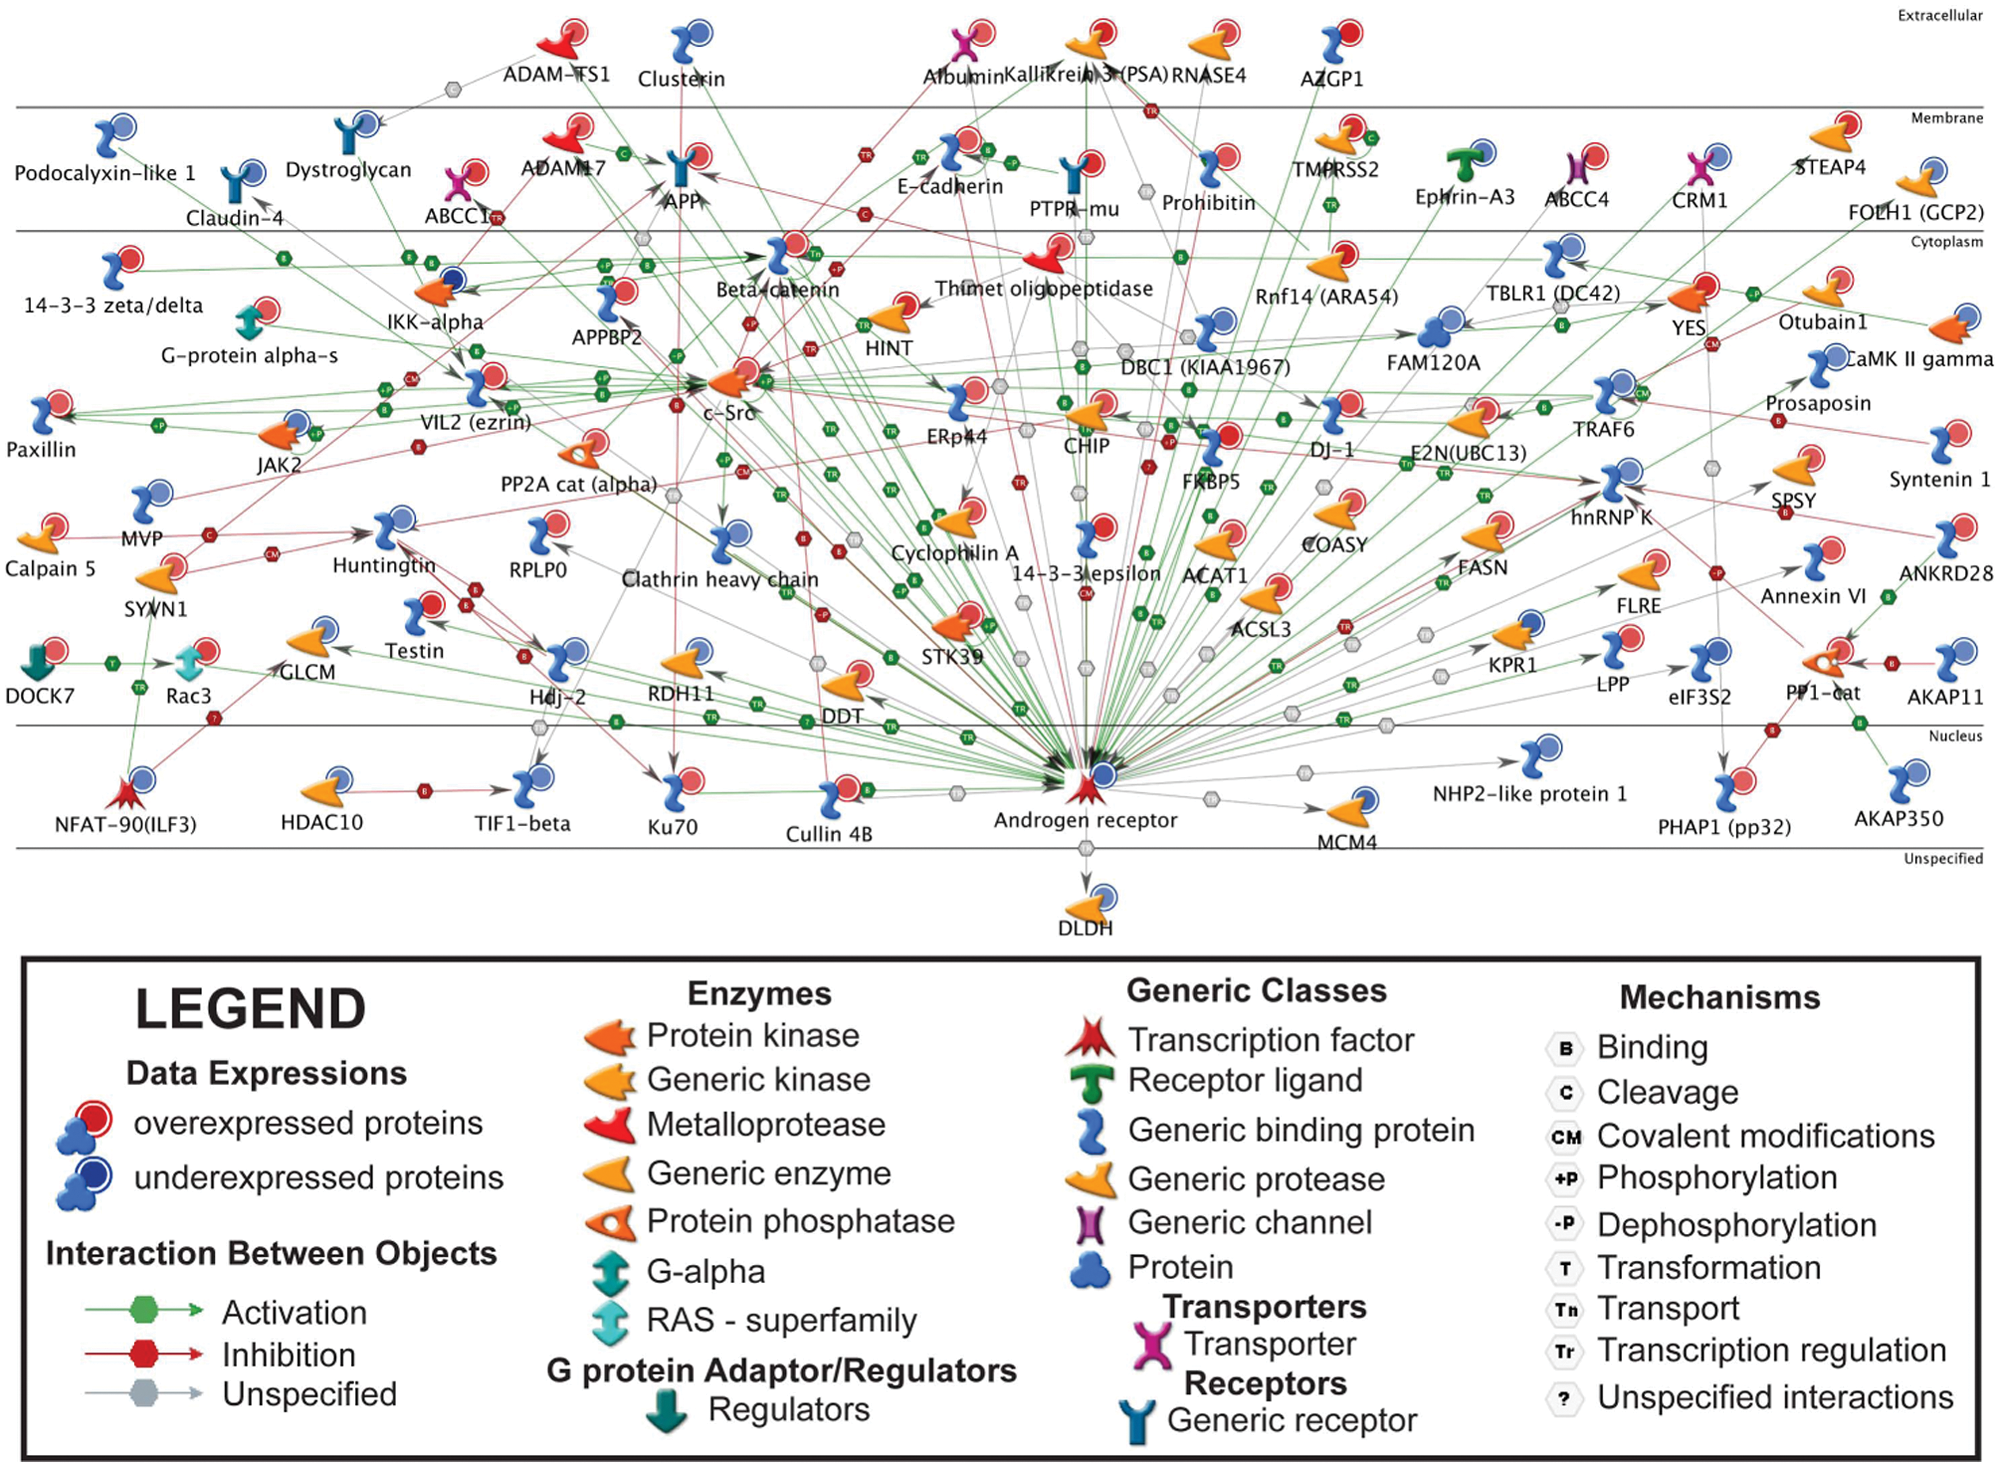
Androgen receptor transcription factor network of androgen-sensitive microsome-associated proteins in LNCaP cells. Androgen-sensitive microsome-associated proteins were uploaded into the GeneGo bioinformatics software program to identify androgen-sensitive subnetworks that are centered on transcription factors. Proteins annotated in the literature are depicted based upon the cellular (or extracellular) sites in which they occur. Red and blue nodes represent androgen-sensitive microsome-associated proteins whose expressions increased (AS) or decreased (AD), respectively, in sodium carbonate–extracted (SCE) microsomes. The colored arrows represent directionality, effect, and mechanism underlying the interactions between proteins.
Next, we set out to identify the androgen-sensitive protein kinases and protein phosphatases in the SCE dataset because both classes of enzymes regulate membrane-associated signal transduction pathways in human prostate cancer cells. 51 The GeneGo network algorithm was used to annotate PPIs between protein kinases and protein phosphatases and to identify androgen-sensitive phosphorylation networks. The resulting network of PPIs highlighted enzymatic and physical interactions between specific kinases and phosphatases and identified the molecular associations between androgen-sensitive kinases and phosphatases (Fig. 5). Notably, c-SRC was the largest hub in the PPI network (Fig. 5). Proteins it was linked to included p70 S6 kinase 1 (p70S6K), 3-phosphoinositide-dependent protein kinase 1 (PDPK1), protein kinase C iota type (PKCλ/ι), JAK2, receptor tyrosine-protein kinase erbB-2 (ErbB2), receptor-type tyrosine-protein phosphatase F (PTPRF), protein-tyrosine phosphatase alpha (PTPRα), and protein kinase C mu (PKCµ). Importantly, the levels of key regulators of prostate cancer cell proliferation (including PDPK1, p70S6K, and mTOR) were increased in AS microsomes (Fig. 5). 52 Moreover, the top-ranked protein network of androgen-sensitive kinases and phosphatases represented the GO processes of phosphate metabolism, phosphorous metabolism, phosphorylation, developmental process, and response to external stimulation (Table 4). Root node proteins in this network included c-SRC, STE20/SPS1-related proline-alanine-rich protein kinase (STK39), protein-tyrosine phosphatase mu (PTPRµ), calcium/calmodulin-dependent protein kinase type II subunit gamma (CaMK IIγ), and pyruvate kinase isozymes M1/M2 (PKM2). Importantly, AR and estrogen receptor (ESR1) were central hubs in a network that exerted direct or indirect transcriptional control over multiple target proteins (Suppl. Fig. S8). In summary, our in silico findings have revealed that the protein kinases and phosphatases known to regulate prostate cancer cell proliferation and differentiation are androgen sensitive and identified selected kinases and phosphatases as candidates for androgen co-regulation on the membranes of human prostate cancer cells.
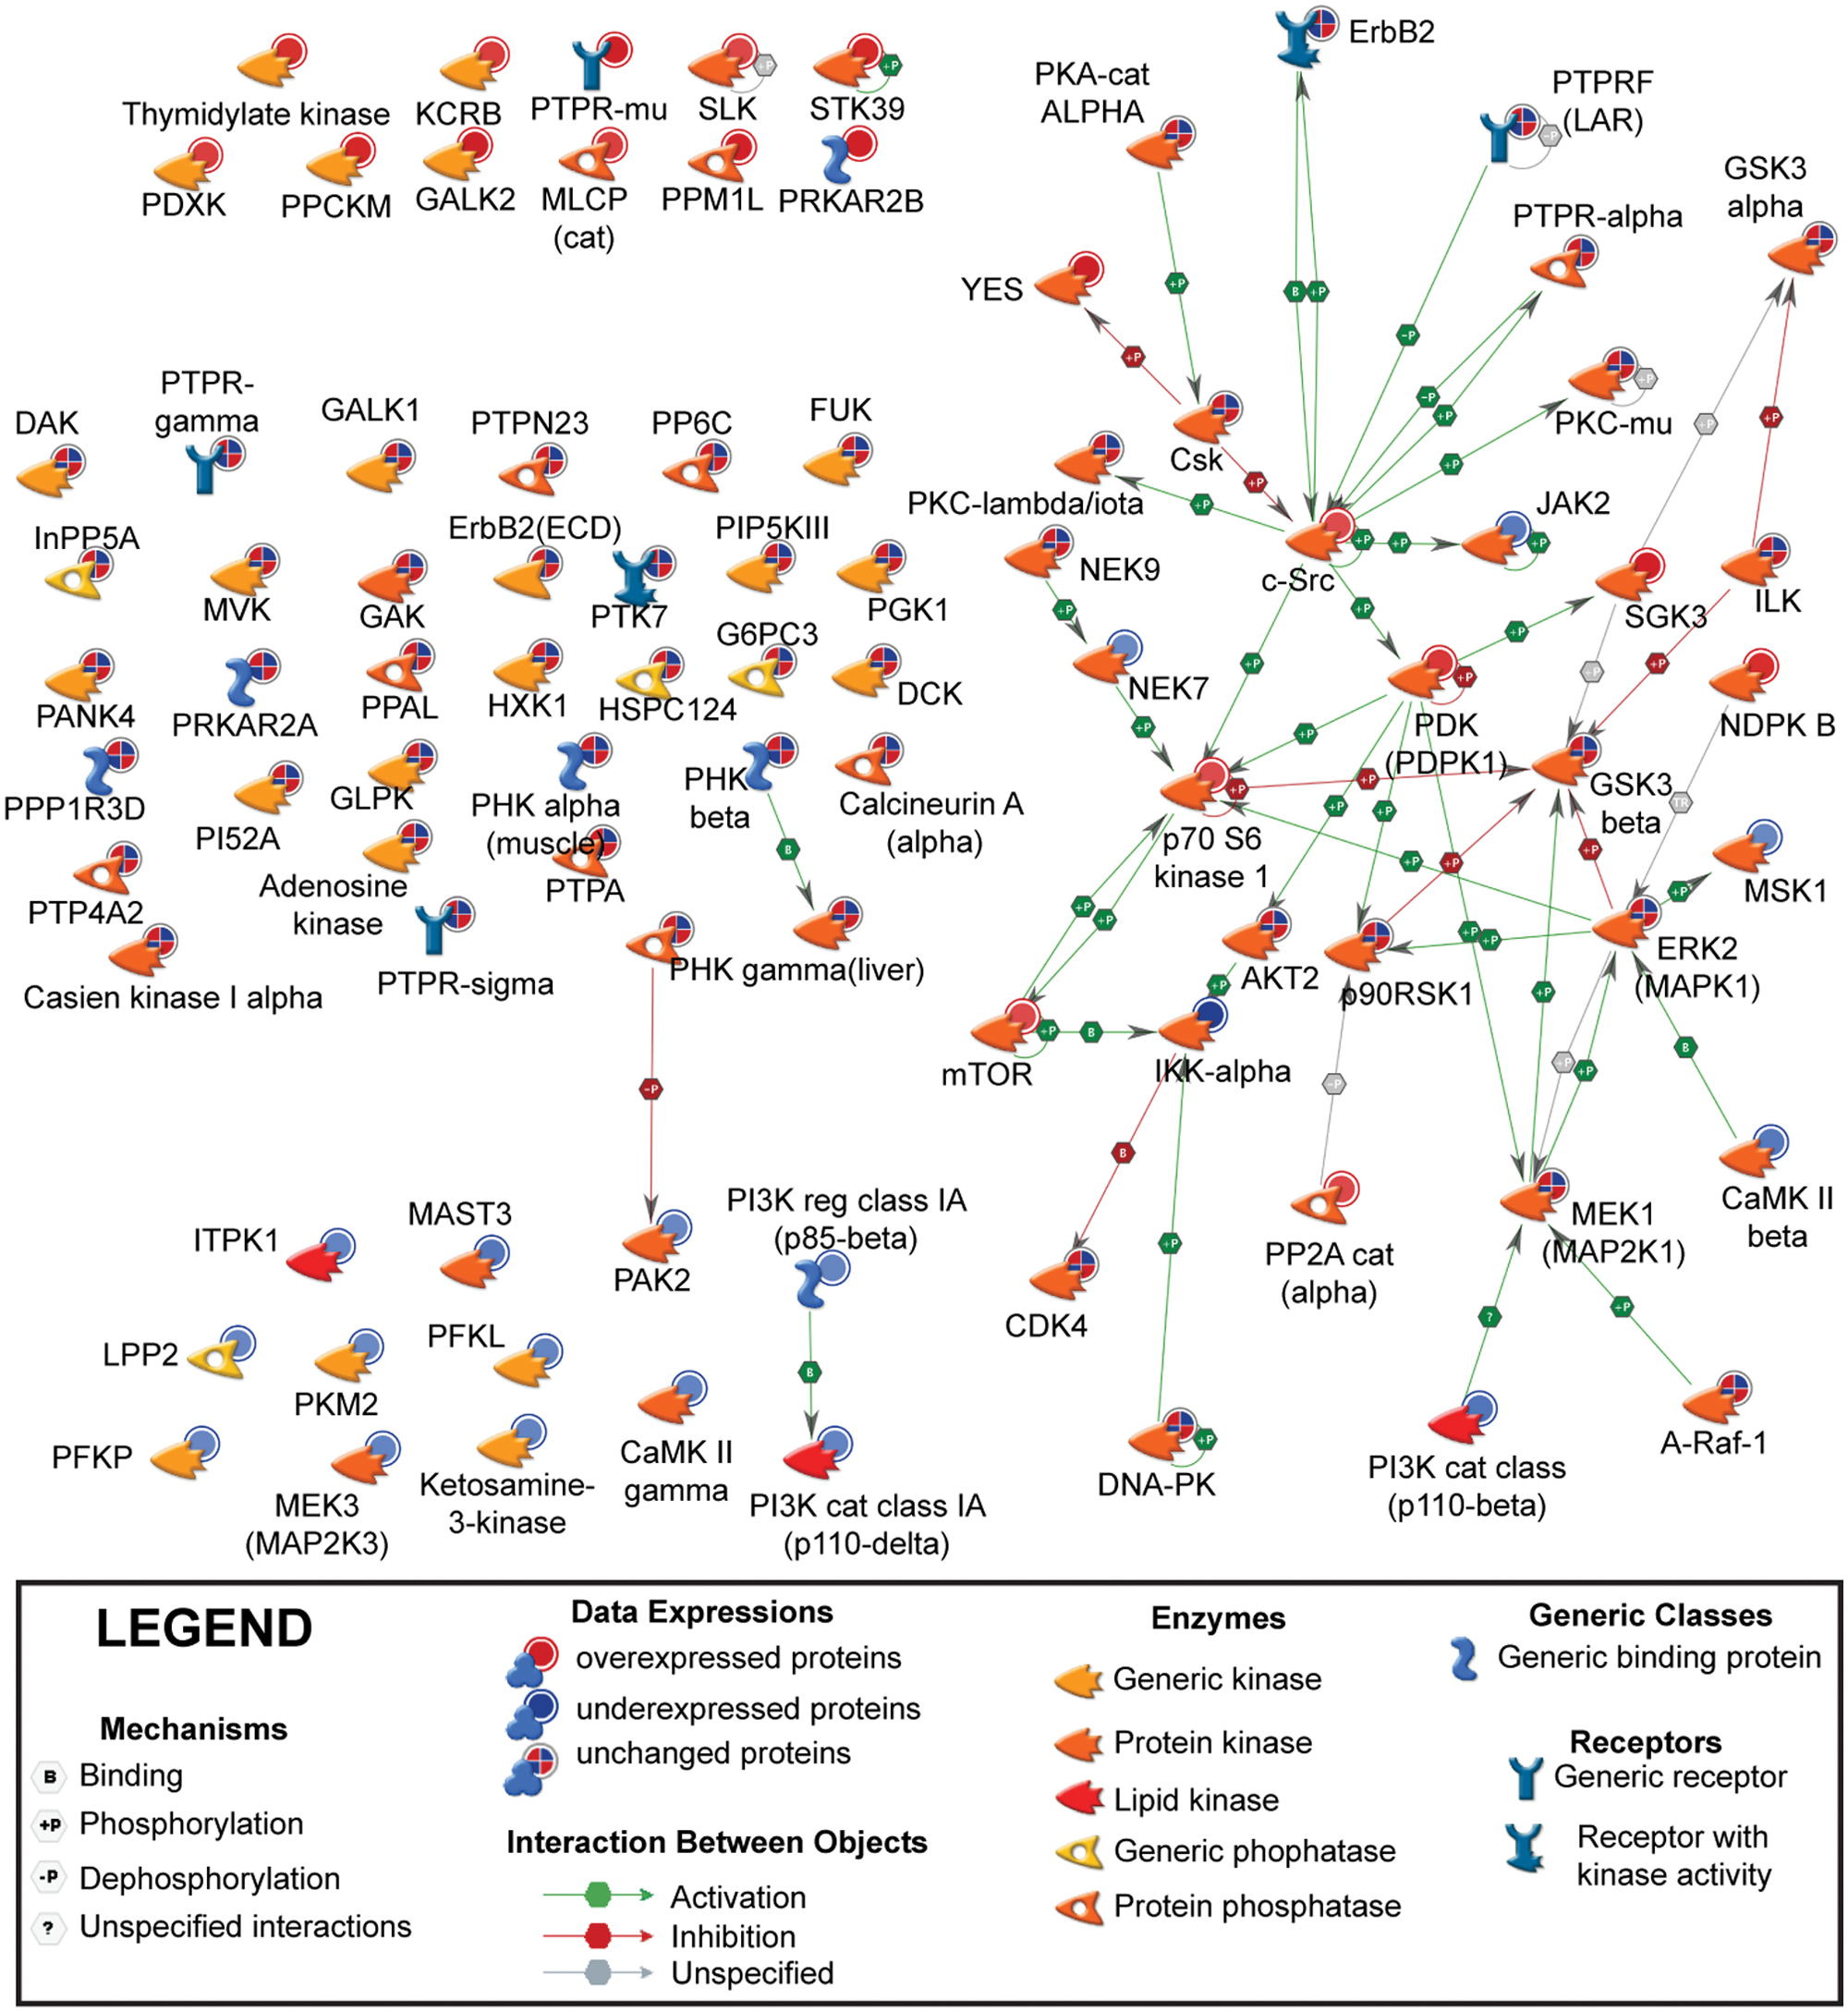
Protein kinase/protein phosphatase interaction network in LNCaP cells. All quantified microsome-associated protein kinases and protein phosphatases were uploaded into the GeneGo bioinformatics software program, and protein-protein interactions annotated in the literature are depicted based upon their cellular localization. Red and blue nodes represent androgen-sensitive microsome-associated proteins whose expressions increased (AS) or decreased (AD) in sodium carbonate–extracted (SCE) microsomes, respectively. Objects or nodes with a blue and red pie-chart circle are androgen-insensitive microsome-associated proteins (d8/d0 isotope-coded affinity tag [ICAT] ratios <1.5-fold or d8/d0 >0.67-fold). The edges or colored arrows represent directionality, effect, and mechanism of interaction between proteins.
Top-Ranked Androgen-Sensitive Networks of Protein Kinases and Phosphatases
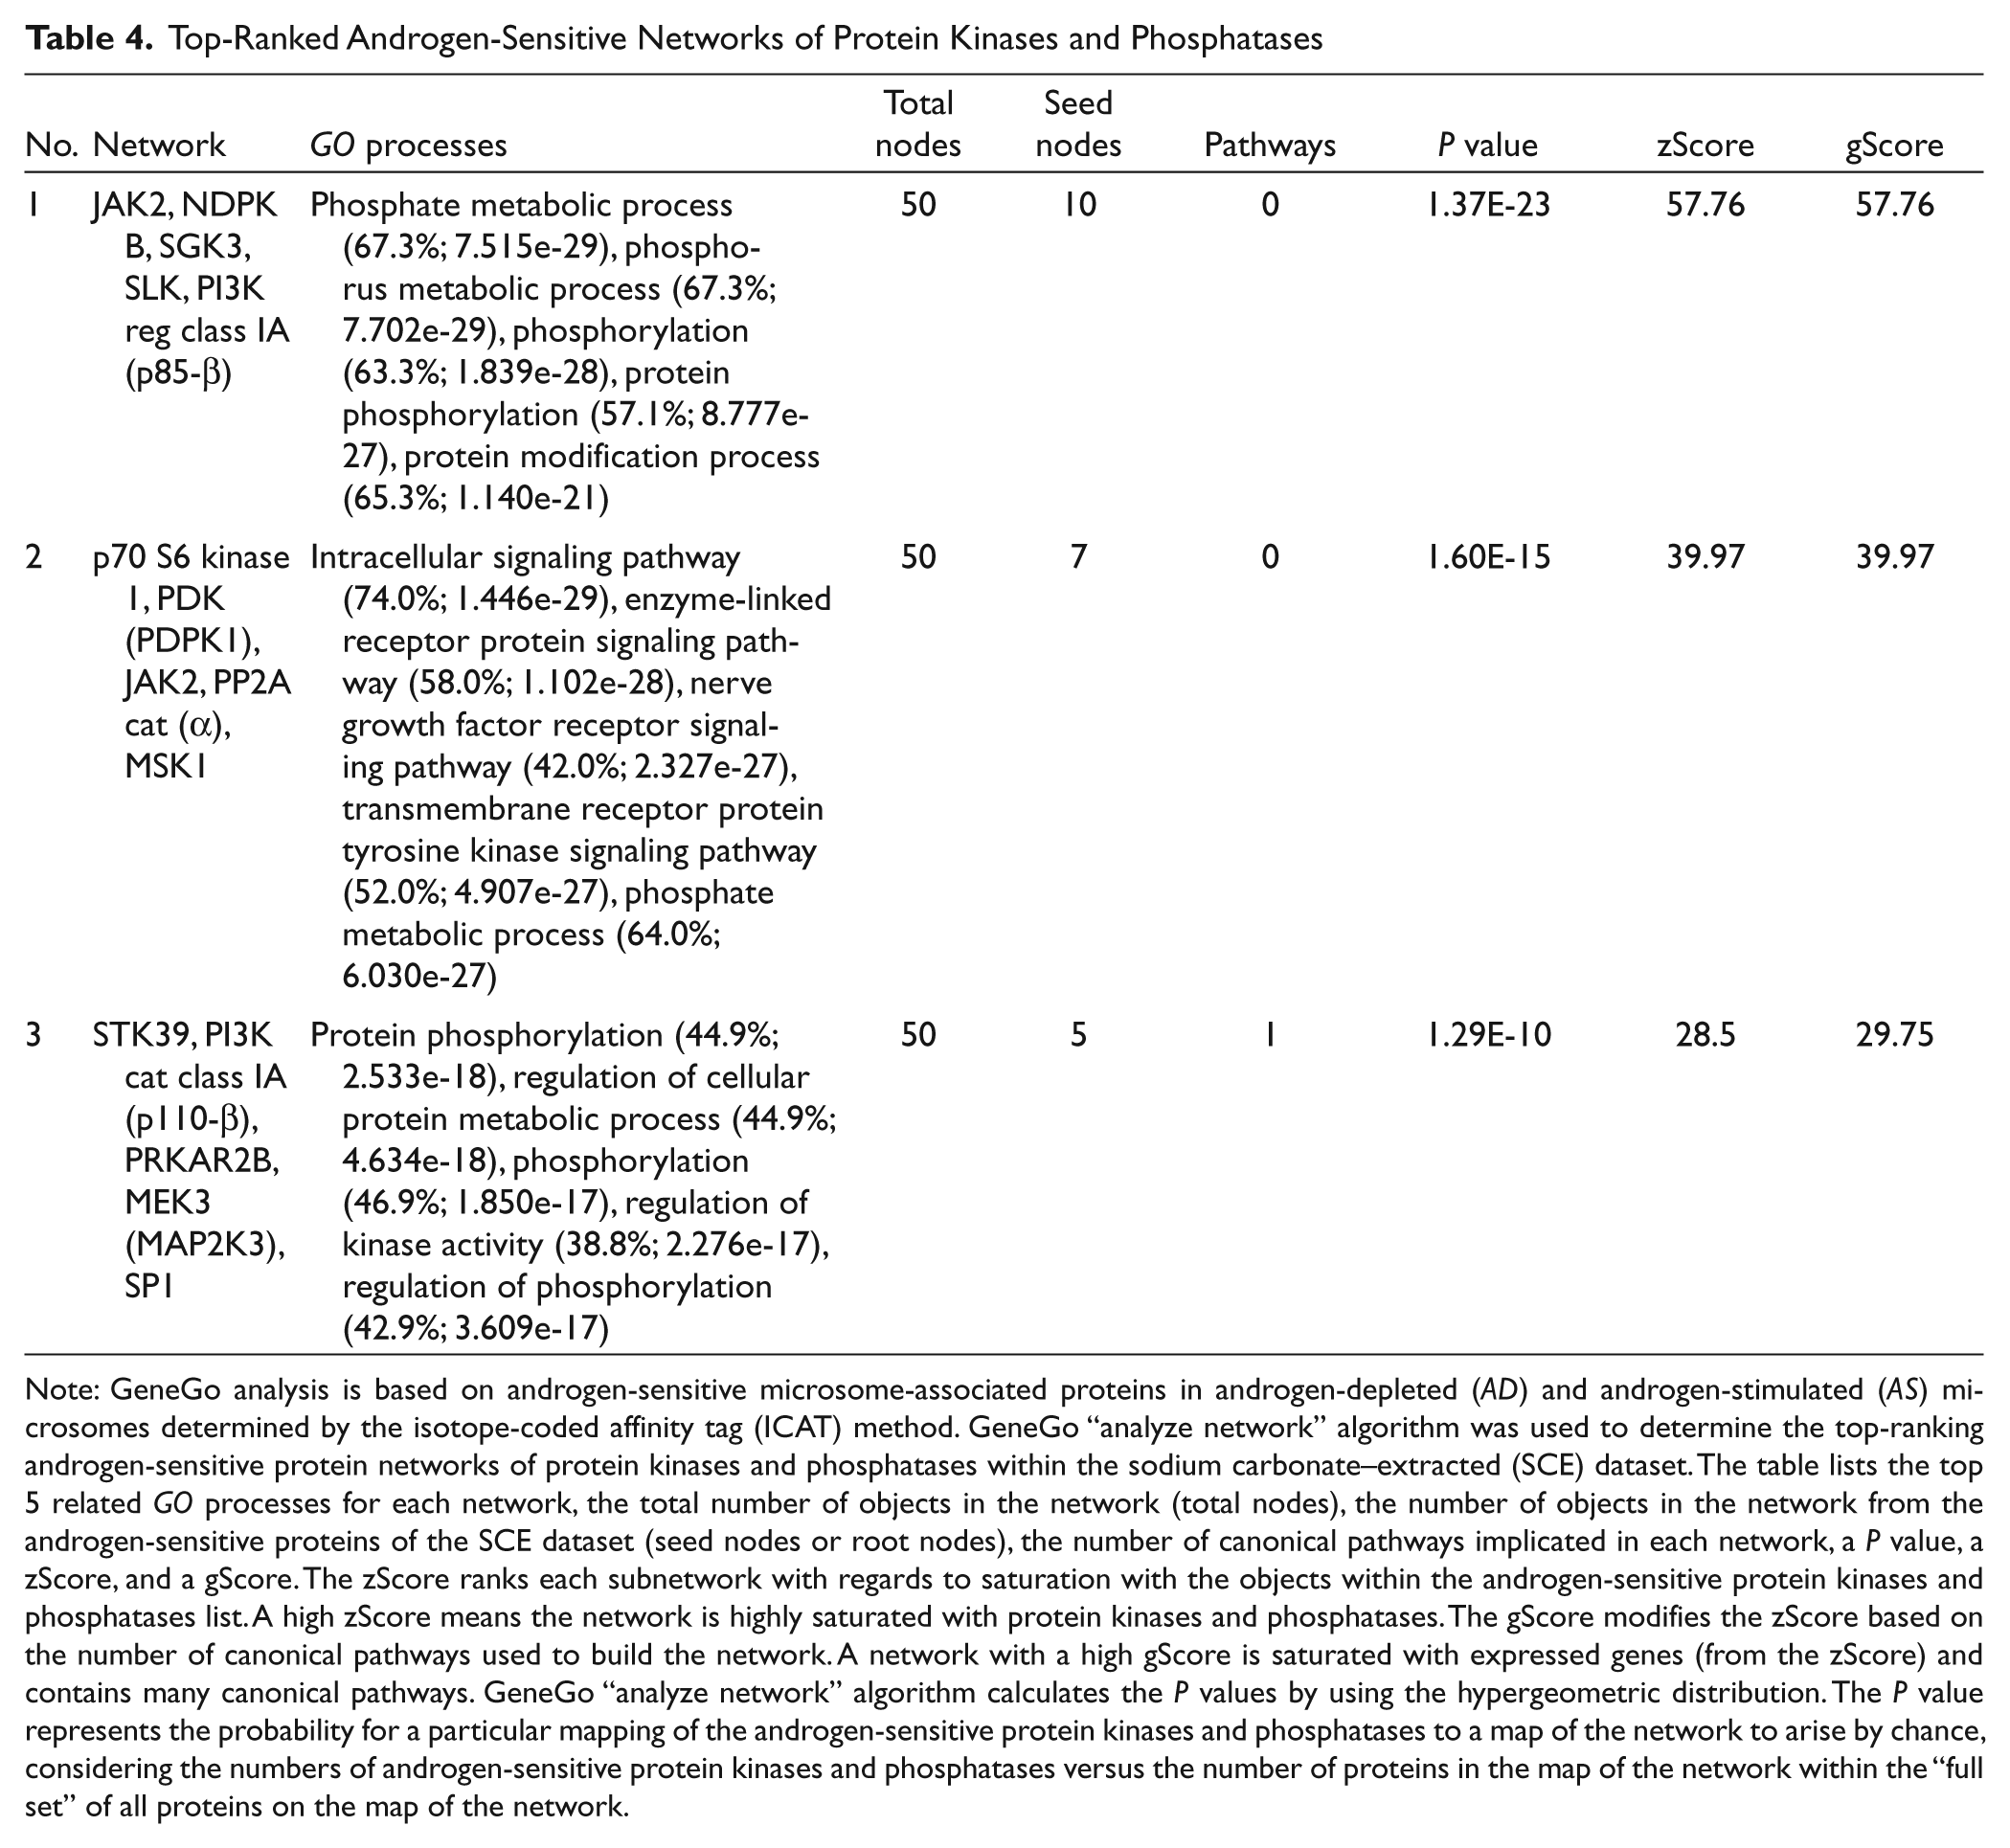
Note: GeneGo analysis is based on androgen-sensitive microsome-associated proteins in androgen-depleted (AD) and androgen-stimulated (AS) microsomes determined by the isotope-coded affinity tag (ICAT) method. GeneGo “analyze network” algorithm was used to determine the top-ranking androgen-sensitive protein networks of protein kinases and phosphatases within the sodium carbonate–extracted (SCE) dataset. The table lists the top 5 related GO processes for each network, the total number of objects in the network (total nodes), the number of objects in the network from the androgen-sensitive proteins of the SCE dataset (seed nodes or root nodes), the number of canonical pathways implicated in each network, a P value, a zScore, and a gScore. The zScore ranks each subnetwork with regards to saturation with the objects within the androgen-sensitive protein kinases and phosphatases list. A high zScore means the network is highly saturated with protein kinases and phosphatases. The gScore modifies the zScore based on the number of canonical pathways used to build the network. A network with a high gScore is saturated with expressed genes (from the zScore) and contains many canonical pathways. GeneGo “analyze network” algorithm calculates the P values by using the hypergeometric distribution. The P value represents the probability for a particular mapping of the androgen-sensitive protein kinases and phosphatases to a map of the network to arise by chance, considering the numbers of androgen-sensitive protein kinases and phosphatases versus the number of proteins in the map of the network within the “full set” of all proteins on the map of the network.
JAK2 and IKAP modulate the expression of epithelial and neuroepithelial markers in prostate cancer cells
In order to authenticate ICAT protein quantifications in the SCE dataset, we tested the expression of several target proteins by Western blot analyses in crude microsomes isolated from 72-hour AD and AS LNCaP cells. Target proteins tested included prostate-specific antigen (PSA), a well-known androgen-regulated target protein,53,54 and several proteins not previously identified as androgen sensitive in human prostate cancer cells. 21 Those in the latter group included JAK2, I kappa B kinase complex-associated protein (IKAP), c-SRC, and c-YES tyrosine-protein kinase. Western blots confirmed that each target was a bona fide androgen-sensitive protein, as initially determined by the ICAT method (Suppl. Table S1). For example, PSA levels were higher in the AS than the AD extracts (Fig. 6A), and JAK2 levels were lower in the AS than the AD extracts (Fig. 6B). Interestingly, the intensities of the IKAP, c-SRC, and c-YES bands at the expected molecular weights were higher in the AD extract relative to the AS extract (Fig. 6C-E). However, closer inspection of the Western blots revealed that AS extracts contained multiple, apparently smaller bands immunoreactive for IKAP, c-SRC, and c-YES, and these were absent in the AD extracts (Fig. 6D). It remains to be determined whether the high-intensity, lower molecular weight immunoreactive bands are protein degradation products or smaller isoforms encoded by alternatively expressed IKAP, SRC, and YES1 gene transcripts in AS cells. Nevertheless, these Western blot experiments validated that the membrane-associated proteins identified by the ICAT method are sensitive to androgens in LNCaP cells.
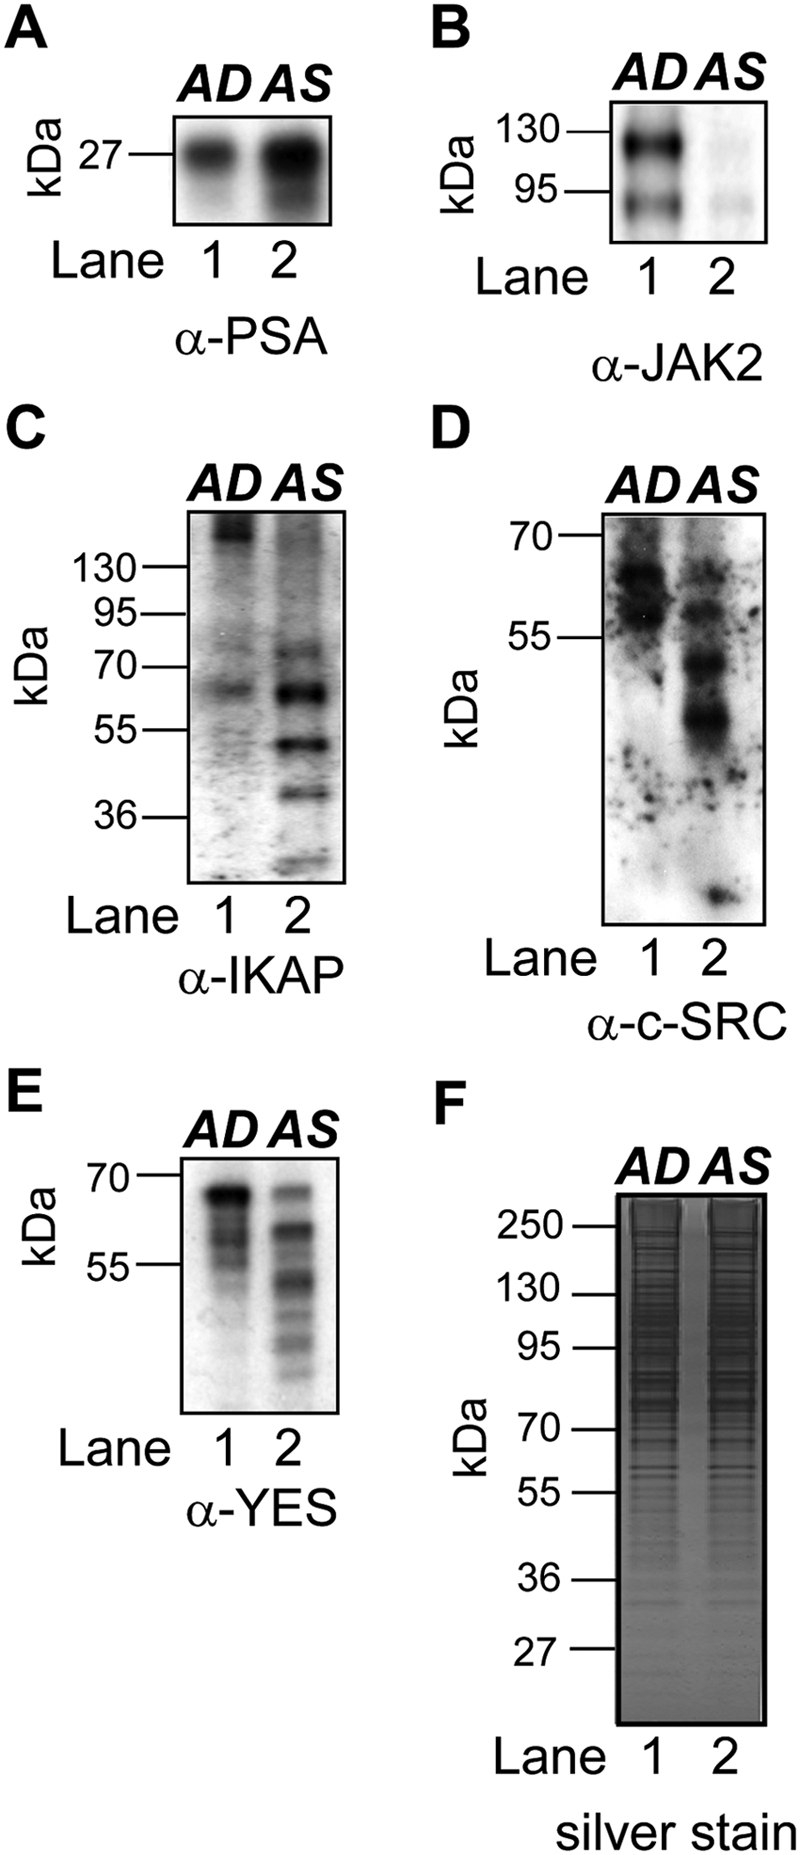
Western blot analyses validating androgen-sensitive microsome-associated proteins in LNCaP cells. Comparative immunoblot analysis of androgen-depleted (AD) (d0) and androgen-stimulated (AS) (d8) microsome-associated extracts probed with antibodies to (
Androgens simultaneously promote the differentiation of secretory epithelial cells and repress neuroendocrine transdifferentiation in LNCaP cells.49,50 Therefore, we assessed whether individual androgen-sensitive microsome-associated proteins can influence the expression of epithelial and neuroepithelial protein markers in LNCaP cells. We selected JAK2 and IKAP for further study because their contribution to androgen-mediated signaling in human prostate cancer cells is unknown. Because higher levels of JAK2 and IKAP were observed in AD microsomes (Figs. 1D and 6B and 6C), we tested the influence of siRNA-mediated knockdown of JAK2 or IKAP, in either the presence or absence of androgens, on the expression of both epithelial and neuroepithelial markers in LNCaP cells. To this end, we carried out Western blot analysis of whole-cell lysates of LNCaP cells transfected with control, JAK2, or IKAP siRNAs for 96 hours in androgen-containing growth medium (RPMI 1640 + 10% FBS). The epithelial markers probed in these analyses were PSA, fatty acid synthase (FASN), and cytokeratin 18 (CK18); the neuroepithelial markers were tubulin beta-3 chain (β-tubIII), glial fibrillary acidic protein (GFAP), and microtubule-associated protein 2 (MAP2) (Fig. 7D-M). Interestingly, cells transfected with IKAP siRNA contained long, stellate cellular processes that were absent in control and JAK2 siRNA–transfected cells (Fig. 7A-C). This neuron-like phenotype was reminiscent of the neuroendocrine transdifferentiation phenotype that LNCaP cells acquire when exposed to AD growth medium or when AR levels are severely reduced as a consequence of experimental manipulations (e.g., siRNA knockdown, ribozyme application).50,55 Western blot analysis of cells transfected with JAK2 and IKAP siRNA revealed that knockdown was efficient (Fig. 7D, upper and middle panels). Because JAK2 and IKAP are androgen-sensitive microsome-associated proteins, AR levels were also probed in these cells. Interestingly, AR levels were slightly increased in JAK2 knockdown cells and decreased by about the same amount in IKAP knockdown cells (Fig. 7E, lanes 1-3). Similarly, PSA levels were increased in JAK2 knockdown cells and reduced in IKAP knockdown cells (Fig. 7F, lanes 1-3). FAS and CK18 levels, on the other hand, remained relatively unchanged in JAK2 and IKAP knockdown cells (Fig. 7G and 7H, lanes 1-3). However, in both JAK2 and IKAP knockdown cells, there was an obvious reduction in the levels of neuroepithelial markers β-tubIII and MAP2 (Fig. 7I and 7J), although there was no change in GFAP, NSE, or nestin levels (Fig. 7K-M). These results show that under standard growth conditions characterized by castrate levels of androgens (10% FBS), 56 JAK2 and IKAP expression is necessary for optimal AR and PSA expression in LNCaP cells. The findings also demonstrate that JAK2 and IKAP are necessary for optimal expression of selected neuroepithelial markers in human prostate cancer cells.
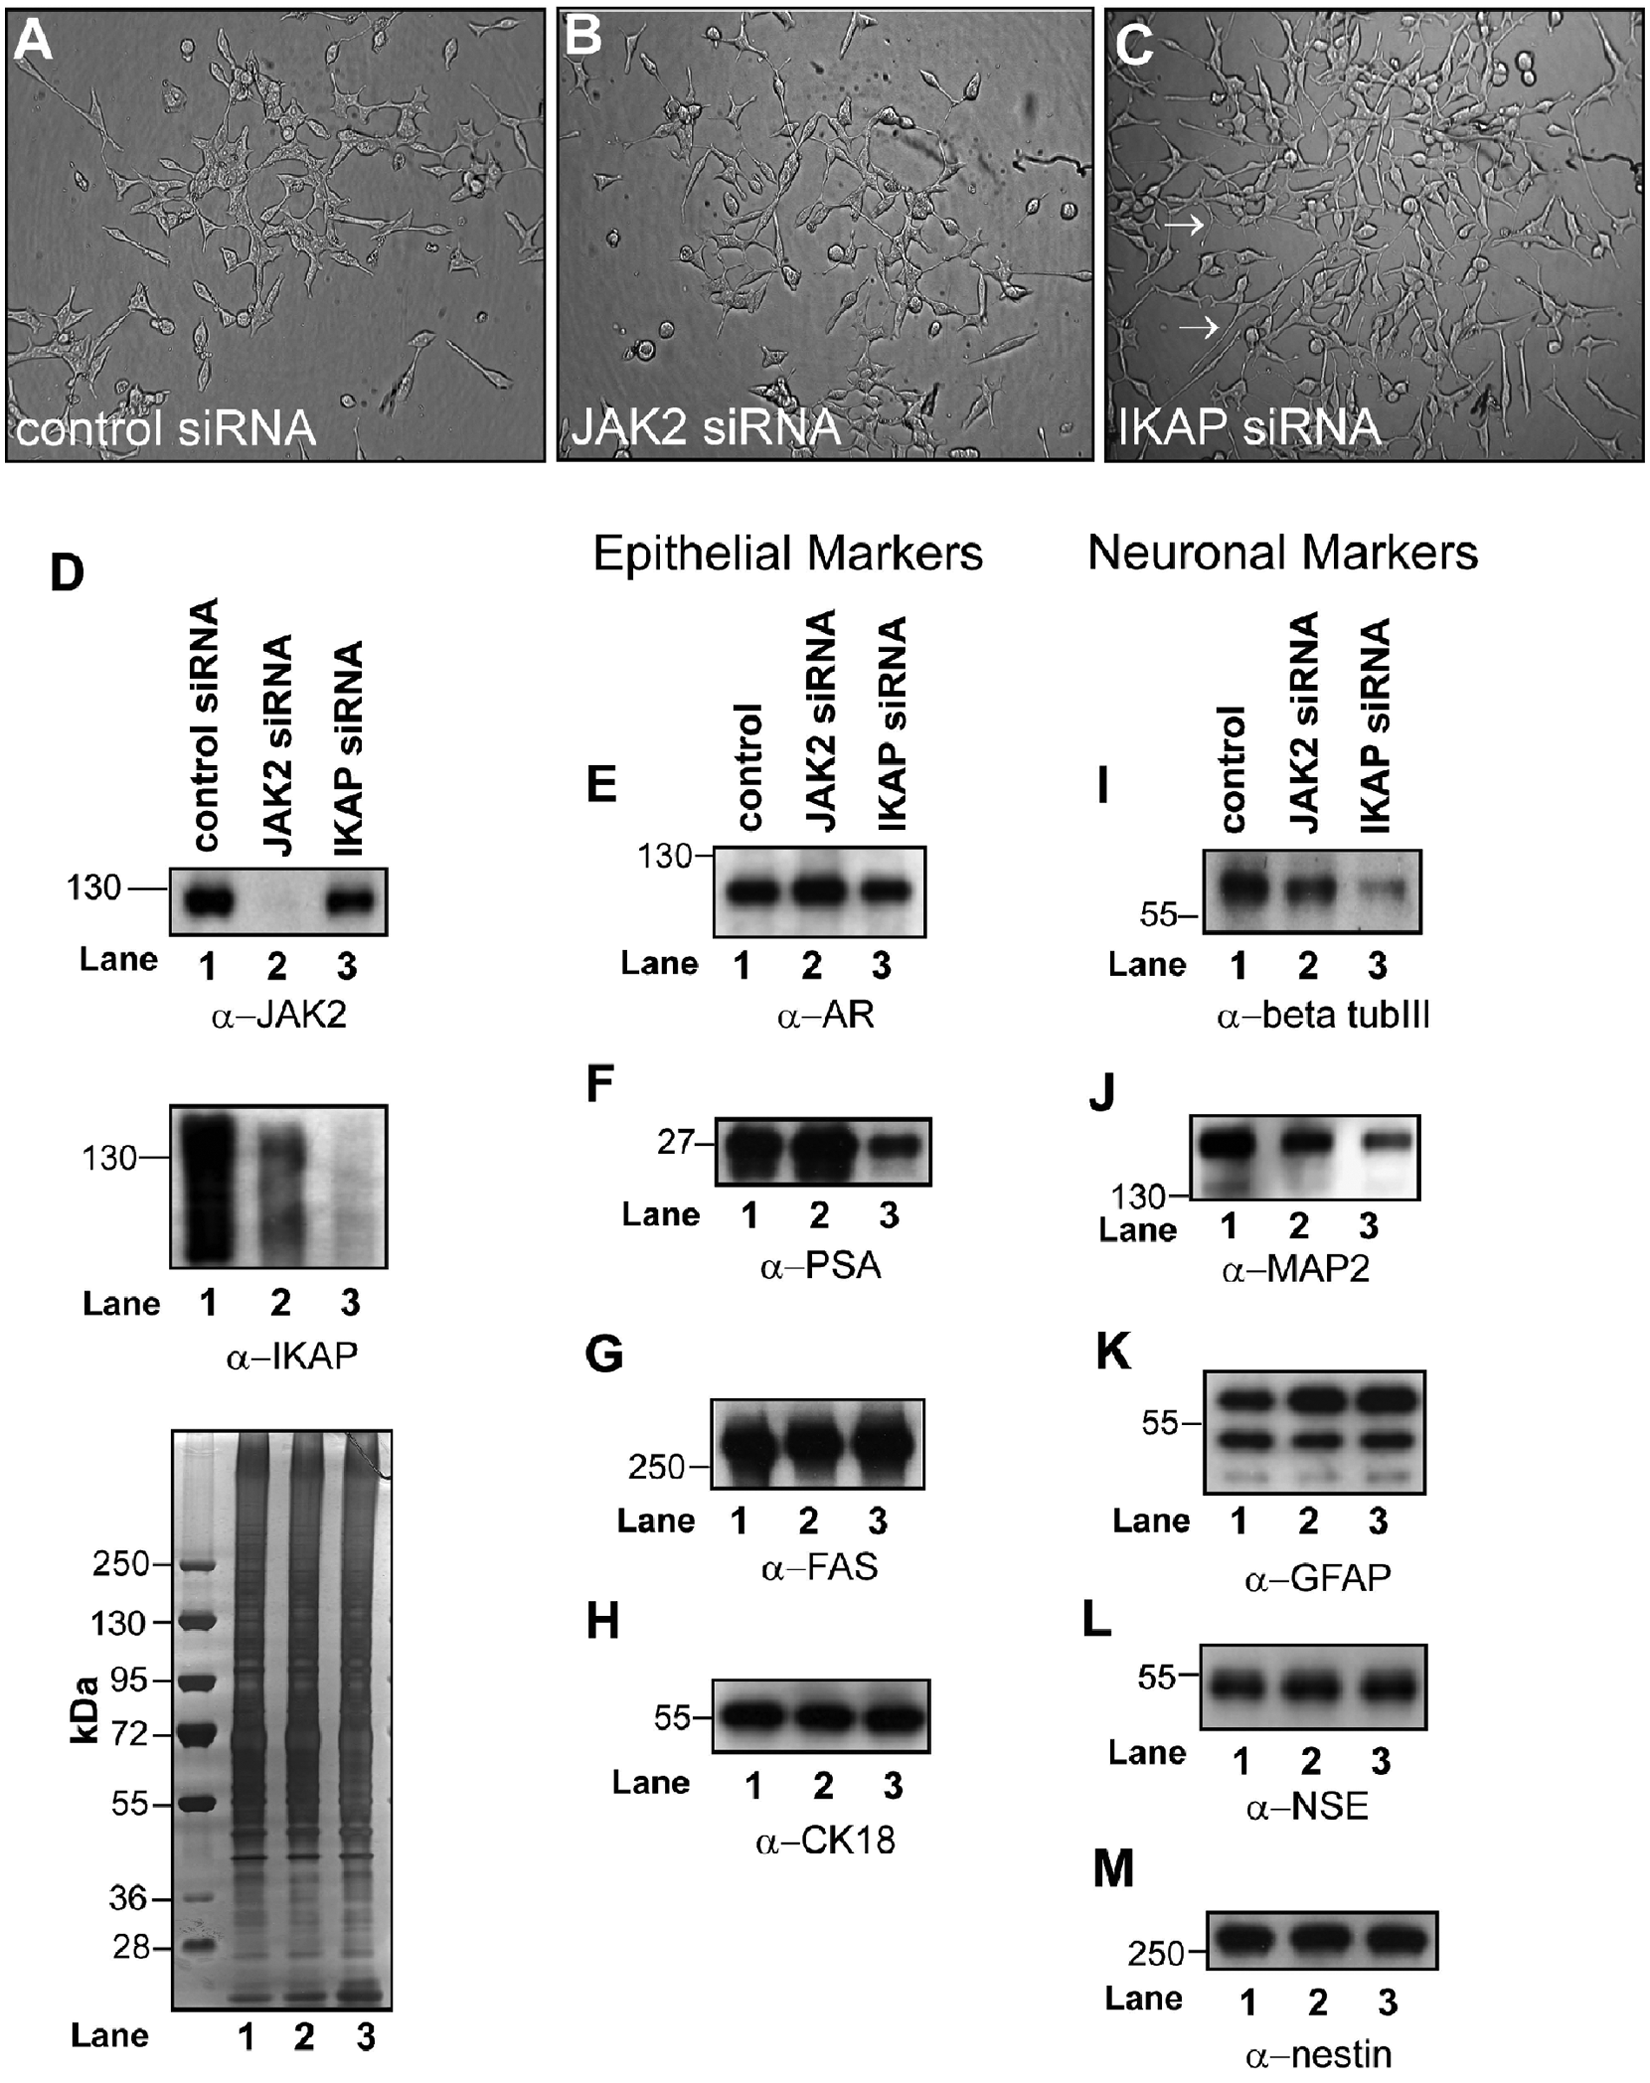
JAK2 and IKAP influence the expression of prostate epithelial and neuronal markers in LNCaP cells exposed to androgen-containing growth medium. Light microscope photographs of 96-hour LNCaP cells transfected with control (
Because higher levels of JAK2 and IKAP were detected in the microsomes of AD LNCaP cells, we explored whether JAK2 and IKAP had any influence on the expression of epithelial or neuroepithelial markers in AD LNCaP cells. We also noticed that prior to Western blot analyses of siRNA-transfected cells, JAK2 siRNA–transfected cells cultured for 96 hours displayed shorter and smaller cellular extensions than did control siRNA–transfected cells (Fig. 8A and 8B). In contrast, IKAP siRNA–transfected cells exhibited a greater number of dendrite-like processes than did controls (Fig. 8A and 8C). Western blot analyses validated that the knockdown of JAK2 or IKAP was efficient in the respective siRNA-transfected cell population (Fig. 8D, upper and middle panels). Interestingly, the levels of AR, PSA, FAS, and CK18 were unchanged in JAK2 and IKAP knockdown cells (Fig. 8E-H), whereas those of several neuroepithelial markers were affected (Fig. 8I-M). For example, JAK2 knockdown had only a minimal influence on the expression of MAP2 (Fig. 5J) but led to a slight increase in the levels of nestin levels (Fig. 8M) and to a decrease in those of β-tubIII, GFAP, and NSE (Fig. 8I-M). Conversely, in IKAP knockdown cells, only GFAP expression failed to change; the levels of β-tubIII, GFAP, and NSE were increased (Fig. 8I-M). These findings show that the expression of JAK2 and IKAP is necessary for optimal expression of neuroepithelial markers in AD LNCaP cells. Finally, these results suggest that JAK2 is a positive regulator, and IKAP a negative regulator, of neuroepithelial fate in AD LNCaP prostate cancer cells.
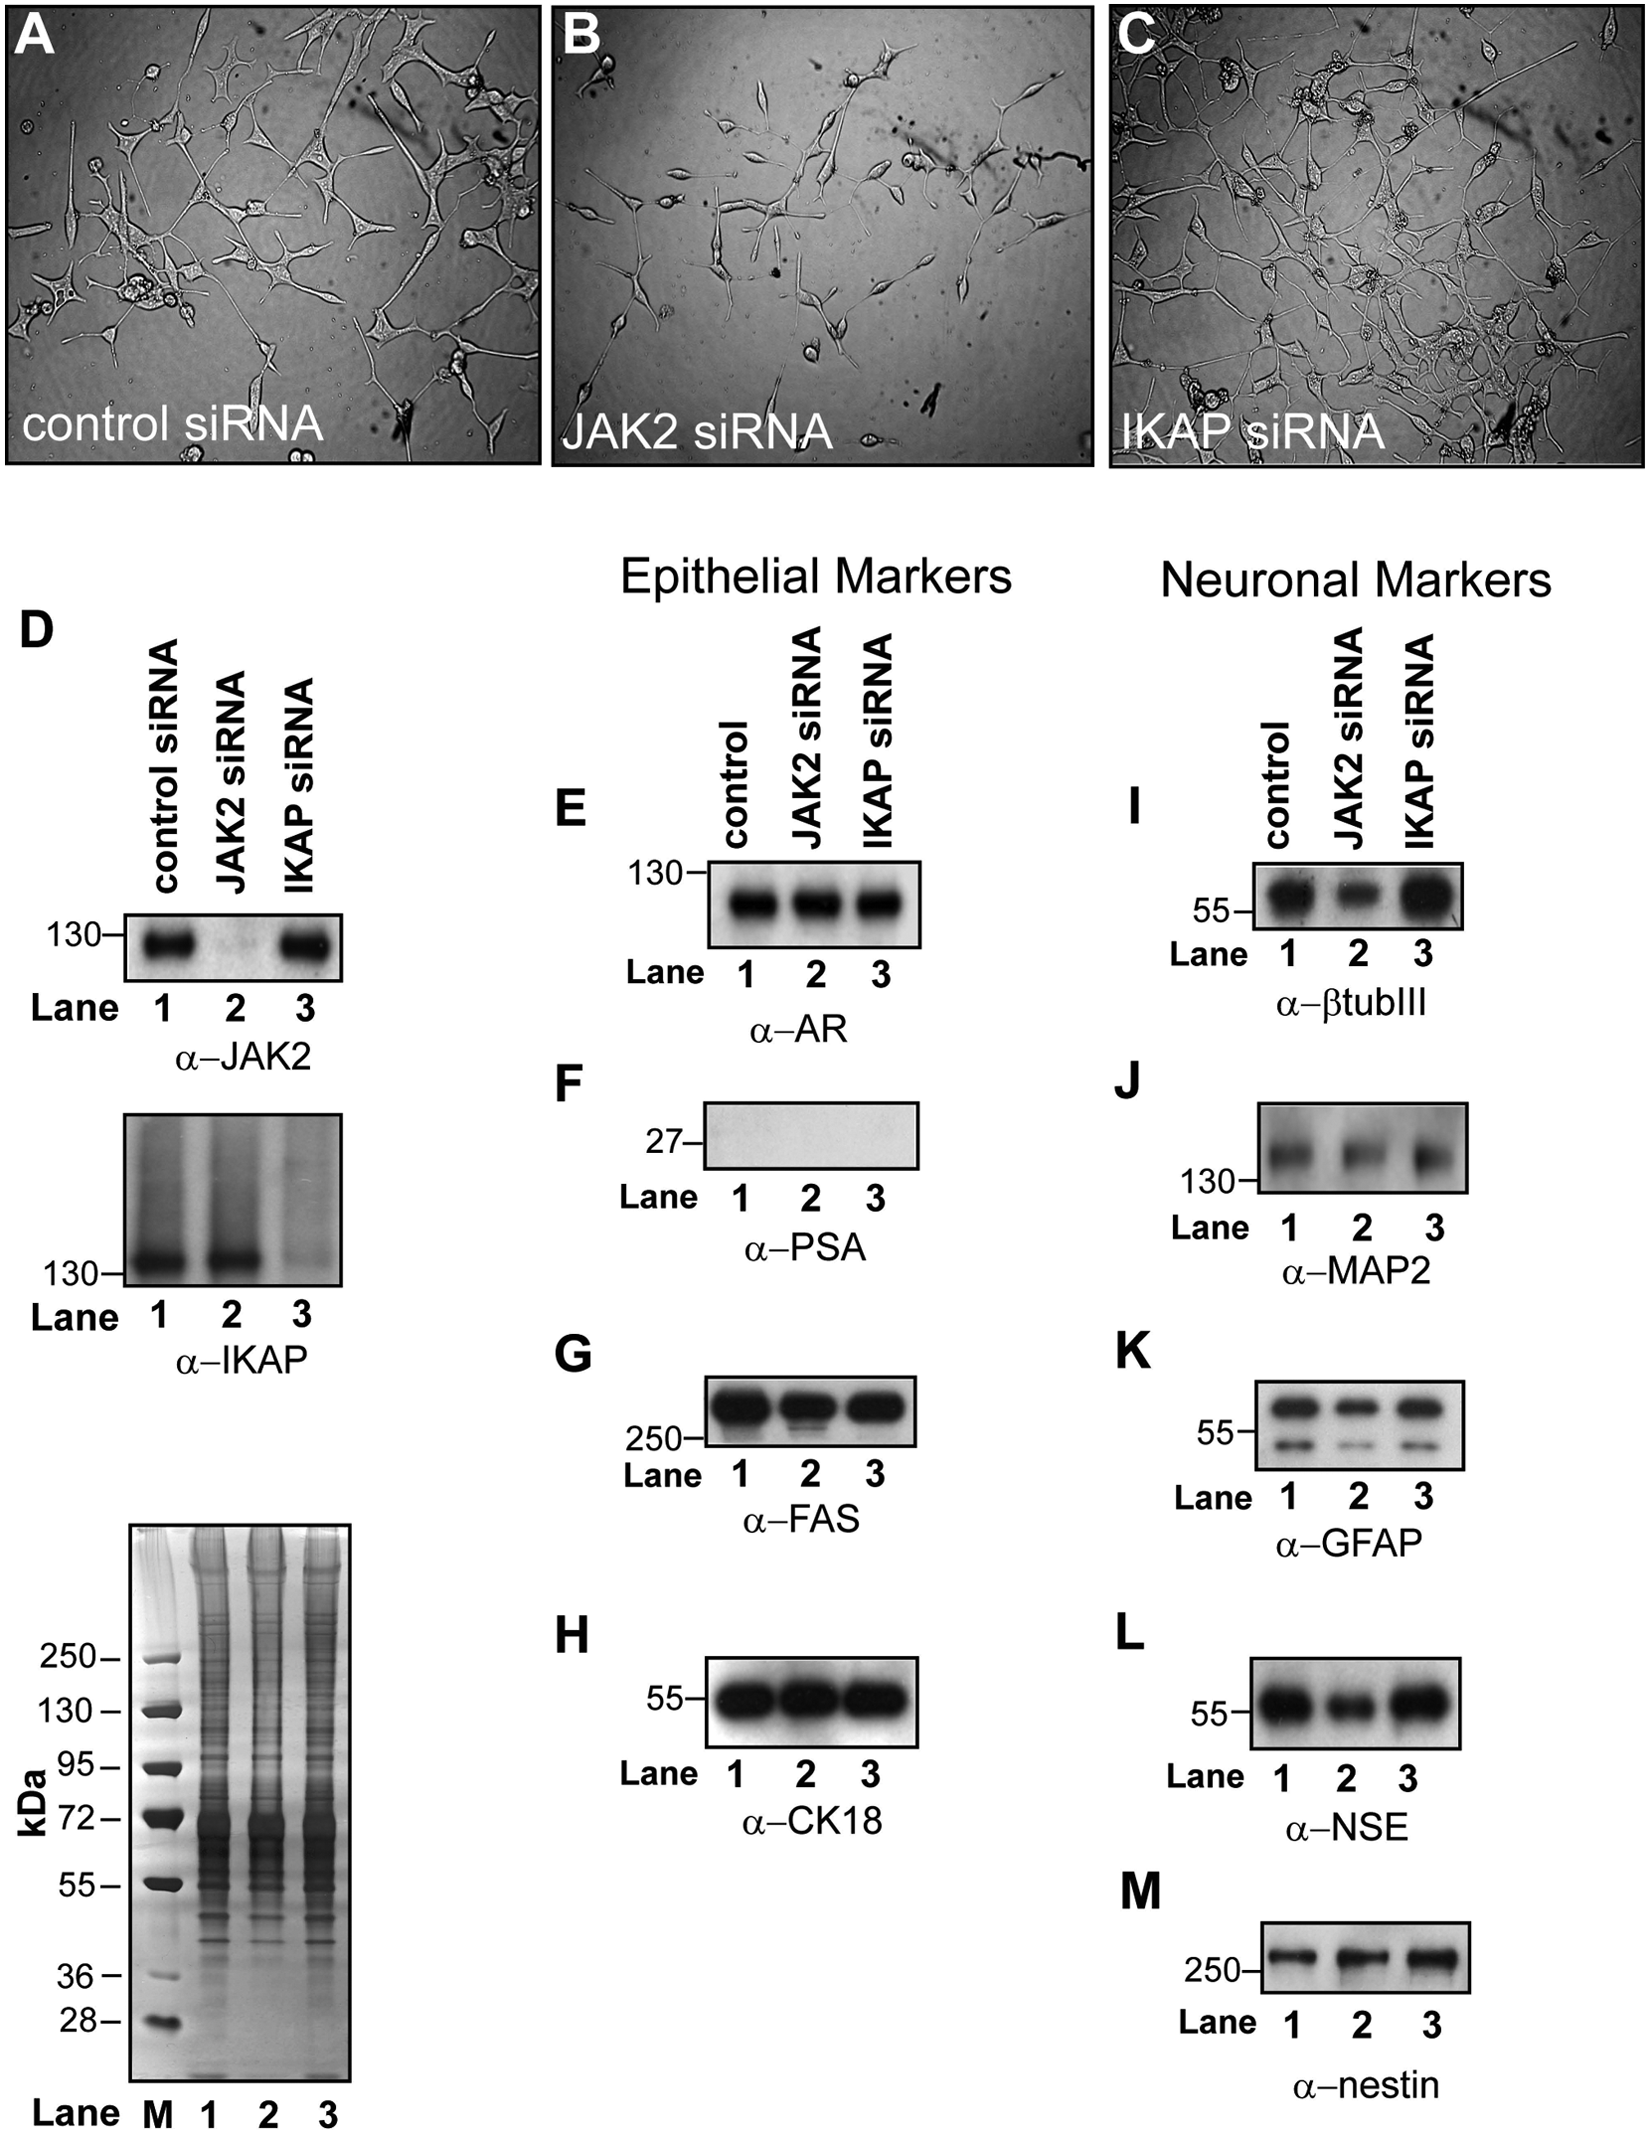
JAK2 and IKAP influence the expression of prostate epithelial and neuronal markers in LNCaP cells exposed to androgen-depleted growth medium. Light microscope photographs of 96-hour LNCaP cells transfected with control (
JAK2 and IKAP modulate LNCaP proliferation and function as co-regulators of AR-mediated transcription
A preliminary siRNA knockdown screen of androgen-sensitive proteins in LNCaP cells revealed a noticeable increase in the proliferation of cells transfected with either JAK2 or IKAP siRNAs relative to that in cells transfected with control siRNAs (unpublished observations). This prompted us to investigate whether the transfection of JAK2 or IKAP siRNA leads to an increase in the proliferation of LNCaP cells when maintained in standard growth medium, that is, at castrate levels of androgens. 56 Indeed, transfection of the JAK2 siRNA led to an approximately 50% increase in the number of viable cells relative to that in controls (Fig. 9A), and transfection of the IKAP siRNA increased growth to more than 300% (Fig. 9A). Interestingly, quantifiable differences in cell proliferation were not observed in knockdown cells cultured under conditions of androgen depletion (data not shown). To determine if the proliferation increases in JAK2 and IKAP knockdown cells required AR expression, siRNAs directed against AR were also co-transfected into LNCaP cells, and proliferation in control/JAK2, control/IKAP, AR/JAK2, and AR/IKAP double knockdown cells was measured and compared (Fig. 9B). The results showed that the increased proliferation in control/JAK2 and control/IKAP knockdown cells was attenuated by the co-transfection of AR siRNAs (Fig. 9B). These results suggested that in LNCaP prostate cancer cells, JAK2 and IKAP antagonize androgen-mediated proliferation through an AR-dependent pathway.
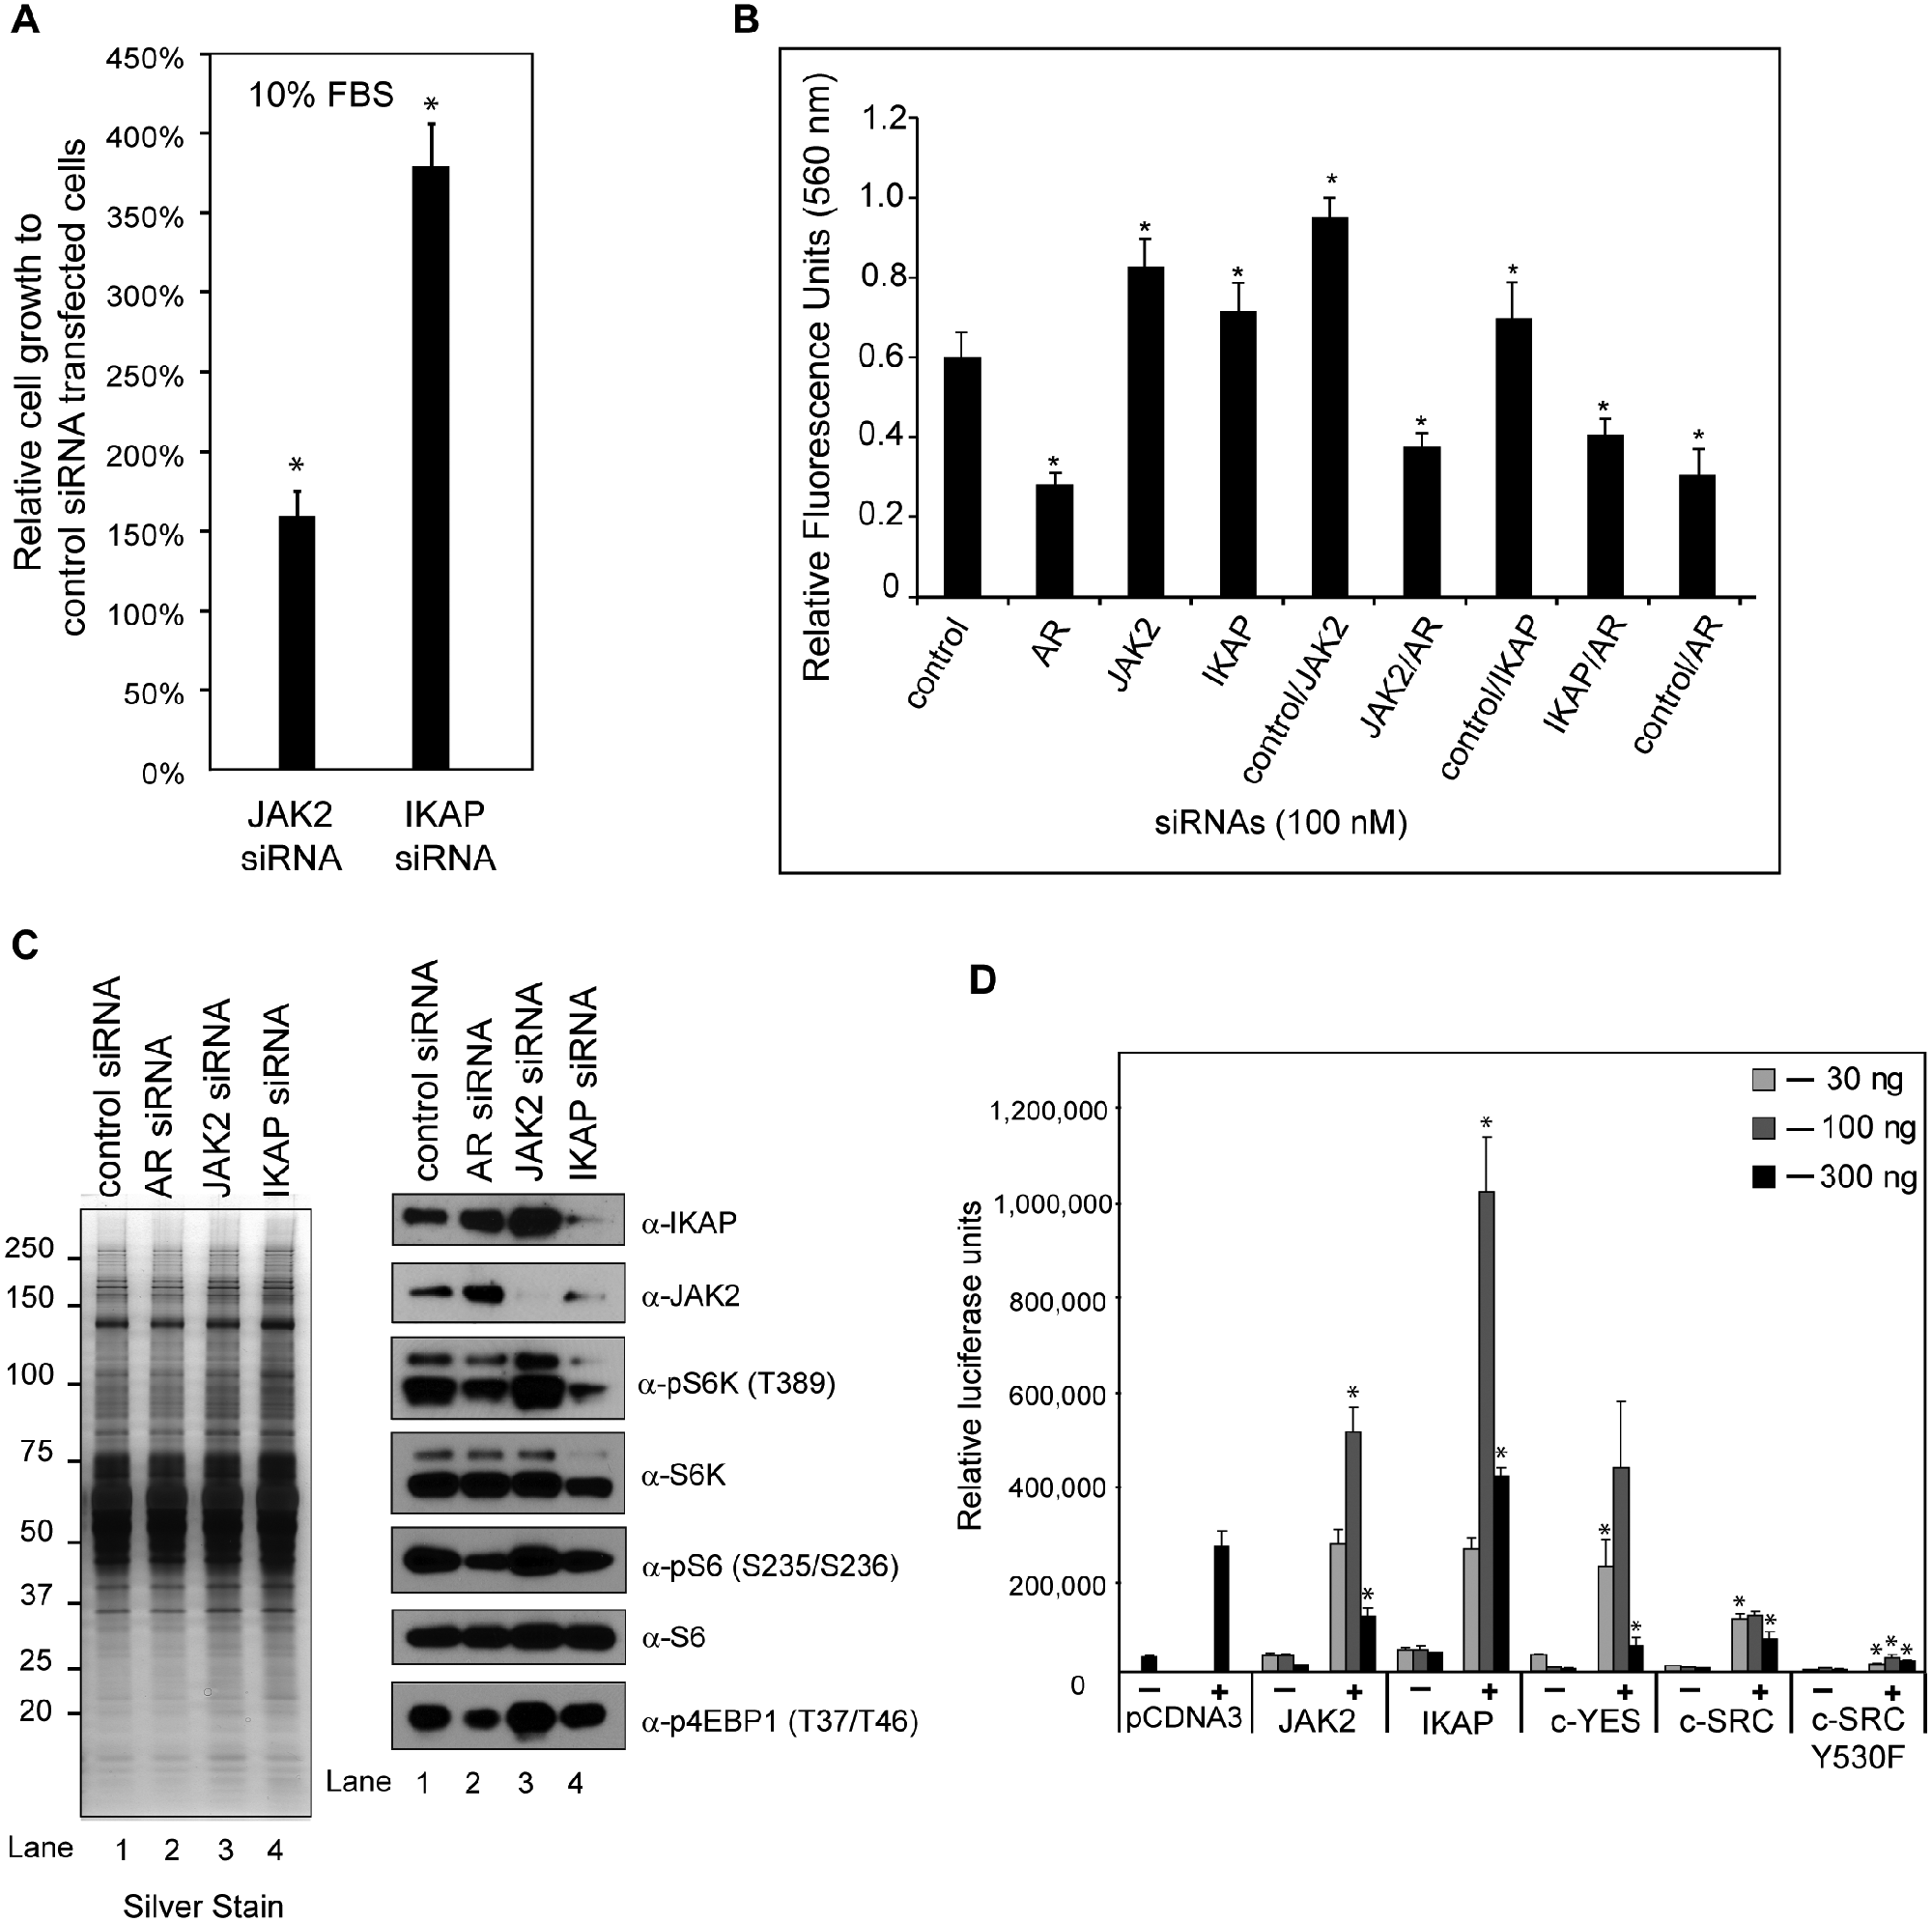
JAK2 and IKAP attenuate cell proliferation and function as co-regulators of AR-mediated transcription. (
Because androgens stimulate the proliferation of androgen-sensitive prostate cancer cells by activating the mammalian target of rapamycin (mTOR), 52 we wanted to determine if the increased proliferation in JAK2 and IKAP knockdown cells was mediated by mTOR activation. Therefore, we assessed the phosphorylation status of mTORC1-dependent downstream substrates (p70S6 kinase [or S6K] and 4E-BP1) and an S6K substrate (S6 ribosomal protein) in S6 in AR, JAK2, and IKAP knockdown cells, using phospho-specific antibodies that recognize the pThr389 of S6K, the pThr37/pThr46 of 4E-BP1, and the pSer235/pSer236 of S6 (Fig. 9C).57-61 In JAK2 knockdown cells, the levels of phosphorylated S6K, 4E-BP1, and S6 were higher than those in control, AR, and IKAP knockdown cells (Fig. 9C, lanes 1-4 in panels 3, 5, and 7), thus demonstrating that JAK2 knockdown enhanced mTORC1 activity in LNCaP cells. In IKAP knockdown cells, by contrast, mTORC1 activity was noticeably reduced in both AR and IKAP knockdown cells, as assessed by the phosphorylation of all markers except 4E-BP1 (Fig. 9C, lanes 1-3 in panels 3, 5, and 7). Moreover, the levels of JAK2 and IKAP themselves were increased in AR knockdown cells (Fig. 9C, lanes 1-4 in panels 1 and 2), thus confirming the ICAT findings suggesting that androgens antagonize the expression of JAK2 and IKAP in LNCaP cells. Overall, the results from these analyses suggest that JAK2 and IKAP antagonize androgen-mediated proliferation in LNCaP prostate cancer cells through an mTOR-dependent and mTOR-independent pathway, respectively.
Given that both JAK2 and IKAP modulate the expression of epithelial and neuroepithelial markers and influence the proliferation of LNCaP cells, we set out to establish whether they do so by modulating AR-mediated transcription. To this end, we used the androgen-responsive rat probasin luciferase promoter (–705 to +1 bp), testing the effects of various manipulations on AR-mediated transcription in LNCaP cells. 62 LNCaP cells were transiently transfected with JAK2 and IKAP mammalian expression vectors at various doses (Fig. 9D). Because JAK2 is an apically expressed nonreceptor tyrosine kinase of cytokine receptor signaling pathways, we also included mammalian expression constructs encoding the downstream effector kinases c-YES, wild-type c-SRC, and constitutively activated c-SRCY530F to examine the specificity of tyrosine kinase activity in influencing AR-mediated transcription in LNCaP cells. Transfection of the JAK2 expression vector at intermediate and high doses caused a dose-dependent increase and decrease, respectively, in AR transcription activity (Fig. 9D). Like the intermediate dose of JAK2, the intermediate dose of IKAP enhanced AR-mediated transcription; however, this was further enhanced at the highest dose of transfected vector (Fig. 9D). Interestingly, the intermediate dose of transfected c-YES expression vector enhanced AR activity slightly, whereas the highest dose of c-YES clearly repressed AR transcriptional activity (Fig. 9D). In the case of c-SRC, in contrast, AR transcriptional activity was repressed at all 3 doses, and this repression was enhanced in the constitutively active c-SRCY530F mutant (Fig. 9D). These findings show that JAK2 and IKAP co-regulate AR-mediated transcription in LNCaP cells and that other tyrosine protein kinases have the potential to do so as well.
Discussion
In this study, we have identified novel androgen-sensitive proteins and protein networks involved in the proliferation, survival, and differentiation of human prostate cancer cells. This was accomplished by using the ICAT method on proteins prepared from microsomes of the human prostate cancer cell line LNCaP, as our previous work indicated that androgens co-regulate membrane-associated protein networks in these cells. In contrast to our previous results, which identified mainly protein networks involved in mitochondrial and RNA metabolism in LNCaP cells, the current study identified numerous signaling adaptors, cell-surface receptors, and regulatory enzymes without any previously reported involvement in androgen-mediated signaling responses in prostate cancer cells. 21 These findings implicate a much broader spectrum of microsome-associated proteins as being androgen sensitive, including proteins involved in the proliferation, survival, and differentiation of human prostate cancer.
In the current study, we identify more microsome-associated proteins, fewer proteins involved in cellular metabolism, and more proteins involved in cellular signaling than in our previous work. We believe that these outcomes were the result of washing the crude microsomal protein pellets with high-pH sodium carbonate buffer, a protocol that has been shown in the rat liver to effectively dislodge ribosomes from the endoplasmic reticulum as well as to release the contents of the cisternae. 31 Indeed, our proteomic findings are consistent with the differential extraction of highly abundant metabolic proteins and enzymes (e.g., mitochondrial respiration), an outcome that would explain the qualitative differences between the signal transduction proteins identified in the SCE versus UNW preparations. 27 In the future, the proteomic content of SCE microsomes will be studied in greater detail to establish experimental conditions under which the identification of membrane and membrane-associated proteins by tandem mass spectrometry (MS/MS) is optimized.
Androgen-sensitive networks identified
An important goal of this proteomic study was to delineate the androgen-sensitive membrane-associated protein networks and pathways that are coupled to the physiology of human prostate cancer cells, as knowledge of these should make it possible to comprehensively delineate protein networks and pathways that mediate androgenic responses at the molecular level. Indeed, this proteomic study has provided a steady-state snapshot of androgen-sensitive protein networks that become activated in growth-inhibited prostate cancer cells in response to androgen deprivation and exposure to high androgen concentrations (e.g., 10 nM R1881). Our proteomic study has provided independent verification of the model positing that androgens are key regulators of the expression of genes involved in cell proliferation, survival, and differentiation in human prostate cancer cells. 21 IGF-1 ligand is a known androgen-regulated gene in prostate cancer cells, and both it and the IGF-1 receptor are required for androgen-mediated PSA expression in prostate cancer cells.12,63 Thus, our proteomic findings provide further evidence that, in prostate cancer cells, androgens influence the IGF-1 signaling pathway at the protein level. Moreover, our bioinformatic analyses show that the top-ranked androgen-sensitive microsome-associated protein networks are coupled to the molecular determinants of cell proliferation and differentiation (Table 2). Previous studies have shown that in LNCaP cells, high concentrations of androgens stimulate the differentiation of secretory epithelia, whereas reduced concentrations promote transdifferentiation into neuroendocrine cells.49,50,64 Androgens also have a biphasic effect on the proliferation of LNCaP cells, with low concentrations stimulating it and high concentrations repressing it while promoting epithelial differentiation.65-68 The top-ranked androgen-sensitive microsome-associated protein networks identified in our analysis function in the GO processes of cell proliferation, anatomic structure morphogenesis, and extracellular matrix disassembly. This outcome further confirms known androgenic actions in androgen-sensitive prostate cancers (Table 2).
Some of the androgen-sensitive microsome-associated proteins identified in this analysis are believed to be key regulators of late-stage metastatic and castrate-resistant prostate cancers. For example, we identified the proto-oncogene c-SRC tyrosine kinase as an androgen-sensitive microsome-associated protein in LNCaP cells. c-SRC is known to be rapidly activated by androgens as a consequence of tyrosine-mediated (Y416) activation; 69 it then phosphorylates AR on tyrosine (Y534), thereby activating AR-mediated transcription in prostate cancer cells.39,69 The src family–selective tyrosine kinase inhibitor PP1 is known to block androgen-induced proliferation even in AD prostate cancer cells,69,70 indicating that c-SRC activity is required to re-initiate androgen-mediated proliferation in this context. Notably, in the current study, we have identified mTOR as an androgen-sensitive microsome-associated protein (Suppl. Table S1), which similar to c-SRC, androgens activate mTOR to re-initiate androgen-mediated proliferation in AD prostate cancer cells. 52
Our proteomic findings also provide evidence that protein kinases involved in the proliferation of LNCaP cells (e.g., mTOR, p70S6 kinase) are co-regulated by androgens (Fig. 5). Such a mechanism for coordinating androgen-mediated cellular proliferation in prostate cancer cells is attractive, although it remains to be validated biologically. Our findings have also uncovered discrepancies between expression values based on ICAT versus Western blotting, for example, in the cases of c-SRC and c-YES expression in AD and AS microsomal extracts (Fig. 6). We believe that the discordances in these cases can be explained by ICAT expression values that were based upon cleaved protein products containing the ICAT reagent; indeed, we detected smaller immunoreactive protein bands of high intensity in AS microsomes (Fig. 6). Interestingly, c-SRC is a known substrate of the calcium-activated neutral protease calpain; in human platelets, c-SRC cleavage by this enzyme disrupts its activity. 71 Our findings suggest that androgens promote c-SRC and c-YES cleavage in LNCaP cells. Previous work has shown that c-SRC is targeted for ubiquitin-mediated degradation in mammalian cells,72,73 and thus, androgens might promote c-SRC and c-YES ubiquitination and their subsequent lysosomal degradation in LNCaP cells. Future studies will determine if androgens promote c-SRC and c-YES proteolysis through the actions of calpains or other yet to be identified protease(s). More importantly, they will determine how androgens modulate the specific enzymatic activities of androgen-sensitive protein kinases and protein phosphatases because the pharmacological inhibition of such proteins would facilitate the molecular dissection of androgen-mediated cellular proliferation and differentiation of human prostate cancer cells.
Roles in early- and late-stage prostate cancers
Growing evidence suggests that aberrant AR signaling drives the progression of early-stage prostate cancers.9,10 Early-stage prostate cancers were recently found to harbor gene fusions between the androgen-regulated protease TMPRSS2 and the oncogenic ETS family of transcription factors (e.g., ERG, ETV1). 4 Androgen-regulated TMPRSS2-ERG gene fusions produce truncated, constitutively active ERG proteins which, when overexpressed, increases the invasive behavior of primary or immortalized benign human prostate epithelial cells.8,74-76 Moreover, recent work has suggested that TMPRSS2-ERG disrupts normal prostate differentiation by activating a dedifferentiation program triggered by increased expression of the EZH2 Polycomb group protein. 9 Therefore, a logical prediction is that molecular signals that interrupt androgen-mediated differentiation will potentiate prostate cancer development. The proteomic study described here has provided further biochemical evidence that androgens control protein networks involved in the cellular differentiation of human prostate cancer cells. For example, we discovered that the androgen-sensitive microsome-associated proteins JAK2 and IKAP modulated the expression of prostate and neuronal epithelial markers in LNCaP cells (Figs. 7 and 8); this suggests that JAK2 and IKAP can function as AR co-regulators of cellular differentiation genes in human prostate cancers. Moreover, our co-transfection assays with the probasin luciferase promoter provide further experimental support that JAK2 and IKAP function as co-regulators of AR-mediated transcription in LNCaP cells (Fig. 9D). Probasin is an androgen-regulated, prostate-specific rodent gene that demarcates differentiated secretory epithelial cells.77,78 The probasin luciferase results demonstrate that perturbed JAK2 or IKAP expression might attenuate or potentiate the expression of cellular differentiation genes in normal or cancerous prostate epithelial cells. This same finding might also apply to c-SRC and c-YES, which displayed strong co-repressor activity during AR-mediated transcription (Fig. 9D). A recent study showed that co-overexpression of c-SRC and AR induced undifferentiated invasive prostate cancer that correlated with increased expression of markers of the EMT in mice. 10 Future studies will explore if c-SRC and other c-src kinase family members negatively regulate the expression of differentiation markers, such as PSA, in human prostate cancer cells.
An important finding of this study is that the increased proliferation in JAK2 and IKAP knockdown cells was AR dependent, thus demonstrating that JAK2 and IKAP antagonize AR-mediated cell growth pathways in LNCaP cells (Fig. 9B). Furthermore, the activity of the androgen-sensitive mTORC1 pathway was elevated in JAK2 knockdown cells (Fig. 9C), which suggests that the increased proliferation in this context was mediated by the mTOR pathway. 52 Additionally, JAK2 may antagonize unidentified androgen-sensitive cell growth pathways in LNCaP cells. Interestingly, IKAP knockdown cells did not exhibit a discernible increase in mTOR activity (Fig. 9C), which suggests that the increased proliferation in this context occurs through an mTOR-independent pathway. In mammalian systems, IKAP is believed to mediate cellular functions in both the cytosolic and nuclear compartments.79,80 The IKAP gene is mutated in the autosomal-recessive genetic disorder familial dysautonomia (FD), and the encoded protein is a subunit of the RNA polymerase II elongator complex. The elongator complex possesses histone acetyltransferase activity, is involved in transcriptional elongation, and serves as a cytosolic scaffold for assembly of the proinflammatory signaling complex composed of I-kappa-B kinase-alpha (IKKα), I-kappa-B kinase-beta (IKKβ), and NF-kappa-B-inducing kinase (NIK).80-85 It is less clear how IKAP might antagonize androgen-mediated proliferation of LNCaP cells because IKAP deficiency is known to disrupt cell migration and impair the branching of projections in neurons. 86 IKAP is also a necessary component of the multisubunit histone acetyltransferase elongator complex, and in its absence, the levels of Elp3, the acetyltransferase subunit of the elongator complex, are significantly reduced. Moreover, this deficiency correlates with a significant decrease in α-tubulin acetylation, 86 which is normally mediated by Elp3 and counteracted by the deacetylase activity of histone deacetylase 6 (HDAC6). 86 This link to HDAC6 is of particular interest because HDAC6 deficiency disrupts AR nuclear localization and AR-mediated transcription in androgen-sensitive and castrate-resistant prostate cancer cells. 87 Thus, targets of HDAC6 deacetylase activity are essential to AR activity. Similarly, tubulin-targeting drugs inhibit the nuclear translocation of AR, as well as AR-mediated transcription, in prostate cancer cells, 88 further supporting a functional link between tubulin and AR activity. These findings reinforce the notion that AR activity is strongly modulated by the cytoskeleton and cytoskeleton-associated proteins 89 especially because IKAP is known to interact with peroxiredoxin 1 (Prx1). 90 In addition to being an antioxidant enzyme that reduces hydrogen peroxide and alkyl hydroperoxides in cells, 91 Prx1 directly binds acetylated α-tubulin and AR, is a substrate for HDAC6, 92 and co-activates AR-mediated transcriptional responses to hypoxia/reoxygenation. 93 Based upon these molecular findings, we predict that AR activity is modulated through direct interactions with protein complexes composed of Prx1, α-tubulin, HDAC6, and IKAP. We propose that IKAP, as a subunit of the elongator complex, attenuates androgen-mediated cell proliferation by modulating the levels of α-tubulin acetylation in prostate cancer cells. This hypothesis will be tested in future studies, as we explore the molecular relationships between IKAP, the levels of α-tubulin acetylation, and the androgen-mediated cellular proliferation of human prostate cancer cells.
Another important finding of the work described here is that in standard growth medium supplemented with 10% FBS, both JAK2 and IKAP actively repressed LNCaP proliferation (Fig. 9A and 9B). A study recently showed that standard growth medium supplemented with 10% FBS contains castrate levels of testosterone and that the overall androgen levels are very close to the serum concentrations in patients undergoing androgen ablation therapy through surgical or chemical castration. 56 Interestingly, JAK2 and IKAP knockdown had no effect on the proliferation of LNCaP cells in AD growth medium, which is supplemented with 10% charcoal-stripped FBS (representative of an infraphysiological level of androgen in patients afflicted with castrate-resistant prostate cancer; data not shown). 56 Based upon these findings, it seems reasonable to question the physiological relevance of studying castrate-resistant proliferation in androgen-sensitive tumor cells exposed to androgen concentrations that are significantly lower than those in the serum of patients undergoing androgen ablation therapy. Thus, despite the conventional belief that AD growth medium replicates the castrate environment in vivo, all available evidence would suggest otherwise. 56
Another potential problem with current methods for studying the behavior of prostate cancer cells is that the LNCaP line was derived from lymph node metastasis in a patient afflicted with castrate-resistant prostate cancer. 94 Therefore, LNCaP cells have adapted to growth medium supplemented with 10% FBS, which contains castrate levels of androgens. We predict that genetic modifiers that enhance the proliferation of LNCaP cells in standard growth medium (e.g., 10% FBS) will represent bona fide regulators of the cell proliferation of castrate-resistant prostate cancers and that these proteins would go undetected in screens for proliferation effects in medium supplemented with 10% charcoal-stripped FBS. In summary, the functional consequences of JAK2 and IKAP activity for androgen-mediated signaling in human prostate cancer cells await further study.
In conclusion, this study has identified novel, androgen-sensitive membrane-associated proteins and protein networks in LNCaP prostate cancer cells. Future interrogation of these novel targets will determine their roles in androgen-mediated cell proliferation, survival, and differentiation in human prostate cancer cells. We predict that the activities of many of the androgen-sensitive proteins identified in this study will be controlled through posttranscriptional (i.e., mRNA splicing, mRNA transport), translational (i.e., initiation factors), and/or posttranslational mechanisms (i.e., protein stability). Therefore, many of these proteins will have escaped detection as androgen-sensitive targets by approaches based on the assessment of gene expression (e.g., mRNA microarrays, RNA sequencing). 21 Finally, this study demonstrates the power of quantitative proteomics to dissect androgen signaling networks in human prostate cancer cells. Indeed, this analysis has provided a molecular framework for developing and testing new hypotheses about how individual androgen-sensitive membrane-associated proteins and protein networks contribute to the physiological properties of human prostate cancers.
Materials and Methods
The following reagents were purchased: AR agonist R1881 (methyltrienolone) (PerkinElmer Life Sciences, Waltham, MA); double-stranded siRNAs (Dharmacon Research, Lafayette, CO); Oligofectamine reagent, 4% to 12% SDS-polyacrylamide gels, and TOPO TA cloning kit (Invitrogen, Carlsbad, CA); prestained Precision Plus protein standards and goat anti-mouse horseradish peroxidase–conjugated secondary (Bio-Rad, Hercules, CA); mouse monoclonal AR antibody (AR441) (Santa Cruz Biotechnology, Santa Cruz, CA); mouse monoclonal IKAP antibody (clone 33) (BD Transduction Laboratories, Franklin Lakes, NJ); rabbit polyclonal pS6KThr389 (product #9205), rabbit monoclonal S6K (product #2708), rabbit monoclonal pS6Ser235/Ser236 (product #4858), mouse monoclonal S6 (product #2317), and rabbit monoclonal p4EBP1Thr37/Thr46 (product #2855) (Cell Signaling Technology, Danvers, MA); bicinchoninic acid protein assay (BCA) kit (Pierce, Rockford, IL); ECL reagents kit and Hyperfilm ECL film (GE Healthcare, Little Chalfont, UK); DNA oligonucleotides (Invitrogen); FastStart TaqDNA polymerase (Roche Applied Science, Basel, Switzerland); FBS and charcoal-stripped FBS (Hyclone Laboratories, Logan, UT); pCMV-SPORT6-JAK2 and pOTB7-IKAP (American Type Culture Collection, Manassas, VA); and pCMV6-XL5-YES1 (Origene, Rockville, MD). The pCI-hSRC and pCI-hSRCY530F plasmids were provided by Dr. Hsien-Jien Kung.
Cell lines
LNCaP-FGC cells were from the American Type Culture Collection. LNCaP-FGC cells were grown in phenol red–deficient RPMI 1640 medium (Invitrogen) containing 10% FBS (Hyclone Laboratories).
Preparation of SCE microsomes, labeling with ICAT reagent, and analysis by MS/MS
Crude microsomes were isolated from AD and AS LNCaP cells, exactly as detailed previously. 27 Crude microsomal pellets were solubilized in 100 mM sodium carbonate buffer (pH 11.5) at 4°C for 30 minutes. Solubilized microsomes were spun at 100,000g for 3 hours, and solubilized proteins were diluted with buffer A (50 mM Tris, pH 8.5, 5 mM EDTA, 1% SDS). A total of 5.0 mg of microsome-associated proteins (2.5 mg from AD cells and 2.5 mg from AS cells) were labeled with ICAT reagent (AD, d0 ICAT reagent; AS, d8 ICAT reagent) as detailed previously 27 with the following modifications: microsomes were reduced with 5 mM tributylphosphine (TBP) for 3 hours, and TBP-reduced extracts were labeled with ICAT reagent for 3 hours and were digested with trypsin overnight at 37°C. The 5-mg trypsin-digested, ICAT-labeled peptide mixture was subjected to strong cation exchange chromatography. Subsequently, 43 cation exchanged fractions were avidin purified, and ICAT reagent-labeled fractions were analyzed by microcapillary liquid chromatography electrospray ionization tandem mass spectrometry (μLC-ESI-MS/MS).
Analysis of mass spectrometry data
Uninterpreted MS/MS spectra were searched against a nonredundant amino acid ipi.HUMAN.fasta.v2.31 database. Tandem mass spectra were analyzed using the SEQUEST database search software (http://proteomicsresource.washington.edu/sequest.php). 95 The database search criteria included a static modification of cysteine residues of 503 Da (mass of cysteine plus light ICAT) and a variable modification of 8 Da for cysteines (for the heavy ICAT).96,97 Additionally, searches were performed with no enzyme constraint on the peptides analyzed from the sequence database. SEQUEST output was analyzed using the INTERACT program (http://tools.proteomecenter.org), and peptides containing the following values were considered to be correct identifications: Xcorr >1.5, Δ correlation scores ≥0.1, Sp rank ≤8, singly tryptic, contain at least one cysteine residue. This generated a list that contained 10,473 MS/MS spectra. All peptide identifications were confirmed by manual inspection of the data. Comparing these criteria to those generated from the PeptideProphet software, 86% of the entries had a probability of 0.99 or higher, and 95% of the entries in the list had a probability of 0.90 or higher. 98 All d0/d8 peptide ratios were analyzed and validated/corrected using the XPRESS quantification program. 97 Quantitative ratios are generated by taking the ratios of the calculated heavy and light elution peak areas for ICAT reagent–labeled peptides. Singletons were quantified as detailed previously. 27 MzXML files were generated from Thermo Finnigan *.raw files (San Jose, CA) using the ReAdW tool, and the files may be downloaded from ProteomeCommons.org Tranche using the following hash: 5kHxVxXj5ozqAyivr31VEfjhVkgGiLS+Ws5l8wkPvyRaoIqhuoHzLVSIgqV+RqmdbHGWbS5ffyVjYQkpsX2ufP9Ti7IAAAAAAAAD2g==.
Bioinformatic analyses
Microsome-associated proteins were considered to be androgen sensitive if they were differentially expressed (d8/d0 ≥1.5-fold and d8/d0 ≤0.67-fold) in either the UNW or SCE microsome experiments applying ProteinProphet values of 5% FDR. 99 Such proteins were analyzed using the IPA program (Ingenuity Systems) when it was necessary to identify enriched canonical pathways and PPI networks in the selected protein lists, using the GeneGo bioinformatic software program.
Western blotting and silver-stain analyses
Proteins in crude lysates of microsomes derived from 72-hour AD and AS LNCaP cells were solubilized in buffer B (50 mM Tris-HCl, 150 mM NaCl, 5 mM EDTA, pH 7.4, 1% SDS) and quantified with the BCA assay. Then, 4 μg of the AD and AS microsome-associated protein lysates were subjected to immunoblot analyses (Fig. 6). For siRNA experiments, 96-hour siRNA-transfected LNCaP cells were solubilized in 0.3 mL of buffer B and heated to 65°C for 5 minutes. Total protein lysates were quantified using the Pierce BCA protein assay kit. There was 4 μg of total protein lysates subjected to SDS-PAGE (4%-12% gradient precast gels) (Invitrogen). Proteins were transferred onto a polyvinylidene difluoride membrane, incubated in Tris-buffered saline containing 0.1% Tween 20 (TBST), and blocked with 5% nonfat milk (w/v) for 1 hour. Membranes were incubated in TBST containing 5% bovine serum and 1:250 dilution of the AR441 mouse monoclonal antibody (Santa Cruz Biotechnology); 1:5,000 dilution of IKAP monoclonal FAS (clone 23, 1 µg/mL), monoclonal nestin (clone 25, 0.5 µg/mL), monoclonal GFAP (clone 52, 1 µg/mL), and monoclonal MAP2 (clone 18, 1:2,500 dilution) from BD Transduction Laboratories; rabbit polyclonal JAK2 (product #3773, 1:1,000 dilution), rabbit polyclonal pS6KThr389(product #9205, 1:1,000 dilution), rabbit monoclonal S6K (product #2708, 1:1,000 dilution), rabbit monoclonal pS6Ser235/Ser236 (product #4858, 1:1,000 dilution), mouse monoclonal S6 (product #2317, 1:1,000 dilution), and rabbit monoclonal p4EBP1Thr37/Thr46 (product #2855, 1:1,000 dilution) from Cell Signaling Technology; monoclonal β-tubulin III (clone TUJI, 1 µg/mL) from Covance (Princeton, NJ); rabbit polyclonal neuronal-specific enolase NSE (product PC23, 1:10 dilution) from Oncogene (La Jolla, CA); and rabbit polyclonal PSA (product A0562, 1:5,000 dilution) from DAKO (Carpinteria, CA) overnight at 4°C. The blots were washed 3 times for 5 minutes in TBST and then incubated with a goat anti-mouse horseradish peroxidase secondary at a 1:10,000 dilution in TBST for 1 hour at room temperature. The blots were washed 3 times for 5 minutes in TBST, and immunoreactive bands were developed and visualized using the ECL reagent kit (GE Healthcare). The blots were exposed to Hyperfilm ECL film (GE Healthcare) for <5 minutes. In silver-staining experiments, 4 ug of total protein lysates were resolved on SDS polyacrylamide gels and were visualized by silver staining as detailed previously. 100
siRNA experiments for Western blot
LNCaP cells seeded at 3,000 cells/cm2 were transfected with the control, JAK2, and IKAP siGENOME SMARTpool siRNAs. Control (catalog no. D-001210-01-20), JAK2 (catalog no. L-003146-00-0005, with target sequences: 5′-GGA AUG GCC UGC CUU ACG A-3′, 5′-AAU CAA ACC UUC UAG UCU U-3′, 5′-UUA CAG AGG CCU ACU CAU A-3′, 5′-CGA AUA AGG UAC AGA UUU C-3′), and IKAP (catalog no. L-009371-00-0005, with target sequences: 5′-ACG AAG CUC UGA AGU UAU A-3′, 5′-CGU CAA AUA UCA CGU CAU U-3′, 5′-CCA GAA AUU UGG ACU CUU A-3′, 5′-CAA GAA ACG UUU AUU GGU A-3′) were transfected at a final concentration of 50 nM, after a 24-hour incubation in medium A (phenol red–deficient RPMI 1640 medium supplemented with 10% FBS lacking antibiotics) or medium B (phenol red–deficient RPMI 1640 medium supplemented with 10% charcoal-stripped FBS lacking antibiotics) using the Oligofectamine reagent (Invitrogen) according to the manufacturer’s guidelines. Transfected cells were exposed to siRNA duplexes for 96 hours, solubilized in buffer B, and quantified with the BCA assay.
Cell growth assays
LNCaP cells on day 0 were seeded at 3,000 cells/cm2 into 6-well tissue culture dishes and incubated in medium A. On day 1, LNCaP cells were transfected with control, JAK2, or IKAP siRNAs. On day 6, cells were washed with PBS and trypsinized, and cell growth of control, JAK2, and IKAP siRNA–transfected LNCaP cells was quantified using trypan blue dye exclusion. 101
Fluorescent cell growth assays
LNCaP cells on day 0 were seeded at 3,000 cells/cm2 into 96-well tissue culture dishes and incubated in medium A. On day 1, LNCaP cells were transfected with control, AR, JAK2, IKAP, control/AR, JAK2/AR, control/IKAP, IKAP/AR, or control/AR siRNAs at 100 nM (50:50 nM). On day 6, cells were quantified using the CyQUANT Cell Proliferation Assay Kit (Invitrogen) according to the manufacturer’s guidelines. Fluorescence measurements were quantified with a Glomax fluorescence microplate reader (Promega, Fitchburg, WI) with excitation at 490 nm and emission detection at 530 nm.
Luciferase assays
LNCaP cells seeded at a density of 30,000 cells/cm2 into Falcon (BD Biosciences) 24-well tissue culture dishes for 24 hours in medium B (phenol red–deficient RPMI 1640 growth media supplemented with 10% charcoal-stripped FBS lacking antibiotics) were transfected with Lipofectamine LTX with Plus reagent (Invitrogen). Transfections were carried out in triplicate, with 335 ng of total plasmid DNA (pGL4.10-Luc2-probasin [10 ng], 102 pRLSV40 Renilla [25 ng] [Promega], or pcDNA3)/well, plus increasing amounts (30 ng, 100 ng, 300 ng) of mammalian expression vector encoding JAK2 (pCMV-SPORT6), IKAP (pcDNA3), c-YES (pCMV6-XL5), c-SRC (pCI), or c-SRCY530F (pCI). The total amount of transfected plasmid DNA (335 ng) was held constant by adding pcDNA3 vector to the 30-ng and 100-ng transfection reactions. Androgen (1 nM R1881) or vehicle (ethanol) was added 24 hours after transfection, and total cell lysates were assessed for dual luciferase activity 24 hours later, using the Dual-Luciferase Reporter (DLR) Assay System (Promega) according to the manufacturer’s detailed protocol. Values for firefly and Renilla luciferase were determined using the Veritas microplate luminometer (Turner Biosystems, Sunnyvale, CA). The means and standard deviations for all firefly luciferase values were calculated, and a pairwise Student t test was used to assess significant differences (P ≤ 0.05) between cells transfected with positive control versus other vectors.
Light microscopy
Light microscope photographs of cells were imaged using a digital camera at 10x on an Olympus IX70 inverted microscope (Tokyo, Japan).
DNA cloning
The pOTB7-IKAP vector was PCR amplified using the Advantage GC-2 polymerase (Clontech, Mountain View, CA) and cloned in-frame into the 5′ NotI and 3′ XhoI restriction sites of the pcDNA3 vector. The oligonucleotide primers (Integrated DNA Technologies, Coralville, IA) used for the cloning of pCDNA3-IKAP included a 5′ NotI primer (GATCGCGGCCGCatgcgaaatct gaaattatttcggaccctg) and a 3′ XhoI primer (5′ GATCCTC GAG tcagtctagcaggctcagcttccactgggttc 3′).
Footnotes
Acknowledgements
The authors thank Dr. Hsien-Jien Kung for providing reagents and Dr. Christine Blaumueller for skillful editing of the article.
The author(s) declared no potential conflicts of interest with respect to the research, authorship, and/or publication of this article.
This work was supported by start-up funds provided by the University of California at Davis and the University of Iowa Carver College of Medicine.
References
Supplementary Material
Please find the following supplemental material available below.
For Open Access articles published under a Creative Commons License, all supplemental material carries the same license as the article it is associated with.
For non-Open Access articles published, all supplemental material carries a non-exclusive license, and permission requests for re-use of supplemental material or any part of supplemental material shall be sent directly to the copyright owner as specified in the copyright notice associated with the article.