
Abstract
The early growth response gene 1, EGR1, is an important transcriptional regulator and acts as the convergent point between a variety of extracellular stimuli and activation of target genes. Unlike other tumor types, prostate tumors express high levels of EGR1 relative to normal tissues. However, the mechanism of EGR1 regulation in prostate tumor cells is unknown. As EGR1 expression and epidermal growth factor (EGF) signaling are frequently upregulated in prostate tumors, we tested the hypothesis that EGF induces EGR1 expression in prostate cancer cells. Using RT-PCR to quantify EGR1 transcripts, we found that EGF induced EGR1 expression in a dose- and time-dependent manner and the ERK pathway inhibitor, PD98059, abrogated the EGF-mediated EGR1 response in LNCaP and PC3 cells. Analysis of the EGR1 promoter using deletion constructs identified an EGF-responsive region in the proximal promoter (–771 to −245 bp) containing 3 potential serum response element (SRE) sites. In vivo chromatin immunoprecipitation assays demonstrated that Elk-1 binding at the SRE sites of the EGR1 promoter was enhanced by EGF treatment in PC3 cells. Overexpression of Elk-1 was sufficient to activate the EGF-responsive region of EGR1 promoter in PC3 cells and, similarly, a dominant-negative Elk-1 suppressed EGR1 promoter activity. Taken together, these results demonstrate for the first time that EGR1 expression in PC3 cells is mediated through an EGF-ERK-Elk-1 signaling cascade.
Keywords
Introduction
EGR1 is an important transcriptional regulator and has been described as a “master switch” linking extracellular stimuli to diverse long-term responses including cell growth, proliferation, and apoptosis.1-3 In many tumor types, such as glioblastoma, lymphoma, and carcinomas of the lung and breast, EGR1 is low or absent,4-7 indicating a tumor suppressive role. Indeed, EGR1 targets include the tumor suppressors PTEN and p53 and the pro-apoptotic factor c-Jun.8-10 In some systems, the absence of EGR1 keeps cell proliferation and growth signals in check by allowing the growth suppressors to act unopposed.
Paradoxically, EGR1 expression is elevated in prostate tumor tissues relative to normal tissues at both the mRNA and protein levels, and its expression correlates with Gleason score.11,12 Loss of expression of an EGR1 repressor protein, NGF-1A-binding protein (NAB2), may also contribute to elevated EGR1 levels found in prostate tumors. 13 Functional studies using antisense EGR1 RNA reduced cell proliferation, colony formation, and growth in soft agar in prostate cancer cells, suggesting that EGR1 is necessary for the transformed tumor phenotype. 14 Additionally, anchorage-independent growth and metastasis may be promoted by the direct action of EGR1 on target genes fibronectin and TGFβ1 as well as by the frequent deletion or inactivation of the tumor suppressors PTEN and p53 in prostate tumors.15,16
Although the many transcriptional targets of EGR1 are well described, little is known about the mechanisms regulating EGR1 gene expression in the context of prostate cancer. In other tissue types, EGR1 is induced by a variety of mitogenic stimuli including growth factors, serum, and cytokines.17-20 However, changes in EGR1 transcript levels are largely dependent on the particular growth factor and the tissue type. One rational candidate for regulation of EGR1 in the prostate is epidermal growth factor (EGF). Both EGF and its receptor have been shown to be elevated in prostate tumors21-23 and are associated with disease progression.24,25 EGF transmits its signal inside the cell primarily through the extracellular regulated kinase (ERK) pathway. One well-described downstream target of ERK is the Elk-1 transcription factor.26,27 Elk-1 is characterized by its Ets-binding domain, recognizing the canonical sequence 5′-GGA(A/T)-3′, and its ability to form a ternary complex with the serum response factor (SRF) on target promoters at the serum response element (SRE). 28 The Elk-1 protein structure not only provides docking sites for ERK and other mitogen activated kinases29,30 but also contains a phosphorylation site that confers Elk-1 transcriptional activity onto target genes.26,31 Some of the best-described targets of Elk-1 are the immediate early genes (IEGs), c-fos,32,33 EGR1,34,35 and JunB, 17 whose expression is often rapid and transient after stimulation (reviewed by Adamson and Mercola 3 ).
As EGR1 expression and EGF signaling are frequently upregulated in prostate tumors, we sought to evaluate the potential of EGF to induce EGR1 expression in a prostate cancer tissue system. An additional goal of this study was to identify the region of the EGR1 promoter affected by EGF treatment. Here we report EGF induction of EGR1 gene transcription and the identification of the EGF-responsive region of the EGR1 promoter in both androgen-responsive (AS) and androgen-independent (AI) prostate cancer cells. Additionally, in AI PC3 cells Elk-1 was identified as a transcription factor that bound and activated the EGF-responsive region. Interestingly, Elk-1 does not appear to mediate the EGF/ERK signaling pathway in the AS LNCaP prostate cancer cells. Overall, these results identify the EGF-ERK pathway as a major regulatory mechanism of EGR1 in prostate cancer cells.
Results and Discussion
Regulation of EGR1 by epidermal growth factor via the ERK pathway
To determine whether EGF induced transient expression of EGR1 after stimulation, LNCaP, CWR, and PC3 cells were treated with EGF for either 1 h or 4 h and samples collected for RNA analysis (Fig. 1A). As expected, each cell line exhibited a strong increase in EGR1 transcription at 1 h (190-, 31-, and 60-fold induction for LNCaP, CWR, and PC3 cells, respectively) and significantly reduced activation by 4 h (3.0-, 3.3-, and 33-fold activation, respectively) although levels were still significantly greater than control. Similarly, EGR1 protein levels responded transiently to EGF with the highest abundance of protein present at 1 h after treatment (Suppl. Fig. S1). To demonstrate the sensitivity of EGR1 expression to EGF levels, a dose response experiment was performed (Fig. 1B). Surprisingly, EGR1 transcript levels were elevated more than 50-fold relative to control with as little as 0.5 ng/mL of EGF. A maximal response was seen using 5 ng/mL of EGF, and no significant increase in activation was observed between 5 ng/mL and 50 ng/mL. These results were obtained using physiologically relevant concentrations of EGF, as EGF concentrations in prostatic fluid have been reported to range from 40 to 175 ng/mL. 36
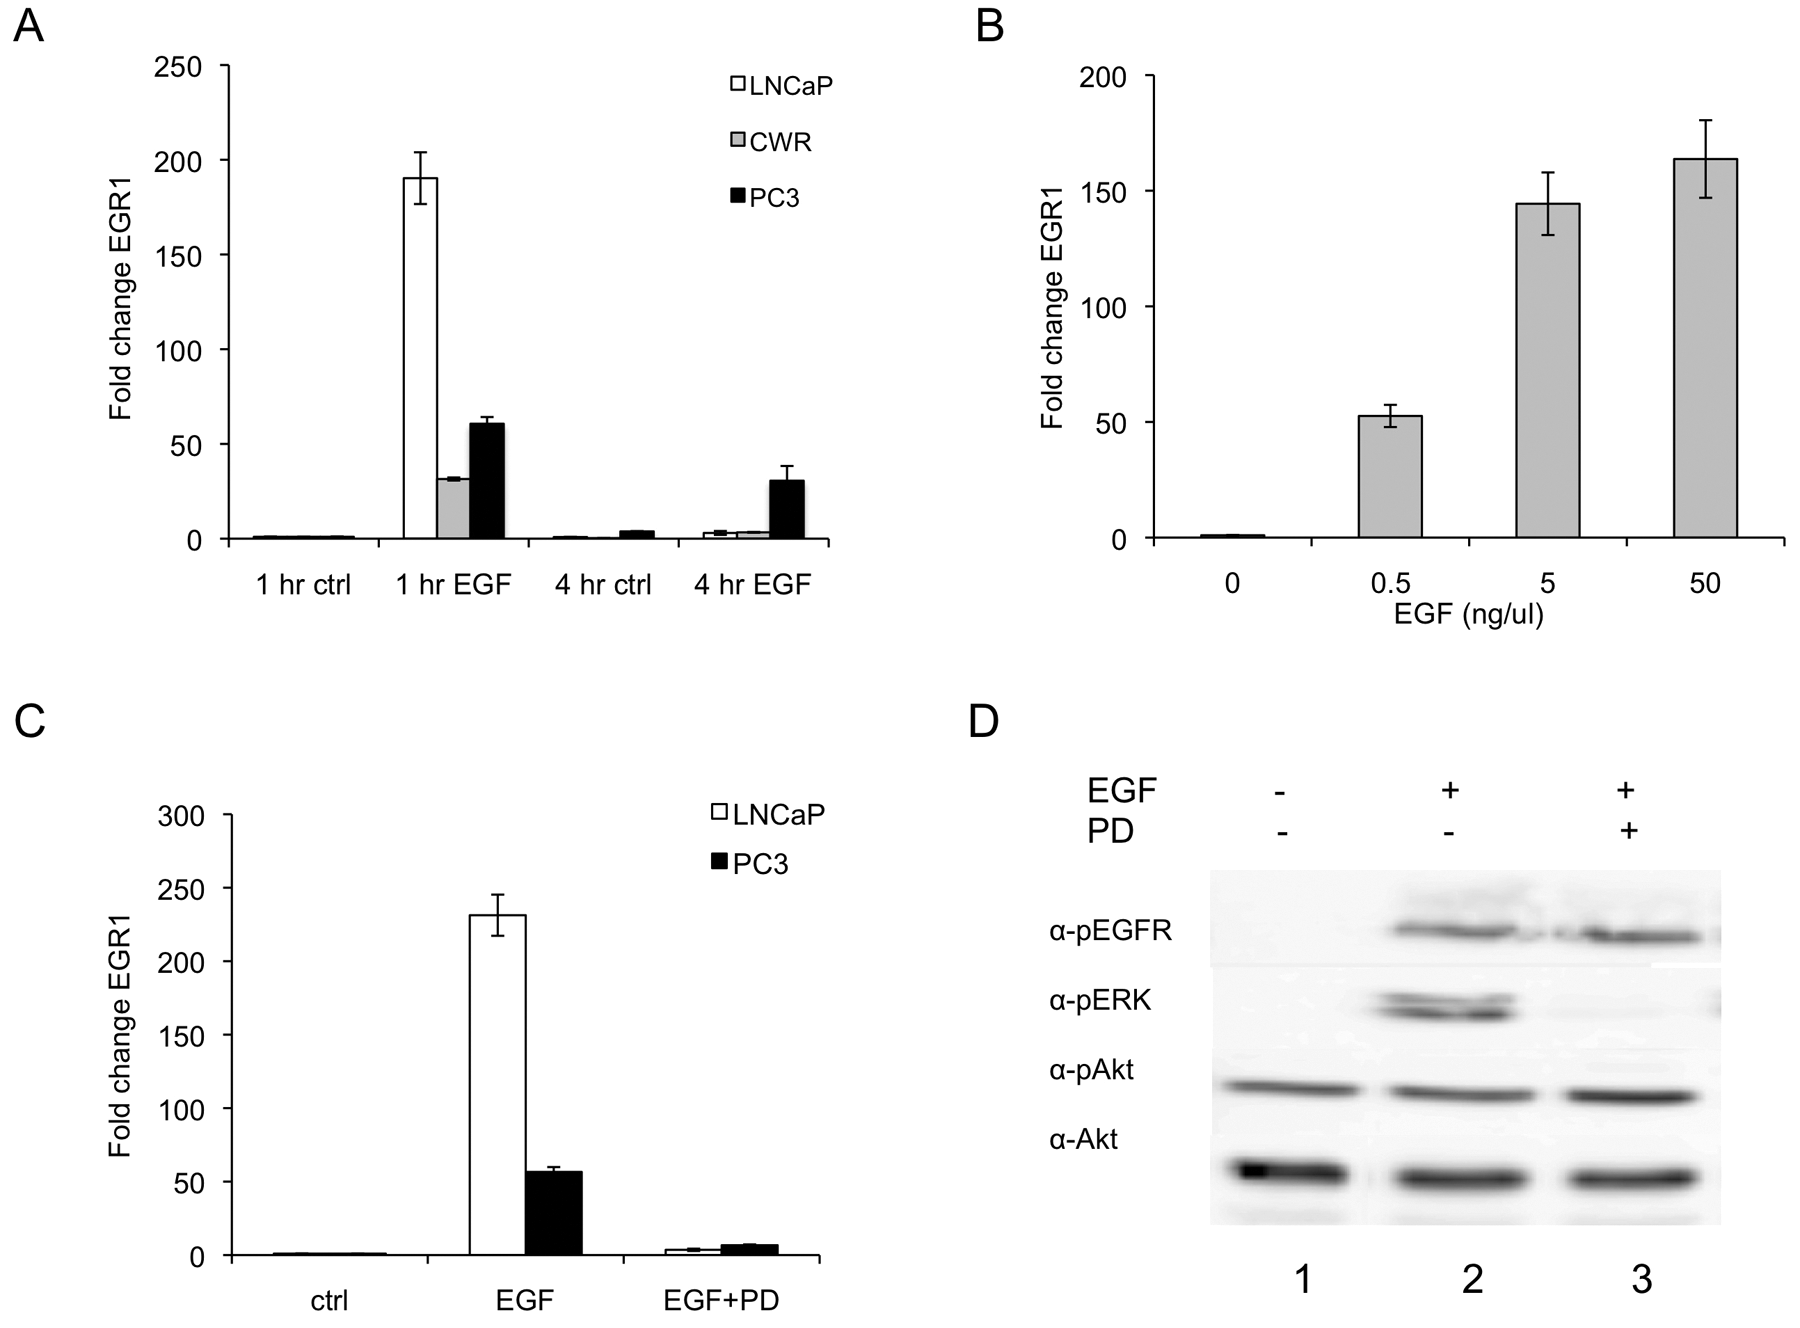
EGF elevates EGR1 transcript levels via the ERK pathway in prostate cancer cells. (
Overall, these data support a strong but transient EGF-induced EGR1 expression pattern in prostate cancer cells. Although the most dramatic increases in EGR1 expression were seen at 1 h after treatment, EGR1 mRNA levels remained elevated above control for several hours. Other reports have also described high levels of EGR1 mRNA and protein in tumor tissues.11,12,37,38 The variability in expression of EGR1 in tumor tissues may reflect the observed variable response of EGR1 transcript levels to EGF treatment of different cell lines. The latter may be associated with hyperactivity of the EGF receptor, as it has been reported that PC3 cells express a constitutively active EGF receptor and thus are less responsive to an EGF stimulus.39,40 Conversely, LNCaP cells, which do not express a constitutively active receptor, exhibited dramatic increases in EGR1 transcript levels, suggesting that these cells may still be highly sensitive to the EGF ligand.
To determine whether the ERK signaling pathway might be regulating the EGF-mediated EGR1 transcriptional response, the pharmacological MEK inhibitor PD98059 was used. As seen in Figure 1C, PD98059 attenuated the EGF response by 98% in LNCaP cells and 88% in PC3 cells, decreasing the activation of EGR1 transcription from 231-fold to 3.6-fold activation and from 57-fold to 7-fold activation, respectively. Phosphorylation of the downstream targets ERK and Akt was examined to determine the specificity of the inhibitor in LNCaP cells. As expected, EGF induced phosphorylation of EGF-receptor, and ERK and PD98059 inhibited ERK phosphorylation by nearly 93% (Fig. 1D, lanes 2 and 3, α-pERK). Interestingly, EGF did not induce Akt phosphorylation above basal levels in LNCaP cells (Fig. 1D, lanes 1 and 2, α-pAkt). A significant amount of basal pAkt signal was observed, likely due to the constitutively active PI3K pathway in LNCaP cells, which are PTEN deficient. 41 Together, these results suggest that the activation of EGR1 occurs through the ERK pathway.
These results are consistent with the role of ERK as the major regulatory mechanism of EGR1 expression in other tissue types such as fibroblasts, keratinocytes, and hepatocytes.17,19,20 This mechanistic role is supported by results of MEK inhibition studies showing that in both LNCaP and PC3 cells, PD98059 treatment attenuated the activation of the EGR1 promoter by EGF and effectively abrogated the induced increase in EGR1 transcript levels. For completeness we also considered the PI3K pathway but obtained no evidence to support a significant role for PI3K in activation of EGR1 expression. Although wortmanin treatment (500 nM) affected EGR1 transcript levels, it also reduced pERK levels 2-fold (data not shown), suggesting that wortmanin effects on ERK pathway were responsible for its modest suppression of transcript levels. Taken together, these data support our hypothesis that ERK drives EGF-mediated regulation of EGR-1.
Analyses of the EGR1 promoter identified several SRE binding sites and the EGF-responsive region
As the SRF/Elk-1 complex (or TCF) is a well-known target of ERK, we hypothesized that Elk-1 might be regulating the EGR1 promoter at the predicted SRE sites. Locations of predicted SRF/Elk-1 binding sites (SREs) were identified within the EGR1 promoter using MatInspector. Predicted sites were identified as core (c), proximal (p), or distal (d) in relation to the EGR1 transcriptional start site within a luciferase promoter construct containing −1,260 to +35 of the human EGR1 promoter 42 (Fig. 2A). Deletion constructs were created from the full-length EGR1 promoter to identify the EGF-responsive region. LNCaP and PC3 cell lines were transiently transfected with each of 3 EGR1 promoter deletion constructs and assayed for luciferase activity (Fig. 2B and 2C). Although deletion of the distal region of SRE sites (–771 hEGR1) had no effect on EGF activation of the EGR1 promoter, deletion of the proximal SRE sites (–245 hEGR1) reduced activation levels to 3% and 22% of the full-length (–1,260 hEGR1) promoter in LNCaP and PC3 cells, respectively. These results indicate that the −771 to −245 bp region of the EGR1 promoter is essential to the EGF-mediated response and that the transcription factor(s) mediating that activity must have binding sites located within the EGF-responsive region. Furthermore, the distal sequence between −1,260 and −771 bp and the core region from −245 to +35 bp contributed little to EGF-mediated activity of the EGR1 promoter.
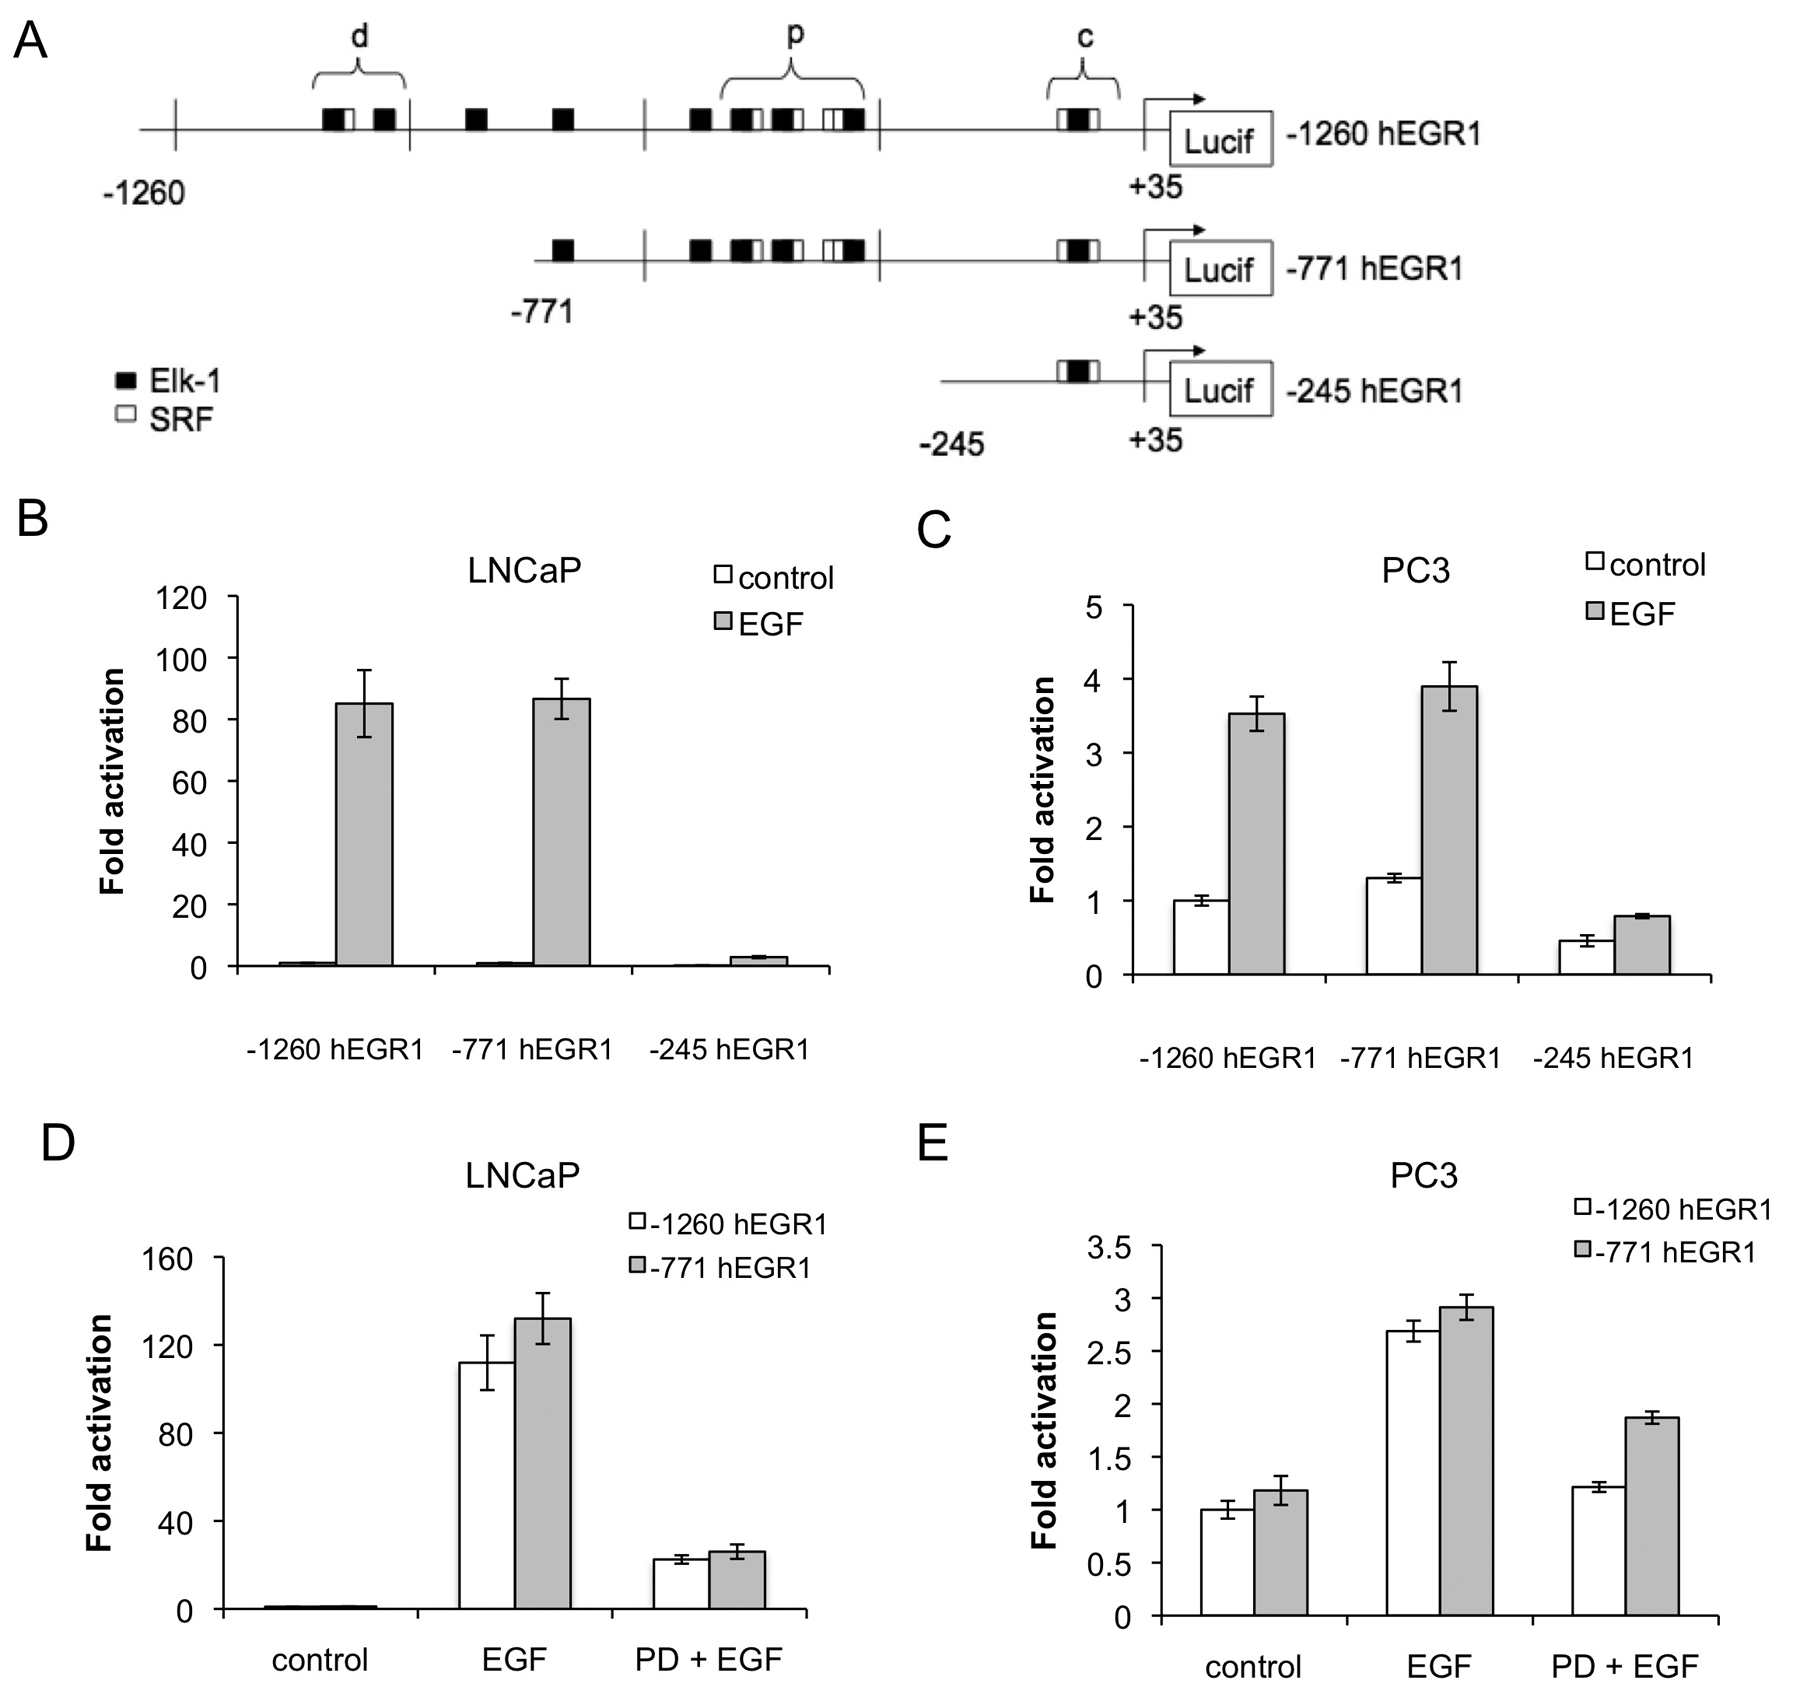
Transcriptional activation of the hEGR1 promoter is dependent on the proximal SRE sites and the Erk pathway in LNCaP and PC3 cells. (
The importance of the ERK pathway for transcriptional activation of the EGR1 promoter was verified using the MEK inhibitor PD98059, which reduced EGR1 promoter activity in both −1,260 hEGR1 and −771 hEGR1 constructs by ~80% in LNCaP cells (Fig. 2D) and 55% and 36% in PC3 cells (Fig. 2E) relative to the activity in the presence of EGF alone. These results are consistent with the analysis of EGR1 mRNA expression and demonstrate that the MEK inhibitor attenuated the activity of the EGR1 promoter within the −771 to -245 bp region. This also indicates that EGF activation of EGR1 is transcriptionally mediated since both endogenous mRNA and an exogenous reporter constructs were stimulated in the presence of EGF. Taken together, these results indicate that the transcription factor mediating the EGF-response in both AS and AI PrCa cells is a downstream target of the ERK pathway and its binding site is located in the proximal region of the EGR1 promoter containing 3 SRE sites.
Others have also demonstrated that this cluster of SRE sites is functional although in other cell types and using different stimuli.20,43,44 However, it is necessary to examine the regulatory mechanism of EGR1 in prostate cancer cells, as different stimuli appear to activate different promoter regions in other cell systems. Although this study did not determine which of the 3 SRE sites was necessary for the EGF response, Chen et al. 43 identified the most downstream of the 3 SRE sites, within the core promoter region, to be essential for estrogen-mediated response in MCF-7 cells and determined that both the TCF and SRF sites within this core SRE region were required. Aicher et al. 45 also found that deletion of the SRE within the core region (within −100 bp) abrogated activity of the EGR1 promoter in L929 fibroblasts and to a lesser extent in 3T3 fibroblasts. Conversely, in our studies, this core region responded weakly to EGF in prostate tumor cells. The focus of these studies was to identify the EGF responsive region of the EGR1 promoter. Localization of the EGF responsive regions to the proximal promoter via deletion analysis did not identify the required bases within the SRE, but additional mutagenesis studies could be used to pinpoint which of the 3 potential SRE sites within the proximal promoter are required for EGF induction of EGR1. Overall, these studies provide evidence of the variability of EGR1 regulation in different cell types and demonstrate that the extent of regulation by each SRE site is highly tissue specific.
Given that EGR1 transcription is activated by the ERK signaling, we focused on the Elk-1 transcription factor as a potential regulator of the EGR1 promoter. Elk-1, a member of the Ets family of transcription factors, is a well-described target of ERK signaling46-48 that regulates the promoters of other immediate early genes such as c-fos and c-jun.49,50 An in vivo analysis of the EGR1 promoter using chromatin immunoprecipitation assays was performed to identify functional Elk-1 binding. Primers flanking the proximal SRE sites, −603 to −315 bp, within the EGR1 promoter (Fig. 3A) were used to amplify chromatin immunoprecipitated with Elk-1 antibody (Fig. 3B). Chromatin immunoprecipitation of Elk-1 at the EGF-responsive region of the EGR1 promoter indicated that Elk-1 was bound to native chromatin in LNCaP and PC3 cells. Although EGF had little effect on the binding of Elk-1 to the EGR1 promoter in LNCaP cells (Fig. 3B, bottom panel), EGF enhanced binding of Elk-1 at the proximal SRE sites an average of 6-fold over control in PC3 cells (Fig. 3B, top panel, lanes 4 and 5) as determined by background correction using Image J analysis. Interestingly, a significant amount of Elk-1 was bound in the absence of EGF stimulation in both cell lines tested (Fig. 3B, lane 4), suggesting that Elk-1 may be constitutively bound in these cells. This differential immunoprecipitation was quantified by RT-PCR analysis of chromatin bound by Elk-1 in PC3 cells, normalized relative to input (nonimmunoprecipitated) chromatin (Fig. 3C). These results confirmed the enhanced binding of Elk-1 in the presence of EGF but also demonstrated a significant amount of bound Elk-1 in control cells.
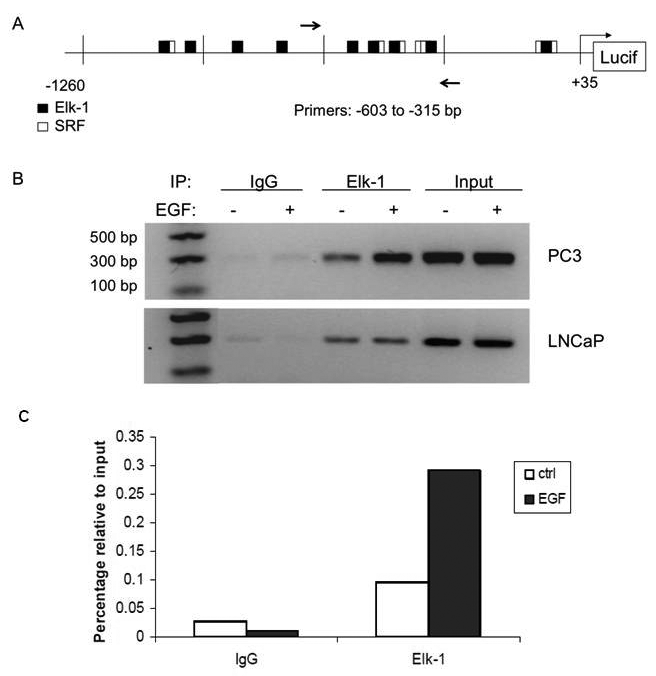
Chromatin immunoprecipitation analysis of the proximal region of SRE sites within the EGR1 promoter in PC3 cells. (
Others have reported similar unstimulated Elk-1 binding at the EGR1 promoter in HeLa cells 49 ; it is speculated that constitutive binding of Elk-1 to the promoter of target genes is necessary to elicit a rapid transcriptional response of immediate early genes such as EGR1. However, in LNCaP cells Elk-1 binding was unaffected by stimulus, suggesting that another transcription factor downstream of ERK signaling (e.g., SAP-1 or SAP-2), may be mediating the EGF response.
To assess whether Elk-1 was sufficient to activate the EGR1 promoter, co-transfection experiments using the −771 hEGR1-luc reporter construct and Elk-1 expression constructs were performed. In PC3 cells, the Elk-1 expression construct enhanced EGF mediated activation of the hEGR1 promoter by nearly 6-fold relative to activation of the empty vector, pcDNA3 (Fig. 4A). Consistent with the ChIP results seen in Figure 3, Elk-1 did not significantly affect the activity of the EGR1-luc promoter in LNCaP cells (data not shown). These differences between cell lines in response to exogenous Elk-1 may be due to high endogenous levels of Elk-1 in LNCaP cells, as we observed that the −771 hEGR1-luc promoter had high levels of activity even in the absence of EGF in LNCaP cells. To determine the necessity of the DNA binding domain, a construct with a deletion of amino acids 2-93 of the Elk-1 DNA-binding domain, Elk-1ΔDBD, was used. Deletion of the DNA binding domain reduced Elk-1–mediated activation by 36% in PC3 cells, suggesting that Elk-1 binding at the Ets binding site was necessary for full activation of the EGR1 promoter in response to EGF. However, given that there was only a partial attenuation of the EGR1 response by the Elk-1 deletion construct without the DNA-binding domain, this suggests that there may be other indirect Elk-1 interactions, possibly affecting binding of SRF at the SRE site. Although the DNA binding domain was deleted in the Δ-DBD construct, the SRF interaction domain was retained, and thus SRF interactions could be maintained. Indeed, SRF has been shown to recruit Elk-1 to the SRE and is often constitutively bound at the SRE site in other immediate early gene promoters, such as c-fos. 33
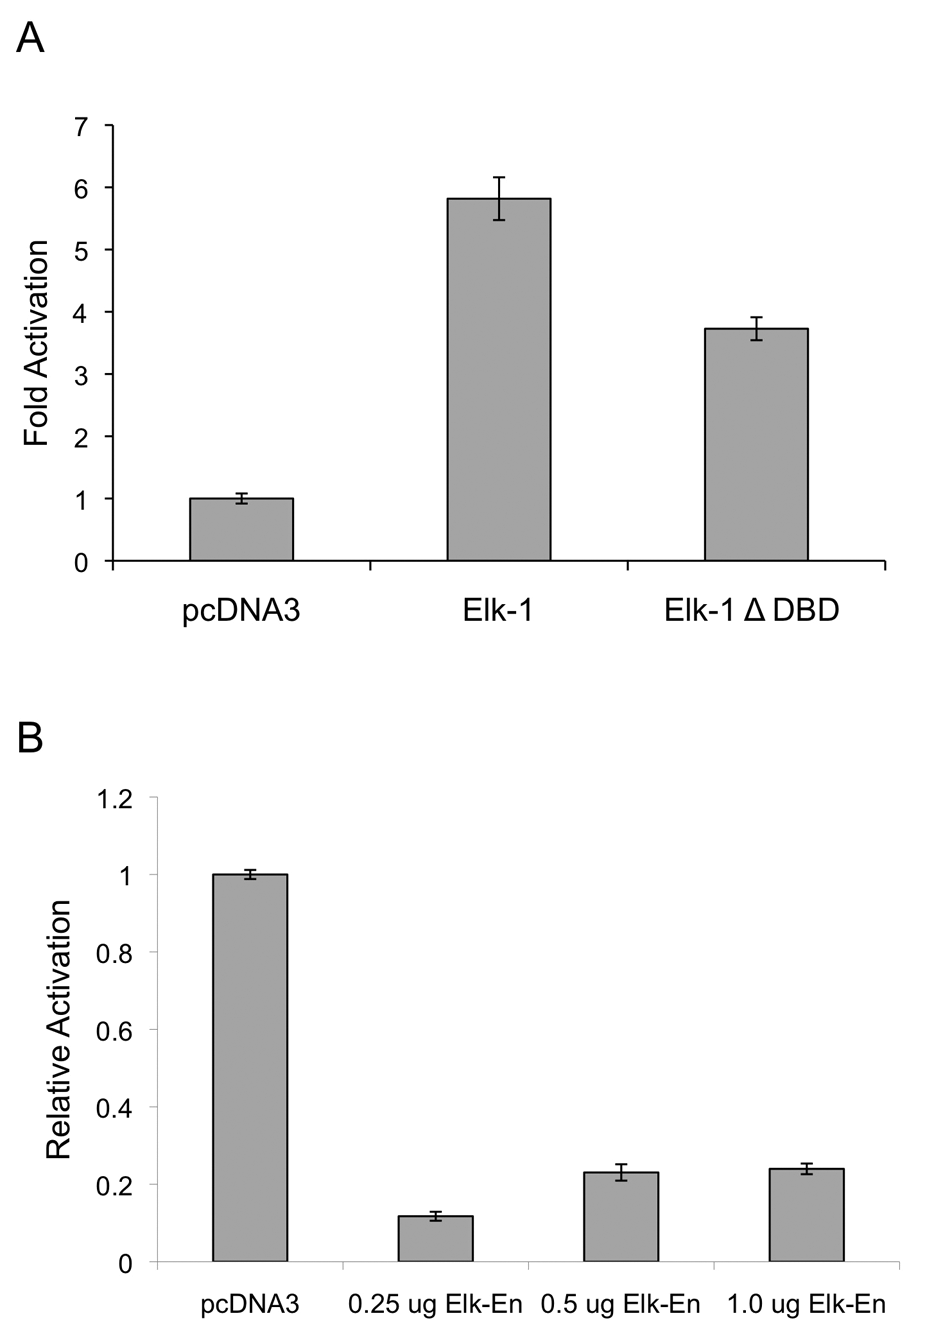
Activation of the −771 hEGR1 promoter is enhanced by Elk-1 expression and inhibited by a dominant negative Elk-1 in PC3 cells. Cells were grown and treated with EGF as previously described in Figure 2 above. (
To assess the necessity of Elk-1 expression for EGF induction of EGR1, a dominant-negative Elk-1 expression construct (Elk-En), containing a constitutive repression domain of the Drosophila Engrailed gene, 50 was co-transfected with the −771 hEGR1-luc promoter. In the presence of Elk-En, activation of the EGR1 promoter was attenuated by more than 76% in PC3 cells relative to the pcDNA3 control vector with all concentrations of Elk-En tested (Fig. 4B). This indicates that EGR1 is an Elk-1 target, as recruiting the repressor Elk-En to binding sites was sufficient to block EGF-mediated activation of EGR1 expression. These results, along with the results from the Elk-1 overexpression experiment, indicate that Elk-1 is necessary and sufficient for EGR1 transcriptional activity in PC3 cells.
Elk-En suppresses gene transcription through histone deacetylation and chromatin modification of Elk-1 target genes. 51 As the dominant-negative Elk-En repressor strongly inhibited EGF-mediated activation of the EGR1 promoter in PC3 cells, these results confirm that EGR1 is indeed an Elk-1 target gene. Others have also shown that HEK-293 cells stably transfected with Elk-En inhibited c-fos and EGR1 expression. 50 Taken together, overexpression of Elk-1 in addition to the use of a dominant-negative Elk-1 demonstrated that Elk-1 is both necessary and sufficient for EGR1 transcriptional activation in PC3 cells.
In LNCaP cells, expression of the dominant-negative Elk-1 in both the presence or absence of EGF blocked EGR1 promoter activity (data not shown). These results are consistent with the ChIP data, which also demonstrated binding of Elk-1 with or without EGF in LNCaP cells. There are several possible explanation for these results. First, as previously discussed, Elk-1 may be constitutively bound in LNCaP cells and thus not affected by co-transfection of additional Elk-1. Second, it may be possible that SRF is the factor that is constitutively bound, and in the absence of stimulus, SRF is still able to recruit Elk-En to the EGR1 promoter to repress transcriptional activity. Third, Elk-1 is highly homologous with the other TCF family members, SAP1 and SAP2/Net. As SRF can recruit any of the TCF family members, 51 it is possible that in LNCaP cells another TCF is required for transcriptional activation of the EGR1 promoter. A recent study has identified EGR1 as a transcriptional target of SAP1 in thymocytes. 52 Moreover, the Elk-En construct is known to block binding by SAP-1 and SAP-2 as well as Elk-1 in 293 cells. 50
Further studies are warranted to determine the mechanistic differences in EGF mediated activation of EGR1 expression in hormone sensitive (e.g., LNCaP) versus refractory (e.g., PC3) cells. This type of comparison may shed light on mechanisms of prostate cancer progression and may partly explain the varied levels of EGR1 protein in tumor tissues of different grade and stage. This variation may be important as elevated EGF signaling in prostate cancer indicates high risk of progression to a hormone refractory state,24,25,53 and so elevated levels of EGR1 should also indicate a poor prognosis. Certainly most evidence in prostate cancer is consistent with EGR1’s role as a growth promoter.11,12,37,54-56 Thus, delineating the mechanisms of regulation of EGR1 by EGF in prostate cancer cells is important, as it will shed light on the dysregulated EGF signaling pathway in hormone refractory tumors.
Materials and Methods
Tissue culture
LNCaP and CWR22rν1 prostate tumor cells were grown in RPMI-1640 (Sigma, St. Louis, MO) supplemented with 10% fetal calf serum and 100 µg/mL penicillin/streptomycin. PC3 tumor cells were grown in DME/F12 (Sigma) supplemented with 10% fetal calf serum and 100 µg/mL penicillin/streptomycin. All cells were maintained in 5% CO2 at 37 °C until 80% to 90% confluent and then serum-deprived overnight in 0.1% fetal calf serum before treatment. Both treated and untreated cells were grown in parallel until the time of collection.
EGF and MEK inhibitor treatments
Cells were treated with 50 ng/mL EGF for 1 h unless otherwise indicated in the figure legends. For inhibitor studies, cells were pretreated for 1 h with 50 µM PD98059 (EMD Biosciences/Calbiochem, Gibbstown, NJ) prior to treatment with EGF. In all experiments, treatments were in the presence of 0.1% fetal calf serum. Cells were harvested for RNA and protein analysis as described below.
RNA isolation and quantitative PCR
Total RNA was isolated using the GenElute Mammalian Total RNA Miniprep Kit (Sigma, St. Louis, MO). Following quantification, RNA samples were reverse transcribed using the High Capacity cDNA Reverse Transcription Kit (Applied Biosystems, Foster City, CA). Real-time PCR was performed using the TaqMan Universal Master Mix and optimized EGR1 TaqMan probes (Hs00152928_m1). The 18S housekeeping gene (Hs99999901_s1) was used as an internal control, and all reactions were performed in triplicate. The comparative Ct method (2 –ddCt) 57 was used to analyze gene expression differences between control (untreated) cells and cells treated with EGF alone or with an inhibitor. Test of significance were done using analysis of variance and a Tukey-Kramer post hoc test.
Western blot analysis
Subconfluent monolayers of cells were washed in ice-cold PBS and lysed using RIPA buffer (1% NP40, 0.5% Na deoxycholate, 0.1% SDS, and 150 mM NaCl) containing a protease inhibitor cocktail (Pierce, Rockford, IL). Lysates were flash frozen at −80 °C for mechanical lysis and centrifuged to remove cellular debris. Protein concentrations were determined using the BCA Protein Assay (Pierce, Rockford, IL). Fifty micrograms of protein was separated by SDS-PAGE and transferred onto PVDF membranes. Membranes were blocked in 5% nonfat dry milk and incubated in primary antibody (pERK [Thr202/Tyr204], pAkt [Ser473], EGFR [Tyr1068], or Akt, Cell Signaling, Danvers, MA; EGR1, Santa Cruz Biotechnology, Santa Cruz, CA; β-actin, Santa Cruz) at 4 °C overnight, followed by incubation in anti-rabbit HRP-conjugated secondary antibody (GenScript, Piscataway, NJ). Proteins were visualized by chemiluminescent detection using a Fuji LAS 300 detection system.
EGR1 promoter and Elk-1 expression constructs
The human EGR1-luciferase promoter construct (pEGR1260/LUC; hEGR1) containing −1,260 bp to +35 bp of the human EGR1 promoter was a kind gift from Dr. Thomas Eling. 42 The pcDNA-Elk-1 (Elk-1) expression construct was provided by Dr. Frederick Stanley. The pcDNA3 and Elk-1 ΔDBD were provided by Dr. Mark Perrella. 58 Dr. Andrew Sharrocks provided the dominant-negative Elk-En expression construct, which consists of the full-length Elk-1 (1-428 a.a.) fused to the Drosophila En repression domain (2-298 a.a.). 51
Transfection and luciferase assays
Cells were grown in 12-well plates until 70% to 80% confluency. Just prior to transfection, standard full-serum medium was replaced with serum-free, antibiotic-free medium to enhance transfection efficiency. For each well, a 1:3 ratio of plasmid DNA to lipid reagent (Lipofectamine 2000, Invitrogen, Carlsbad, CA) was used. Unless otherwise indicated, 500 ng of reporter construct was used per well. Cells were transfected with the lipid reagent and plasmid for 5 h, after which the transfection medium was replaced with full-serum medium. Cells were grown for 24 h, serum deprived in 0.1% FCS overnight, and then treated with EGF for 5 h with or without 1-h pretreatments with PD98059. All inhibitor experiments used 50 µM PD98059; EGF concentrations used are indicated in figure legends. Cell lysates were harvested using Promega (Madison, WI) PLB lysis buffer and analyzed for luciferase activity by the Promega luciferase assay system and a Turner luminometer. Promoter activity was indicated by relative light units (RLU) produced by luciferase; RLU values were normalized to protein concentrations for each well.
Creation of hEGR1 deletion constructs
Using sequence analysis, internal restriction sites were found within the hEGR1 promoter. Two SmaI sites, located at −1,170 bp and −771 bp, and 1 SacI site, located at −245, were identified. Restriction digests were prepared using standard conditions, and plasmid DNA was extracted and purified using the QIAquick gel extraction kit (Qiagen, San Diego, CA) followed by an additional sodium acetate precipitation of DNA. DNA quantity and quality were checked by absorbance. Ligation reactions were prepared using T4 DNA ligase (New England Biolabs, Ipswich, MA), and ligated products were transformed and selected using Escherichia coli DH5α competent cells following standard techniques. The content of each plasmid was verified using sequence analysis. The human EGR1 promoter sequence was obtained from the Ensembl website (www.ensembl.org) and analyzed for predicted transcription factor binding sites using Transfac/MatInspector (Genomatix, http://www.genomatix.de).
Chromatin immunoprecipitation
Chromatin immunoprecipitation was performed as per the manufacturer’s recommendations, using the Millipore EZ–Magna ChIP kit (Millipore, Billerica, MA). Briefly, LNCaP and PC3 cells were grown to 80% to 90% confluency, serum-deprived overnight in 0.1% fetal calf serum, then treated for 30 min to 1 h with 5 ng/mL (LNCaP) or 50 ng/mL (PC3) of EGF. Proteins and chromatin were cross-linked in a 1% solution of formaldehyde, followed by quenching with glycine. Fixed cells were sonicated using 6 cycles of 20 sec of sonication followed by 60 sec on ice using a Microson UltraSonic Cell Disruptor. Sheared DNA was analyzed by gel electrophoresis, and chromatin within the range of 200 to 1,000 bp was used for further analysis. Sheared chromatin was suspended in protein G magnetic beads with 1 µg of the appropriate antibody (anti-IgG, Millipore; anti-Elk-1, Epitomics; Burlingame, CA) overnight at 4 °C with rotation. Beads were washed per the manufacturer’s recommendations, and immunoprecipitations were incubated with proteinase K to reverse cross-linking. Eluted chromatin was purified using DNA purification columns, and the promoter region was amplified by PCR as per the manufacturer’s recommendations (Applied Biosystems, Foster City, CA). Primers were designed to flank an Elk-1/SRF cluster containing 4 Elk-1 binding sites from −603 to −315 bp of the EGR1 promoter and were comprised of the following sequences: Forward, 5′ GCCATATAAGGAGCAGGA AGG; Reverse 5′ CTTCTTCCCTCCTCCCAGAG. The following standard PCR conditions were used: 94 °C for 2 min, 36 cycles of 94 °C for 20 sec, 56° C for 30 sec, 72 °C for 30 sec, and a final extension at 72 °C for 2 min. PCR products were electrophoretically separated and visualized in an ethidium bromide 1.5% agarose gel.
For quantification of genomic DNA by RT-PCR, samples were analyzed using an ABI 7000 thermocycler, and Ct values were measured by the ABI Prism 7000 detection system (Applied Biosystems, Foster City, CA). Each PCR reaction was carried out in triplicate using the SYBR Green master mix. The amount of DNA immunoprecipitated in the presence of EGF with the target antibody was calculated in comparison to total input (nonimmunoprecipitated) DNA using Ct values normalized to the control samples.
Footnotes
Acknowledgements
We greatly appreciate Thomas Eling for providing the human EGR1 promoter construct, Frederick Stanley for the Elk-1 full length construct, Mark Perrella for the Elk-1ΔDBD construct, and Andrew Sharrocks for Elk-En dominant negative construct.
The author(s) declared no potential conflicts of interest with respect to the research, authorship, and/or publication of this article.
The author(s) disclosed receipt of the following financial support for the research, authorship, and/or publication of this article: Funding was provided by NIH-1CA331160 (GF), and Ohio Board of Regents.
References
Supplementary Material
Please find the following supplemental material available below.
For Open Access articles published under a Creative Commons License, all supplemental material carries the same license as the article it is associated with.
For non-Open Access articles published, all supplemental material carries a non-exclusive license, and permission requests for re-use of supplemental material or any part of supplemental material shall be sent directly to the copyright owner as specified in the copyright notice associated with the article.