
Abstract
BCL-2/E1B-19 kDa–interacting protein 3 (BNIP3) is a BH3-only mitochondrial protein. Expression of BNIP3 is strongly stimulated by hypoxia. Up-regulation of BNIP3 has been detected in several human carcinomas including carcinomas of the lung and breast. The significance of BNIP3 overexpression in these cancers is not known. To determine whether BNIP3 plays a role in tumor growth, we generated A549 lung carcinoma cells that overexpressed BNIP3 and examined their ability to form tumors in the mouse xenograft model. All cell lines that overexpressed BNIP3 formed larger tumors compared to the parental or vector-transformed A549 cells. Breast carcinoma cell lines that overexpressed BNIP3 also induced tumors in athymic mice in the absence of hormone administration, while the parental cell line did not. Stable shRNA-mediated knockdown of endogenous BNIP3 severely impaired the tumorigenic activity of A549 cells. The tumor growth-enhancing activity was reduced by deletion of the BH3 domain of BNIP3. Expression of a dominant-negative mutant of BNIP3 lacking the C-terminal transmembrane domain also inhibited the tumorigenic potential of A549 cells. These results suggest that BNIP3 plays a fundamental role in the development of certain solid tumors such as the lung and breast carcinomas.
Introduction
BCL-2/E1B-19 kDa–interacting protein 3 (BNIP3) is a BH3-only BCL-2 family protein that is predominantly localized in mitochondria. 1 Like other BCL-2 family members, BNIP3 possesses a C-terminal transmembrane (TM) domain that targets BNIP3 to mitochondria. 2 However, the TM domain of BNIP3 is unique, and it contributes to detergent-stable dimerization of BNIP3. 3-5 BNIP3 is a pro–cell death protein, and its activity is dependent on the BH3 domain as well as on the TM domain. 6-8 Unlike most BH3-only members that induce acute apoptotic cell death upon overexpression, transient expression of BNIP3 results in delayed cell death. 2,9 Overexpression of BNIP3 induced apoptosis in specialized cells such as cardiomyocytes. 10 However, in most other cases, cell death induced by BNIP3 resembled necrotic cell death with autophagic features. 3,11,12 Several recent studies have suggested that a major mode of BNIP3-induced cell death may involve autophagy. 10,13-17 In addition to autophagic cell death, BNIP3 has also been implicated in autophagic cell survival possibly by facilitating removal of damaged mitochondria. 13,18-20 It appears that the relative level of expression of BNIP3 may determine the cell fate between autophagic cell death and cell survival. 13
Expression of BNIP3 is strongly activated by hypoxia. 20 The promoter of BNIP3 contains a hypoxia response element (HRE) and appears to be a direct target for transcriptional activation by HIF-1. Hypoxia-regulated expression of BNIP3 has been demonstrated in a wide variety of normal cells and in cells undergoing pathological hypoxic stress. Several reports demonstrated overexpression of BNIP3 in neuronal cells and in myocytes exposed to ischemic stress. 21-23 Since solid tumors are poorly vascularized with areas of reduced oxygen supply, Harris and coworkers suggested hypoxia-induced expression of BNIP3 may contribute to tumor necrosis. 24 They reported high-level expression of BNIP3 in several human carcinomas compared to normal tissues. In tumor tissues, expression of BNIP3 was observed in the perinecrotic regions, suggesting a potential role for hypoxia in the activation of BNIP3 in these areas of the tumor. Expression of Bnip3 was also reported to be associated with high-grade DCIS of the breast. 25 A study involving non–small cell lung carcinoma samples suggested a strong correlation between BNIP3 expression and poor prognosis. 26 Thus, analyses of human tumor tissues suggest a correlation between up-regulation of BNIP3 expression and tumorigenesis. To establish an experimental cause and effect relationship between BNIP3 expression and tumorigenesis, we established lung and breast carcinoma cell lines that overexpressed exogenously introduced BNIP3 and examined their tumorigenic activity in the mouse xenograft model. Our results suggest that BNIP3 plays an essential role in solid tumor development.
Results
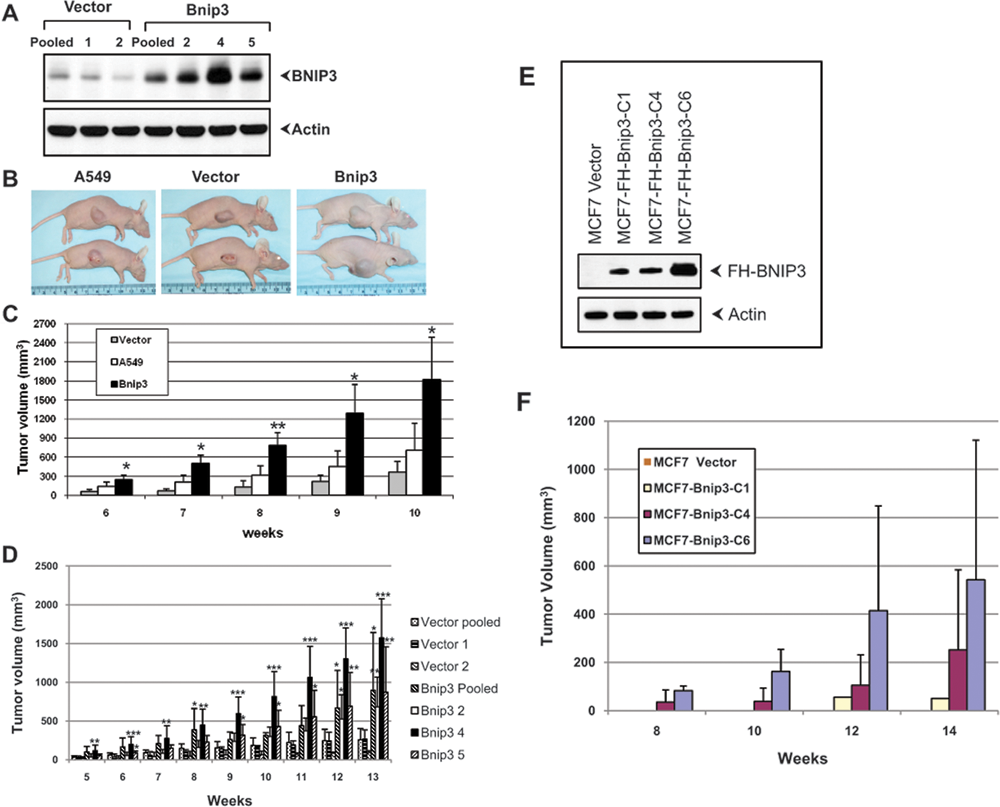
To determine the effect of BNIP3 overexpression on tumorigenesis, we chose to exogenously introduce BNIP3 in a human lung carcinoma cell line, A549. This model system seemed a logical choice since BNIP3 overexpression was observed in over 100 clinical samples of lung carcinomas. 26 We established clonal as well as pooled cell lines from A549 cells transduced with a BNIP3-expressing retrovirus vector or the empty vector (Fig. 1A). The tumorigenic potential of these cell lines was determined by subcutaneous injection in athymic mice. First, we compared the oncogenic activity of uninfected parental A549 cells with cells stably transduced with BNIP3 expression vector or the empty vector (Fig. 1B and 1C). All animals developed tumors at 5 weeks after injection, and there was no significant difference in the latency period. However, in animals injected with BNIP3-expressing cells, the tumors grew faster compared to animals injected with the control cells (A549 or pooled vector-transfected cells). The average volume of tumors induced by BNIP3-expressing cells was 1824 mm3 (range, 1095-2700 mm3) compared to 361 mm3 (range, 180-507 mm3) for the vector group and 706 mm3 (range, 194-1217 mm3) for untransduced A549 cells. A similar pattern was also observed with 3 different clonal BNIP3-expressing cell lines (Bnip3-2, -4, and -5) that produced larger tumor volumes compared to 2 different cell lines derived from cells transduced with the empty vector (Fig. 1D). The tumors were subjected to histopathology analysis. A549 tumors were histologically similar to one another, being primarily solid carcinomas with occasional gland formation and variable amounts of central coagulation and necrosis. In some BNIP3-overexpressing tumors, gland formation was not conspicuous (results not shown).
We also generated human breast carcinoma cell lines derived from the cell line MCF7 and determined their tumorigenic activity in the mouse xenograft model. While the parental cell line did not form tumors (in the absence of external estrogen administration), 3 clonal cell lines formed tumors (Fig. 1F). The cell line C6 that expressed the highest level of BNIP3 (Fig. 1E) formed fast-growing tumors in all animals, while the other 2 cell lines (C1 and C4) that expressed moderate levels of BNIP3 formed tumors in fewer animals. Histopathological examination of MCF7 xenograft tumors revealed that they were trabecular in pattern (results not shown). These results suggest that overexpression of BNIP3 in the lung and breast carcinoma cell lines increases their ability to form tumors in the mouse xenograft model.
Effect of BNIP3 overexpression on tumorigenesis by A549 (
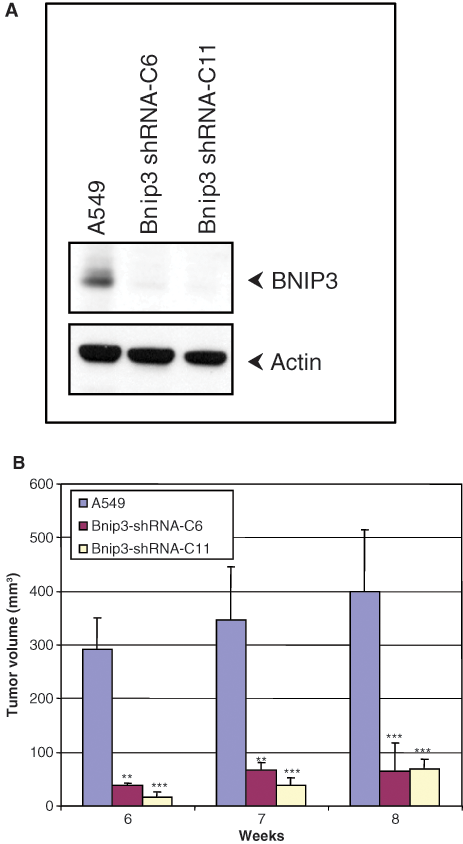
We then determined the effect of knockdown of endogenous BNIP3 on the tumorigenic activity of A549 cells. Clonal cell lines that expressed reduced levels of BNIP3 were isolated from A549 cells transfected with a plasmid-expressing shRNA against BNIP3 (Fig. 2A). The tumorigenic activities of 2 different clonal cell lines (clone #6 and clone #11) with reduced BNIP3 expression compared to the parental A549 cells were determined (Fig. 2B). Both BNIP3-deficient cell lines were severely retarded in their ability to form tumors compared to the parental A549 cells. These results suggest a strong role for BNIP3 in the tumorigenic activity of lung carcinoma cells.
Effect of BNIP3 knockdown on tumorigenesis by A549 cells. (
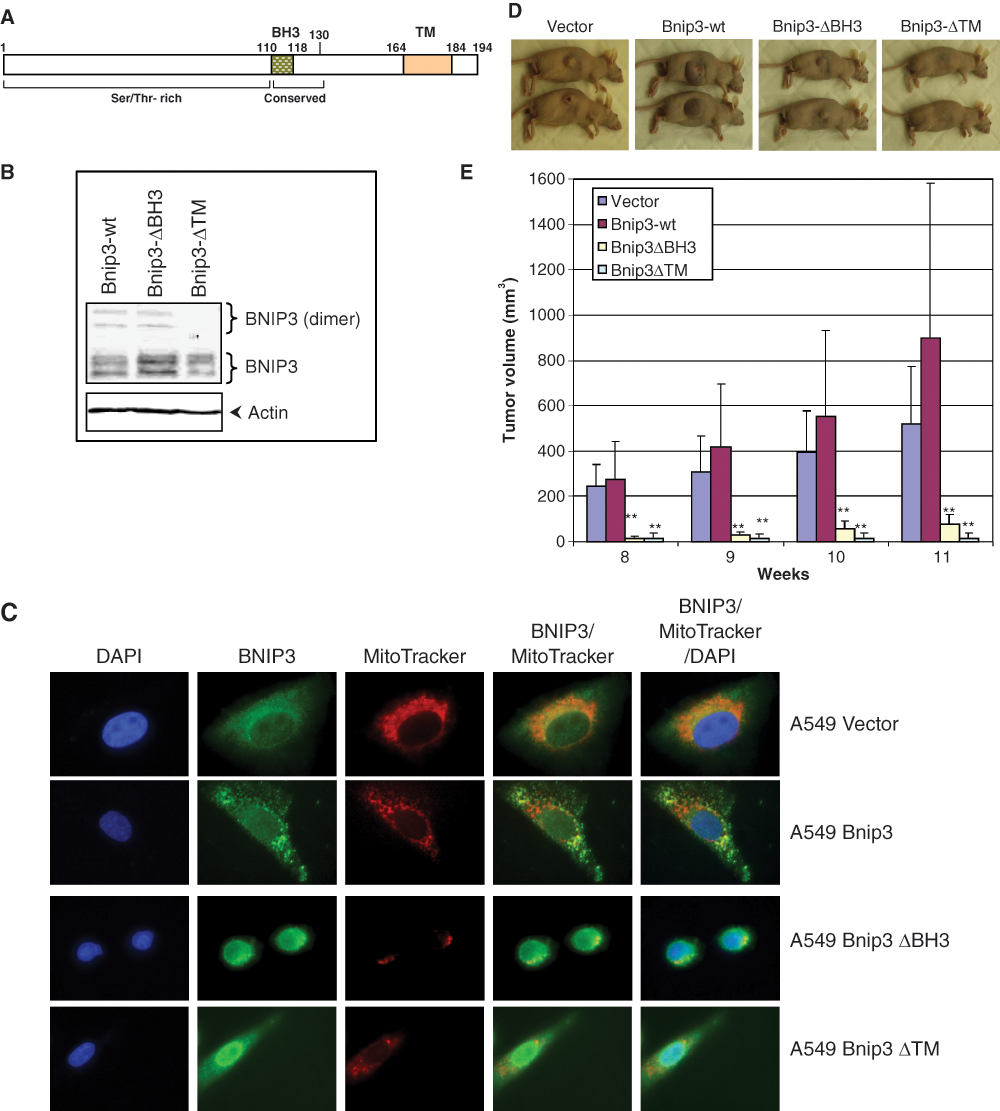
We also determined the effect of BNIP3 mutants lacking the TM or the BH3 domains on tumorigenesis. The TM domain of BNIP3 is required for the dimerization, and insertion into the mitochondrial membrane contributes significantly to the cell death activity. 6 Mutants of BNIP3 lacking the TM domain have been shown to function as dominant negatives. 3,10 The BH3 domain appears to be important for interaction with BCL-2 family antiapoptosis proteins and context-dependent cell death activity. 2 To determine the role of these domains in the tumorigenesis activity of BNIP3, we generated mutants that lacked the TM domain (amino acids 164-194) or the BH3 domain (amino acids 110-115) (Fig. 3A and 3B). A549 cells that stably expressed the mutant proteins were generated by transduction with BNIP3-expressing retrovirus vectors and analyzed by indirect immunofluorescence (Fig. 3C), while endogenous BNIP3 (Fig. 3C, top panel) and ectopically expressed BNIP3 (Fig. 3C, second panel from top) were localized predominantly in the mitochondria. Subcellular fractionation also agreed with these results as most BNIP3 was localized in heavy membrane fractions without significant concentration in the nuclear and cytosolic fractions (results not shown). The mutant proteins were concentrated in the nucleus with some cytosolic localization (Fig. 3C, bottom 2 panels). Cells that expressed ΔTM and ΔBH3 mutants were generally smaller and showed distinct changes in morphology. The tumorigenic activities of these cells were determined by transplantation in athymic mice. Cells expressing BNIP3ΔTM produced very small nodules in some animal and no palpable tumors in others, while cells expressing BNIP3ΔBH3 also induced tumors with reduced volumes (Fig. 3D and 3E). These results suggest that expression of BNIP3ΔTM strongly inhibited the tumorigenic activity of A549 cells. Since cells expressing the mutant BNIP3ΔBH3 formed very small tumors, it appears that the BH3 domain is also a critical determinant for the tumorigenic activity of BNIP3.
Effect of BNIP3 mutants on tumorigenesis. (
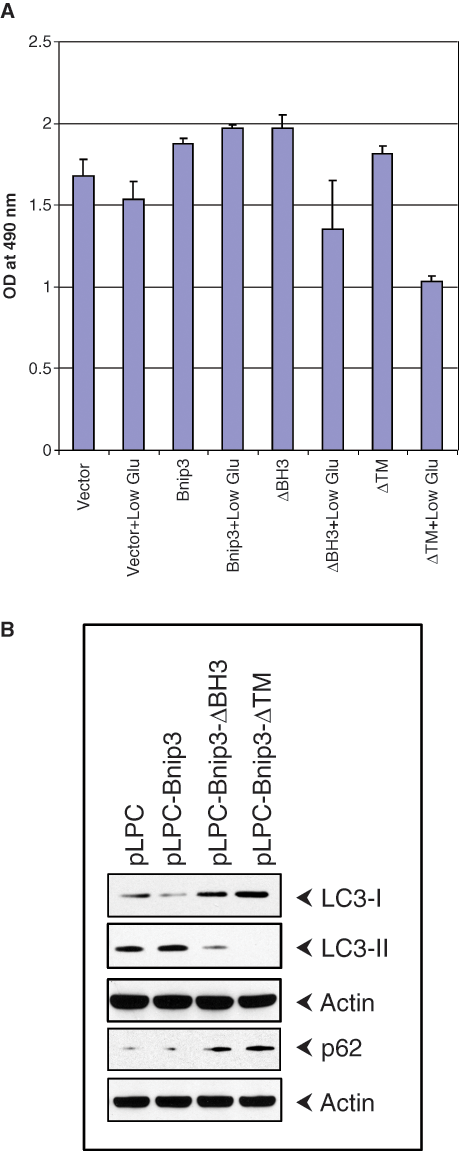
To determine the potential mechanism behind the tumorigenic activity of BNIP3, we analyzed the growth characteristics of BNIP3-expressing cells under a variety of growth conditions (results not shown). When these cell lines were grown in growth medium containing low glucose (0.1%), the cell lines that expressed BNIP3ΔTM or BNIPΔBH3 mutants lost viability compared to cells that expressed wt BNIP3 or the vector (endogenous BNIP3) (Fig. 4A). There was no significant difference in the viability among different cell lines when grown in normal media. These results suggest that BNIP3 may provide a survival advantage under the low glucose growth condition. This appears to correlate with the expression of the autophagic marker LC3-II 28 (with corresponding decrease in LC3-I) that was expressed more in cells expressing wt BNIP3 than in cells expressing BNIP3ΔTM or BNIPΔBH3 mutants (Fig. 4B). There was an inverse correlation for the expression of p62 (which is subject to degradation during autophagy) 29 ; that is, there was less p62 in cells expressing wt BNIP3 than in cells expressing the mutants. These results suggest that BNIP3 may confer autophagic survival advantage under growth conditions deprived for glucose.
Proliferation of BNIP3-expressing cells in low glucose media. (
Discussion
Our results demonstrated that ectopic overexpression of BNIP3 in a lung carcinoma cell line enhanced the tumorigenic activity. In addition to A549 cells, we also showed that a breast carcinoma cell line, MCF7 transduced with BNIP3 expression vector, also induced tumors without external administration of estrogen, while the parental cell line did not. Our results showed that stable knockdown of endogenous BNIP3 and inhibition of the tumorigenic activity of the parental A549 cells by the dominant-negative mutant of BNIP3 (BNIP3ΔTM) suggest that BNIP3 plays a fundamental role in tumor development. Our results provide experimental support to the results from clinical studies that have shown up-regulation of BNIP3 in solid tumors such as non–small cell lung carcinomas and DCIS. 25,26 In these cancers, enhanced BNIP3 expression was shown to correlate with aggressive tumor phenotypes and poor prognosis. The effect of BNIP3 appears to be primarily a late event in tumor formation since the lag period was similar for tumors induced by the parental or vector-transduced cells and by BNIP3-overexpressing cells. It is possible that the role of BNIP3 in solid tumor microenvironment may become evident after a critical tumor mass formation. Under the tumor microenvironment that experiences hypoxia and low glucose, BNIP3 expression may facilitate tumor development by providing a survival advantage to tumor cells.
We have shown that the tumorigenic activity of BNIP3 was abrogated by deletion of the BH3 domain. The BH3 domains of BNIP3 2 and the related BNIP3L 30 have been linked to 2 activities: interaction with BCL-2 family antiapoptosis proteins and a slow cell death activity. It is counterintuitive that a domain linked to prodeath activity might promote tumor growth. It is possible that ΔBH3 mutant may function as a dominant-negative mutant via heterodimerization with endogenous BNIP3 mediated by the TM domain. This interpretation appears to be consistent with the immunofluorescence analysis (Fig. 3C, third panel from top) in which the mitochondrial staining of endogenous BNIP3 was greatly diminished. A slow cell death activity controlled by the BH3 domain may also contribute to tumor progression during late stages. A previous report suggested a correlation between the BNIP3 expression and the grade and prognosis of breast DCIS and lung carcinomas that contained necrotic lesions. 25 It is possible that the prodeath activity of BNIP3 may contribute to enhanced tumor growth as a result of emergence of resistant cells or as the result of overexpression of survival factors that might be activated to counteract the BNIP3 effect. It is known that hypoxic conditions favor up-regulation of survival factors such as VEGF and bFGF. 31 It has been already reported that the presence of growth factors inhibits the cell death activity of BNIP3. 32 The conflicting signals imposed by a cell death factor (i.e., BNIP3) and hypoxia-induced survival factors might lead to the selection of aggressive tumor cells that can withstand cell death stimuli. It is possible that BNIP3 may also play a context-dependent tumor-suppressive role. In advanced cancers, continued expression of BNIP3 may be an impediment for tumor progression due to its cell death activity. In such cases, down-regulation of BNIP3 might lead to further tumor progression. In certain advanced cancers such as high-grade pancreatic adenocarcinomas, expression of BNIP3 was shown to be silenced by promoter methylation. 33,34 In summary, our results provide strong experimental support to the clinical results and suggest that BNIP3 might be a new prognostic marker for certain solid tumors such as the carcinomas of the lung and breast. Since knockdown of endogenous BNIP3 and dominant-negative inhibition of endogenous BNIP3 inhibit tumor formation, it is possible that BNIP3 could be a target for the design of antitumor strategies for lung and breast cancers. 6
Materials and Methods
Vectors and cloning
BNIP3 wt was subcloned from the parental clone HA-BNIP3 2 into the retroviral vectors pLPC 27 or pBabe with the puromycin selection marker. The deletion mutants BNIP3ΔBH3 and BNIP3ΔTM were constructed using the Quickchange XL site directed mutagenesis kit from Stratagene (Agilent Technologies, Santa Clara, CA).
Cell culture and retrovirus transduction
A549 and MCF7 cells were cultured in Dulbecco’s Eagle’s medium supplemented with 10% fetal bovine serum under 95% air and 5% CO2. The cells were infected with retroviral vectors pseudotyped in amphotropic phoenix A packaging cells. Clonal and pooled cell lines were selected with puromycin at a concentration of 1 µg/mL and analyzed for BNIP3 levels.
Western blotting
Cells were harvested and lysed in RIPA buffer supplemented with protease inhibitor cocktail from Sigma-Aldrich (St. Louis, MO). Total protein estimation was done using the BCA protein estimation kit from Pierce (Thermo Fisher Scientific, Rockford, IL). The cell lysates were separated by SDS-PAGE and analyzed by Western blotting using the respective primary antibodies (BNIP3, Sigma-Aldrich #B7931; LC3-I, Cell Signaling Technology #2775, Danvers, MA; LC3-II, Santa Cruz Biotechnology #28266, Santa Cruz, CA; and actin, Santa Cruz Biotechnology #SC1615). Horseradish peroxidase-conjugated secondary antibodies specific for the respective primary antibodies were used. The bands were visualized using ECL reagents from Roche (Basel, Switzerland) as per the manufacturer’s instructions.
Immunofluorescence analysis
A549 cells cultured on coverslips were stained with 50 nM Mitotracker (Molecular Probes #M7512, Invitrogen, Carlsbad, CA) for 30 minutes and fixed with 3.7% formaldehyde at room temperature for 10 minutes and permeabilized with methanol at −20°C for 6 minutes. The cells were rehydrated with phosphate buffered saline (PBS) and blocked with 5% bovine serum albumin in PBS. Cells were incubated in mouse monoclonal Bnip3 (B7931, Sigma-Aldrich) antibody (1:1,000 dilution in PBS containing 5% BSA) for 90 minutes at 37°C, washed, and incubated with secondary Alexa Fluor 488 goat antimouse IgG (H & L) (Molecular Probes #A11029) (1:300 dilution) for 60 minutes. Nuclei were stained with DAPI (300 nM) and mounted onto slides with Vectashield mounting media (Vector Laboratories, Burlingame, CA), and cells were visualized at 60x by using a Nikon Microphot-FXL microscope (Tokyo, Japan). Images were merged using ImageJ software (National Institutes of Health, Bethesda, MD).
Knockdown of BNIP3
The oligonucleotides (5′-GTTCCAGCCTCGGTTTCTA-3′; 5′-TAGAAACCGAGGCTGGAAC-3′) encoding the shRNA specific to human Bnip3 were cloned in pRS vector (OriGene Technologies, Rockville, MD). A549 cells were transfected, clonal cells were isolated by puromycin selection, and the levels of BNIP3 expression were determined by Western blot analysis.
Xenografts
Athymic (4-week-old female, 5-6 animals/group) mice were injected subcutaneously with 1 million cells per animal in each experimental group. Tumor measurements were taken weekly. Maximum length and width of tumors were taken, and the tumor volume was calculated. Animals were euthanized when the tumor size reached approximately 20 mm. All data were represented as mean ± standard deviation (SD). The statistical significance was determined using a Student t test. The P values were determined by comparing the vector or parental groups with other groups: *P < 0.05, **P < 0.01, and ***P < 0.001. This analysis was followed by 1-way analysis of variance (P and F values are given in the legends) using GraphPad Prism 5 software (GraphPad Software, La Jolla, CA).
Footnotes
The author(s) declared no potential conflicts of interest with respect to the authorship and/or publication of this article.
This work was supported by research grants CA-33616, CA-116262, and CA-73803 from the National Cancer Institute, Bethesda, MD, USA.