
Abstract
Glioblastoma (GBM) is the most common malignant brain tumor that is characterized by high proliferative rate and invasiveness. Since dysregulation of Notch signaling is implicated in the pathogenesis of many human cancers, here we investigated the role of Notch signaling in GBM. We found that there is aberrant activation of Notch signaling in GBM cell lines and human GBM-derived neurospheres. Inhibition of Notch signaling via the expression of a dominant negative form of the Notch coactivator, mastermind-like 1 (DN-MAML1), or the treatment of a γ-secretase inhibitor, (GSI) MRK-003, resulted in a significant reduction in GBM cell growth in vitro and in vivo. Knockdown of individual Notch receptors revealed that Notch1 and Notch2 receptors differentially contributed to GBM cell growth, with Notch2 having a predominant role. Furthermore, blockade of Notch signaling inhibited the proliferation of human GBM-derived neurospheres in vitro and in vivo. Our overall data indicate that Notch signaling contributes significantly to optimal GBM growth, strongly supporting that the Notch pathway is a promising therapeutic target for GBM.
Introduction
Glioblastoma (GBM) is the most common malignant brain tumor and is characterized by high proliferation rate and invasiveness. The median survival of GBM patients ranges from 9 to 15 months, even with use of the most aggressive treatments, which include surgery, radiation, and chemotherapy. 1-5 Dysregulation of a number of signaling pathways has been reported in GBM pathogenesis. These pathways include cell cycle control (such as P16INK4A-CDK4-RB, P18INK4C, and p19ARF-MDM2-p53 pathways), growth factor receptors (such as platelet-derived growth factor receptor and epidermal growth factor receptor), transforming growth factor β signaling, and phosphoinositide 3-kinase/phosphatase and tensin homolog (PTEN) signaling. 3,4 Signaling pathways regulating stem cell development may also play a role in the pathogenesis of this disease as cancer stem cells have been isolated from GBM. 6-11 A further understanding of these signaling pathways may lead to novel therapies and strategies that will advance the treatment of GBM.
Notch signaling is an evolutionarily conserved pathway that plays an important role in multiple cellular and developmental processes. These processes include cell fate decision, differentiation, proliferation, survival, angiogenesis, migration, and epithelial-mesenchymal transition in many tissues, including the brain.
9,12-14
There are 4 Notch receptors (Notch1-4) and 5 ligands (Jagged1, Jagged2, and Delta-like 1, 3, and 4) identified in mammals.
12,13
Notch receptors are conserved type I transmembrane receptors. The binding between Notch receptors and ligands on neighboring cells leads to multiple steps of proteolytic cleavage of the receptors and releases the Notch intracellular domain (NICD), which translocates into the nucleus. In the nucleus, NICD binds to transcription factor CSL (
Activated Notch signaling can be either oncogenic or tumor suppressive depending on the cellular and physiological context. 13,15,20 In normal brain development, the Notch pathway is known to have an impact on neural stem cell renewal, progenitor cell differentiation, learning, memory, and gliogenesis. 21-24 In brain cancer development, Notch1 was previously reported to be oncogenic. 25 Notch1 and its ligands Delta-like 1 and Jagged1 were reported to be crucial for GBM cell growth. 26 Notch1 and Notch2 were shown to have opposite effects on medulloblastoma growth. 27 Loss of Notch2 was a predictor of survival in subgroups of human glial brain tumors. 28 Recently, tenascin-C, an extracellular matrix protein with a role in migration, was identified as a Notch target gene in gliomas. 29 Although increasing evidence suggests that Notch signaling plays a role in GBM pathogenesis, the mechanisms underlying Notch activation and the importance of specific Notch receptor(s) in the regulation of GBM growth remain poorly defined.
Recently, cancer stem cells were identified in GBM. 6-8,10,11,30 Notch signaling was also implicated in neural stem cell renewal, proliferation, and differentiation. 21,22 Further investigation into the role of Notch signaling in GBM cancer stem cell development will provide new insights into the pathogenesis of this disease. Targeting these cancer stem cells may prevent the predictable recurrence of GBM. 7
In this study, we determined the role of Notch signaling in established GBM cell lines and in human GBM-derived neurospheres. We observed elevated Notch signaling in GBM, which is shown by the enhanced expression levels of ligands, receptors, and target genes from our analysis of data from Serial Analysis of Gene Expression (SAGE) database. We then validated the expression levels of Notch signaling components in GBM cells and tumor neurospheres by Western or quantitative RT-PCR analysis. We also investigated the importance of Notch signaling and individual Notch receptors in the growth of GBM cell lines and tumor neurospheres in vitro and in vivo. Our overall findings revealed a crucial role of Notch signaling activation in the pathogenesis of GBM.
Results
GBM cell lines express high levels of Notch signaling components
Notch signaling was shown to be involved in the pathogenesis of many tumor types. 15,17 Therefore, we used an unbiased approach, SAGE analysis, to determine the relative expression levels of the Notch pathway components across different tumor types compared to their normal cognate tissues and to determine whether the expression of Notch components correlates with tumorogenicity. 31 After analyzing the expression of Notch ligands, receptors, and target genes in 17 tumors, we found elevated expression of DLL1, DLL3, NOTCH1, NOTCH2, HES1, HES5, HEY1, DTX2, and NRARP in brain tumors as compared to normal brain samples (Suppl. Fig. S1A and Suppl. Table S2). As the brain tumor samples contain 6 different subtypes (28 medulloblastoma, 20 astrocytoma, 19 glioblastoma, 12 ependymoblastoma, 5 meningioma, 2 oligodendroglioma, and 8 normal brain samples), we analyzed the expression levels of Notch signaling components in each of the subtypes compared to a normal brain (Suppl. Fig. S1B and Suppl. Table S3). We found significant elevation of Notch signaling gene expression in 5 of 6 subtypes, with astrocytoma having elevated expression of DLL3, NOTCH1, NOTCH2, HEY1, and HEY2; ependymoblastoma having increased expression of NOTCH2, HES1, and HEY1; GBM having elevated NOTCH2 and HES1 expression; oligodendroglioma having increased HES1, HEY1, and DTX1 expression; and meningioma having elevated HES1 expression. Since GBM is the most malignant among brain tumors and has significantly increased levels of the Notch signaling–related gene expression by SAGE analysis, we used 5 GBM cell lines LN827, deltaU87, U87, U251, and LN428 to further test and confirm the expression levels of the Notch pathway components. All of these 5 cell lines expressed Notch1, Notch2, and Notch3 RNA and protein (Fig. 1A and B). Compared to NOTCH1 and NOTCH3 transcripts, the RNA level of NOTCH2 was 10- and 20-fold higher, respectively, while NOTCH4 transcripts were undetectable in these cell lines (Fig. 1A). All 5 cell lines express JAGGED-1 and JAGGED-2 protein, with U251 and LN428 having the highest amounts (Fig. 1B). DELTA-LIKE-1, DELTA-LIKE-3, and DELTA-LIKE-4 are undetectable in these cells (data not shown). All 5 cell lines expressed Notch target genes HES1, HEY1, and C-MYC proteins (Fig. 1B). LN428 appears to have higher NOTCH1 expression at the protein level than the RNA level, which is likely due to the translational regulation of Notch1 by the Ras and Akt pathway as reported previously. 32 These data indicated that Notch signaling is activated in GBM, which may play a role in the pathogenesis of this tumor. Recently, Notch and Sonic Hedgehog signaling were reported to be highly expressed in the classic subtype of GBM, 33 further highlighting the clinical relevance of Notch signaling in GBM.
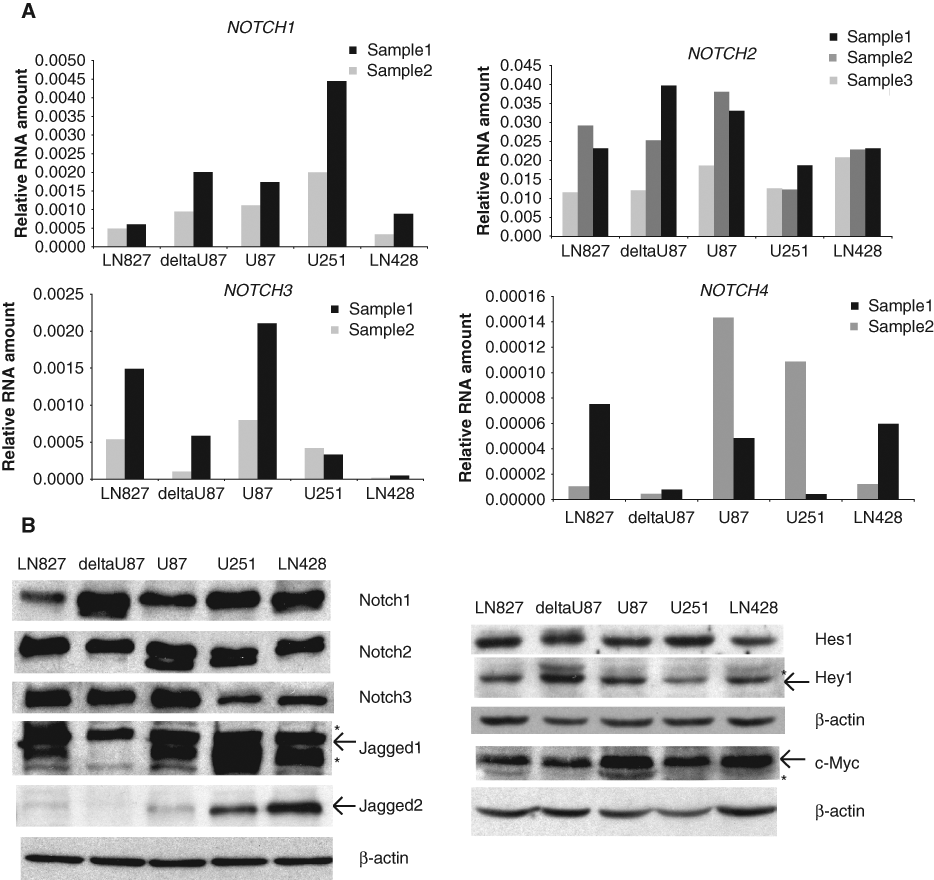
Expression of Notch signaling components in GBM cells. (
Inhibition of Notch signaling by the dominant negative form of mastermind-like 1 significantly reduced GBM cell growth in vitro and in vivo
Since we found that Notch signaling is highly expressed in GBM, we next determined whether it is important for GBM cell growth. We blocked Notch signaling in 5 GBM cells by transducing cells with lentiviruses expressing a dominant negative form of Notch coactivator mastermind-like 1 (DN-MAML1) (Suppl. Fig. S2) 34 and monitored cell growth. The expression of DN-MAML1 strongly inhibited Notch signaling, as there was a 60% to 90% reduction of Notch target gene C-MYC expression in all 5 cell lines, a 56% to 67% reduction of HEY1 expression in LN827, deltaU87, and U87 cells, and a 60% to 80% reduction of HES1 expression in deltaU87, U87, U251, and LN428 cells transduced with DN-MAML1 virus compared to cells transduced with GFP control virus (Fig. 2A). Importantly, cells with DN-MAML1 expression showed reduced growth in LN827, deltaU87, U87, U251, and LN428 cells by 84%, 72%, 58%, 59%, and 30%, respectively, on day 5 or day 6 posttransduction compared to cells transduced with control virus (Fig. 2B). A time course of GBM cell growth showed that the growth was inhibited 2- to 29-fold by DN-MAML1 on day 8 or day 9 posttransduction (Suppl. Fig. S3). These results indicated that inhibition of Notch signaling significantly reduced GBM cell growth in vitro. To evaluate the functional significance in vivo, the most Notch-responsive cell line, LN827 cells, was transduced with DN-MAML1 or GFP control viruses, and then the infected cells were injected intracranially into SCID mice. Mice injected with DN-MAML1–transduced LN827 cells had significantly longer survival compared to those with GFP control virus–transduced cells (P = 0.0006) (Fig. 2C(a)). The tumors were excised from the mice at sacrifice, and the RNAs were extracted. Compared to GFP controls, the tumors generated by DN-MAML1–infected cells have a significant reduction of C-MYC, HES1, and HES5 expression (Fig. 2C(b)). Taken together, these data demonstrated that inhibition of Notch signaling by DN-MAML1 significantly reduced GBM cell growth in vitro and in vivo.
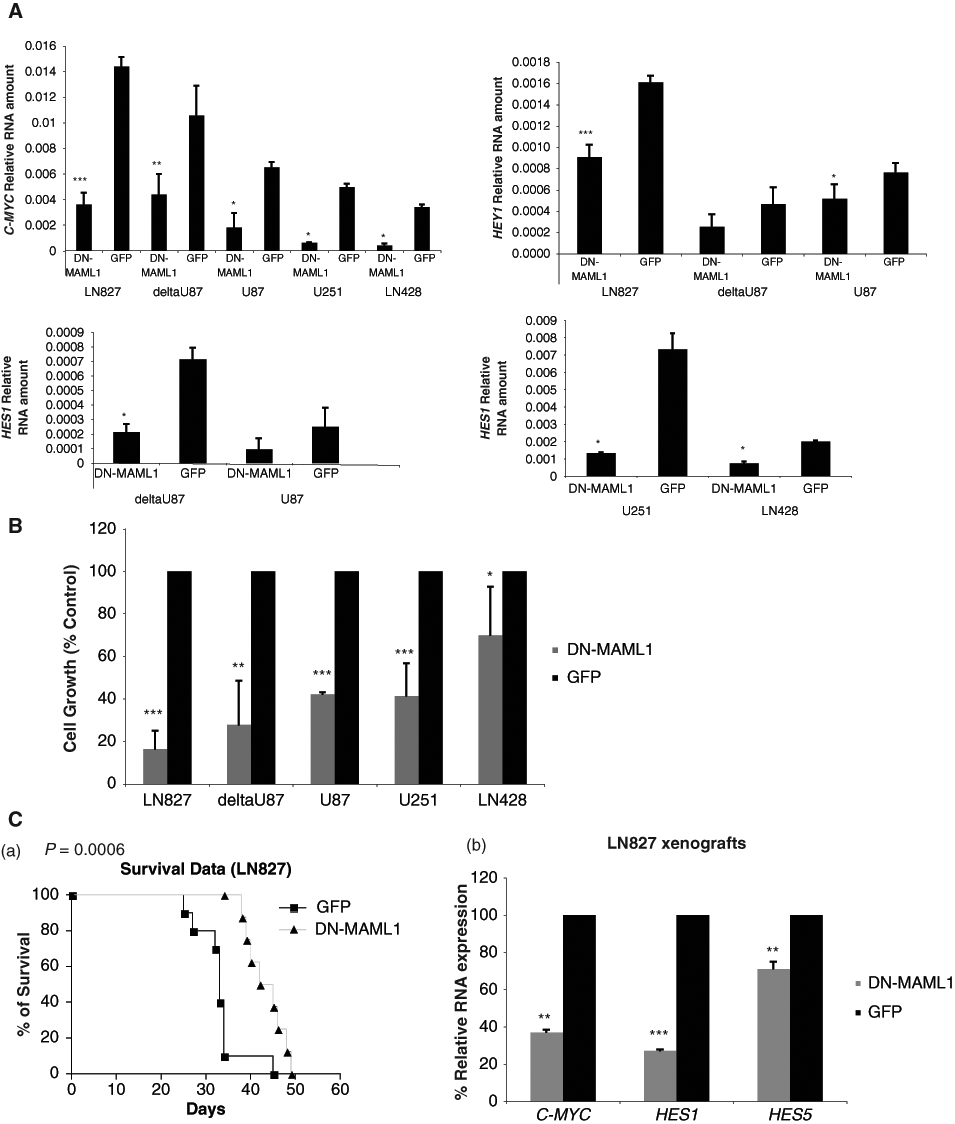
A dominant negative form of mastermind-like 1 (DN-MAML1) inhibited Notch signaling in GBM cells and prevented GBM cell growth in vitro and in vivo. (
The expression of the dominant negative form of mastermind-like 1 caused G0/G1 cell cycle arrest and induced apoptosis in GBM cell lines
Since expression of DN-MAML1 caused growth suppression of GBM cells, we further determined the molecular mechanisms for cell growth inhibition by analyzing cell cycle profile and cell apoptotic rate. We observed that lentiviral-mediated DN-MAML1 expression in LN827 and deltaU87 cells led to an increase of cell populations in the G0/G1 phases, as compared to control GFP expression (65.88% v. 47.01% in LN827, respectively) and (85.46% v. 60.13% in deltaU87, respectively) (Fig. 3A). Forty-eight hours of DN-MAML1 expression in LN827, deltaU87, and U87 cells led to a significantly higher number of apoptotic cells compared to GFP control cells (Fig. 3B). As CYCLIN D1 is a known Notch target gene 35 that plays an important role in cell cycle progression in G1 phase, 36,37 we measured the CYCLIN D1 expression levels by qPCR and Western analysis. We found that DN-MAML1 expression reduced CYCLIN D1 expression (Fig. 3C and Suppl. Fig. S4C(a)), which might contribute to increased cell populations in the G0/G1 phases. Our data therefore indicated that dominant negative Notch inhibitor DN-MAML1 caused cell growth suppression in part by down-regulating CYCLIN D1 expression, inducing cell cycle arrest and apoptosis.
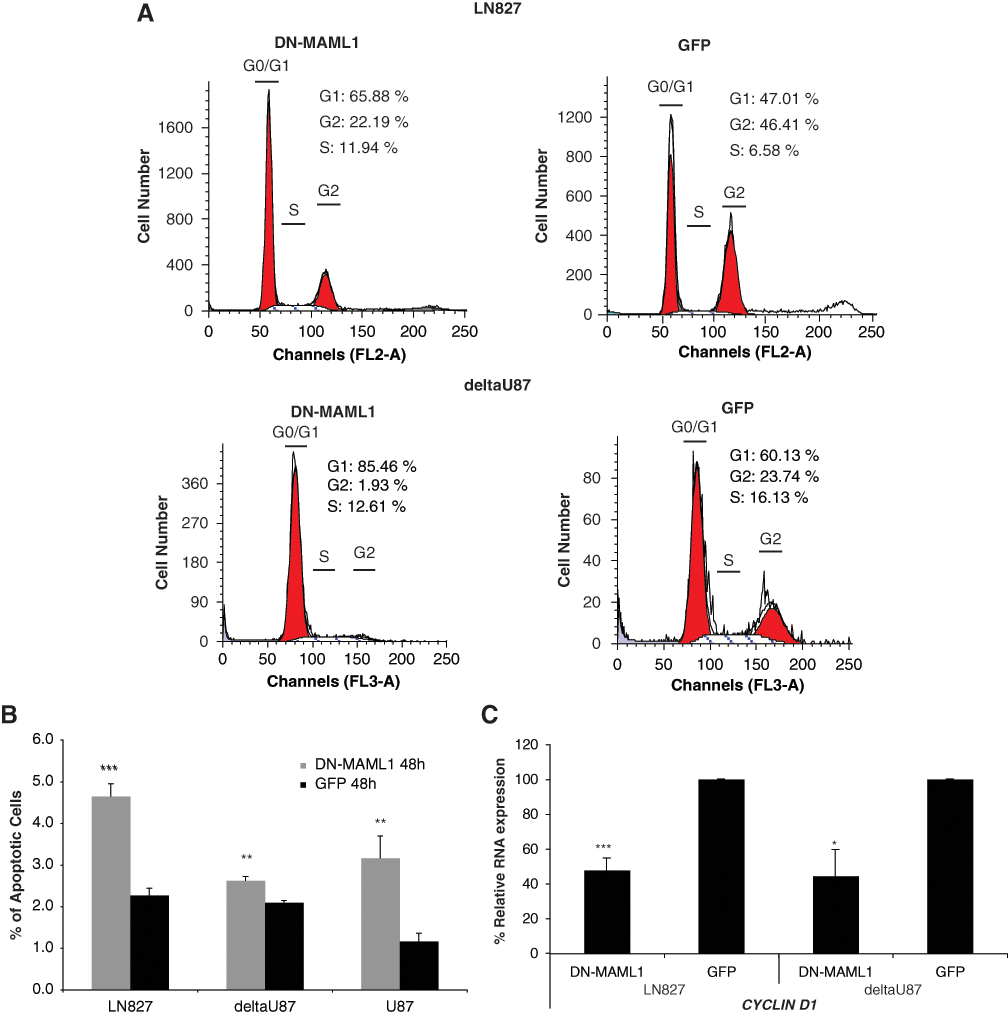
DN-MAML1 expression caused G1 arrest, down-regulated CYCLIN D1 expression, and induced apoptosis in GBM cells. (
γ-secretase inhibitor MRK-003 inhibited Notch signaling, reduced cell growth, and induced apoptosis in GBM cells
Activation of Notch signaling involves a critical step of proteolytic cleavages upon ligand binding. The cleavage of Notch receptors by γ-secretase protein complex releases the Notch intracellular domain, which then translocates to the nucleus and activates Notch target genes. We used the γ-secretase inhibitor (GSI) MRK-003 to test whether inhibition of Notch signaling at the step of receptor processing would also inhibit GBM cell growth. GSI effectively inhibited Notch signaling as shown by the down-regulation of C-MYC and HES1 expression in a dose-dependent manner (Fig. 4A). Consistent with the decrease in C-MYC RNA levels, we also observed a decrease of C-MYC protein level after 24 hours of 10 µM and 20 µM GSI treatment (Suppl. Fig. S4A). The GSI effect is specific for Notch signaling inhibition since the phosphorylation status of other signaling pathways (including phospho-AKT of the PI3-kinase pathway or phospho-pp44/42 of the MAP-kinase pathway) was not affected (Suppl. Fig. S4B). GSI treatment also decreased CYCLIN D1 RNA levels and protein levels, which could contribute to G0/G1 cell cycle arrest (Fig. 4B and Suppl. Fig. S4C(b)). Furthermore, GSI inhibited the growth of all 5 GBM cell lines in a dose-dependent manner (Fig. 4C). The IC50 for cell growth in these cells varied between 7 to 16 µM. LN827, deltaU87, and LN428 were the most sensitive cell lines as their growth was inhibited 50% to 80% at 10 µM and 100% at 20 µM and was consistent with a decreased level of CYCLIN D1 expression (Fig. 4B). Since the effects of Notch inhibitors on cell growth were profound, we further tested the effects of MRK-003 on GBM cell survival. Twenty-four and 48 hours after MRK-003 treatment, GBM cells underwent significant apoptosis compared to DMSO control treatment (Fig. 4D). These results demonstrated that inhibition of Notch signaling by GSI treatment causes GBM cell growth suppression via inducing cell cycle arrest and apoptosis, strongly supporting an important role for the Notch pathway in GBM cell growth.
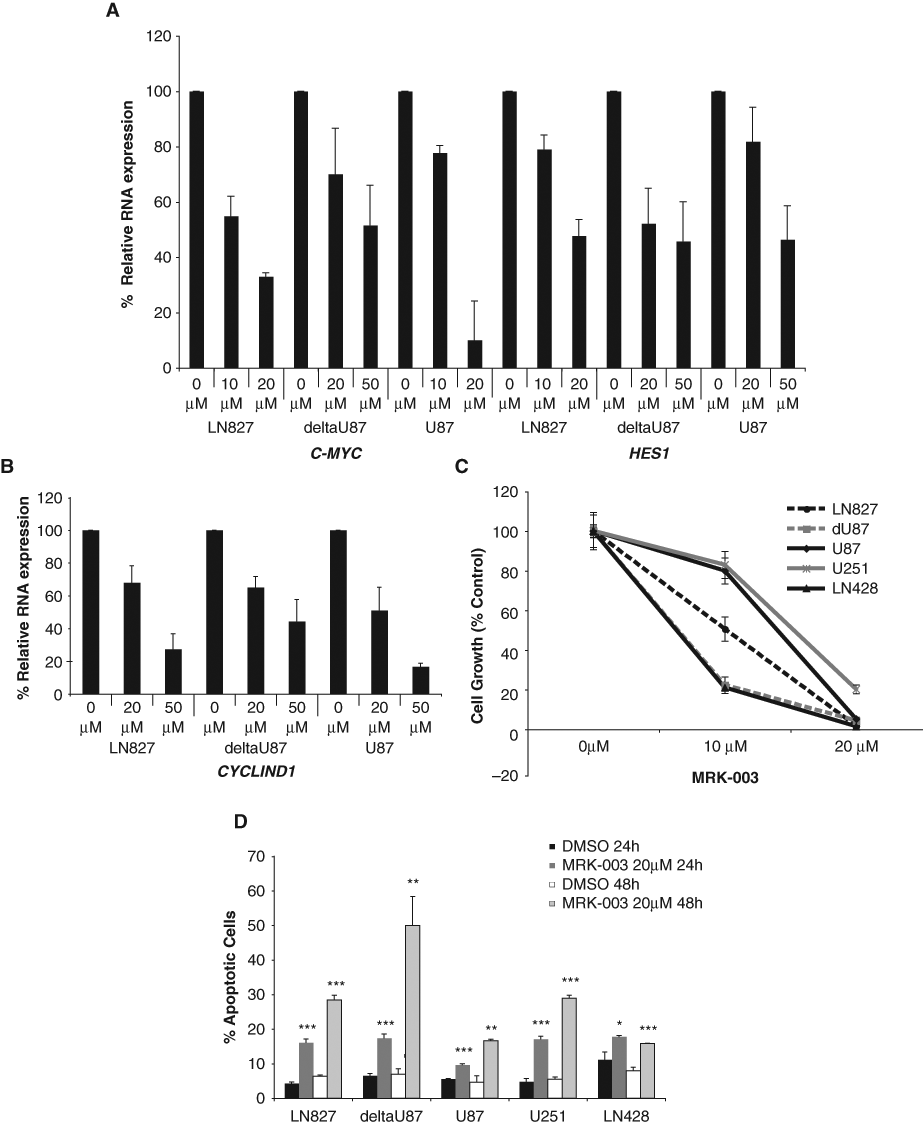
GSI MRK-003 treatment down-regulated Notch target gene expression, inhibited GBM cell growth, and induced apoptosis. (
Notch1 and Notch2 have differential effects on GBM cell line growth
These GBM cells express Notch receptors 1, 2, and 3, with NOTCH2 being the most abundant. NOTCH2 mRNA was 10-fold higher than NOTCH1 and 20- to 25-fold higher than NOTCH3 in the cells studied here (Fig. 1A). To further investigate the importance of each receptor in GBM cell growth, we knocked down Notch1, Notch2, and Notch3 (not shown) using shRNAs. The knockdown of each Notch receptor was specific (i.e., the protein levels of each Notch receptor were not altered by the knockdown of the other two) (Fig. 5A). Comparable down-regulation of NOTCH1 or NOTCH2 in deltaU87 and U251 cells significantly reduced HEY1 expression compared to scramble control (Fig. 5B). We observed that NOTCH1 knockdown resulted in a reduction in cell growth (60%-80% decreased growth in LN428 and U251, respectively), as compared to control cells (Fig. 5C(a)). Notch2 knockdown with 2 shRNAs significantly inhibited the growth of all 5 cell lines 50% to 70% compared to scramble control–infected cells (Fig. 5C(b)). Notch3 knockdown only had a minor effect on U251 and LN428 cell growth, but not the other 3 cell lines (data not shown). Therefore, these data indicate that both Notch1 and Notch2 are involved in regulating GBM cell growth while Notch2 has a more dominant effect on these cells.
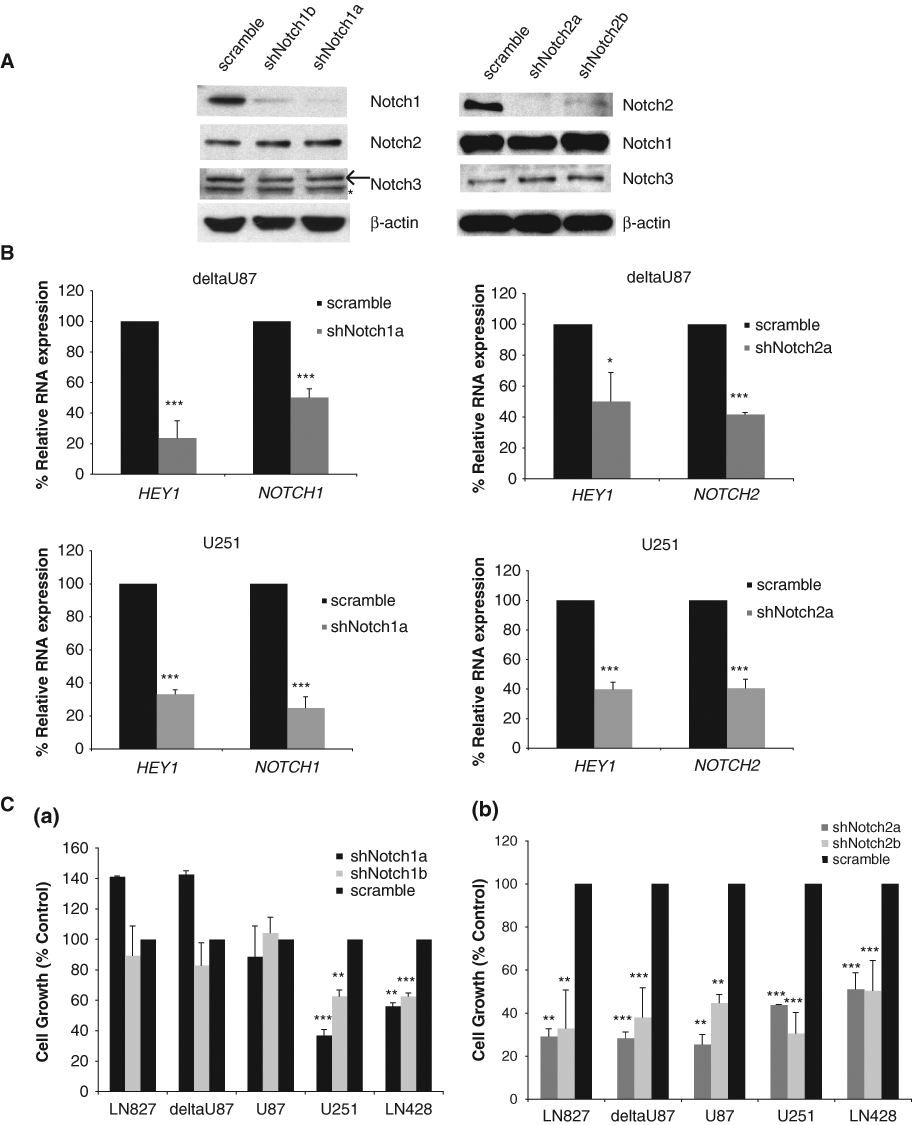
Notch1 and Notch2 knockdown differentially inhibited GBM cell growth. (
Inhibition of Notch signaling reduced human GBM neurosphere growth in vitro
Since inhibition of Notch signaling by either DN-MAML1 or GSI prevented GBM cell growth in vitro and in vivo, we further tested whether the Notch signaling inhibition could affect the growth of human GBM neurospheres. These neurospheres were derived from primary GBM tumors and cultured in the stem cell medium. Compared with serum-cultured cell lines, these neurospheres harbor more authentic tumor features and thus provided a useful tool to study the biology of GBM. 30 Some neural stem cell markers, such as CD133, NESTIN, and ALDH1A, were expressed differentially among these neurospheres, indicating the neural stem cell features of these spheres (Suppl. Fig. S5). Furthermore, all 3 neurosphere lines express Notch ligands, receptors, and target genes at relative high levels, suggesting that they harbor intact Notch signaling and activity (Suppl. Fig. S6). Expression of DN-MAML1 in neurosphere lines BT70, BT74, and BT37 resulted in a significant down-regulation of C-MYC, HES1, and HEY1 expression compared to GFP control, indicating that these neurospheres responded well to Notch inhibition (Suppl. Fig. S7). DN-MAML1 inhibited sphere formation of BT70, BT74, and BT37 lines by 29%, 39%, and 30%, respectively, compared to GFP control virus–infected neurospheres (Fig. 6A). This observation was consistent with the study from Fan et al., who reported that Notch pathway blockade depletes CD133-positive GBM cells and neurosphere growth. 38 We also used GSI to further confirm this growth inhibition effect. BT37 neurosphere was chosen as it has the most Notch target gene down-regulation after DN-MAML1 expression (Suppl. Fig. S7). GSI inhibited BT37 neurosphere formation in a dose-dependent manner. Treatment of 10 µM MRK-003 inhibited 30% of neurosphere formation in 5 days, while treatment of 20 µM MRK-003 inhibited almost 100% of neurosphere formation compared to DMSO control (Fig. 6B (a) and (b)).
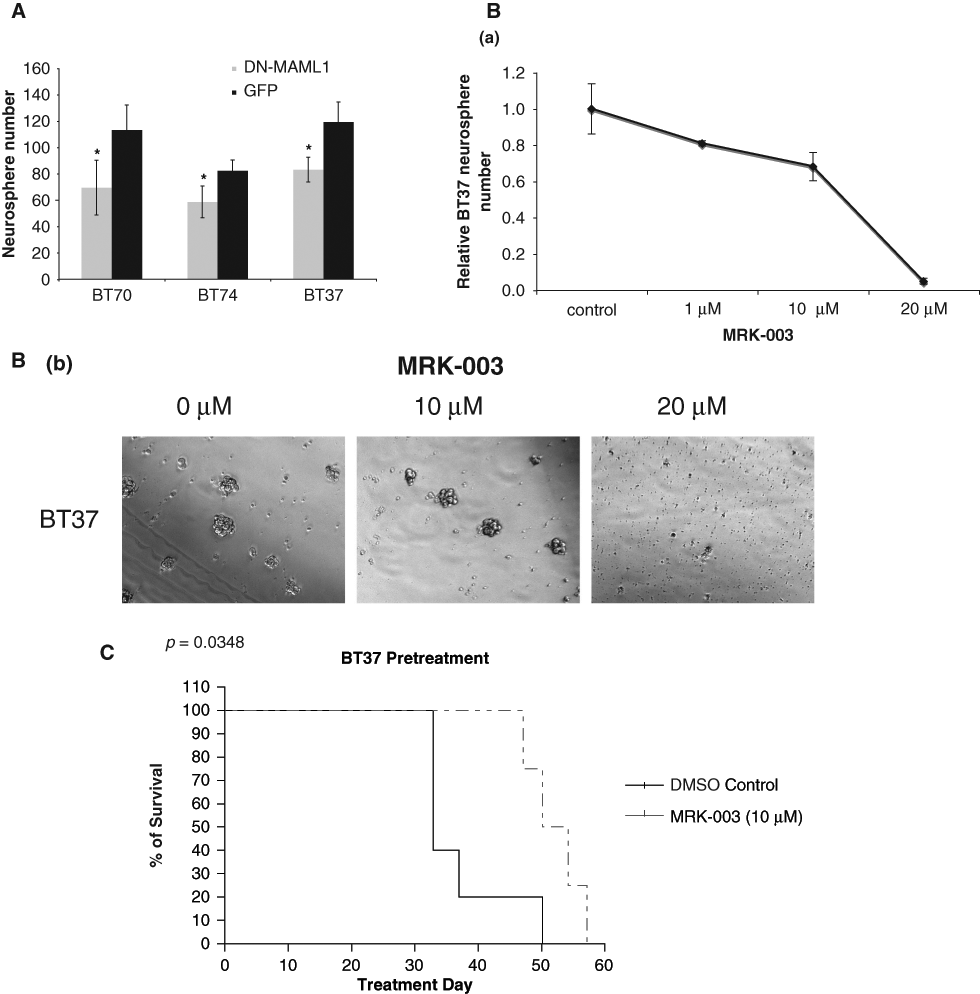
Inhibition of Notch signaling prevented human GBM-derived neurosphere growth in vitro and in vivo. (
Inhibition of Notch signaling prevented GBM neurosphere growth in vivo
To determine whether the in vitro inhibition of Notch signaling has functional relevance in vivo, equal numbers of BT37 neurosphere cells, pretreated with 10 µM GSI or the DMSO vehicle control for 24 hours, were intracranially injected into SCID mice. We found that mice injected with BT37 cells pretreated with GSI had significantly prolonged survival (P = 0.0348) compared to the controls (Fig. 6C). These data indicated that inhibition of Notch signaling prevented GBM neurosphere growth in vivo (Fig. 6C).
Discussion
The Notch signaling pathway has been associated with the pathogenesis of many cancers. 15 Here, we investigated the importance of Notch signaling and different Notch receptors in GBM, the most malignant type of brain cancer. After identifying elevated Notch signaling using web-based SAGE analysis, we confirmed the expression of Notch receptors 1, 2, and 3, Notch ligands Jagged1 and Jagged2 in GBM cells, suggesting possible juxtacrine or autocrine models of Notch activation. In addition, Notch signaling components were expressed in human GBM-derived neurospheres. These findings were consistent with other previous reports, 25-28 showing Notch signaling components were expressed in different brain tumors and play important roles in their pathogenesis. Recently, Verhaak et al. reported that Notch signaling was highly expressed in the classic subtype of GBM. 39 We further showed that DN-MAML1 and GSI inhibited Notch signaling and differentially inhibited GBM cell growth. The difference of growth inhibition could be due to the different cellular context and heterogeneous genetic background of these GBM cell lines. For example, U251 and LN827 express p53 mutants, while U87 and deltaU87 cells contain wild-type p53. 40 LN428 cells harbor wild-type PTEN, while the other 4 cell lines are PTEN null (data not shown). 40 PTEN mutation renders T-ALL cells resistant to Notch inhibition by GSI treatment, 41,42 as aberrant PI3-kinase/Akt signaling contributes to cell growth and survival. Whether mutation in PTEN contributes to GSI resistance in GBM cells needs to be investigated further.
Involvement of Notch signaling in cancer is highly context dependent. In embryonal brain tumors, Notch1 inhibits while Notch2 promotes tumor growth. 27 In GBM, Notch1 and its ligands Delta-like-1 and Jagged1 have been reported as important for tumor cell survival and growth. 26 Also, loss of Notch2 positively predicts the survival of human glial brain tumors. 28 Our results demonstrated that Notch2 is the predominant Notch receptor that contributes to the growth of all 5 GBM cell lines tested, while Notch1 contributed to U251 and LN428 cells. It is possible that as the RNA expression of NOTCH2 is 10 times higher than NOTCH1 in these GBM cells, they have more active Notch2 and thus are more dependent on Notch2 for growth. U251 and LN428 cells have relatively high protein levels of Notch1 and ligands Jagged1 and Jagged2. Therefore, these 2 cell lines may have more active Notch1 than the other 3 cell lines, which render them dependent on Notch1 for growth as well. Our results suggest that Notch2 and Notch1 are important for optimal GBM cell growth and therefore represent potential therapeutic targets. It would be interesting to identify the additional downstream target genes of Notch2 and Notch1 that facilitate their oncogenic functions. C-MYC is one of the interesting downstream candidates as it is a direct target of Notch signaling and has an oncogenic role in many tumors. 43,44
As GBM is one of the most malignant brain tumors, the most effective treatment so far has been surgery followed by radiation with concurrent and adjuvant temozolomide (TMZ) treatment. Invariably, all GBM patients succumb to recurrence within a few years. The resistant nature of GBM may be due to the fact that the GBM stem cells are resistant to this standard treatment. 45,46 We demonstrated that inhibition of Notch signaling by DN-MAML1 and GSI prevented GBM-derived neurosphere growth in vitro and in vivo. We also found GSI sensitized GBM cell lines and neurospheres to TMZ treatment and radiation (our unpublished data), which was reported by Wang et al. 47 Therefore, targeting GBM by Notch inhibition together with chemotherapy and radiation might lead to more durable clinical outcomes. It would be of great interest to further characterize the downstream molecular targets of Notch signaling that play roles in the renewal and proliferation in GBM and cancer stem cells. The results presented here may have clinical relevance in light of a recent report of a phase I clinical trial of GSI (MK-0752) in advanced cancers, which showed a partial responder in malignant glioma. 51
In addition, the dominant negative form of MAML1 was found to have significant impact on GBM cell line and tumor neurosphere growth. Since a cell-permeable, stabilized peptide that can directly inhibit Notch signaling is now available, 33 it will be of great interest to further test the effect of this peptide inhibitor on GBM cell line and tumor neurosphere growth, as it is a potential therapeutic tool with less off-target toxicity.
In summary, we demonstrated that Notch signaling is a major contributor for GBM cell growth. Notch2 and Notch1 are important Notch receptors that mediate this growth requirement, with Notch2 playing a more predominant role. Moreover, inhibition of Notch signaling by DN-MAML1 or GSI prevented human GBM-derived neurosphere growth. Our data suggest that inhibition of the Notch pathway is a promising therapeutic approach for GBM.
Materials and Methods
Serial Analysis of Gene Expression (SAGE) analysis
Web-based tool SAGE Anatomic Viewer (http://cgap.nci.nih.gov/SAGE/AnatomicViewer) was used to obtain the relative expression of 16 Notch signaling genes including 5 Notch ligands, 4 Notch receptors, and 7 known Notch target genes in a panel of 17 tumors and their cognate normal tissues. Each tumor type and its corresponding normal tissue were composed of samples (1-94) from the SAGE library. These samples are either patient bulk tumors or established human cell lines. GeneBank accession number of each Notch signaling gene was inputted, and the short tags with the highest rank were used to blast the SAGE automatic viewer (Suppl. Table S1). Mean of the tags per 200,000, which represents the expression of a gene in each tumor and its cognate normal tissue, was obtained. The expression fold change of the gene was obtained by dividing the mean of the tags per 200,000 of tumor over normal (Suppl. Table S2). As the brain tumor cohort has 94 samples (28 medulloblastoma, 20 astrocytoma, 19 glioblastoma, 12 ependymoblastoma, 5 meningioma, 2 oligodendroglioma, and 8 normal brain samples), we compared the tags per 200,000 of Notch signaling genes in each brain tumor subtype to normal brain tissue to delineate the Notch expression (Suppl. Table S3). The fold change was transformed to LOG (2) value. If the tags per 200,000 of a gene in one tissue was 0 (no expression), 1 was used to replace 0 when transforming into the LOG (2) value. The values were subjected to hierarchical clustering (average linkage analysis) using the DNA-Chip Analyzer software (www.dchip.org).
Plasmids and small hairpin RNAs
The FLAG-tagged 1-302aa MAML1 34 was cloned into the NheI site of lentiviral vector pCSCGW2-IRES-GFP. Small hairpin RNA (shRNA) lentiviral constructs targeting Notch1 (#a clone ID TRCN0000003359, #b TRCN0000003362) and Notch2 (#a clone ID TRCN0000004895, #b TRCN0000004896) were obtained from the Dana-Farber RNAi screening facility (Dana-Farber Cancer Institute, Boston, MA). pKLO.1–scramble control vector was obtained from Addgene (Cambridge, MA). pMD2-VSV-G and pCMV_dr8_91 were gifts from Dr. William Hahn (Dana-Farber Cancer Institute).
Hairpin sequence for TRCN0000003359:
CCGGCTTTGTTTCAGGTTCAGTATTCTCGAGAATACTGAACCTGAAACAAAGTTTTT
Hairpin sequence for TRCN0000003362:
CCGGCAAAGACATGACCAGTGGCTACTCGAGTAGCCACTGGTCATGTCTTTGTTTTT
Hairpin sequence for TRCN0000004895:
CCGGGCAAGAATTGTCAGACAGTATCTCGAGATACTGTCTGACAATTCTTGCTTTTT
Hairpin sequence for TRCN0000004896:
CCGGCCAGGATGAATGATGGTACTACTCGAGTAGTACCATCATTCATCCTGGTTTTT
Antibodies
Notch1 (sc-6014R, primary antibody dilution 1:200, Santa Cruz Biotechnology Inc., Santa Cruz, CA), Notch2 (#2420, primary antibody dilution 1:200, Cell Signaling Technology, Danvers, MA), Notch3 (sc-5593, primary antibody dilution 1:200, Santa Cruz Biotechnology), Jagged2 (#2205, primary antibody dilution 1:200, Cell Signaling Technology), Jagged1 (sc-8303, primary antibody dilution 1:200, Santa Cruz Biotechnology), c-Myc (sc-40, primary antibody dilution 1:1000, Santa Cruz Biotechnology), Hes1 (ARP32372_T100, primary antibody dilution 1:200, Avia Systems Biology, San Diego, CA), Hey1 (ab22614, primary antibody dilution 1:400, Abcam, Cambridge, MA), cyclinD1 (sc-450, primary antibody dilution 1:200, Santa Cruz Biotechnology), phospho-p44/42 MAPK (T202/Y204) (#4376, Cell Signaling Technology), phospho-AKT (S473) (#9271, Cell Signaling Technology), anti-FLAG M2 monoclonal antibody (primary antibody dilution 1:1000, Sigma-Aldrich, St. Louis, MO), GFP (sc-8334, primary antibody dilution 1:1000, Santa Cruz Biotechnology), and β-actin (primary antibody dilution 1:5000, Sigma-Aldrich) were used.
Western blot analysis
Fifty micrograms of proteins were separated by electrophoresis in 6% to 12% SDS-polyacrylamide gels, electrotransferred to polyvinylidene difluoride membranes (Millipore, Bedford, MA), and probed with the indicated antibodies as recommended by the manufacturer. Antibody binding was detected by chemiluminesence (Perkin-Elmer, Waltham, MA). Loading was normalized with β-actin (Sigma-Aldrich).
Cell line culture
Glioblastoma cell lines LN827, U87, deltaU87 (EGFR vIII overexpressing U87), U251, and LN428 were cultured in Dulbecco’s modified Eagle’s medium (DMEM) (Mediatech, Manassas, VA), supplemented with 10% heat-inactivated fetal bovine serum (Lonza, Basel, Switzerland), 1% penicillin-streptomycin (Mediatech), and 2% L-glutamine (Mediatech). 293FT cells were cultured in DMEM with 10% fetal bovine serum and 1% penicillin-streptomycin. All cell lines were incubated at 37°C, 5% CO2.
Neurosphere cultures
The human GBM stem cell line BT37 was derived from a patient who underwent surgery at Brigham and Women’s Hospital according to approved protocols. The BT70 and BT74 lines were obtained from GBM xenografts received from C. David James (University of California, San Francisco, CA). These xenografts were derived from glioblastoma biopsies and implanted into immunocompromised mice and passaged-in mice. Dissected xenografts were washed in artificial cerebrospinal fluid (CSF) and manually dissociated into single cells. Red blood cells were removed using Lympholyte-M (Cedarlane, Burlington, NC). The cells were cultured in DMEM/F12 (with L-glutamine, Invitrogen, Carlsbad, CA) medium containing glucose (0.3%), penicillin/streptomycin (50 µg/mL), Apo-transferrin (0.1 mg/mL), progesterone (20 nM), sodium selenite (30 nM), putrescine (60 µM), insulin (25 µM/mL), sodium bicarbonate (3 mM), HEPES (10 mM), 20 ng/mL EGF, 10 ng/mL LIF, and 20 ng/mL FGF. Live cells were counted using a hemocytometer and trypan blue exclusion. 30,48
Secondary neurosphere assay
Neurospheres are mechanically dissociated into single cells and viable cells counted using trypan blue exclusion. Approximately 20,000 to 100,000 viable cells were used per treatment condition (done in triplicates), and the cells were allowed to form spheres for 5 days, after which the numbers of neurospheres were counted by microscopy (Fig. 6B(b)).
Compound treatment
For inhibitor treatments, cells were grown in their normal medium and treated with 10 µM or 20 µM of GSI MRK-003 (Merck Research Laboratories, Boston, MA) or DMSO (Sigma-Aldrich) for 24 or 48 hours as indicated in the text.
Lentiviral transduction
To produce lentivirus, 293FT cells were plated at 3 × 10⁶ in 100-mm dishes. DN-MAML1, PCSCGW2-IRES-GFP lentiviral vectors, lentiviral vectors targeting Notch1, Notch2, or PKLO.1–scramble control plasmid, together with packing plasmid pCMV_dr8_91 and pseudotyped envelope pMD2-VSV-G, were transfected into the cells at a ratio of 1:1:1 using Fugene 6 reagent (Roche, Basel, Switzerland). Virus was collected 48 and 72 hours posttransfection. Target cells were infected twice with 0.8 mL virus plus 0.2 mL fresh complete medium with 8 µg/mL Polybrene (Sigma-Aldrich) for 6 hours and replaced with fresh medium. 49 For neurosphere infection, 110 mL of virus was concentrated by ultracentrifugation using SW-28 rotor and rotated at 19,500 rpm at 4°C for 3 hours. The pellet was resuspended in 360 µL serum-free DMEM overnight. Fifty microliters of virus was used to infect 100,000 viable cells.
Quantitative real-time reverse transcription PCR (qPCR)
Total RNA was isolated by the Trizol method (Invitrogen), and cDNA was generated from 800 ng of total RNA (Taqman Reverse Transcription Kit, Applied Biosystems, Foster City, CA). qPCR was performed from the cDNA samples using ABI PRISM 7500 sequence detector (Applied Biosystems), and the PCR products were measured by the SYBR green method (Applied Biosystems). All samples were amplified in triplicates. The relative change of transcript amount in each sample was determined by normalizing with the GAPDH mRNA expression levels. The relative RNA expression of genes was also normalized with GAPDH amount. 50 Primer sequences are listed in Supplementary Table S4.
Cell growth, MTS assays, cell cycle analysis, and apoptosis assay
For cell growth assay, 2 × 10⁵/2 mL GBM cells were plated in 6-well plates, infected with lentivirus plus fresh medium twice for 6 hours. On day 5 postinfection, cells were trypsinized and resuspended in 500 µL medium, and 25 µL of cells were counted using a hemocytometer by trypan blue exclusion. The rest of the cells were diluted to 4 mL, and 2 mL of cells (1:2 dilution) were plated back to 6-well plates and counted on day 8 or day 9.
For MTS proliferation assay (Promega, Madison, WI), cells were plated at 1 to 2 × 10³/50 µL in 96-well plates. Fifty microliters of growth medium diluted with MRK-003 or DMSO were added 3 hours later to make the final concentration as indicated in the text. MTS activities were measured on day 5 at OD 490 using the Elisa microplate reader (Spectra Max190, Molecular Devices, Sunnyvale, CA).
For cell cycle assay, 2 × 10⁵/2 mL GBM cells were plated in 6-well plates, infected with lentivirus plus fresh medium twice for 6 hours. On day 4 postinfection, cells were trypsinized, washed once with ice cold 1x PBS (Mediatech), fixed with 40% ethanol for 30 minutes, treated with 500 µL 500 µg/mL RNAse A (Sigma-Aldrich) for 30 minutes at 37°C, and stained with 0.0046 mg/mL propidium iodide (Sigma-Aldrich) for 30 minutes in the dark at room temperature. DNA amount was measured by flow cytometry analysis (BD FACScans, BD Biosciences, San Jose, CA). Cell cycle distribution was determined by ModFit software (Verity Software House, Topsham, ME). A minimum of 10,000 events was collected to perform each experiment.
For apoptosis assay, 1 × 10⁵/2 mL GBM cells were plated in 6-well plates. Two milliliters of growth medium diluted with 20 µM MRK-003 or DMSO were added the second day or infected with DN-MAML1 or GFP lentivirus twice for 6 hours. Cell viability was measured after 24 or 48 hours of treatment using the Annexin-V-FLUOS Staining Kit (Roche Diagnostics, Indianapolis, IN). Briefly, cells were trypsinized and washed once with 1x PBS. Cell pellet was resuspended in 100 µL buffer 3 together with 2 µL propidium iodide (PI) and 2 µL Annexin-V, incubated for 15 minutes in the dark and subjected to flow cytometry analysis (BD FACScans).
In vivo murine xenograft model
For LN827, cells were infected twice with DN-MAML1 or GFP control virus. On day 3 posttransduction, 1 × 10⁶ cells were injected intracranially into SCID (NOD/SCID mice from Taconic, Hudson, NY) mice using a stereotactic apparatus. 48 For BT37 studies, tumors grown in flanks of SCID mice were dissected out, dissociated, plated, and immediately treated in vitro for 24 hours with either DMSO or MRK-003. Cells were then manually dissociated and counted. Cells were resuspended in PBS at a concentration of 2 × 10⁴ viable cells/5 µL and implanted into the right striatum as previously described. 48 Mice were sacrificed when morbid, and the date was recorded for survival analysis. Brain tumors from both DN-MAML1 or control mice were excised, snap frozen in liquid nitrogen, and stored at –80°C.
Statistical analysis
The values were shown as the mean ± standard deviation. Comparisons were performed using the Student t test (GraphPad Software Inc., San Diego, CA). Significant P values were shown as P < 0.05 (*), P < 0.01 (**), and P < 0.001 (***). For survival analysis, a log-rank test was performed using Prism 4 software (GraphPad Software Inc.).
Footnotes
Acknowledgements
The authors thank Merck Research Laboratories for MRK-003 and Dr. Martin Sattler for scientific suggestions. The costs of publication of this article were defrayed in part by the payment of page charges. This article must therefore be hereby marked as advertisement in accordance with 18 U.S.C. Section 1734 solely to indicate this fact.
This work was supported in part by grants from National Institutes of Health (NIH) RO1 CA66996 to J.D.G. and NIH K08CA124804 and ABC2 to S.K.
S.K. is a coinvestigator on a phase I clinical trial for the GSI MK-0752. P.R.S. is a full-time employee of Merck Research Laboratories. J.D.G. is funded by and on the consultant/advisory board of Novartis. No further potential conflicts of interest exist.
References
Supplementary Material
Please find the following supplemental material available below.
For Open Access articles published under a Creative Commons License, all supplemental material carries the same license as the article it is associated with.
For non-Open Access articles published, all supplemental material carries a non-exclusive license, and permission requests for re-use of supplemental material or any part of supplemental material shall be sent directly to the copyright owner as specified in the copyright notice associated with the article.