
Abstract
Disparities in demographic representation between students, teachers, and educational leaders have persisted for decades, as have outcomes on licensure exams across fields. With administrative data from the California Administrator Performance Assessment (CalAPA), we used descriptive analyses to elucidate a demographic profile of California’s educational leadership pipeline. We then used general linear models to explore patterns of association among racial/ethnic and gender groups on administrator candidate scores from the CalAPA. We found that diversity in California’s principal pipeline shows promise for future diversification in the principalship, yet disparities in licensure assessment outcomes raise some concerns about fairness.
Keywords
Introduction
Demographic disparities persist in the outcomes of employment and licensure exams (Angrist & Guryan, 2008; Columbia Law Review Association, 1968; Esmail & Roberts, 2013; Nettles et al., 2011; Nienow & Sogabe, 2023; Patrick, 2024; Wightman, 1998). Disparities are germane to employment and licensure exams across fields, including licensure exams for educational leaders (Fuller & Young, 2022; Grissom et al., 2017), and scholars have critiqued the use of licensure assessments for initial principal licensure for this and other reasons (Grissom et al., 2017; Perrone et al., 2022). Nevertheless, 33 of the 50 United States require some form of licensure assessment for principal licensure (Gordon & Niemiec, 2020). As Perrone et al. (2022) asserted, research on principal licensure “is incredibly important given that licensure tests can unnecessarily restrict the supply of principals—especially principals of color” (p. 426).
Over the past two decades, several states have adopted performance assessments for teacher licensure such as the edTPA (De Voto et al., 2021; Pecheone & Chung, 2006). Performance assessments represent a stark contrast with traditional licensure exams. These performance assessments are portfolio-style assessments, often embedded in preparation programs or internships, in which pre-service educators demonstrate capacities for the job—as opposed to more traditional licensure exams which might include multiple choice items or written responses to prompts. More recently, a smattering of states (e.g., Massachusetts, Georgia, Texas, and North Carolina) have adopted policies requiring performance assessments for licensure of school leaders. The California Commission on Teacher Credentialing implemented the first administration of the California Administrator Performance Assessment (CalAPA) in the 2018–2019 academic year, following a pilot study the year prior. The CalAPA certifies candidates for the Preliminary Administrative Services Credential, allowing one to obtain administrative jobs including the principalship in California public schools. Thus, the CalAPA represents a possible barrier into the administrator labor market.
Given the paucity of data on the principal pipeline across the United States, Perrone et al. (2022) called “for improved national and state-level data collection and access relevant to the principal pipeline … preparation, licensure, and labor markets—as well as the essential issue of diversity itself” (p. 423). We sought to describe diversity in one segment of the principal pipeline in California and to assess potential interaction and main effects of race/ethnicity and gender on administrator candidate outcomes on the CalAPA, utilizing data from the first four years of implementation. Through reflection on potential disparities in performance assessment for administrative licensure outcomes, the following research questions were posed: How do CalAPA scores vary across candidates of different racial/ethnic backgrounds, gender identities, and over time? And what interaction and main effects exist in CalAPA outcome scores among racial/ethnic and gender groups? Following a review of salient literature related to issues of diversity in the principal pipeline and our methodological approach, we present our findings. Subsequently, we situate our findings in the literature and conjecture implications thereof.
Diversity in the Educator Labor Force
Disproportionate underrepresentation of racial/ethnic minorities in teaching and educational leadership positions have been repeatedly documented (e.g., Bitterman et al., 2013; Taie & Goldring Westat, 2019). According to the most recent administration of the National Teacher and Principal Survey (NTPS, 2021), since the Schools and Staffing Survey (SASS, 2012) was last administered, the principal workforce across the United States is becoming slightly more diverse. In the 2020–2021 school year, 78.4% of principals were White and non-Hispanic compared to 80.2% in the 2011–2012 school year. The racial/ethnic diversity of teachers and principals remains disproportionate to the racial/ethnic distribution of students in the United States (National Center for Educational Statistics [NCES], n.d.). Relative to the percentage of females present in the teacher workforce, males are disproportionately selected at higher rates than females to matriculate into administrative roles, especially in larger and high schools (Davis et al., 2017; Jean-Marie, 2013). According to the 2020–2021 NTPS administration, 76.8% of public-school teachers in the U.S. were female, while 56.0% of principals were female.
Representation Matters
Evidence suggests Black and Latine students benefit from attending schools with Black and Latine educators (Atkins et al., 2014; Bates & Glick, 2013; Downer et al., 2016; Egalite et al., 2015; Moore et al., 2017). Furthermore, evidence suggests that Black and Latine students benefit from having Black and Latine administrators (Grissom et al., 2017; Meier, 1993; Meier & Stewart, 1992; Perrone, 2022). Likewise, gender plays an important role in educational leadership and student outcomes (Green, 2015; Perrone, 2022). More generally, bureaucratic representation theory posits that citizens who are served by bureaucratic agencies are better served when the bureaucrats who serve them share similar characteristics (Nicholson-Crotty et al., 2011; Pitkin, 1967; Pitts, 2005). If there is to be proportional representation of educational administrator candidates in the labor queue (Thurow, 1975), then barriers to entry must be scrutinized.
There is evidence supporting the suppositions of bureaucratic representation in principal workforce diversity beyond student outcomes (see Grissom et al., 2021; Perrone, 2022). For example, Grissom and Keiser (2011) demonstrated that teachers had higher rates of job satisfaction and tended to remain at their school when they are supervised by someone of the same race and that Black teachers were paid less supplemental pay than White teachers at the same school when they were supervised by a White principal. Bartanen and Grissom (2019) found that Black teachers were more likely to be hired by a Black principal and were more likely to continue teaching at the same school when there was a Black principal. These findings suggest that increases of minorities in educational leadership positions may lead to increased retention of minorities in the teacher workforce. Furthermore, Grissom et al. (2012) found evidence that a principal’s gender is important in predicting teacher job satisfaction and turnover. Given the body of research on the import of representation in schools, our study centers on diversity and potential disparities among administrator candidates on the CalAPA.
Diversity and Licensure in the Principal Pipeline and Labor Market
The term “pipeline” serves as a metaphor for the trajectories, benchmarks, and attrition in the educational leadership workforce. The term pipeline serves as a helpful metaphor for making key points. Clement and Young (2022) and Fuller and Young (2022) evoked imagery of “leaks” in the pipeline to describe segments where career trajectories leading to administrative positions for educators of Color are disproportionately and negatively impacted. Clement and Young (2022), Fuller and Young (2022), and Perrone (2022) pointed to many examples of such leaks in the principal pipeline, such as equitable access to recruitment efforts, high-quality leadership preparation programs, certification (including licensure exams), matriculation, and retention in administrative roles. Similar to the metaphor of leaks in the principal pipeline, authors have critiqued the use of licensure assessments as serving a gatekeeping function or, using more explicit diction, as representing structural barriers to racial/ethnic diversity in the educator pipeline (Agarwal-Rangnath & Ayers, 2024; Bennet et al., 2006; Memory et al., 2003; Petchauer, 2012).
Teachers dominate the potential educational administrator pool (Hackmann, 2016). Racial and gender inequities in outcomes on teacher licensure exams have long been observed (Anrig et al., 1986; Epstein, 2005; Goldhaber & Hansen, 2010). In spite of persistent disparities across licensure assessments, some authors have lauded the promise of performance-based teacher licensure assessments as meaningful predictors of future teacher effectiveness (Darling-Hammond, 2010; Darling-Hammond et al., 2013) as well as their potential to support the improvement of educator preparation programs (Pecheone & Chung, 2006; Peck & McDonald, 2013) and pre-service teacher learning (Chung, 2008). The role of demographic factors in performance-based teacher licensure assessments has received some attention. Using ANOVAs and t-tests to analyse outcomes from a pilot of the Performance Assessment for California Teachers, Pecheone and Chung (2006) found no statistically significant differences among groups of candidates for initial teacher licensure, based on race/ethnicity, gender, or cultural-linguistic background. As such, Pecheone and Chung’s findings point to the promise of fairness in performance assessments.
Less is known about performance assessments for initial principal licensure relative to more traditional licensure exams for the principalship; although Orr, Pecheone, Hollingworth et al. (2018) and Orr, Pecheone, Snyder et al. (2018) have offered works related to content validity and reliability of Massachusetts’s Performance Assessment for Leaders (PAL). More recently, Orr and Hollingworth (2023) were able to match PAL scores of candidates who completed the PAL between 2014 and 2019 to some labor market outcomes. Orr and Hollingworth were interested in the rate at which PAL completers in successive cohorts matriculated into leadership positions, relative to non-PAL certified candidates. Using analysis of variance and regression techniques, Orr and Hollingworth (2023) found that cohorts of candidates held to successively higher cut scores of the PAL “advanced more quickly than those with lower or no score requirements,” and that PAL completers “were more likely to be rated as exemplary on educator evaluation and more likely to be retained or promoted after two years in their first school leader position” (p. 362). Their findings suggest some clear benefits of performance assessments for administrator candidates in the labor market. Relevant to our own study, Orr and Hollingworth also compared all first-time hires as assistant principals or principals by gender (female/not-female) and race/ethnicity (White/non-White) with PAL-completion status. They found that PAL completers who matriculated into these administrative positions were more likely to be female but less likely to be non-White than non-PAL completers. Furthermore, Orr and Hollingworth (2023) asserted “gender and race/ethnicity seemed to matter less in career advancement than was found in other studies” (p. 362).
In recent decades, several authors have explored relationships between numerous variables and more traditional principal licensure exam scores. Using t-tests for within-characteristic comparisons and logistic regression, Grissom et al. (2017) found non-White test takers of the School Leaders Licensure Assessment scored significantly lower and were 12% less likely to achieve a passing score. Interestingly, they also found no evidence that licensure exam scores were valid predictors of several different measures of principal effectiveness from Tennessee. Scores on the School Leaders Licensure Assessment did, however, predict the likelihood of an individual being appointed to the principalship. Grissom et al. (2019) also drew administrative data from Tennessee and attempted to use an estimated probability of failure on the School Leaders Licensure Assessment as an indicator of principal preparation program quality, which was used to predict principal labor market outcomes and job performance. Grissom et al. (2019) “were able to associate [principal preparation programs] with high and low principal [job] performance” (p. 73) but faced several methodological challenges. Worthy of noting here, they stated, “the small sizes of many [principal preparation programs] in the state make drawing statistical distinctions among programs difficult” (p. 107), even over the course of a decade of principal candidate data and were forced to collapse smaller programs into groups large enough to draw meaningful statistical inferences.
Other authors (e.g., Faircloth et al., 2015; Gillborn et al., 2018) have discussed the limitations of quantitative efforts to operationalize racial/ethnic and gender diversity; notably, the ways in which race/ethnicity and/or gender are operationalized in the myriad administrative data sets often used to investigate diversity. In addition, given the relative sizes of racial/ethnic groups, quantitative researchers often exclude or collapse racial/ethnic groups, often to a White/not-White dichotomy or sometimes to a few groups of relatively larger size where possible (e.g., Asian, Black, Hispanic, Latine, White, and sometimes “other”)—if not to ensure ethical data sharing and reporting standards, then because inferential analyses often have limits on disparate cell sizes, given their assumptions. Similar tensions and critiques about gender or gender identity have been noted (Perrone, 2022).
Exploring various segments of the principal pipeline in Texas, Fuller and Young (2022) used administrative data from the Texas Education Agency between 1987 and 2007 to illustrate disparities in passing rates on principal certification tests by race/ethnicity, with White candidates having higher passing rates (to a greater or lesser extent) than all other racial/ethnic groups identified. Fuller et al. (2007), using ordinary least squares estimates, found that whether a principal had failed a licensure exam was significantly related to student achievement outcomes on the Texas Assessment of Knowledge and Skills, as were gender and race. Neither Fuller and Young (2022) nor Fuller et al. (2007) specified particular principal licensure exams by name. However, given the timing and context of these studies, we can infer these exams were more traditional licensure exams (not performance assessments).
No peer-reviewed empirical literature on CalAPA outcomes could be found, although several authors have written about the CalAPA. Alongside implementation of the CalAPA, authors have provided summaries of the development and design process (Reising et al., 2019), investigations of content validity (Orr et al., 2018), literature reviews situating theoretical perspectives related to equity imbued in the CalAPA (Szolowicz, 2020), as well as grey literature (Kearney et al., 2018) and empirical works (Ojeda et al., 2019) which summarized findings from interviews and surveys of faculty in California administrator preparation programs. Prior to the design and implementation of the CalAPA, a consortium of faculty from the California Professors of Educational Administration Association called for the redesign of administrator preparation programs and to “assess an administrator’s level of competence … based on fair [emphasis added] and accurate performance assessments” (Davis et al., 2011, p. 81). Our study centers on the evaluation of fairness embodied in the CalAPA.
The Principal Pipeline in California
California has a two-tiered administrator credential system and does not distinguish credentials for distinct administrative positions in schools or district offices (California Commission on Teacher Credentialing [CCTC], 2022). To obtain the preliminary credential and therefore be eligible to obtain an administrative position in a California public school, an administrator candidate must either complete a CCTC-accredited preparation or internship program and pass all three Cycles of the CalAPA, or achieve a passing score on the California Preliminary Administrative Credential Examination—which is not a performance assessment. Prior to the 2018–2019 academic year, administrator candidates seeking the preliminary credential through an accredited preparation or internship program did not need to complete any licensure assessment. Thus, the CalAPA represents a new and important gateway, structural barrier, or potential leak in the principal pipeline in California. Figure 1 illustrates the principal pipeline in California.
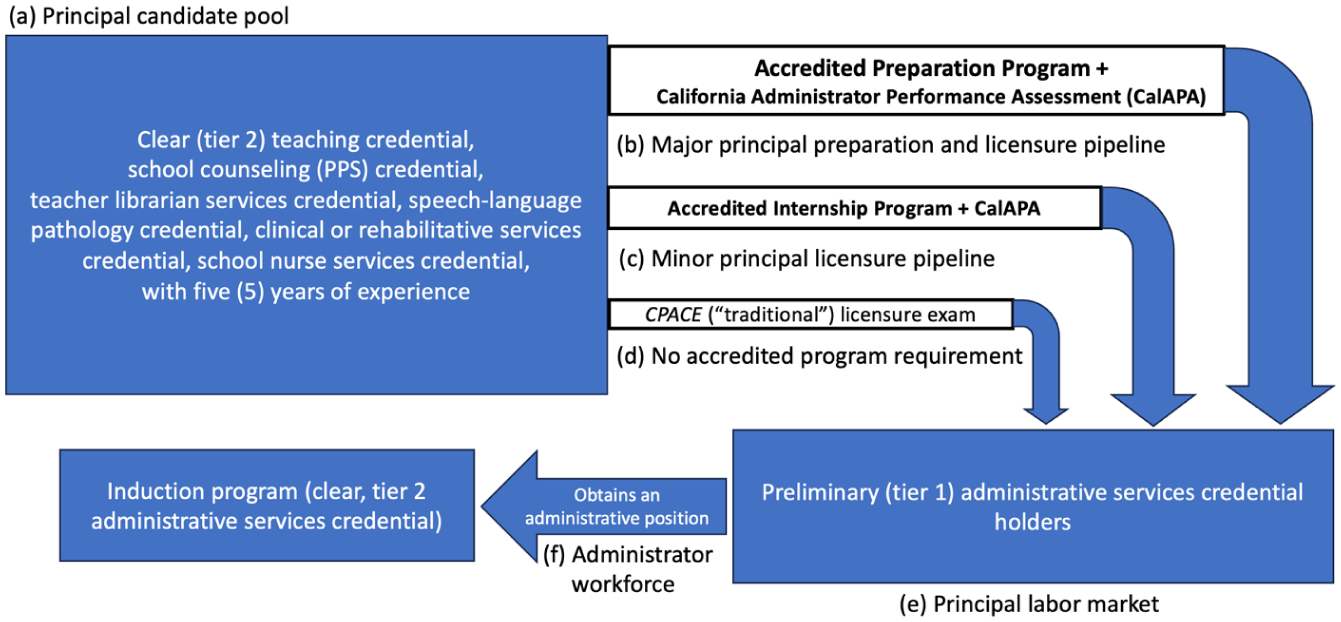
California’s principal pipeline.
The California Administrator Performance Assessment (CalAPA)
Beginning in the 2018–2019 academic year, candidates for the preliminary administrative credential in California were required to complete, and in subsequent years meet minimum passing scores on, the CalAPA. 1 The CalAPA is similar to the Performance Assessment for Leaders (PAL) recently implemented in Massachusetts (Orr, Pecheone, Hollingworth et al., 2018; Orr and Hollingworth, 2023; Orr, Pecheone, Snyder et al., 2018), was developed in a manner similar to other performance assessments (e.g., the PAL, the PACT, and edTPA), and is comprised of three Cycles (Reising et al., 2019). Each of the three Cycles, or sub-assessments, is aligned to specific California Administrator Performance Expectations. The Cycles of the CalAPA closely mirror those of the Massachusetts PAL (Orr, Pecheone, Snyder et al., 2018). One notable exception being the exclusion of a Cycle related to family and community engagement, which is included as a fourth Cycle on the Massachusetts PAL. Indeed, the use of performance assessments for principal licensure seems to be an expanding trend. Texas and Georgia have recently adopted the Performance Assessment for School Leaders (developed by Educational Testing Services) for tiers 1 and 2 credentials, respectively, and North Carolina has recently implemented the Principal Portfolio Assessment for principal licensure.
Each Cycle of the CalAPA consists of four Steps (Investigate, Plan, Act, and Reflect) and each assesses specific California Administrator Performance Expectations. In Cycle 1, administrator candidates investigate school-level data to identify and understand root causes of equity gaps related to student academic achievement and/or well-being. Candidates then develop a problem statement and identify potential improvement strategies, elicit feedback from educational partners (e.g., site administrators, teachers, etc.), and subsequently refine proposed improvement strategies. Finally, candidates reflect on their learning, guided by a series of reflective prompts. In Cycle 2, candidates demonstrate capacity to facilitate a community of practice for improving student learning and/or well-being. In Cycle 3, candidates demonstrate their capacity for instructional coaching with a volunteer teacher.
Methods
We utilized descriptive statistics to explore the racial/ethnic and gender diversity in California’s principal pipeline and variations in CalAPA Cycle Sum Scores as well as multivariate and univariate general linear models to explore potential interaction and main effects with post-hoc tests to explore associations among racial/ethnic and gender groups. All data were acquired from the California Commission on Teacher Credentialing following approval of the California Committee for the Protection of Human Subjects' Institutional Review Board. The cases included administrative candidates who submitted any Cycle of the CalAPA in the first four academic years (2018–2019 through 2021–2022), including variables of candidate self-identified racial/ethnic and gender identity, as well as rubric-level scores across CalAPA Cycles. No personally identifiable information was revealed from the data release.
CalAPA Cycle Sum Scores
Candidates submit evidence (e.g., written responses to prompts, videos, samples of student work products, etc.) of their work for each Cycle, which is evaluated by trained scorers (employed by Pearson) against some number of analytic rubrics, each having five levels of success (5 = high performance, 1 = low performance). Evidence from Cycle 1 is scored against eight rubrics (40 points possible). Cycles 2 and 3 are each scored against seven rubrics (35 points possible). Three variables were operationalized as outcomes: the sum of all rubric-level scores for each of the three Cycles, or Cycle Sum Scores. In the 2018–2019 academic year, candidates did receive rubric-level scores, but there was no threshold or minimum passing score for any Cycle; administrator candidates simply had to submit all three Cycles. A minimum passing score for each Cycle was established in the 2019–2020 academic year using the Sum Score of all rubric-level scores included in the Cycle: 14, 12, and 12 for Cycles 1, 2, and 3 (respectively).
Race/Ethnicity
The American Psychological Association (n.d.) defines race not as an objective characteristic, but a social construct and categorization of people based on perceived physical traits that perpetuate social hierarchies. Ethnicity is defined as a characterization of individuals with shared culture related to common ancestry or shared history. We acknowledge the complexity inherent in objectifying both race and ethnicity. In the registration process for the CalAPA, candidates are presented with 19 categories, including an option for “other” and are asked to self-identify their race/ethnicity (see Table 1) or choose not to respond. Allowing for self-identification of race/ethnicity adds a layer of complexity to this variable in our study, given that an individual’s racial/ethnic identity is dependent upon one’s own psychological sense of belonging to a racial/ethnic group (American Psychological Association, n.d.). However, we see self-selection of one’s race/ethnicity as a strength of our data set. Another strength is the relatively large number of racial/ethnic categories from which administrator candidates can choose, allowing for great fidelity in the racial/ethnic diversity in the principal pipeline. However, we recognize that 20 racial/ethnic categories are restrictive to inferential statistical analyses.
Frequency Counts and Descriptive Statistics by Cycle: 2018–2019 through 2021–2022, First-Attempts for All Cycle Submissions.
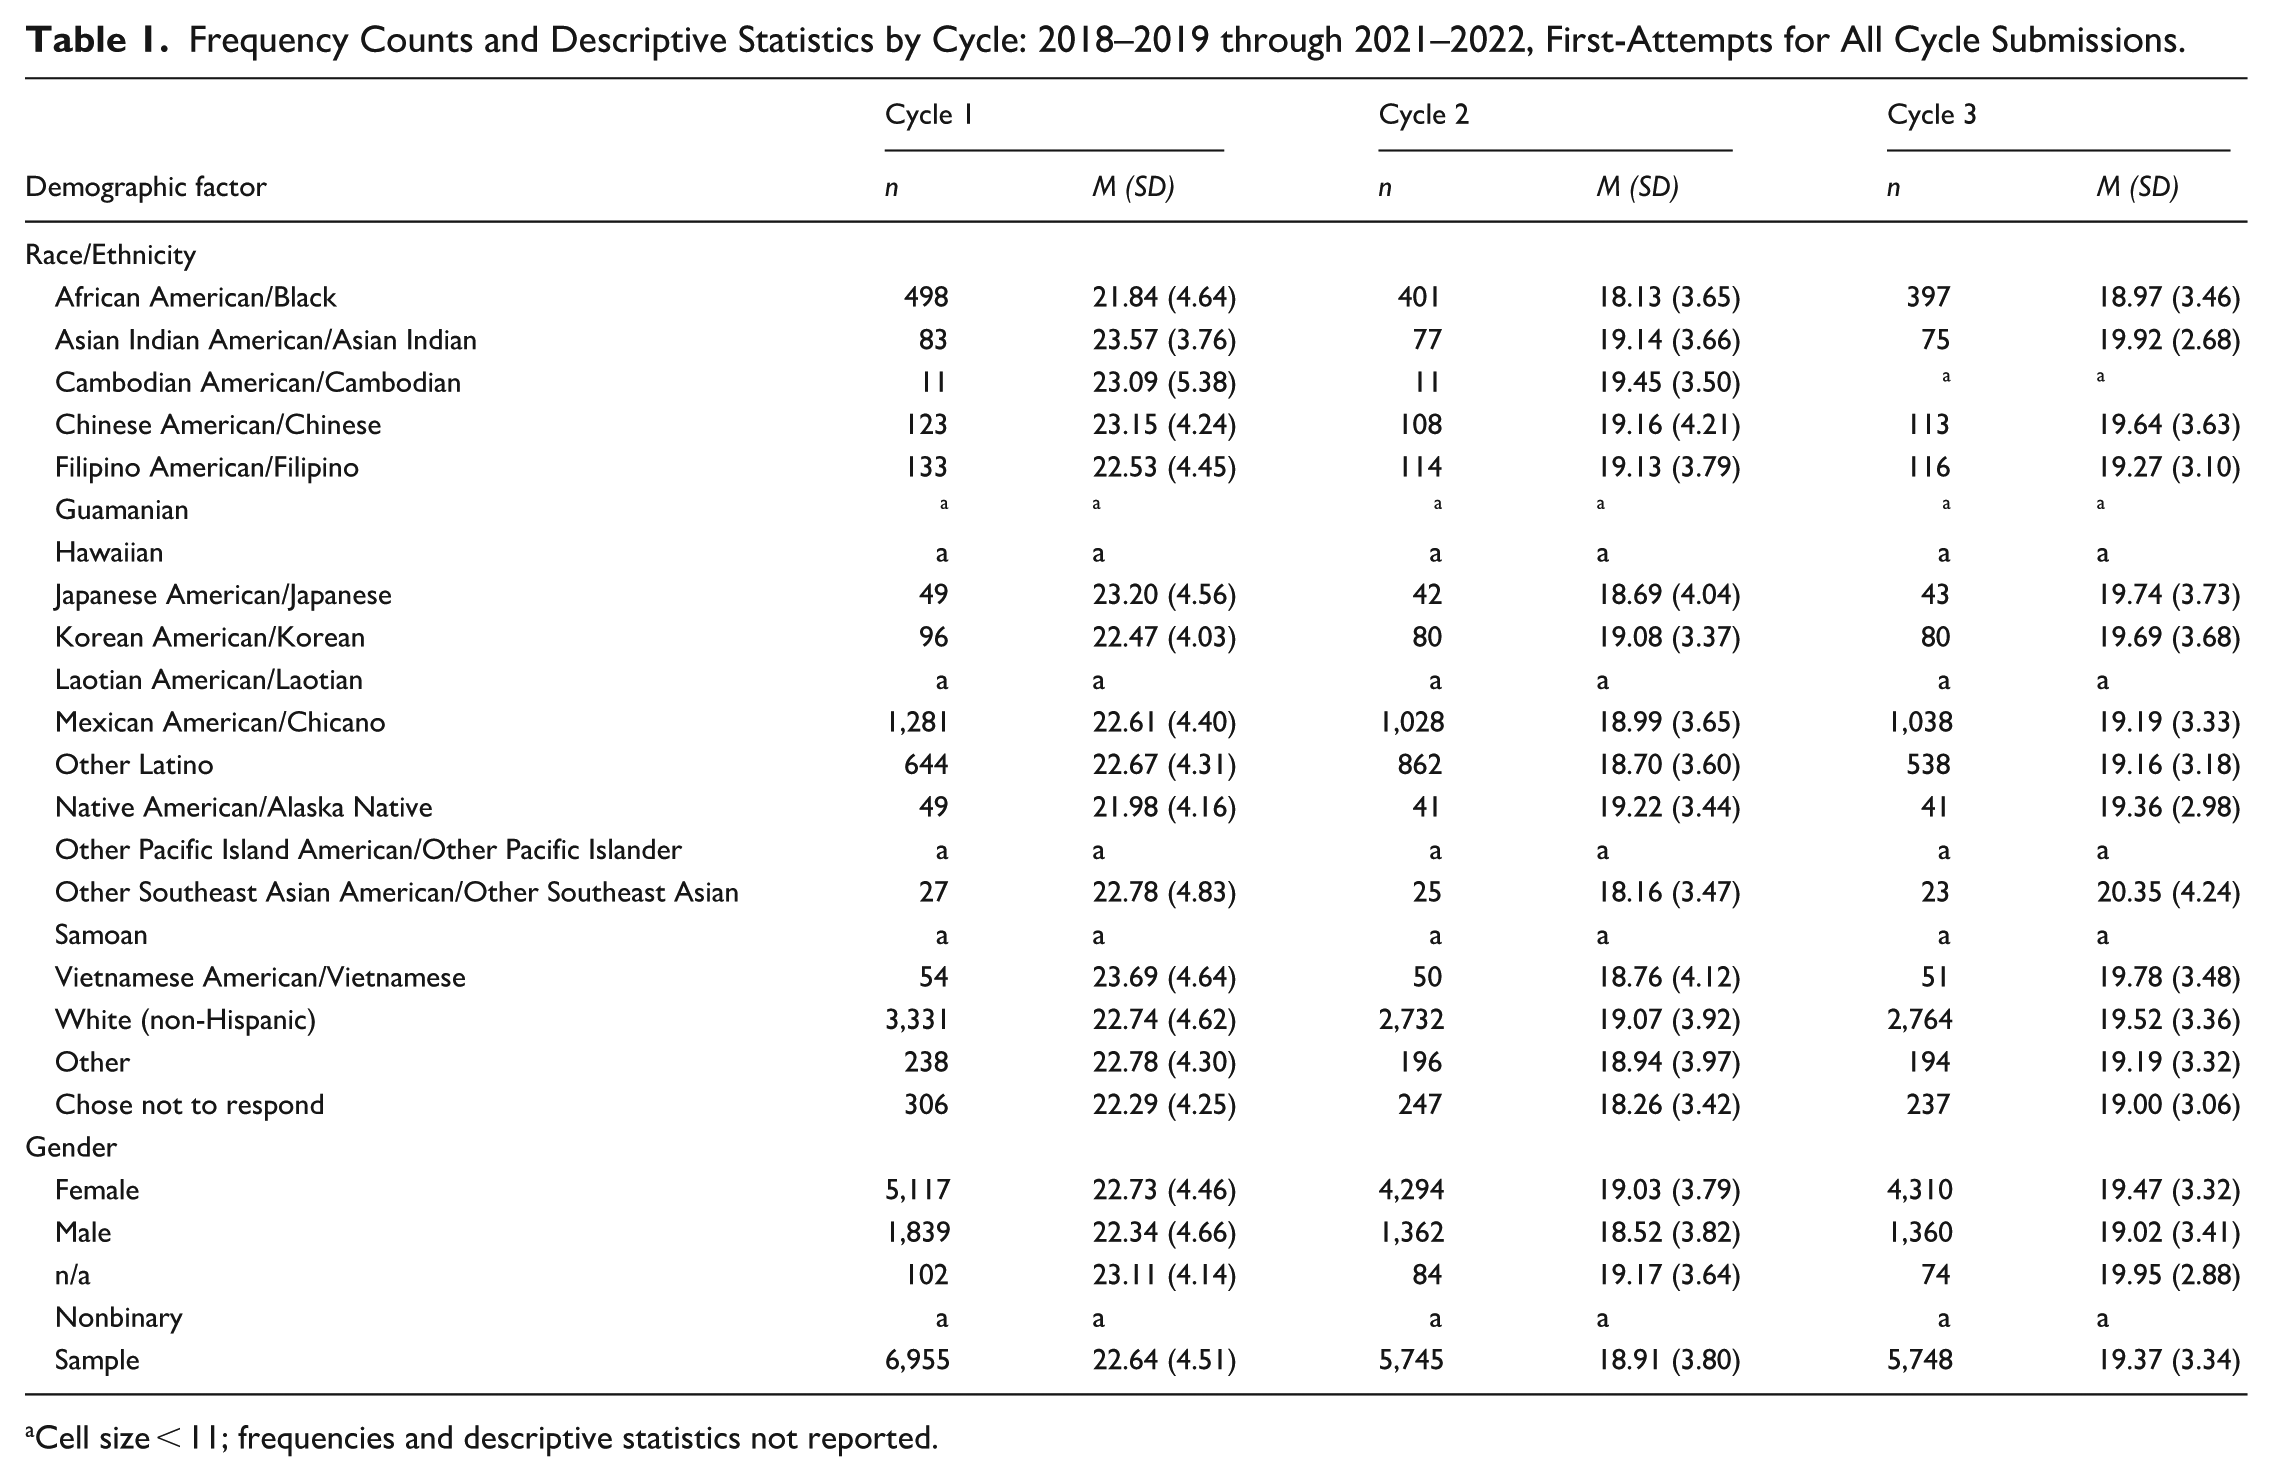
Cell size < 11; frequencies and descriptive statistics not reported.
In our descriptive analysis of diversity in the principal pipeline and CalAPA outcomes, we utilize all 20 categories of candidate self-identified race/ethnicity provided to provide some nuance in the differences in representation and CalAPA outcomes among racial/ethnic categories. Given the differences in cell sizes across racial/ethnic groups, for the inferential analysis, several categories for race/ethnicity were collapsed into six broader classifications of race/ethnicity to decrease the likelihood of violations of the assumptions for the statistical inferences employed. In collapsing categories of race/ethnicity, we were mindful of Gillborn et al.’s (2018) critique of using a White/non-White dichotomy, or other dichotomies. Yet even Gillborn et al. (2018) acknowledged the necessity of collapsing categories for the purpose of yielding meaningful statistical comparisons: “If using too few ethnic categories is one way to produce meaningless results, then using too many categories can be almost as bad” (p. 172).
Figure 2 illustrates how we collapsed racial/ethnic groups for our inferential analysis. Categories of race/ethnicity for the inferential analysis included Asian American/Asian (by collapsing racial/ethnic groups related to geographies of the Asian continent and Japan), African American/Black, White (non-Hispanic), Mexican American/Chicano, and Other Latino. Here, Other Latino is used to reference the specific ethnicity selected by candidates when they registered for the CalAPA. Other references to Latine throughout this paper should be interpreted as a more inclusive ethnic group, guided by the American Psychological Association’s (2023) Inclusive Language Guide; for example, when referencing the works of others who have used terms such as “Hispanic” or “Latino/a/x.” Finally, a category of “Other” included racial/ethnic groups related to geographies of the Pacific Islands and Native American/Alaska Native, as well as administrator candidates who selected “Other,” and those who chose not to respond.
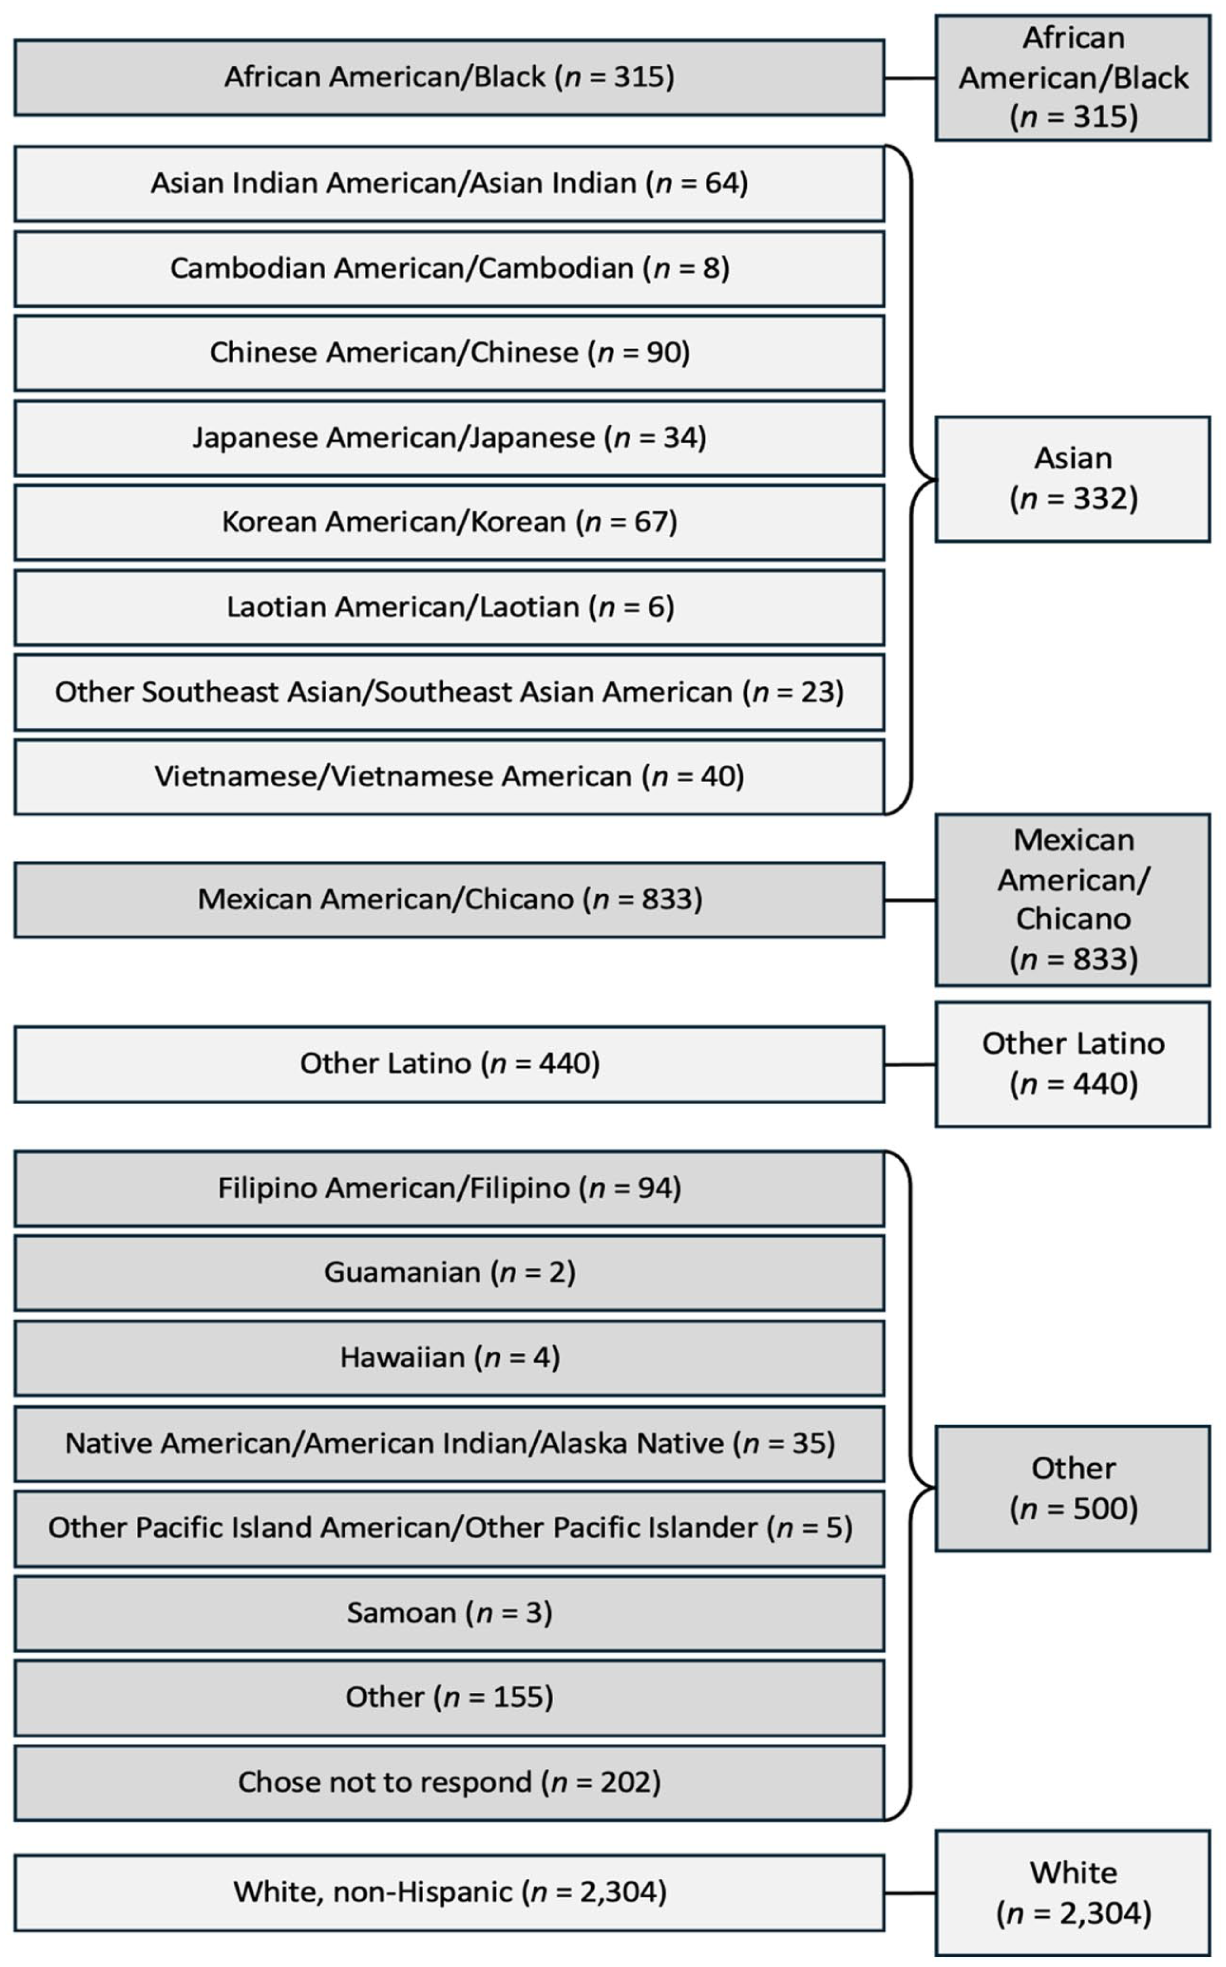
Collapsing of racial/ethnic categories for inferential analysis.
While bureaucratic representation theory has achieved hegemonic status in public administration studies, Strader et al. (2023) critically suggested a problem lies in researchers’ tendency to ignore sociohistorical context while using racial classification schemes to divide populations. Indeed, many authors have problematized the use of race with arguments like Strader et al.’s (2023) critique of the use of race in works evoking bureaucratic representation theory. For example, Ladson-Billings and Tate (1995) noted the tensions between thinking about race as an objective condition, raising questions about deciding how to fit individuals into racial classifications, versus treating race as an ideological construct. Gillborn et al. (2018) also problematized the idea of race as an objective condition and explicitly critiqued the collapsing of multiple racial/ethnic groups into a White/non-White dichotomy but also pointed to the futility of having too many categories for statistical inferences. Perrone (2022) levelled similar critiques regarding the literature on the principal pipeline, acknowledging that “part of this limitation is attributable to relatively small population sizes of educators” (p. 6). In our study, we acknowledge the ambiguities regarding classifications and deferred to the candidate’s self-reporting of their own racial classification utilizing the classifications presented to candidates upon registration for the CalAPA and tried to minimize the collapsing of racial/ethnic categories for the purpose of statistical inference testing.
Gender
Data on gender included four categories for candidates to self-identify (initially, female, male, and n/a; nonbinary was added in the 2019–2020 academic year). For our inferential analysis, gender was coded dichotomously with 1 representing female and 0 otherwise. Cell sizes for candidates selecting n/a, or non-binary were too small and were therefore collapsed in the dichotomous not-female along with candidates identifying as male. In fact, administrator candidates who selected non-binary were too scarce to ethically report descriptive statistics.
Results
In this section, we present the findings from our analysis. First, a descriptive analysis allowed for an exploration of racial/ethnic and gender diversity in California’s principal pipeline and variation in CalAPA Cycle Sum Scores across candidates of different racial/ethnic backgrounds, gender identities, and over time. Second, we sought to explore possible associations between race/ethnicity and gender with CalAPA Sum Scores on Cycles 1, 2, and 3. To explore these associations, we used multivariate and univariate analysis of variance to identify potential interaction and main effects of collapsed variables of race/ethnicity and gender on CalAPA Cycle Sum Scores.
Pipeline Diversity and Variation in CalAPA Scores
Administrator candidates in California are predominately White and female. Table 1 provides frequency counts and descriptive statistics of candidates’ first attempts of any Cycle, for all Cycle submissions in the sample (nCycle 1 = 6,955; nCycle 2 = 5,745; nCycle 3 = 5,748). Descriptive statistics show that the administrator candidate pipeline in the present sample is more racially/ethnically diverse than recent labor market statistics from across the United States and California in the 2020–2021 school year (NCES, n.d.). While White candidates composed the largest racial/ethnic group in the sample, they comprised only 47.9% of submissions for Cycle 1, 47.6% for Cycle 2, and 48.1% for Cycle 3. There was representation within all 20 racial/ethnic categories, though representation varied from one group to another. Other racial/ethnic groups with relatively large representation included Mexican American/Chicano, Other Latino, and African American/Black. Racial/ethnic groups with the smallest representation included some Asian and Pacific Islander groups (i.e., Guamanian, Hawaiian, Laotian American/Laotian, Samoan, and other Pacific Island American/Islander). About 3 in 4 administrator candidates in the present sample were female. In other words, gender parity apparently exists between the administrator pipeline and the teaching force, both across the United States and California.
Asian American/Asian groups (i.e., Asian Indian American/Asian Indian, Cambodian American/Cambodian, Chinese American/Chinese), tended to receive higher scores on the CalAPA while African American/Black candidates consistently received relatively lower scores than any other demographic group across all CalAPA Cycles. CalAPA Sum Scores for candidates identifying as Mexican American/Chicano, Other Latino, and American Indian/Alaska Native were typically consistent with scores of White candidates in the sample. Females tended to score higher than their male counter parts on all Cycles of the CalAPA, but also scored lower, on average, than candidates who identified with the label n.a. when selecting their gender category.
Failure rates are only salient after the 2018–2019 academic year, which did not have a minimum passing score. Overall, 97.12% of candidates passed Cycle 1 on their first attempt, 97.35% passed Cycle 2, and 99.23% passed Cycle 3 between 2019–2020 and 2021–2022. Failure rates for first-time submissions across all Cycles tended to be low across all demographic groups. For Cycle 1, with the exception of the 2020–2021 academic year, African American/Black candidates had the highest failure rate among these sub-groups. This trend is also apparent for Cycle 2. Interestingly, for Cycle 3 and with the exception of the 2020–2021 academic year, African American/Black candidates had the lowest failure rate among these racial/ethnic groups. Table 2 provides failure rates amongst first-time submissions for selected racial/ethnic groups, as well as by gender and for the entire sample for each Cycle.
Failure Rates (First Attempt) by Selected Demographic Groups, 2019–2020 through 2021–2022.
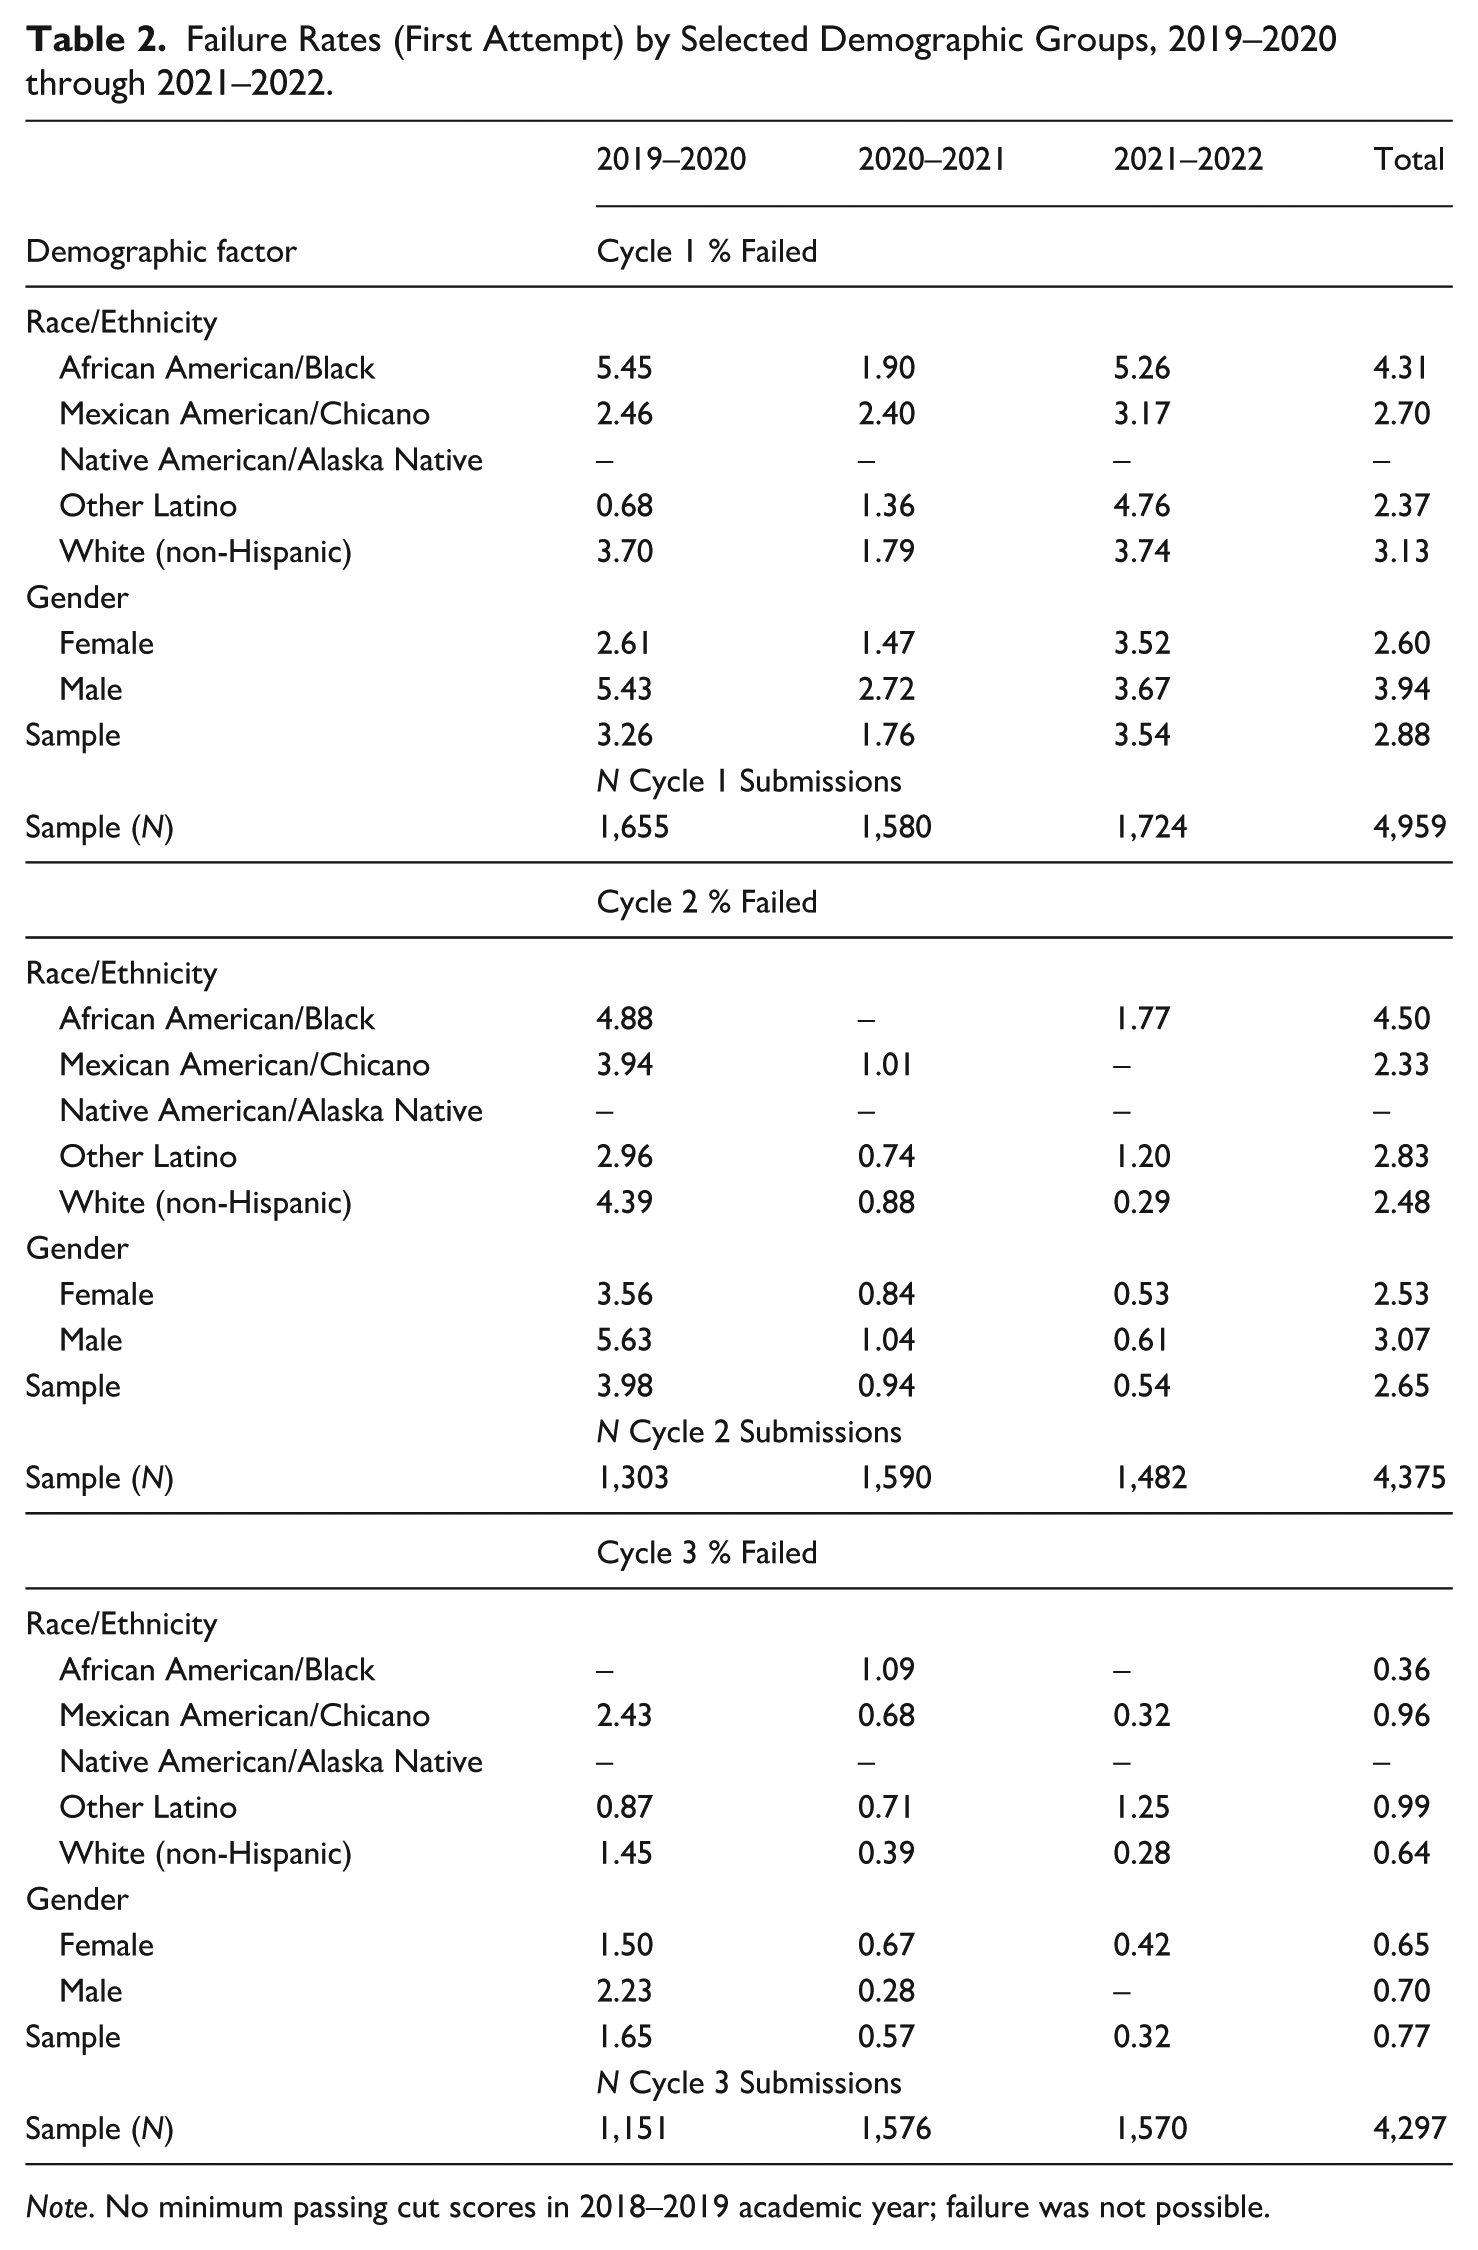
Note. No minimum passing cut scores in 2018–2019 academic year; failure was not possible.
An exploration of the distributions of Cycle Sum Scores over time provides some nuance to the descriptive analysis. Over the first four years of administration and across all three Cycles of the CalAPA, we found a trend toward decreased variation in Cycle Sum Scores, resulting in more leptokurtic distributions with less skewness. For Cycles 1 and 3, the means generally decreased across the four years of implementation, but Cycle 2 mean scores appeared more stable over time.
Associations of Race/Ethnicity and Gender with CalAPA Cycle Sum Scores
To explore potential interaction and main effects, and to detect whether groups differed among combinations of the three Cycle Sum Scores, we first used a multivariate analysis of variance (MANOVA), thus accounting for the relationships among the three Cycle Sum Scores. The six levels of race/ethnicity and two levels of gender were entered as fixed factors. For the inferential analysis, only those students who had submitted all three Cycles in academic years 2018–2019 through 2021–2022 were included (N = 4,724) since cases with missing data on the dependent variables are deleted listwise for the MANOVA procedure. That is, candidates who only completed one or two Cycles in these academic years were omitted from the inferential analysis. Table 3 provides frequency counts of the portion of the sample included in the inferential analysis. Wilks’ lambda (Λ) was used to interpret the proportion of the total variance on each of the variates. Box’s text suggested equal covariance matrices among groups (Box’s M = 79.61, F [66] = 1.25, p = .13). Multivariate normality was checked using Shapiro-Wilks tests for each Cycle Sum Score. Values indicated significant deviations from normality, though the MANOVA is robust with large sample sizes (Field, 2013). Scatterplots of standardized residuals versus fitted values showed residuals were dispersed around zero and no curvilinear patterns were apparent, suggesting the assumption of linearity was tenable. Pearson correlations among Cycle Sum Scores were positive and statistically significant, but weak to moderate in strength (rCycles 1 and 2 = .25, p < 0.01; rCycles 1 and 3 = .0.28, p < 0.01; rCycles 2 and 3 = .31, p < 0.01). According to Tabachnick and Fidell (2012), the MANOVA works “acceptably well with moderately correlated [dependent variables] in either direction … MANOVA also is wasteful when [dependent variables] are not correlated” (p. 268).
Frequency Counts and Descriptive Statistics for the Inferential Procedures.
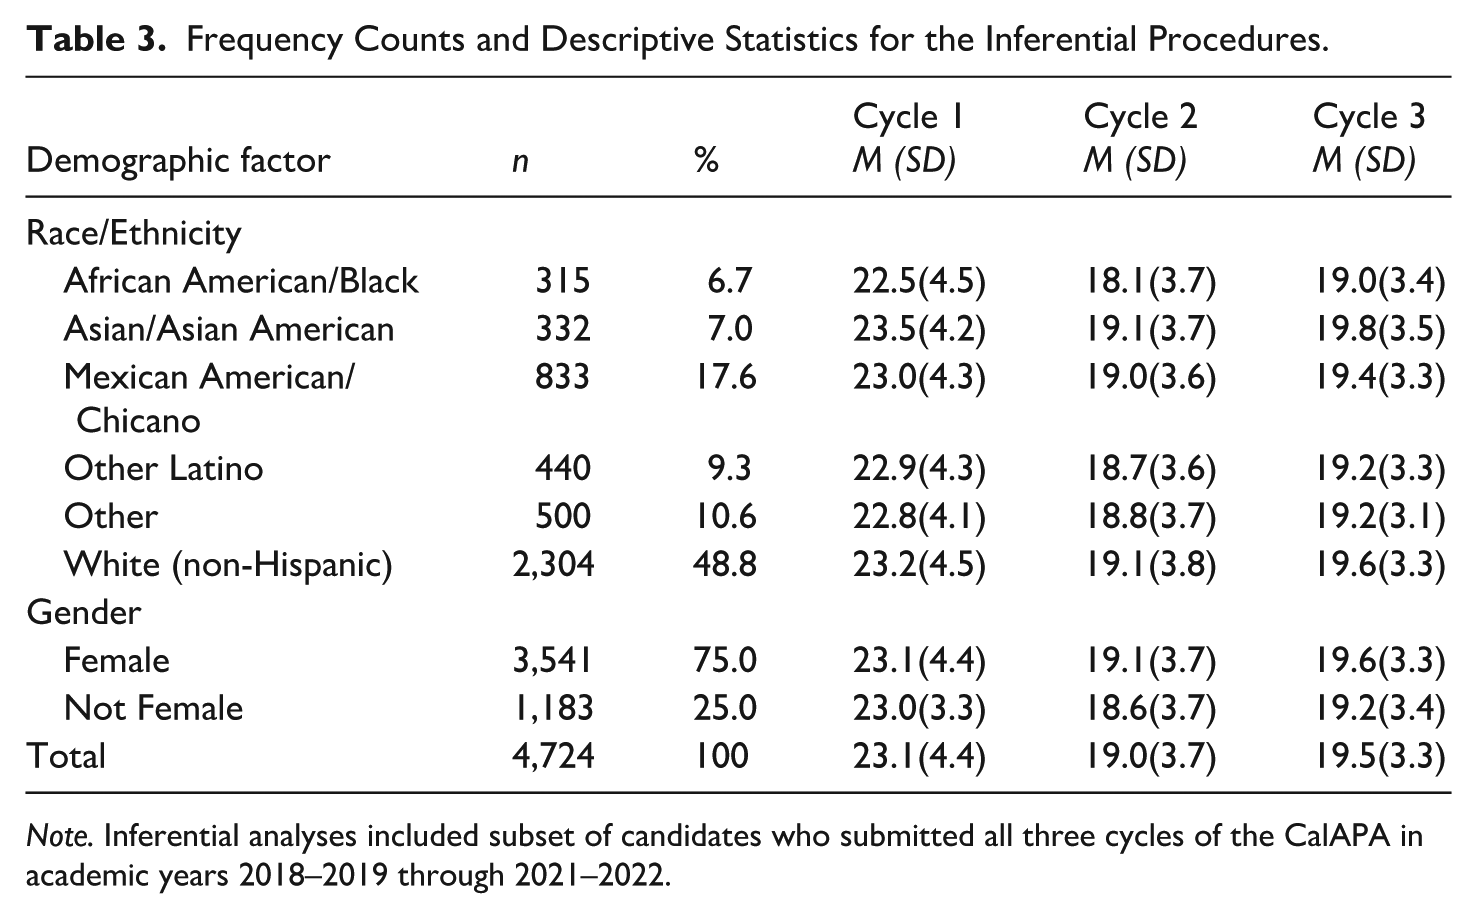
Note. Inferential analyses included subset of candidates who submitted all three cycles of the CalAPA in academic years 2018–2019 through 2021–2022.
The two-way MANOVA (6 x 2) indicated statistically significant main effects for both race/ethnicity (Wilks’ Λ = 0.993, F [3, 13002.64] = 2.27, p = .003) and gender (Wilks’ Λ = 0.997, F [3, 4710] = 4.58, p = .003). However, the interaction effect (race/ethnicity x gender) was not statistically significant (Wilks’ Λ = 0.996, F [15, 13002.64] = 1.11, p = .34). Table 4 displays parameters for the two-way MANOVA. Both race/ethnicity and gender showed significant main effects, but no patterns of interaction between race/ethnicity and gender were detected on the set of Cycle Sum Scores.
Multivariate Analysis of Variance on Cycle Sum Scores for Cycles 1, 2, and 3.
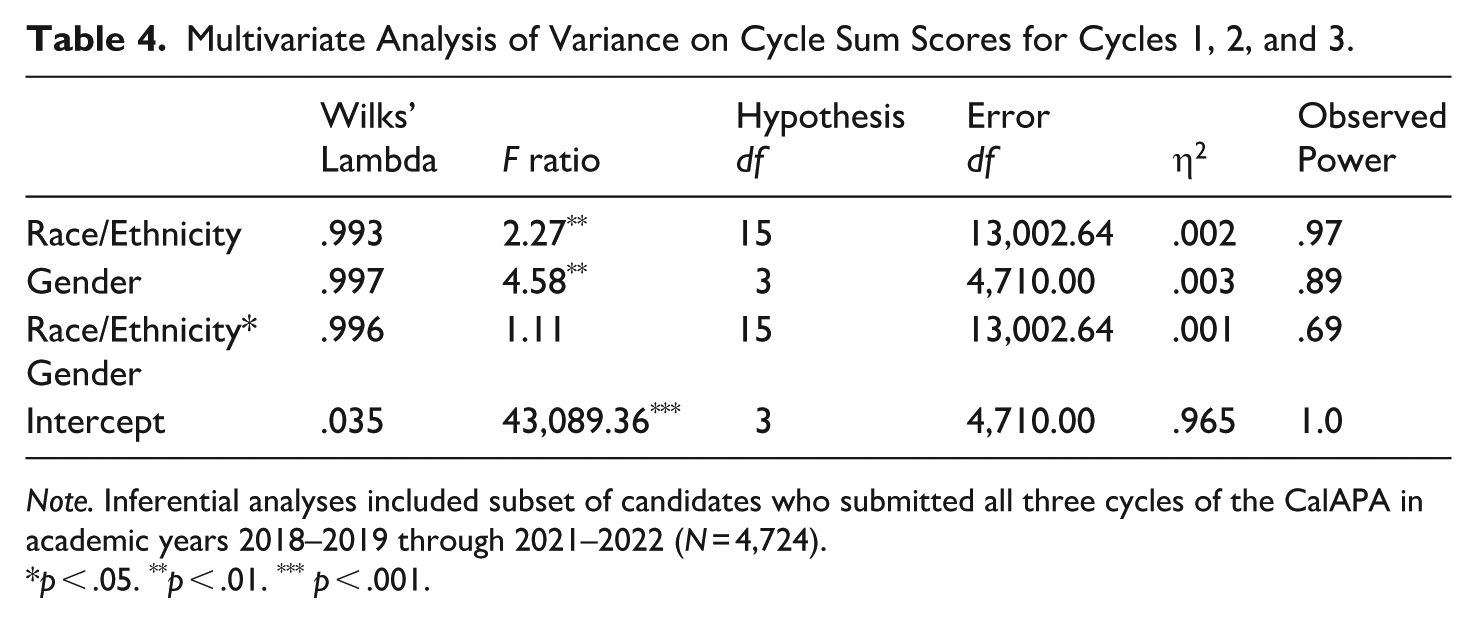
Note. Inferential analyses included subset of candidates who submitted all three cycles of the CalAPA in academic years 2018–2019 through 2021–2022 (N = 4,724).
p < .05. **p < .01. *** p < .001.
For the univariate analysis, values for Levene’s test indicated no statistical significance for any Cycle Sum Scores, indicating the assumption of homogeneity of variance was tenable. Univariate (ANOVA) results are displayed in Table 5. Regarding Cycle 1, race/ethnicity showed no statistically significant main effect (F [5, 4,712] = 1.74, p = .12). However, race/ethnicity showed statistically significant main effects for Cycles 2 (F [5, 4,712] = 3.60, p = .003) and 3 (F [5, 4,712] = 3.70, p = .002). Essentially, race/ethnicity exerted a significant main effect on Sum Scores for Cycles 2 and 3, but not for Cycle 1. These findings are interesting, given that for Cycles 2 and 3 but not for Cycle 1, candidates submit video evidence of themselves, which is evaluated for scoring. Post hoc analysis with Tukey’s honestly significant difference revealed several statistically significant differences amongst racial/ethnic groups operationalized herein.
Univariate Analysis of Variance by Cycle.
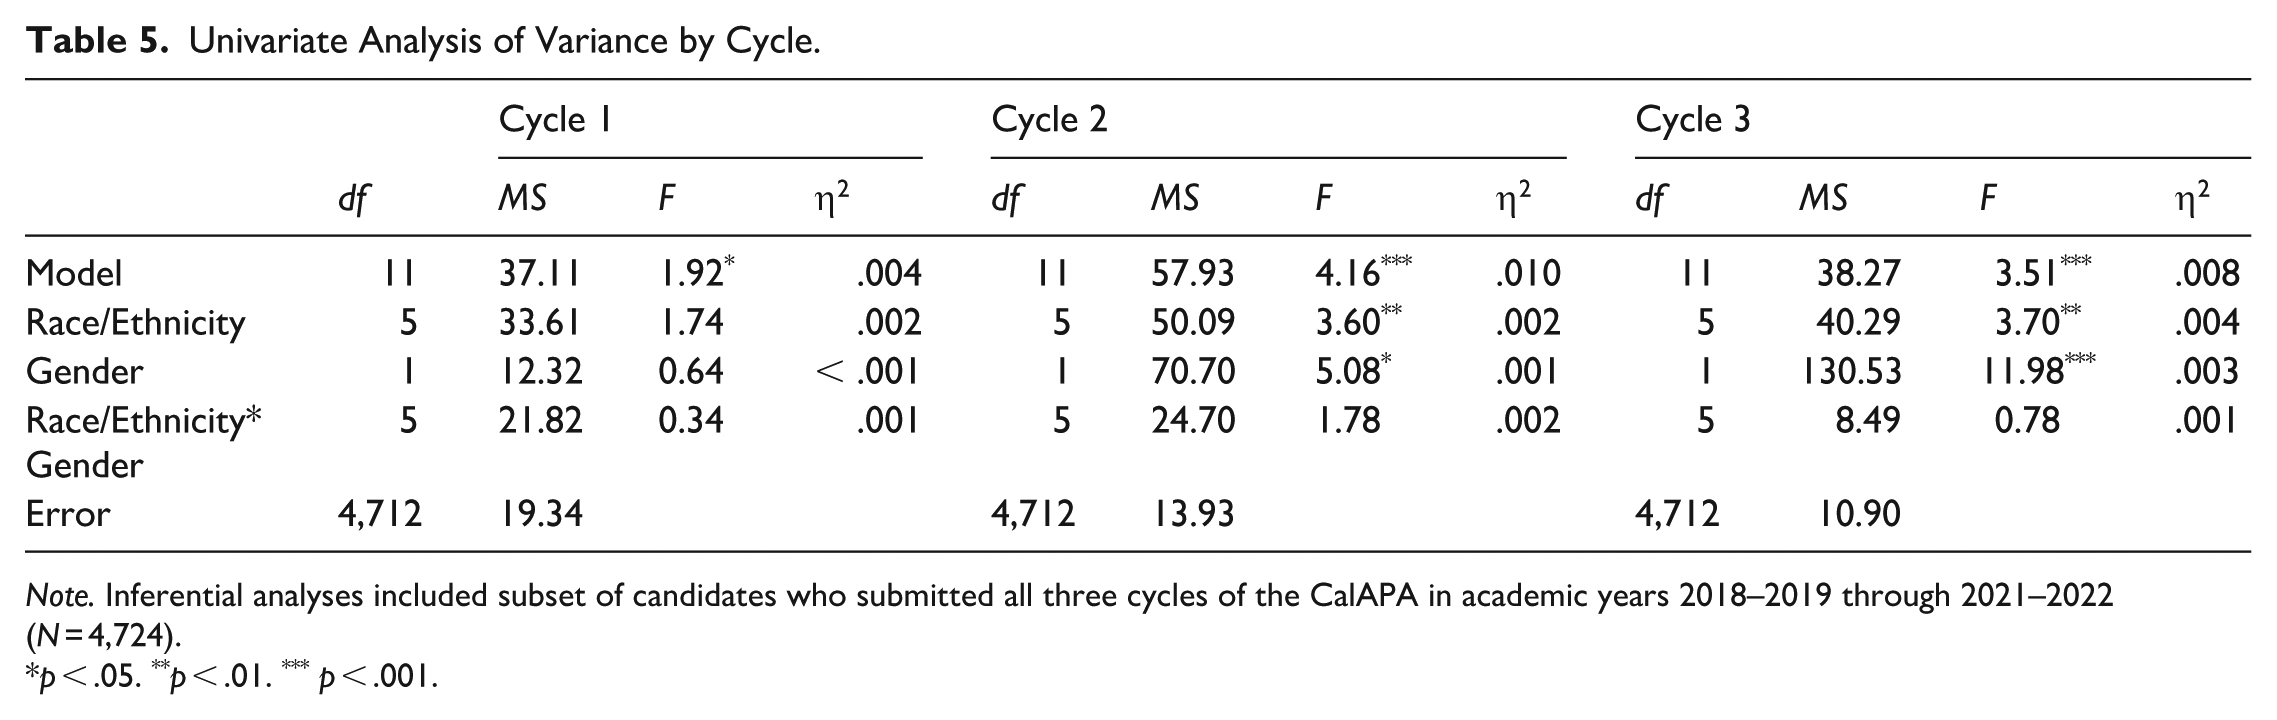
Note. Inferential analyses included subset of candidates who submitted all three cycles of the CalAPA in academic years 2018–2019 through 2021–2022 (N = 4,724).
p < .05. **p < .01. *** p < .001.
In Cycle 2, several statistically significant mean differences in Cycle Sum Scores were identified between racial/ethnic groups. Candidates who self-identified as African American/Black had mean differences for Cycle 2 Sum Scores that were significantly lower than their Asian American/Asian (mean difference = –1.02 points, p = .007), Mexican American/Chicano (mean difference = –0.93 points, p = .002), and White, non-Hispanic (mean difference = –1.03 points, p < .001) peers. In Cycle 3, statistically significant mean differences between racial/ethnic groups were also identified. Candidates who self-identified as African American/Black had mean differences for Cycle 3 that were significantly lower than their Asian American/Asian (mean difference = –0.80 points, p = .025) and White, non-Hispanic (mean difference = –0.60 points, p = .030) peers. Moreover, candidates categorized as Other had mean differences that were significantly lower than Asian American/Asian (mean difference = –0.67 points, p = .047) and White, non-Hispanic (mean difference = –0.47 points, p = .046) peers.
As with race/ethnicity, with respect to gender, the univariate model indicated no statistically significant main effect with Cycle 1 Sum Scores (F [1, 4,712] = 0.64, p = .43). However, similar to the pattern with race/ethnicity, gender also showed statistically significant main effects for Cycles 2 (F [1, 4,712] = 5.08, p = .024) and 3 (F [1, 4,712] = 11.98, p < .001). In general, females tended to receive higher Sum Scores than non-females across all cycles, but differences were statistically significant for Cycles 2 and 3 only.
In summary, race/ethnicity and gender were significantly associated with CalAPA Cycle Sum Scores for Cycles 2 and 3, but not for Cycle 1. More specifically, on Cycles 2 and 3, African American/Black candidates tended to receive lower marks, and females tended to receive higher marks. Though statistically significant effects were found for both Cycles 2 and 3, mean differences revealed greater disparities in Cycle 2 Sum Scores for African American/Black candidates than those observed for Cycle 3. Additionally, F-values indicated disparities between females and non-females were more pronounced in Cycle 3 than in Cycle 2.
Implications Regarding Representation
The principal pipeline in California is apparently more diverse than the principal work force in California, suggesting at least the potential for continued diversification of the principalship in the future. One may argue that failure rates on the CalAPA are low, relative to failure rates reported by authors investigating traditional licensure exams. Nettles et al. (2011) reported first time passing rates on Educational Testing Services’ Pre-Professional Skills Test (i.e., Praxis 1) of Black test takers between 2005 and 2009 were 40% (for reading), 44.2% (for writing), and 36.8% (for mathematics) compared to White test takers: 81.5% for reading, 79.5% for writing, and 78.2% for mathematics. Related to teacher performance assessments (i.e., the CalTPA and edTPA), Patrick (2024) reported that no statistically significant differences in passing rates by race/ethnicity among teacher preparation programs with passing rates above 90%. Patrick (2024) also noted that “disparities were much larger among programs with lower overall passing rates,” yet asserted, “differences in [teacher performance assessment] passing rates are much smaller than previously reported on other licensure exams including the California Basic Educational Skills Test and the California Subject Examinations for Teachers” (p. 14). It is important to remember that diversity in the principal pipeline is largely contingent upon diversity in the teacher workforce, as many aspiring educational leaders are teachers (Hackmann, 2016).
Regarding the principal pipeline more directly, Grissom et al. (2017) reported failure rates on the School Leaders Licensure Assessment were also low, as low as 1.4% in the 2008–2009 academic year, but the failure rate rose to 17% in 2009–2010 following an increase in the passing cut score and a decrease in average values with a new version of the exam implemented in the same year. While failure rates for first-time submissions across all CalAPA Cycles tended to be low across all demographic groups, it is important to recognize that the cut scores implemented for passing the CalAPA in 2019 were lower than the panel of experts recommended for the CalAPA in the initial standard-setting process. 2 It is also important to note that beginning with the 2023–2024 academic year, minimum passing scores were increased for Cycles 1, 2, and 3 to 15, 14, and 14 (respectively). 3 Our analysis suggests that there may be some questions about fairness of the CalAPA, especially for African American/Black candidates relative to their Asian American/Asian and White (non-Hispanic) peers. We not only call attention to the disparities in outcomes present in our sample, but the licensure decisions based on cut scores codified in policy. The American Educational Research Association, American Psychological Association, and National Council for Measurement in Education (2014) remind us that fairness is “the responsibility of those who develop, use, and interpret the results of tests” (p. 49) when decisions, such as licensure decisions, are “based on differences in scores for subgroups of different races, ethnicities, or genders” (p. 31).
Whether or not CalAPA scores are predictive of placement in the principalship remains to be seen, especially given the nascence of CalAPA implementation. Importantly, Grissom et al. (2017) found that School Leaders Licensure Assessment scores were significant predictors of job placement in the principal work force. Furthermore, Orr and Hollingworth (2023) found that cohorts of administrators with higher minimum passing threshold scores on the Massachusetts PAL matriculated into administrative positions at a higher rate than those with lower minimum passing threshold scores. As such, we believe the possibility exists that CalAPA Sum Scores matter beyond licensure decisions—for hiring decisions—which, given our findings, is worrisome when considering racial/ethnic diversity of the principal labor force but also promising when considering gender parity between the principal labor force and the teacher labor force. Nevertheless, considering the disproportional representation of females in the principalship relative to females in the teaching force, we cannot help but to evoke Ladson-Billings and Tate’s (1995) reminder that while females often receive higher marks, they are often not rewarded for these achievements in the labor market.
As policymakers from California and other states will undoubtedly reconsider an increase in the minimum passing standards of recently implemented performance assessments in the future (as Massachusetts has already done multiple times, Orr & Hollingworth, 2023), it is important that these policy makers continue to be mindful of the tension between using a licensure exam to ensure some minimum level of competency for entry into an administrative position with the potential for such exams to unfairly inhibit entry into the field. This is even more important, given the current lack of evidence, or even available data to support claims about CalAPA scores as valid predictors of job placement or performance in the administrator labor market. Nevertheless, three of the four of us are faculty members in a university administrator preparation program, and we agree that the skills of data analysis to inform equitable school improvement, capacity to lead groups of educators, and to coach teachers for instructional improvement are important for any educational leader (broadly defined). We can also attest to the value of authentic learning opportunities made possible using performance assessments with our own teaching and coaching of aspiring educational leaders.
Members of state educator credentialing agencies would be wise to critically examine the ways in which performance assessments may be inhibiting a more equitable representation of candidates in the administrator labor queue. At the very least, greater attention should be given to the ways in which performance assessment design and evaluation may be contributing to the disproportionalities revealed herein. For example, while each “Cycle” of the CalAPA is conceptualized as such, only a single cycle of investigate, plan, act, and reflect is conducted—the three cycles are independent of one another. In other words, each of the three “Cycles” are, in practice, comprised of a set of linear and sequential steps. Such a pattern of logic may be culturally biased (e.g., Jones & Nichols, 2013; Lacko et al., 2024; Nichols, 1986; Nisbett et al., 2001; Varnum et al., 2010). We also recognize unavoidable opportunities for implicit biases of evaluators to creep into decision-making processes during evaluation as Cycles 2 and 3 require video evidence that show the candidates and their participants in the CalAPA. As such, reducing the potential for racial/ethnic bias must remain a priority as the CalAPA remains a requirement for the administrative credential. We call on state educator credentialing bodies and assessment providers (i.e., Pearson and Educational Testing Services) to carefully monitor continuous improvement efforts regarding anti-bias training and calibration for scorers—especially when video evidence is included in evaluation. If disparities persist, then policymakers may reconsider performance assessment design and weighing the benefits of using video evidence against its potential impediment to equity in the principal pipeline.
Limitations and Implications for Future Research
The present analysis provides some initial steps toward understanding the gatekeeping role of the CalAPA as a potential structural barrier in the principal pipeline. Additional research on program-level variation, connecting CalAPA outcomes to job placement and performance outcomes, and qualitative inquiry with candidates of Color are warranted. We acknowledge the seemingly irreconcilable tension between acquiring candidate-level data on race/ethnicity and gender with the identification of candidates’ preparation programs from licensing agencies. Due to low cell-sizes and salient federal guidelines for data sharing, we were unable to procure both race/ethnicity and gender identifiers with preparation programs. This is not an uncommon limitation across the literature base investigating teacher and administrator candidate outcomes (e.g., Hackmann, 2016; Patrick, 2024). In fact, very few peer-reviewed papers published to date include matched data of candidate demographics, administrator preparation programs, licensure exam scores, and principal labor market outcomes (e.g., Grissom et al., 2017; Perrone et al., 2022). As such, we are unable to distinguish between the possibilities of racial/ethnic or gender biases in assessment or evaluation practices and the potential variation in preparation program quality or labor market outcomes on CalAPA outcomes scores. However, we join the calls of other authors (e.g., Perrone et al., 2022) for additional access to data and research on diversity across the principal pipeline.
Importantly, the findings from our analysis only suggest racial/ethnic and gender biases, albeit with statistical significance. We are unable to identify specific sources of potential biases in preparation programs, the CalAPA process, or the process of scoring. Future research might be able to dig deeper into the potential sources of racial/ethnic and gender biases entrenched in the CalAPA or performance assessments more broadly. We suspect that forces such as preparation program quality, participant experiences in the field while they conduct the CalAPA, the structure of the assessment and its rubrics used to evaluate candidate evidence, as well as potential bases (implicit or otherwise) of evaluators, which may be contributing to these apparent disparities in candidate outcomes may prove fruitful objects of future research. We can also make no claims about the validity of the CalAPA to predict job placement or performance of candidates once they matriculate into the administrator labor force. Future research investigating predictive validity of performance assessments for administrative licensure and job placement is an obvious and important implication for future research, as candidates who have completed these nascent performance assessments matriculate into administrative positions. Furthermore, we must acknowledge the COVID-19 pandemic and the potential confounding effects of school closures beginning in March of 2020 and continuing through the 2020–2021 academic year in most California schools. Therefore, we encourage the replication of our analysis to include academic years beyond those included in our sample.
We must also acknowledge the inherent epistemological limitations of our inquiry. We echo the principle of Gillborn et al. (2018) that quantitative data cannot speak for itself. These apparent disparities in CalAPA outcomes should be interrogated by faculty and administrator candidates of Color, whose lived experiences with these relatively protracted performance-based licensure exams may promote critical understandings about how leadership preparation programs may better support candidates of Color and how the assessment itself or the evaluation thereof might be augmented. Importantly, the voices of these faculty and administrator candidates must be heard by policy makers. Furthermore, we call for analyses of other administrator licensure exam outcomes—especially from the nascent performance assessments which appear to be proliferating across states (i.e., Massachusetts, Georgia, Texas, and North Carolina). While some authors have lauded the validity, reliability, and potential for fairness in performance assessments for licensure decisions (Orr and Hollingworth, 2023; Orr, Hollingworth, & Cook, 2018; Orr, Pecheone, Hollingworth et al., 2018; Orr, Pecheone, Snyder et al., 2018; Pecheone & Chung, 2006; Reising et al., 2019), it is important for scholars to identify the reification of racism entrenched in educator and administrator licensure processes. Doing so may reveal further opportunities for deeper, richer inquiry regarding racism in the licensing processes to inform anti-racist policy decisions and support social justice aims.
Conclusion
The preamble to the California Administrator Performance Expectations (California Commission on Teacher Credentialing, 2024) espouses that “educational leaders strive for educational opportunities that are driven by equity and cultural responsive practices” (p. ii). Indeed, Reising et al. (2019) insisted the design and development of the CalAPA was grounded in the “principles and practices that support educational equity, equal access and opportunities for all students, and cultural responsiveness” (p. 101). While we acknowledge and appreciate these assertions, it should be noted that inequities are apparent in the outcomes analysed here. Nevertheless, these findings are consistent with licensure exams across fields (Angrist & Guryan, 2008; Esmail & Roberts, 2013; Wightman, 1998) as well as with studies investigating disparities in outcomes on more traditional educational leadership licensure exams (Grissom et al., 2017). We are not certain that the complete abolition of licensure assessments for educational leaders is warranted. However, the findings of the present analysis demand consideration, reflection, and reaction. Furthermore, we encourage researchers and policy makers to adopt a critical perspective (Gillborn et al., 2018) in the meaning made by these and other statistical analyses and read “racism” whenever disparities in outcomes related to “race” or “ethnicity” are discussed.
Footnotes
Acknowledgements
The authors acknowledge support from the California Commission on Teacher Credentialing for providing access to study data.
Ethical Considerations
The study received approval from the California Committee for the Protection of Human Subjects Institutional Review Board (California Health and Human Service Agencies Federalwide Assurance #00000681) on November 17, 2020. All data were deidentified and data will not be shared with third parties.
Consent to Participate
The requirement for informed consent was waived by the California Committee for the Protection of Human Subjects.
Consent to Publish
Not applicable.
Funding
The authors received no financial support for the research, authorship, and/or publication of this article.
Declaration of Conflicting Interests
The authors declared no potential conflicts of interest with respect to the research, authorship, and/or publication of this article.