
Abstract
Background and aim: African Greater Cane (ACG) rat populations are widely distributed across Africa but the ancestral origin of populations inhabiting different geographical regions is unknown. There is currently no information available on the genetic differentiation of these populations resulting from long-time geographical isolation, environmental and anthropogenic pressures they face in each region. This limits our ability to understand potential speciation processes in AGC and their implications for their conservation and of other small wild mammals exposed to similar ecological conditions in the savannah biomes in Africa. Methods: We analyzed mitochondrial genes targeting the D-loop region of AGC samples from two blocks of the Eastern Arc Mountains in Tanzania (eastern), three agro-ecological zones in Ghana (western) and four sites in South Africa (southern) to characterize the phylogeographical patterns of the species. Results: AGC populations from Tanzania revealed higher haplotype diversity than those from the two other régions. Analysis of variance (AMOVA) revealed higher genetic variations within than between populations in all geographic regions. Demographic history analysis revealed a negative and significant Tajima’s D for a single southern African population as well as close relatedness with the Eastern Africa populations, suggesting a common ancestral origin. Conclusion: This is the first study to compare maternal lineages of AGC populations from eastern, western and southern Africa and provides a basis for future genetic studies of the species, its evolutionary ecology and the conservation of these populations across their range. Conservation implications: Evidence of recent population size expansion underpinned by high genetic diversity observed in the Uluguru urban (Tanzania) Guinea savannah (Ghana) and Kwazulu Natal (South Africa) populations suggest that the AGC populations are not currently threatened, consistent with the current IUCN status. Also, the distinct haplotypes observed in each region suggest that the populations can be managed as meta-populations, thus providing opportunities for potential local game-farming programs.
Keywords
Introduction
The African Greater cane rat, Thryonomys swinderianus, is widely distributed in sub-Saharan Africa with populations in eastern (Tanzania), western (Ghana) and southern African (South Africa) regions, isolated due to topographical, anthropogenic activities and environmental barriers that limit natural dispersal (Collier, 2006). These barriers limit gene flow between these populations, which may lead to genetic divergence among populations (Kilwanila et al., 2021). For example, habitat fragmentation and seasonality have been shown to correlate with genetic diversity in spatially isolated populations of Cape mole-rat, Georychus capensis in South Africa (Visser et al., 2018). Given the long-time separation of the southern, eastern and western African regions (about 543 million years) (Suess, 1885; Sloss, 1963), exposure to different biotic and abiotic conditions over biogeographical time and space may have resulted in significant genetic differentiation among the AGC populations. However, to date, there is a scarcity of information on these populations' demographic history and genetic variation. This knowledge gap limits a broader understanding of the potential speciation process that may exist and is an impediment to the development of management strategies and conservation efforts where the species is considered a pest, or a game species across its range in Africa (Kilwanila et al. 2022). Further, species utilization as wild meat through either hunting or ranching requires a deeper understanding of the conservation efforts required across these regions (Kilwanila et al., 2021).
Mt-DNA has been used to assess haplogroup histories, maternal lineages and the genetic affinities of many vertebrates, including mammals (Guo et al., 2005; Kamalakkannan et al., 2021), birds (Di Lorenzo et al., 2015), reptiles (Candan et al., 2021) and amphibians (Wang et al., 2021). Mt-DNA was deemed valuable for characterizing populations of cane rats occurring in distant localities by considering sequences of the hypervariable D-loop region (Excoffier et al., 1992). The study concluded that long-term isolation and large geographic distances of these populations may have led to greater genetic differentiation (Foll & Gaggiotti, 2006).
The AGC occur throughout most of sub-Saharan Africa in grassland and wooded grassland habitats and prefer feeding on grasses and vegetation along waterways (Adu et al., 2017). Their distribution corresponds to preferences within a greater range of habitats, but specific information on population structure in their natural habitats across Africa is still incomplete (Kilwanila et al., 2021). The presence and predominance of dense thick cane-like grasses such as elephant grass (Pennisetum purpureum) and guinea grass (Panicum maximum) influence the geographical distribution of the species (Kilwanila et al., 2021). Improved understanding of AGC ecology and biology could foster widespread farming and ranching practices of this species. Increasing cane rat meat consumption could presumably reduce illegal poaching of threatened slow-breeding wild large mammals across the savannah biomes in Africa by switching the consumers preference (Rija et al. 2020). Despite separation of AGC populations across Africa, we lack the basic genetic information needed to ascertain current and potential threats and how it can help in broader conservation prospects of other species and the livelihood of local communities depending on it as a food source across Africa and beyond.
In the present study we investigated population structure of the AGC from three geographically distant countries in Africa (South Africa, Tanzania and Ghana), spanning southern, eastern and western regions of the continent. We aimed to use phylogeographic and haplotype distributions to show the current patterns of diversity and differentiation in cane rats in these regions to inform conservation measures if the need arises.
Materials and Methods
Source of Data
Diversity indices and neutrality tests of AGC (Thryonomys swinderianus) population sequences from eastern, western and southern Africa. NS = Not Significant, ** = P ≤ 0.01.

In Tanzania, all the fecal samples were from wild AGC trapped from two mountain blocks (Uluguru and Udzungwa) of the Eastern Arc (Figure 1). Details of the field sampling, DNA extraction, PCR and sequencing have been provided elsewhere (Kilwanila et al., 2022). The genetic sequences (D-loop region) of the AGC from Tanzania were compared with genetic sequences from Western and Southern Africa retrieved from NCBI GenBank: Ghana with accession nos. AB675385 - AB675410) (Adenyo et al., 2013) and South Africa with accession nos. OP121209–OP121231) (Coetzer, W. G., 2023).The sequence data from Tanzania were deposited in the NCBI GeneBank with accession numbers OM475549 - OM475594. The specific localities of data collection in Ghana, Tanzania and South Africa are shown in Figure 1. For Ghana the exact location of the sample collection of each population could not be ascertained as they were collected from local bushmeat markets. Locations of sample collections in Ghana, Tanzania, and South Africa.
Data analysis
Population Genetic Analyses
We edited and aligned the sequences from all three countries using MEGA software version 11 (Tamura et al., 2021). The diversity indices (number of haplotypes - h, haplotype diversity - Hd and nucleotide diversity - π), were calculated using DNASP 6.12.03 (Ramos-Onsins and Rozas, 2002).
Genetic variation within and among AGC populations was estimated using Analysis of Molecular Variance (AMOVA) (Excoffier et al., 1992) and conventional F-statistics were computed from haplotypes with 1000 permutations using Arlequin version 3.5 (Fu,1997; Excoffier & Lischer, 2010). Genetic distances (pairwise FST values) between populations were estimated using MEGA software version 11 (Tamura et al., 2021).
The relationships among haplotypes were estimated by a haplotype network using the minimum spanning method (Iwagami et al., 2010). The evolutionary relationships and probable ancestral connections among haplotypes from Tanzania, Ghana and South Africa were established by constructing a maximum likelihood phylogenetic tree. The best nucleotide substitution model for haplotype alignments was determined using MEGA version 11 (Tamura et al., 2021) before phylogenetic tree construction. The model identified to have the lowest BIC was HKY+G. Fukomys damarensis and Hystrix indica sequences were used as out-groups. Confidence levels were determined using 1,000 replications. A median joining network was also used to determine the evolutionary relationships and probable ancestral connections among haplotypes from Tanzania, Ghana and South Africa. The median-joining network was constructed in NETWORK software version 10.2 (Bandelt et al., 1999).
We used Tajima’s D and Fu's F-statistic implemented in Arlequin version 3.5 (Fu,1997; Excoffier & Lischer, 2010), using p-values generated using 1000 simulations under a model of selective neutrality to test whether there was evidence for past population expansions. A mismatch distribution was estimated using Arlequin software (Version 3.5). The Harpending’s raggedness pairwise distribution of observed and simulated frequencies was used to test the deviation from the sudden expansion model (Harpending, 1994).
Results
The AGC population from Tanzania (East Africa) revealed the highest haplotype diversity (0.900–0.937), followed by the Ghanaian population (West Africa) (0.853–0.978), whereas the South African population (South Africa) had the lowest (0.250–0.970). There were slight differences among regions in nucleotide diversity, from 0.008–0.014 for Ghana (West Africa), to 0.006–0.011 for Tanzania (East Africa) and 0.002–0.011 for South Africa (South Africa) (Table 1).
Within and between population variations of AGC sequences from eastern, southern and western Africa.

In order to infer the demographic history of the AGC populations from eastern, western and southern Africa, we established whether there was any haplotype clustering between AGC sub-populations from the three regions. Figure 2 shows the phylogenetic tree of 60 haplotypes observed from AGC populations from Tanzania, South Africa and Ghana. Haplotypes from the same geographic region tended to cluster together. Maximum Likelihood phylogenetic tree of 51 haplotypes observed from AGC populations from Tanzania, South Africa and Ghana. The percent bootstrap value is represented by the numbers at the node after 1000 replication.
To establish the phylogenetic relationships of the AGC we determined the genetic relatedness between populations from the three geographic regions. The haplotype network revealed that no haplotypes were shared between geographical regions (Figure 3). The haplotypes divided into three main haplogroups, each one representing a geographical region (western, southern and eastern Africa), but for Tanzania (East Africa) the group could further be divided into three main clades (clade A, B and C) and two clades (D and E) for Ghana (West Africa), while the population from South Africa revealed no structuring (Figure 3). The haplotype distribution of the Tanzanian AGC populations was 16.00%, 60.00%, and 24.00% for clades A, B and C, respectively. The most dominant clade amongst all AGC populations from Tanzania was B which consisted of 33.33 % haplotypes specific to the Udzungwa North population, 33.337% haplotypes specific to the Uluguru rural population, and 33.33% haplotypes specific to the Uluguru urban population. Clade C was the second largest haplogroup consisting of a majority (66.67%) of the haplotypes specific to the Uluguru urban population, the remaining 33.33% of the haplotypes were specific to the Uluguru rural population. Clade A was the smallest haplogroup consisting of 100% haplotypes specific to the Udzungwa South population. The most dominant clade in the Ghanaian population was Clade D, which is a complex consisting of haplotypes from all three zones. It consisted of guinea savannah-specific haplotypes (30.76%), forest zone-specific haplotypes (11.54%), a coastal zone-specific haplotype (3.85%), a haplotype shared between forest and coastal savannah zones (3.85%), and haplotypes common to all three populations (15.39%). The second haplogroup in the Ghana population was Clade E which was less complex consisting of coastal savannah zone-specific haplotypes (15.39%), guinea savannah zone-specific haplotypes (3.85%) and haplotypes shared between guinea savannah and coastal savannah (7.69%). The haplotype network of the South African populations revealed that KwaZulu-Natal had six unique haplotypes (66.67%), while the Free State had only one unique haplotype (11.11%). Also, the network revealed that all South African populations shared one common haplotype (11.11%), while KwaZulu-Natal and Eastern Cape shared one common haplotype (11.11%). Median joining network of three AGC populations from western Africa (Ghana), eastern Africa (Tanzania) and southern Africa (South Africa) (A branch represents a single nucleotide change; red dots on branches represent inferred missing haplotypes (single nucleotide changes). Description of acronyms for haplotypes (Figure 3). Tanzania: ULU: Uluguru urban, ULR: Uluguru rural, UDZS: Udzungwa South, UDZN: Udzungwa North; Ghana: GS98, GC01 and GC94: coastal savannah zone, GD 86: shared between Guinea savannah and forest zone, GS06, GS05, GS08, GS04, GS02, GS03 and GS10: Guinea savannah specific, GF90, GF91, GF88: forest zone specific, GB87: shared between coastal and forest zone and GA89: common to all zones, GS99: shared between guinea and coastal savannah; Eastern Cape: AM04EC, Free State: BM06FS, KwaZulu-Natal: TM04KZ, TM05KZ, DM01KZ, DM02KZ, DM03KZ and DM05KZ; and Gauteng: TM08GP.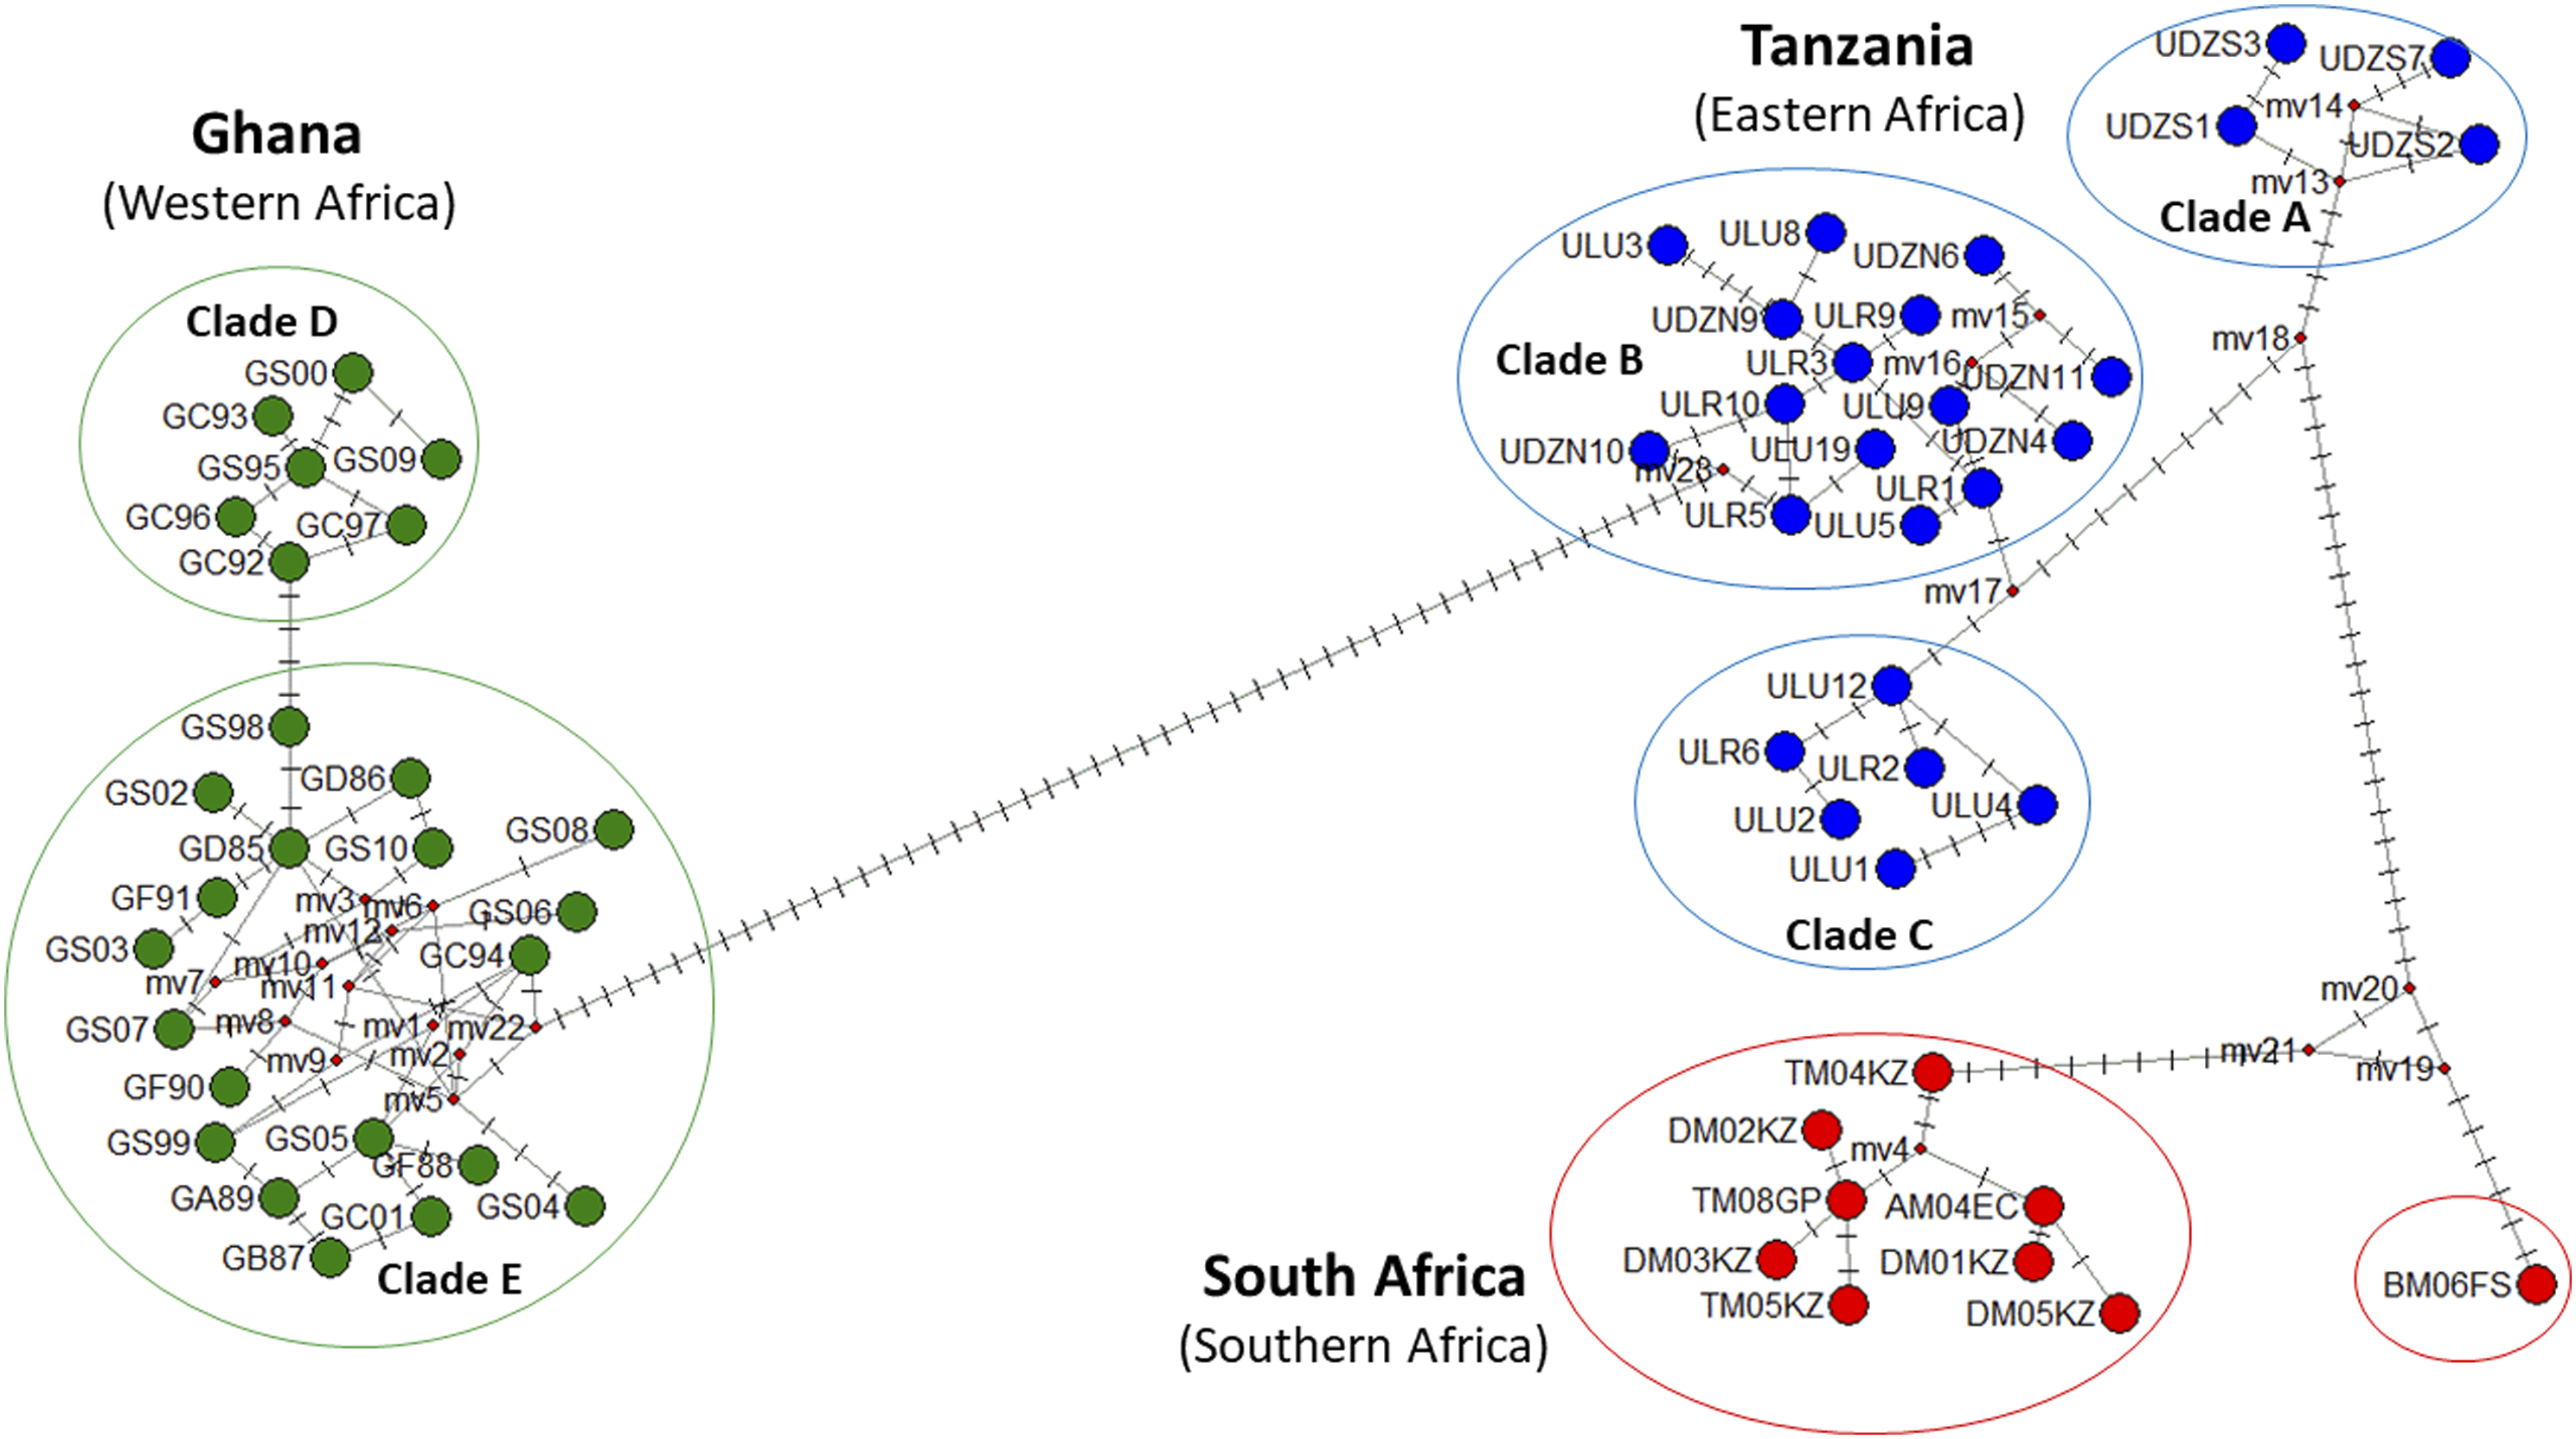
Tajima’s D values calculated for both eastern and western Africa AGC populations were not significant, while for Southern Africa, the Free State population revealed a negative and significant Tajima’s D value -1.832 (p = 0.001). In Tanzania, only the Uluguru urban population had a significant negative Fu’s Fs value -2.867 (p = 0.033)). The Guinea savannah population from Ghana had a significant negative Fu’s Fs values -7.134 (p = 0.002). The Free State population from South Africa had a significant positive Fu’s Fs value 6.673 (p = 0.016)), while the Kwazulu-Natal population had a significant negative Fu’s Fs value -4.479 (p = 0.010) (Table 1). A mismatch distribution analysis of eastern, western and South African AGC populations revealed ragged-mismatch plots (Figure S1), thus indicating the populations are in equilibrium.
Discussion
This study examined the genetic variability of African Greater Cane Rat, Thryonomys swinerianus, populations from parts of western, eastern and southern Africa by analysing the mitochondrial D-loop. This is the first time that the mt-DNA D-loop sequences of AGC have been used to establish maternal lineages of the geographically isolated populations. The distributions of genetic variation observed among regions suggest a recent population expansion in the eastern and southern African regions and also implies a western African origin of this species followed by expansion east and south.
However, the relationships among populations from the different regions suggest that the Tanzania and South African populations share a much more recent history than the western African populations. We also observed a high haplotype diversity in eastern and western African AGC populations and relatively low diversity of the southern African populations, but was presumably due to small sample sizes. It can be inferred that the high diversity and lack of shared haplotypes among regions may be due to long periods of isolation of these separate regions, coupled with large population sizes (Kraatz, et al., 2013; Coetzer, 2013). After excluding the southern African AGC populations due to small sample size, we observed that the western African populations had low nucleotide diversity compared to those in eastern Africa. The low nucleotide diversity of AGC populations indicates small differences between haplotypes which suggests that the genetic diversity of the AGC in west Africa has declined. This may be attributed to a long domestication history in Ghana which is associated with artificial inbreeding probably as the result of small base populations that are highly susceptible to inbreeding and genetic drift (Guerier et al., 2012). This is in contrast with the eastern African AGC populations which are essentially wild, with no history of domestication. Domestication has been reported to reduce diversity in both flora and fauna (Liu et al., 2019). Further, inbreeding reduces fitness, increasing susceptibility to diseases and accelerating loss of genetic diversity (Smallbone et al., 2016). Furthermore, defaunation caused by overhunting for bushmeat trade in most west African countries including Ghana (Benítez-López et al., 2019) is known to have reduced species diversity and consequently the genetic diversity of mammals (Körner et al., 2017). Low genetic diversity coupled with inbreeding depression is expected to affect many fitness-related traits including both survival and reproduction success (Smallbone et al., 2016). The network analysis indicated a significant and strong geographical structure, with very high level of sequence divergence. Every sampling locality appears to be a unique genetic entity since the results clearly show that no haplotypes were shared between western, eastern and southern Africa AGC populations. The geographical structure for all populations was more visible when they were compared across geographical regions. These results clearly mirror those from the diversity indices and AMOVA which show high within-population variance in all populations. The strong genetic differentiation points to a very low historical gene flow between the regions. Similar results were observed in Cape mole rats in South Africa (Visser et al., 2018). Other related observations were made on two geographically isolated populations of Saxicolous Mice (Phyllotis xanthopygus) in Patagonia (Chile), in which phylogenetic analysis of mt-DNA provided evidence of lack of gene flow between them (Kim et al., 1998). The strength of genetic structure relates to geographical distance and genetic distance (Foll & Gaggiotti, 2006). The geographical distance between Ghana and Tanzania is approximately 3000 km, and the distance between Ghana and South Africa is approximately 5000 km. Further, The pairwise FST values among the three groups was high which also conforms with the genetic differentiation index results. Wright (1951) reported that the degree of differentiation would be high if the Fst was >0.25. The AGC populations in this study met this criterion suggesting that the long history of spatial isolation between them has affected their genetic makeup. It is possible that the observed genetic difference results from a lack of female-mediated gene-flow between regions (Tserenbataa, et al., 2004). Although we did not analyse social grouping and structuring and its impact on the within-population paternity in our study, evidence from other social mammals such as lions, etc. (Lyke et al. 2013) suggests that within-population genetic diversity is driven by extra-group mating by males that is essential for ensuring population genetic viability. Future research work on AGC should explore social grouping at a metapopulation level, and whether extra-group paternity exists in this elusive species. This will be useful particularly for improving potential game-farming programs when this species is bred ex situ for commercial purposes.
Further, the median joining network revealed that the populations from Ghana have little divergence and share the most common haplotypes between the three agro-ecological zones. Less-divergent haplotypes within animals and geographical locations suggest that gene flow has occurred on a regional scale during the recent past and the animals have not been subdivided by long-term biogeographic barriers (Simon et al., 2022). The AGC populations from Tanzania on the other hand were more structured with some haplotypes unique to a single population (Udzungwa South) while other haplotypes were shared between populations (Udzungwa North, Uluguru urban and Uluguru rural), indicating low genetic exchange among the Udzungwa South, Udzungwa North, and Uluguru urban and rural populations. The South African regions revealed no clear geographic structuring, indicating that there was gene flow between these populations and hence less divergence. The high gene flow among South African AGC populations (which span region that is less topographically heterogeneous than the other two) may be due to the fact that they can cross different habitats including those which are terrestrial and aquatic (Kilwanila et al., 2021).
The analyses of demographic history suggested a recent population expansion for a single AGC population in each of the three regions. We found a negative and significant Tajima’s D only for the Free State (South African population). This signifies an excess of low frequency polymorphisms, which was not expected; which could indicate population size expansion (e.g. after a bottleneck or a selective sweep).
The long history of spatial isolation of the three regions may have been caused by intense agricultural activities, which led to new adaptations by the AGC in these human modified habitats (Babarinde et al. 2023). On the other hand the mismatch analysis revealed multimodal and ragged shapes for all three geographical regions. The multimodal mismatch observed in the eastern and southern Africa regions may be attributed to stable and structured populations. Also, the bimodality of the mismatch distributions observed in our study could be interpreted as a result of the presence of different haplogroups (as seen in the haplotype network), rather than demographic stability.
Implications for conservation of wild mammals across the savannah biomes
Our study has revealed strong genetic differentiation among eastern, western and southern African AGC populations and a unique maternal origin of each region. The high genetic diversity and the negative and significant Fus Fs values in some of the AGC populations from the three geographical regions, and the ragged mismatch distributions are suggestive of a healthy population status, concurring with the current IUCN status of least concern for this species. However, the phylogenetic tree and median joining network revealed that there were no shared haplotypes among these three regions. This suggests that these populations need to be conserved since any potential threat leading to the loss of haplotypes in any of the regions could result into disappearance of such haplotypes across Africa.
Also, the AGC populations revealed distinct phylogenies but with shared lineages indicating that the species has undergone different historical processes that have influenced its evolution in its current distribution in western, eastern and southern Africa. Lineage diversification has been observed in other species of vertebrates attributed to long term separation and environmental factors (Guliyeva, et al., 2016; Iwagami et al., 2010). The phylogeographical patterns AGC in Africa and the phylogenetic relationships of populations in western, eastern and southern Africa are important elements for conservation of the species. The preservation of the genetic diversity of AGC in the African continent should be a major focus of conservation efforts as it applies to many other species (Byrne, 2003). AGC populations from Tanzania were richer in diversity than the southern and western Africa populations. This finding could be useful in improving the in situ populations through some forms of introductions to augment the gene pools of the western and southern Africa AGC populations. Also, a similar approach could be used to benefit any game-farming program through cross breeding of the eastern Africa stock with either Ghanaian or southern African stocks to improve the genetic diversity of the species and enhance their economic value. This information is important in informing the conservation strategies aimed at protecting the genetic diversity of the species across the regions. This will ensure the genetic diversity is preserved, and that local adaptations to specific environments are well considered.
Supplemental Material
Supplemental Material - Phylogeographic Patterns of the Greater Cane Rat (Thryonomys Swinderianus) Populations from Eastern, Western and Southern Africa and Implications for Wildlife Conservation
Supplemental Material for Phylogeographic Patterns of the Greater Cane Rat (Thryonomys Swinderianus) Populations from Eastern, Western and Southern Africa and Implications for Wildlife Conservation by Shadia I. Kilwanila, Charles M. Lyimo, Alfan A. Rija, and Rhodes H. Makundi in Tropical Conservation Science
Footnotes
Acknowledgments
We wish to acknowledge the financial support from the Africa Centre of Excellence for Innovative Rodent Pest Management and Biosensor Technology Development (Grant no. 5799-TZ) for the PhD Scholarship offered to Shadia Ibrahim Kilwanila. A specimen collection in the field was assisted by Mr Ismail Issa and is cordially thanked.
Author Contribution
All authors contributed to the study conception and design. SIK collected data, performed laboratory and statistical analysis and with RHM prepared the first and final drafts of the manuscript. CML performed formal analysis, validation and reviewed the manuscript. AAR supervised data collection and reviewed the first manuscript draft. All authors commented on subsequent versions of the manuscript. SIK and RHM revised the final draft after reviewer’s comments.
Declaration of Conflicting Interests
The author(s) declared no potential conflicts of interest with respect to the research, authorship, and/or publication of this article.
Funding
The author(s) disclosed receipt of the following financial support for the research, authorship, and/or publication of this article: This study was funded by the Eastern and Southern Africa Higher Education Centers of Excellence Project—ACEII (Africa Centre of Excellence for Innovative Rodent Pest Management and Biosensor Technology Development—Sokoine University of Agriculture)—Credit no. 5799-TZ.
Permits
The Tanzania Wildlife Research Institute (TAWIRI) and Tanzania Commission for Science and Technology (COSTECH) provided a research permit number 2020-247-NA-2020-158 to conduct this study.
Ethical Statement
Data Availability Statement
All sequences used in this study are in NCBI gene bank and are available for public use with accession numbers Tanzanian sequences OM475549 - OM475594, Ghanaian sequences AB675385 - AB675410 and South African sequences OP121209–OP121231.
Supplemental Material
Supplemental material for this article is available online.
References
Supplementary Material
Please find the following supplemental material available below.
For Open Access articles published under a Creative Commons License, all supplemental material carries the same license as the article it is associated with.
For non-Open Access articles published, all supplemental material carries a non-exclusive license, and permission requests for re-use of supplemental material or any part of supplemental material shall be sent directly to the copyright owner as specified in the copyright notice associated with the article.