
Abstract
Plantation of Eucalyptus and Acacia species emerges as a promising alternative in the tropics in a scenario of high demand for provisional and regulating ecosystem services. The research aimed to characterize the spatiotemporal dynamics of ecosystem service values in response to planting practices of Eucalyptus and Acacia species in the Gilgel Abay watershed, Northwest Ethiopia. The threshold values of NDVI were employed to classify land-use/covers using cloud-free satellite imagery data in 1984, 1998, 2013, and 2021. The benefit transfer method of modified value coefficient was used to estimate ecosystem service values (ESVs) of the study watershed. Total ESV decreased from 1984 to 1998 due to the expansion of cultivated land at the expense of natural forests, shrubs, and grasslands. As food production increased, performance levels of climate regulation, erosion control, and nutrient cycle declined. In contrast, the service values of erosion control, climate regulation, and nutrient cycles were the major contributors to the overall increase in ESV from 1998 to 2021. This was caused by expanding Acacia and Eucalyptus species plantation at the expense of cultivated land in the watershed. The research revealed a trade-off relationship between provisional and other ecosystem services, such as regulating and supporting ecosystem service values in response to land-use system transformation. As a result, it is suggested that synergistic interactions between regulating, provisional, and supporting ecosystem service values be developed by merging plantation and cultivated land. Maintaining the right proportions of degraded plantations, protected natural forests, farmlands, and wetland ecosystems can be the most effective way to provide optimal multiple ecosystem services.
Keywords
Introduction
Biodiversity and associated declines in ecosystem function can have significant implications for the tropical sustainable development agenda (Dickens et al., 2020). Ecosystem services are the benefits that people receive from ecosystems for survival, livelihood, and well-being (Costanza et al., 2017). Provisional, regulatory, and cultural services have a direct impact on human well-being in the short term, and supportive services have an indirect impact on human well-being in the long term by maintaining the production of other services (Costanza et al., 2014; TEEB, 2018). The immense contribution of ecosystem services to natural functions and sustainable livelihoods has been significantly reduced in time and space by anthropogenic activities that promote land-use/cover changes (Costanza et al., 2017; Sutton et al., 2016).
In Ethiopia, rapid population growth and rising food demand have led to significant expansion of cultivated land at the expense of natural vegetation ecosystems (Gashaw et al., 2018; Haregeweyn et al., 2015). The continuous degradation of land and associated ecosystem services are severe problems in the highlands of Ethiopia. The degradation is caused by the intermingled factors of population pressure, inappropriate farming practice, agricultural expansion, cutting of live woody plants for fuelwood and charcoal production, topography, and overgrazing (Angessa et al.,2019; Gashaw et al., 2014; Kindu et al.,2013; Yalew et al., 2016). Land degradation results in diverse onsite effects on regulating ecosystem services, such as a decline in soil quality, reduction in available water capacity and nutrient reserves, biodiversity deterioration, and depletion of ecosystem carbon pool (Gashaw et al., 2014; Lal, 2014; Wassie, 2020).
Land-use/cover dynamics are a major component of land degradation, which affects overall ecosystem services. This is a key factor behind accelerated soil loss, increased sediment yields, and reduced protection against erosion (Woldemariam and Harka, 2020). In connection with changes in land-use/covering processes, the study estimates land loss rates in watersheds and catchments. For example, in the Erer Basin in northeastern Ethiopia, the main soil loss rate increased from 75.85t ha-1yr-1 in 2000 to 107.07t ha-1yr-1 in 2018, mainly due to the expansion of bare and cultivated land at the expense of natural vegetation cover (Woldemariam and Harka, 2020). The highest soil loss rates of 110t ha-1yr-1 and 102t ha-1yr-1 were observed in the degraded areas of the Angeni and Chemoga watersheds in the upper Blue Nile River, respectively (Haregeweyn et al., 2015). In the Yazat watershed in northwestern Ethiopia, the estimated annual soil loss increased by 0.5t ha-1yr-1 and decreased by 2.9t ha-1yr-1, respectively, due to the decrease and increase in vegetation cover (Tadesse et al., 2017). In the Gilgel Abay watershed, annual soil erosion rates range from 5t ha-1yr-1 in the plantation field to 50t ha-1yr-1 on the steep slopes of cultivated land, providing mainly nutrient-bearing sediments to Lake Tana (Gashaw et al., 2020). The authors further reported that planting in acreages above 15% acreage could reduce total soil loss by 65% compared to extensive management of acreage. The overall increase in the value of ecosystem services due to the expansion of cultivated land was so small that it was possible to offset the overall loss of value of ecosystem services from water bodies and vegetation areas (Nigussie et al., 2021). Decreased organic matter input to arable land results in the lowest organic carbon stores in soil, negatively impacting climate control performance, crop yields, and food security (Amanuel et al., 2018). Loss of soil and biodiversity in certain ecosystems further impacts land productivity and the livelihoods of smallholders (Wassie, 2020).
In humid and sub-humid highlands with high rainfall (average rainfall of 1700 mm1 per year), where Nitisol predominates, nutrient leaching and associated soil acidity are major problems for agricultural land productivity (Amare et al., 2022). Decreased yields from cultivated fields and climate variability are affecting farmers' interest in planting Acacia and Eucalyptus seeds on their farmlands (Nigussie et al., 2021; Yalew et al., 2016). Charcoal production, firewood sources, improved soil fertility, reduced runoff, and high cash income from employment sources be the main motivations for expanding acacia and eucalyptus plantations (Amare et. al., 2022; Chanie and Abewa, 2021; Nigussie et al., 2021). Planting Acacia decurrens is the most preferred way to improve soil fertility in acidified soils by converting acidic farms into productive farms (Tamirat & Wondimu, 2019; Nigussie et al., 2021). After establishing the Acacia decurrens plantation, cover cropping is done between the shrubs until the top of the tree closes. Demand for construction materials in the region and international markets is also increasing through cross-border trade in Ethio-Sudan, allowing Eucalyptus plantations to be expanded at the expense of crop production (Tefera and Kassa, 2017). The canopy of the Eucalyptus camaldulensis tree is used to produce charcoal for sale and firewood.
However, the loss of cultivable land and rangelands in plantations raises food prices by switching from annual crops to perennial crops, reducing livestock numbers, and increasing inequality (Nigussie et al., 2021). The cost of nutritious foods can make a healthy diet affordable (FAO et al., 2021). The expansion of plantations has also led to a shift from a socially and economically balanced lease-based system to a sharecropping system, which is a disadvantage for landless farmers who rely on leasehold or sharecropping systems (Nigussie et al., 2021). Managing changes in ecosystem processes that support regulatory services to address these issues can bring additional benefits to provisional, processing, and cultural services (Smith et al., 2013).
When assessing plantations as sustainable land-use, it is important to consider how this type of land-use change affects a variety of environmental goods and services. Plantations are most likely to contribute to biodiversity when established in devastated lands, rather than replacing natural ecosystems such as forests, grasslands, and shrubs (Bremer & Farley, 2010). Establishing a mosaic of tree age and species has been proposed as it can improve the biodiversity of the landscape (Chazdon, 2008; Brockerhoff et al., 2013). Afforestation is recommended in areas where agriculture is limited or where synergies between agricultural production and afforestation can be achieved (Bremer & Farley, 2010; Chazdon, 2008; Paudyal et al., 2020). A mixed plantation of Eucalyptus, Acacia, and a high diversity of native tree species is technically feasible and represents an important alternative for landscape restoration (Amazonas et al., 2018).
Restoring devastated land on steep slopes through mixed plantations maintains soil and ecosystem carbon storage, reduces soil erosion, improves soil quality, improves net primary productivity, and provides more ecosystem services will be provided (Amanuel et al., 2018; Lal, 2014; Paudyal et al., 2020; Zhang et al., 2020). About 50% of Eucalyptus camaldulensis and 50% of Acacia decurrens plantations reported having higher total soil nitrogen, organic carbon, and organic matter (Bekele et al., 2021). In addition, acacia plantations and annual charcoal rotations with edible crops are the best innovative practice for synergies between soil fertility, carbon stocks, crop yields, cash income, and food costs (Chanie and Abewa, 2021; Nigussie et al., 2021).
An assessment of ecosystem services can provide a better understanding of human dependence on a well-functioning and healthy ecosystem (Hu et al., 2019). It can play a compelling role in making informed decisions for sustainable ecosystem-based management. Quantifying the value of current and future ecosystem services is important for designing support policies, socio-economic development, and sustainable interventions that can improve ecosystem services in the Gilgel Abay watershed (Gashaw et al., 2020). Studies have shown that the value of ecosystem services has steadily declined over the past three decades as cultivated and barren land expands at the expense of forests, shrubs, grasslands, and waters (Kindu et al., 2013; Gashaw et al., 2018; Godebo et al., 2018; Nigussie et al., 2021; Solomon et al., 2019). However, expanding Acacia and Eucalyptus seed planting at the expense of arable land can impact the value of ecosystem services and has received limited attention. Small-scale planting of Acacia and Eucalyptus species in the tropics has emerged as a promising alternative in scenarios of high demand for firewood, monetary income purposes, and regulatory services (Amazonas et al., 2018). Rather, the integration of eucalyptus and acacia plantations and arable land is a synergistic relationship between the values of multiple ecosystem services. This study aims to characterize the spatiotemporal dynamics of the value of ecosystem services in response to Acacia and Eucalyptus planting practices in the Gilgel Abay watershed in northwestern Ethiopia.
Methods and Materials
Location of the Watershed
The Gilgel Abay watershed lies between latitude 10° 56'30.238 "N_11° 48'52.052" N and longitude 36° 44'11.172 "E_37 ° 23'28.483" E (Figure 1). The watershed is on a plateau in the northwestern part of Ethiopia. It is found in the Lake Tana sub-basin, which is the headwater of the upper Blue Nile basin of Ethiopia. The watershed includes administrative parts of the Sekela, Mecha, BanjaShekudad, FagitaLekoma, Dangila, South Achefer, North Achefer, and Bahir Dar Zuriya districts (Figure 1). Map of the study watershed.
Geological Characteristics and Landform
The geological characteristic of the watershed is categorized by the tarp series volcanic rock formed during the Cenozoic Era (Billi, 2015). During the Pleistocene epoch, a series of lavas erupted from fissures volcanoes and formed a volcanic barrier to the Gilgel Abay watershed (Poppe et al., 2013). The major landforms in the selected watershed are characterized as gently sloping and slightly dissected undulating surfaces, river gorges, hills, and ranges of Choke Mountain. Gilgel Abay is the largest river that contributes the largest proportion of the inflow to Lake Tana from the south escarpment of the Lake Tana sub-basin (Alemu & Melesse, 2020; Poppe et al., 2013). Steep slope topography, shallow soils, low rock fragment cover, and expansion of cultivated land increase the drainage ratios due to high surface runoff, low soil moisture content, and a small share of evapotranspiration (Lemma et al., 2019). Gilgel Abay watershed is one of the heavily degraded watersheds that contributed to the sediment runoff due to the influx of nutrients into Lake Tana (Bogale, 2020; Gashaw et al., 2020).
Agroecological Zones and Climate Conditions
The Gilgel Abay watershed is located in the temperate and sub-tropics corresponding to the traditionally named Dega and Woinadega Agroecological Zones. Under these agroecological zones, the climate is generally sub-humid in the lower and humid in the middle and upper parts of the watershed (Hurni, 2015). Due to seasonal fluctuations in the Intertropical Convergence Zone (ITCZ), there is a dry season from October to May and a rainy season from June to September. More than three-quarters of precipitation falls from June to September. The spatial pattern of precipitation in the basin varies depending on the elevation difference and ranges from 1695 m to 3543 m (Figure 1).
Land-Use/Coverage and Management Systems
Agricultural land and settlements, pastures, forests, forests, shrubs, and wetlands are the major land-use/coverage of the watershed. Cultivated land is the major land-use type that contributes to soil erosion in the watershed compared to other land-use/cover (Bogale, 2020). This land-use is projected to grow to 77.5% of the basin by 2025 (Yalew et al., 2016). Forest cover consists of natural forests and plantation forests. Plantations are one of the intensive land-use practices in the watershed and are expected to grow at a faster rate at the expense of natural vegetation, cultivated land, and grassland (Yalew et al., 2016).
Plantations of Acacia and Eucalyptus species are the common practices in the highlands of Ethiopia. Eucalyptus species were introduced from Australia to Ethiopia in 1894/1895 and were the largest plantation at the time (Billi, 2015). These two exotic species are largely planted in the middle and upper part of the watershed. Eucalyptus camaldulensis is mainly produced for cash income, charcoal production, construction materials, and fuelwood purposes. The sole plantation of Eucalyptus camaldulensis is practiced largely in the middle part of the watershed, including the lower part of the Mecha district, and the upper part of the south Achefer district. In the area between the towns of Duribete and Dangila, mixed plantations of Eucalyptus camaldulensis and Acacia decurrens are widely observed.
Acacia decurrens is a major plantation in high rainfall areas, including the humid climate of the Fagitalekoma and Dangila districts for cash income, charcoal production, and firewood (Tamirat & Wondimu, 2019). From 1995 to 2015, forest coverage increased by 1.2% per year, and farmland costs increased by 1% per year. This is mainly due to the increase in mimosa acacia planting (Wondie & Mekuria, 2018). Converting farmland to mimosa Acacia plantations creates employment opportunities for landless people and enables farmers to diversify their lives (Nigussie et al., 2021; Tamirat & Wondimu, 2019; Wondie & Mekuria, 2018). Sparse distribution of mixed Eucalyptus globules and Acacia plants was also observed in this area (Figure 2). Agriculture, which combines crops and livestock, is the main production system. Grains, legumes, root vegetables, oilseeds, vegetables, and other cash crops are grown in the area. Crops are cultivated using rainfed agriculture and irrigation and residual moisture planting patterns (Abera, 2017). Rainwater agriculture is the dominant agricultural pattern. Livestock includes raising cattle, sheep, donkeys, horses, and more. Husbands contribute to farmers' lives as food, cash income, risk diversification, agricultural production, transportation, and sources of firewood. Livestock productivity is low due to changing land-use, restricted access to feed, inadequate grazing systems, inadequate provision of veterinary services, and market inefficiencies (Alemayehu & Tassew, 2017). Plantation practice of Acacia decurrens and Eucalyptus globules and camaldulensis in the study watershed.
Materials and Sources of the Data
Remote sensing data is especially important for understanding the degree of interaction between social systems and ecological characteristics. Space-based observations of Landsat 5 images in 1984 and 1998 and Landsat 8 images in 2013 and 2021 are taken from the United States Geological Survey (USGS; http://glovis.usgs.gov/). Satellite images were collected in February without clouds.
Data Analysis Methods and Procedures
NDVI thresholds based on LULC classification
The normalized vegetation difference index is the most common indicator of vegetation growth and vegetation cover dynamics (Huang et al., 2019). NDVIs are biophysical parameters associated with photosynthetic vegetation and provide valuable information on the dynamics of vegetation coatings over time. The main principles of vegetation change detection by NDVI are vegetation that strongly reflects near-infrared rays and vegetation pigment (chlorophyll) that strongly absorbs visible red.
NDVI is the proxy of vegetation changes computed from the ratio of near-infrared and visible red reflectance. It can be computed as follows:
Near-infrared – visible red
Landsat 5 and 8 bands with their respective wavelength and spatial resolution.

NDVI threshold classes, corresponding land-use/covers, and their description.

Estimating the value of ecosystem services

The land covers types and biome equivalents with the corresponding value coefficients.


Specific ecosystem services value coefficients (US$ ha-1 Yr-1) for five representative biomes.
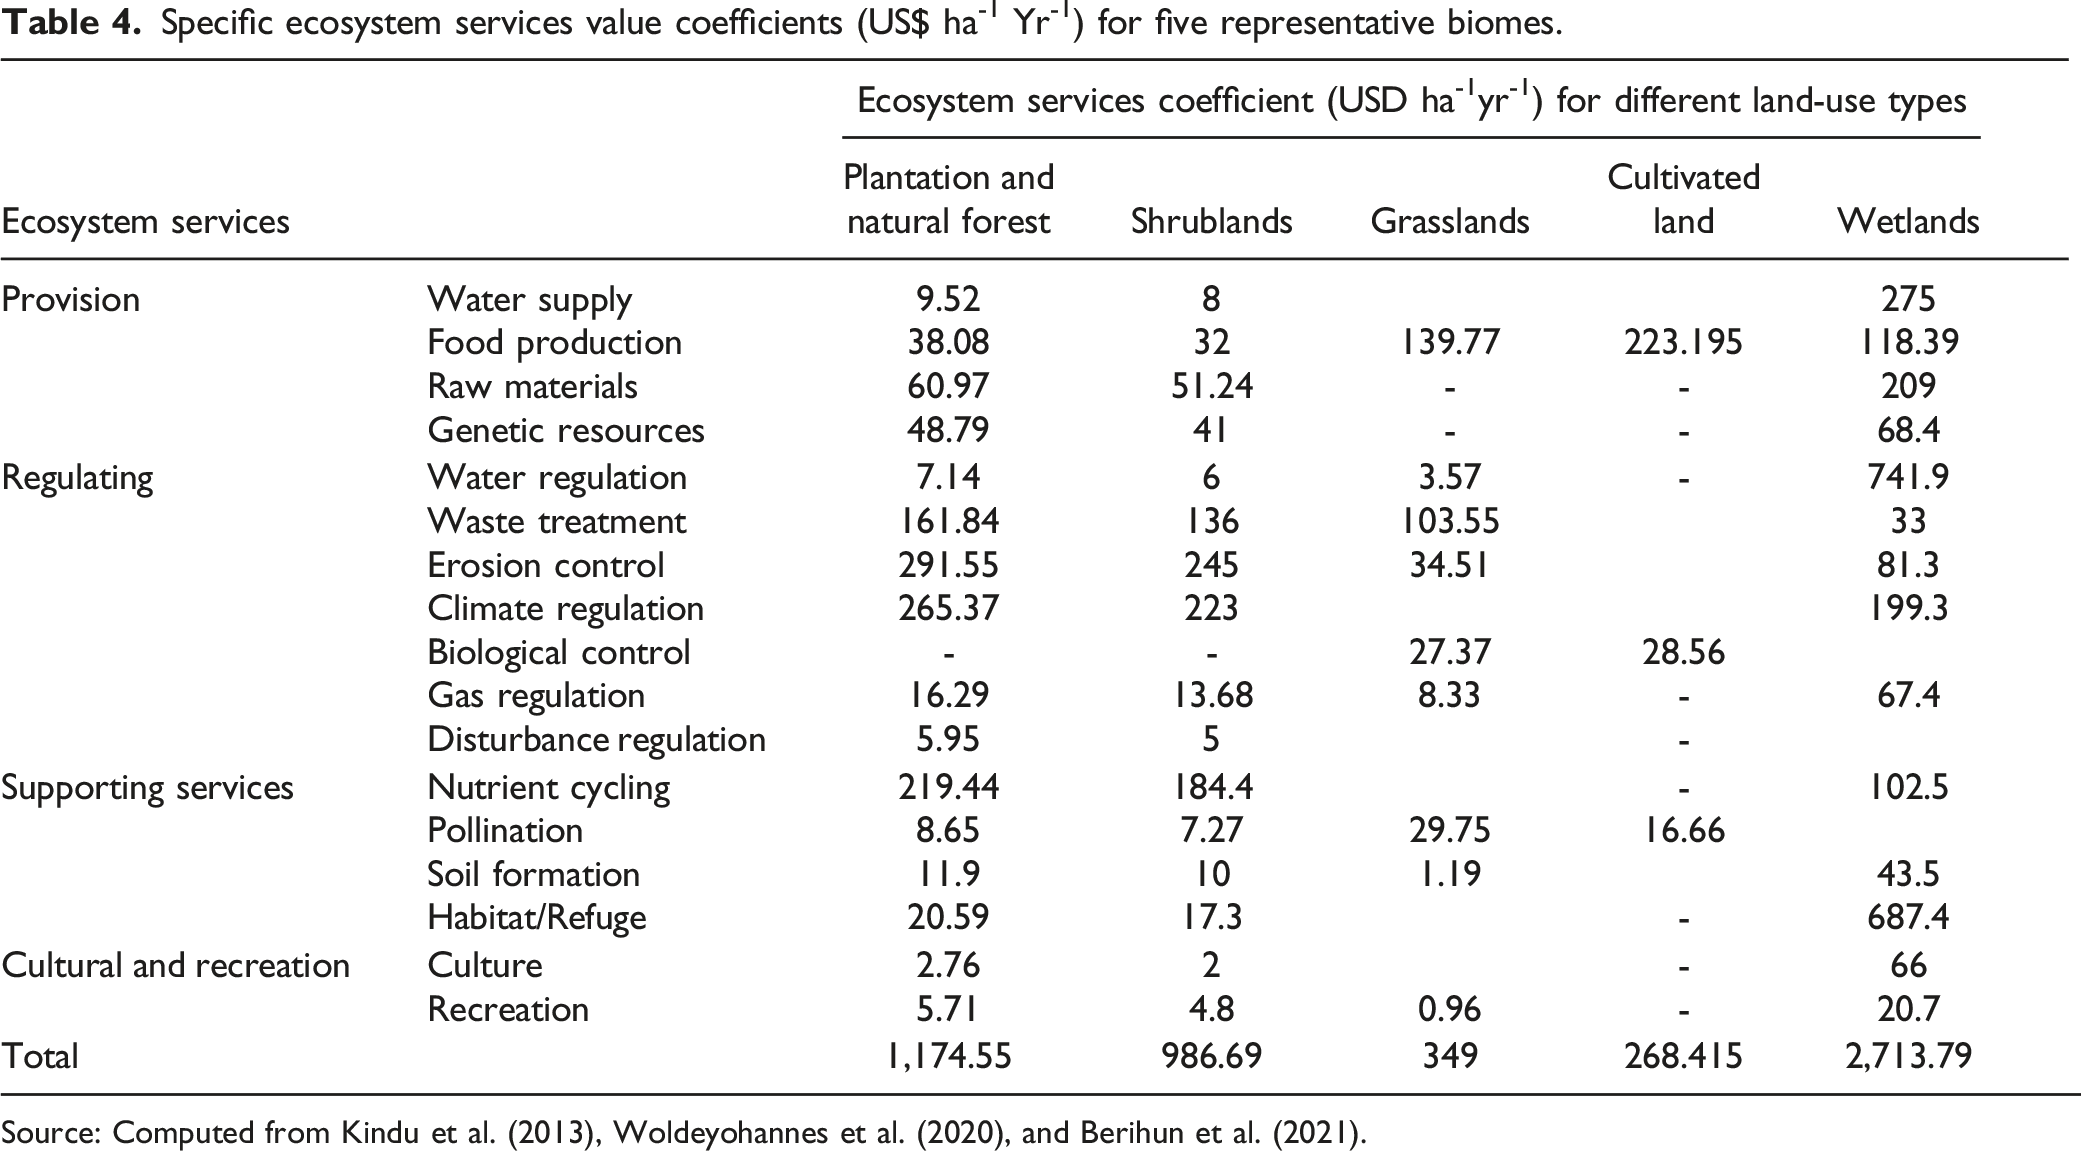
Source: Computed from Kindu et al. (2013), Woldeyohannes et al. (2020), and Berihun et al. (2021).
Sensitivity Coefficient Analysis
A sensitivity analysis was performed to determine the rate of change of ESV for a particular rate of change in the value factor (Zhang et al., 2015). The sensitivity factor (CS) was calculated using the standard economic concept of elasticity. H. The rate of change of the output given the rate of change of the input. It is important to consider that the value factor is uncertain and the biomes used as LULC-type proxies are not always the same. Ecosystem modification factors for forests, shrubs, grasslands, farmlands, and wetlands were adjusted by 50% to calculate the corresponding sensitivity factor (CS) (Kreuter et al., 2001).
where ESVi and ESVj = initial and adjusted ecosystem service values, respectively, and VCik and VCjk = LULC type “K” initial and adjusted value coefficients (US $ ha1 Yr1). If CS is greater than 1, the estimated value of the ecosystem service is taken into account. If CS is less than 1, the estimated ecosystem value is considered inelastic. CS = 1 means perfect elasticity. CS = 0 indicates complete inelasticity. The greater the proportional change in the ecosystem service value to the proportional change in the rating factor, the more important it is to use the correct ecosystem value factor (Kreuter et al., 2001; Zhang et al., 2015).
Results
LULCs Changes
Land-use/cover changes from 1984 to 2021.


Land-use/cover distributions of Gilgel Abay watershed from 1984 to 2021(in ha).
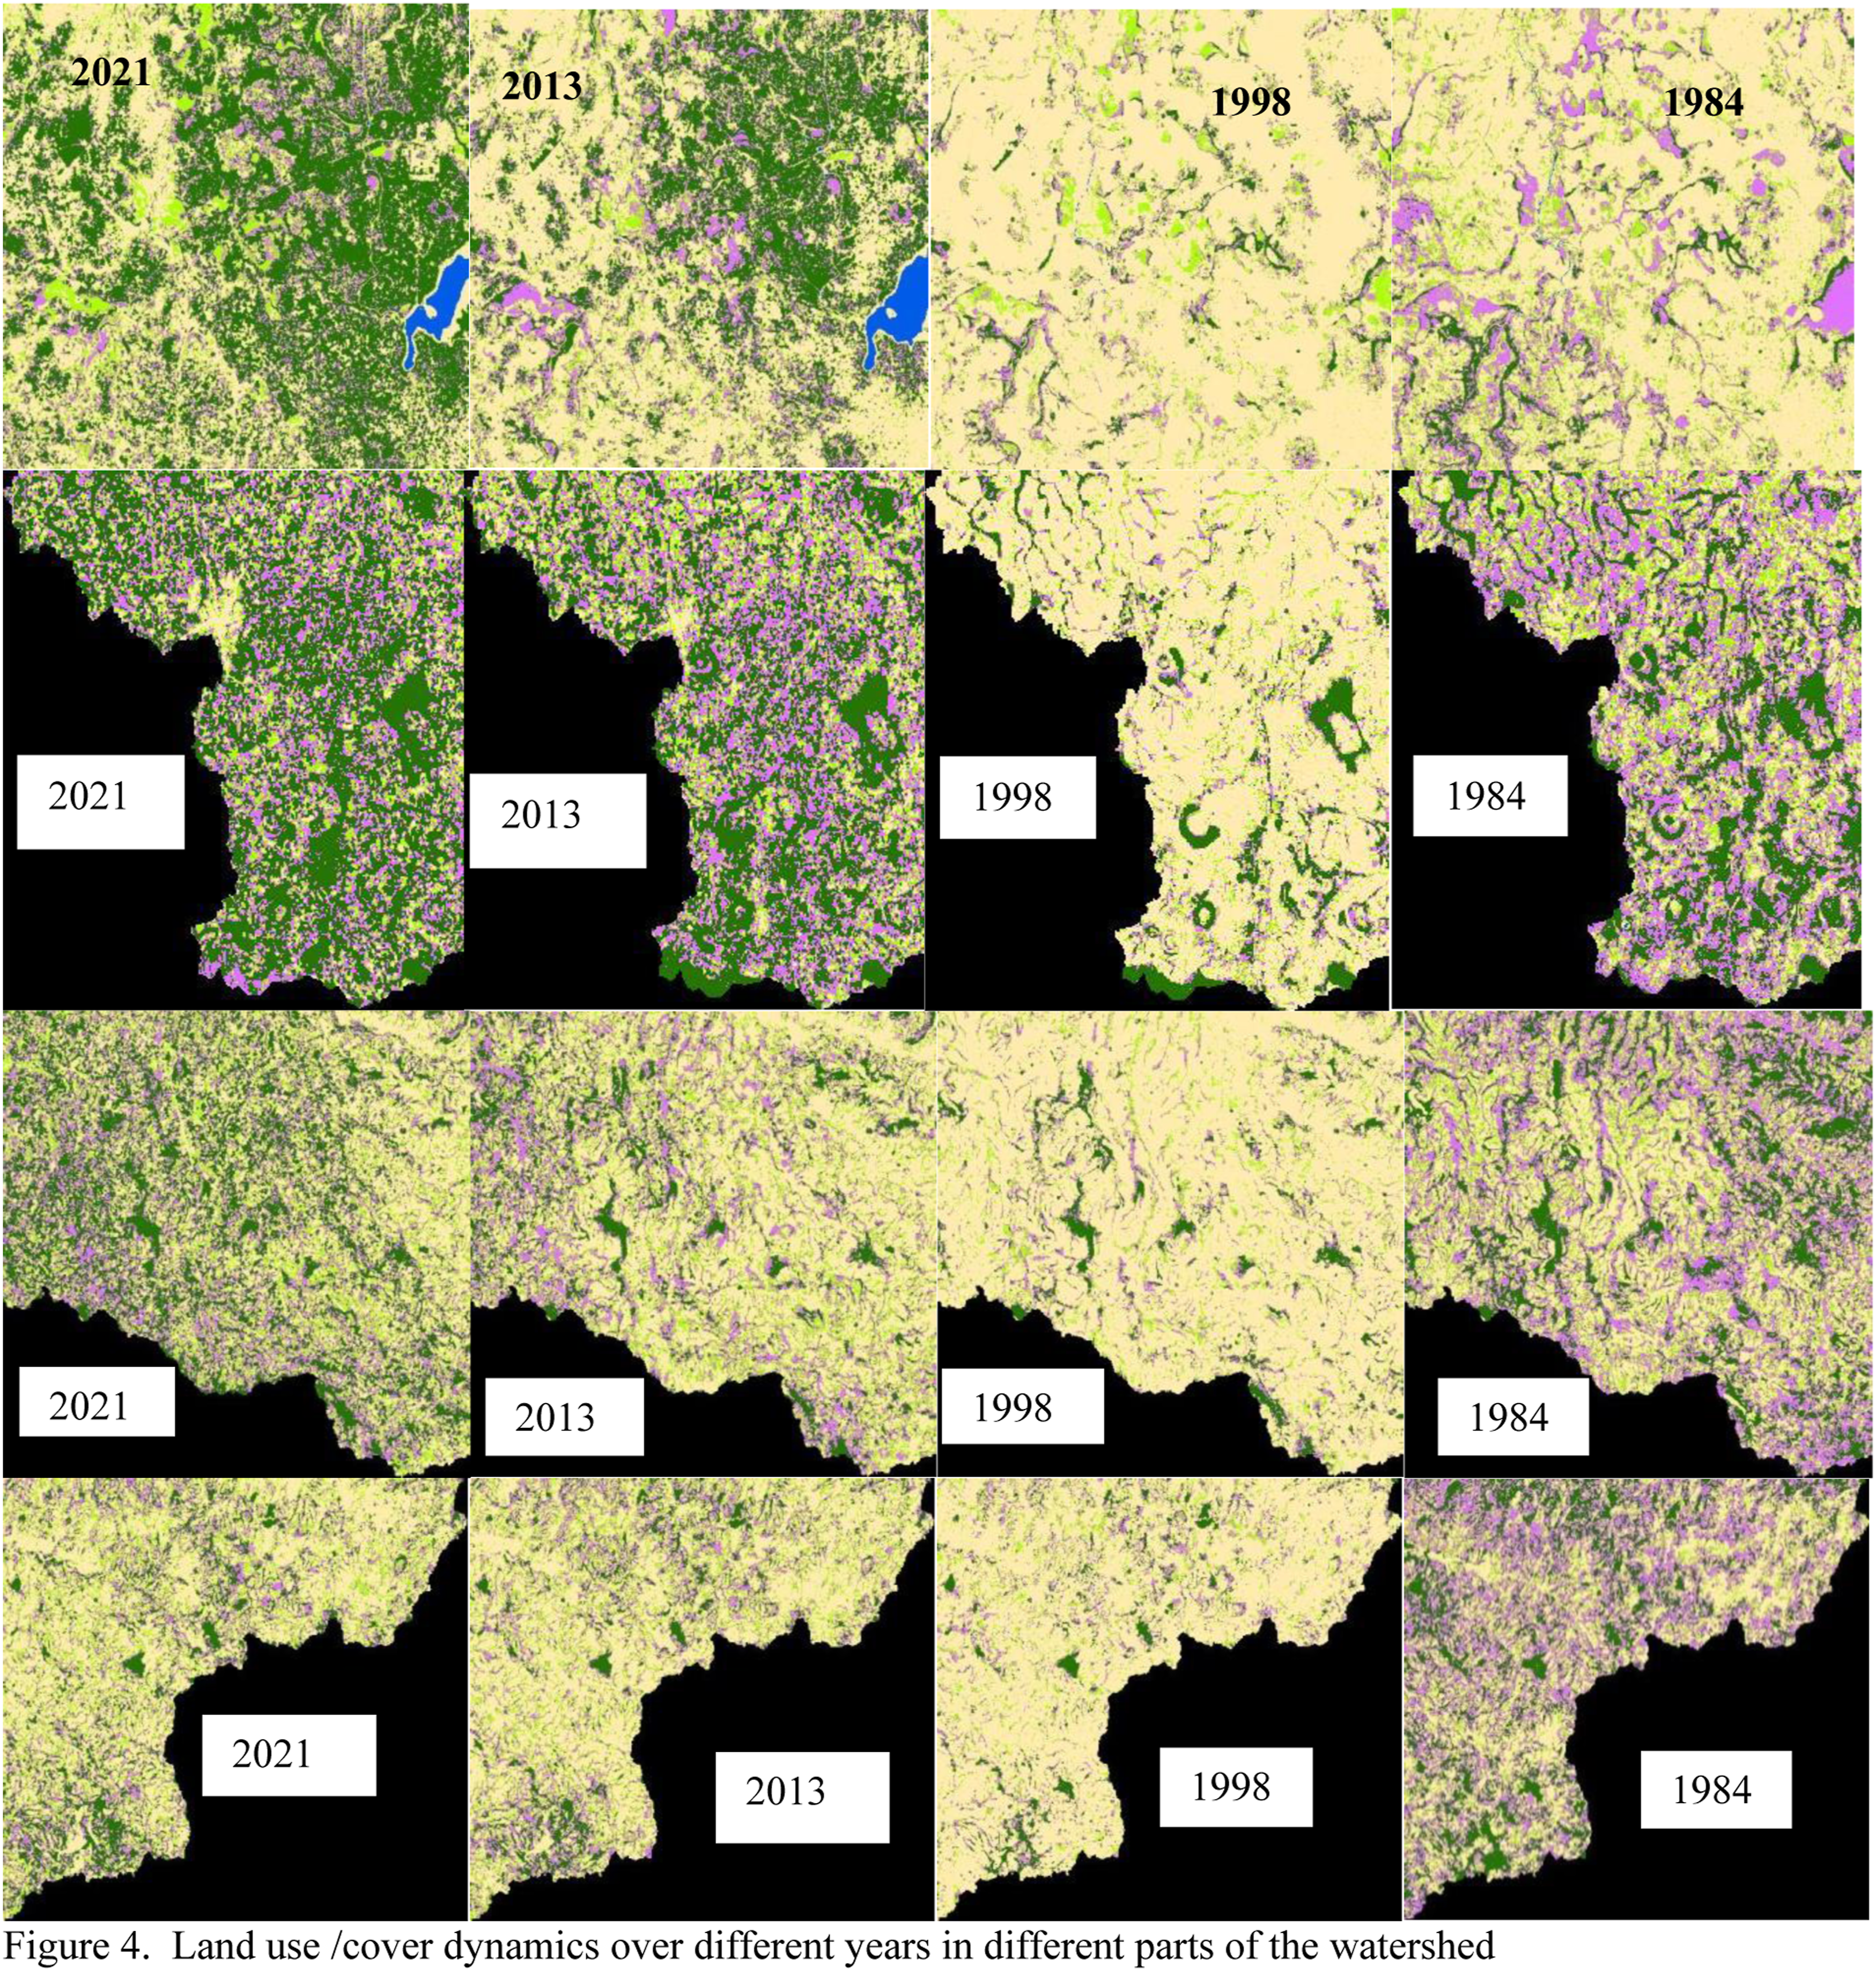
Land-use/cover dynamics over different years in different parts of the watershed.
Forest cover decreased by 22,548.3 hectares in the first period, while steadily increasing to 41,267.7 hectares in the second period and 31,706.2 hectares in the third period. From 1984 to 2021, forest cover increased by 50,425.6 ha with other land-use costs/land cover due to the expansion of forest area planted with exotic Acacia and Eucalyptus species. Shrubs decreased by 65,059.3 hectares in the first period due to deforestation, while increased by 44,440.8 hectares in the second period due to afforestation practices. Between 1984 and 2021, the shrublands decreased by 28,377.3 hectares with the gain of forests, wetlands, and grasslands. Like forests, grasslands decreased by 65,059.3 hectares in the first period, while they increased steadily after 1998. The area of cultivated land increased in the first period but continuously decreased after 1998. From 1984 to 2021, the wetland area increased by 531.1 hectares
Estimated Changes in the Total Value of Ecosystem Services
The estimated changes in total ecosystem service values.

Clearing forests cost about $26.48 million worth of watershed ecosystem services in the first period. Forest expansion increased by 48.53 million USD in the second period and 37.24 million USD in the third phase. Forest expansion increased the total value of ecosystem services by US$59.23 million between 1984 and 2021. The total values of grassland and wetland ecosystem services increased by 1.8 and 1.44 million USD, respectively.
Sensitive Analysis of Ecosystem Service Coefficient Value
Coefficient Sensitivity (CS) of each land use land cover with their respected years.

Effects of changes in LULC on individual ecosystem service values
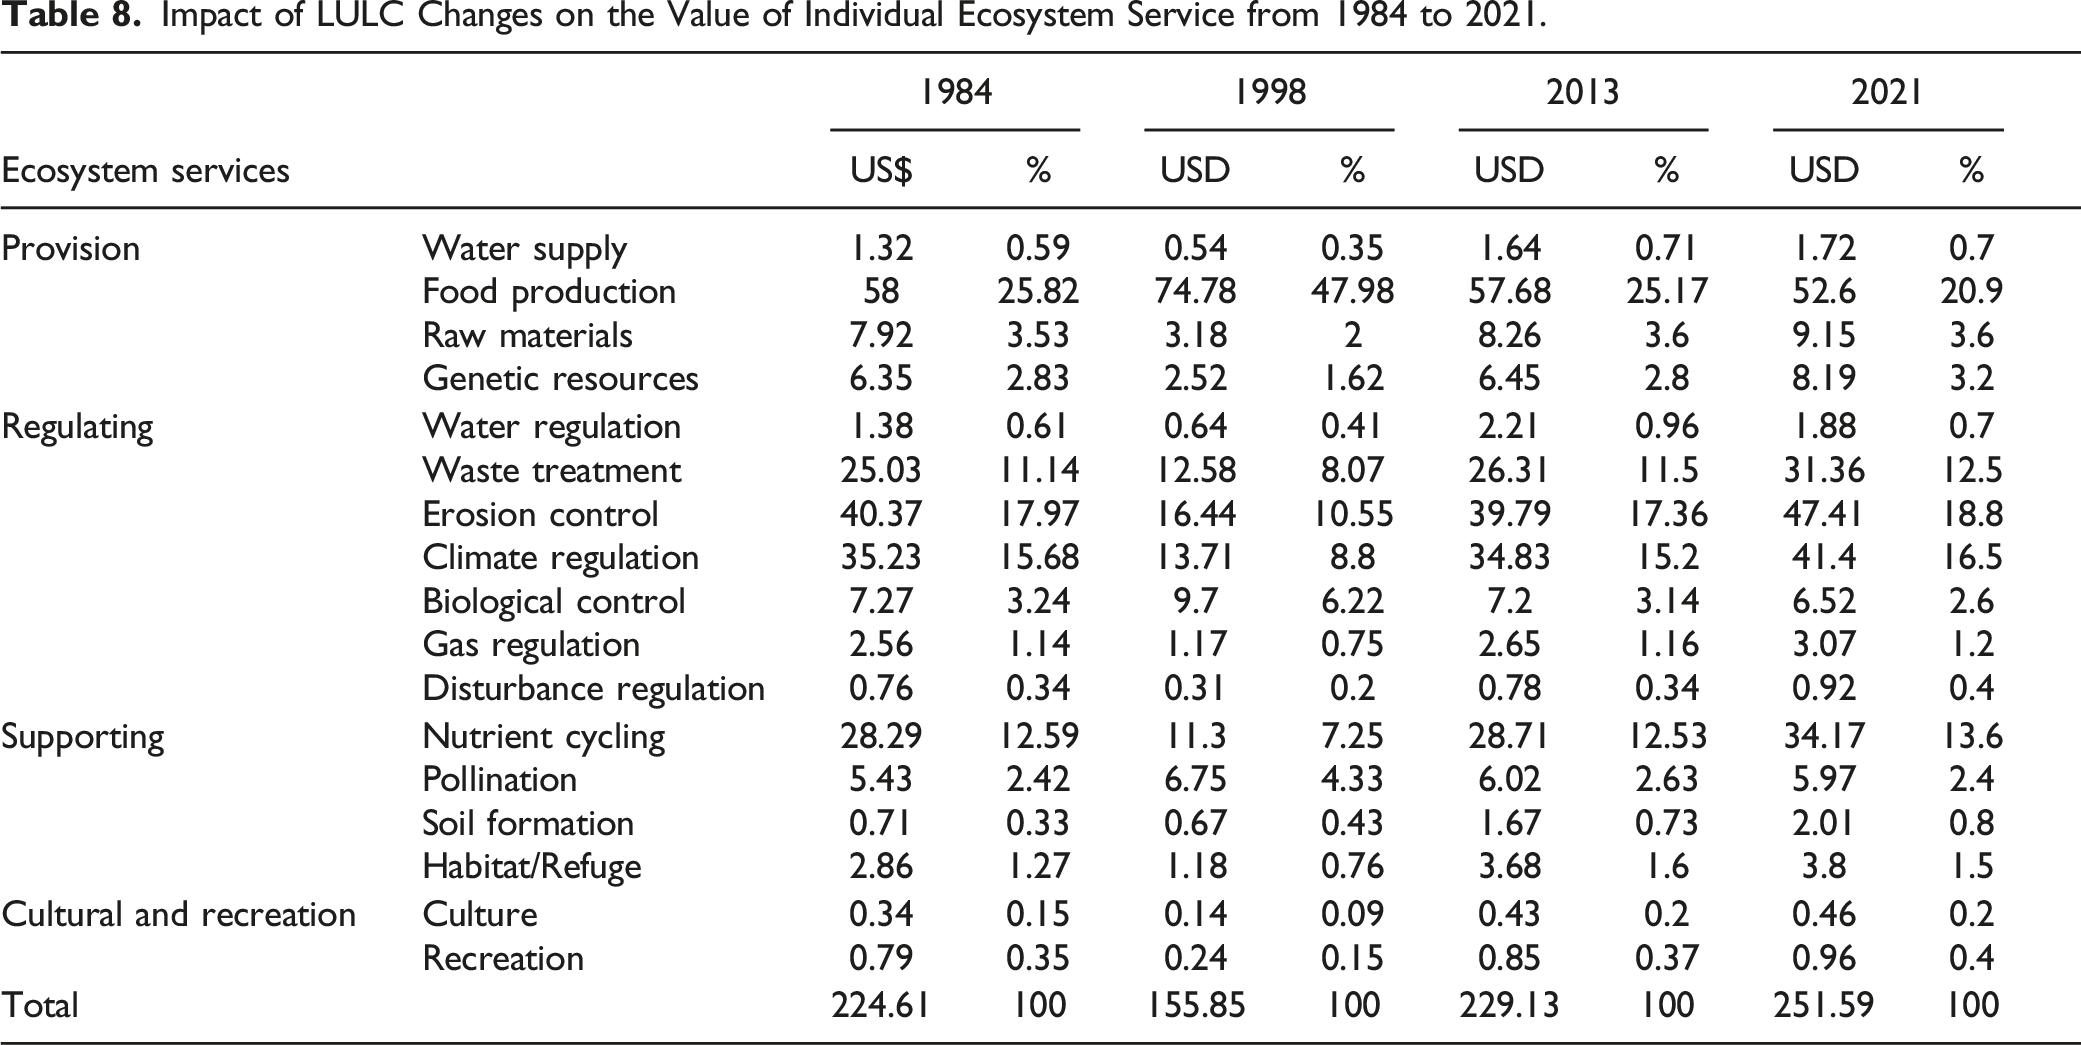
Table 7 shows the estimated change in the value of specific ecosystem services by land-use/land cover dynamics from 1984 to 2021. Regulation of ecosystem services (primarily erosion control and climate regulation) and provisional (mainly food production) are major contributors to watershed ecosystem services. Regulatory ecosystem services decreased from US$112.6 million in 1984 to US$54.55 million in 1998, while after 1998 services continued to grow to $113.77 million US in 2013 and US$132.56 million in 2021. Provisional ecosystem services increased from US$73.59 million in 1984 to US$81.02 million in 1998, but then decreased steadily to USD 74.03 million in 2013 and USD 71.66 million in 2021. Supporting ecosystem services (primarily nutrient cycling followed by pollination) was the third-largest contributor to ecosystem services in the watershed over the years studied.
Impact of LULC Changes on the Value of Individual Ecosystem Service from 1984 to 2021.
Discussion
Changes in Land-Use/Cover from 1984 to 2021
During the entire study period, forests, then grasslands, increased to the detriment of cultivated land and shrublands largely. Inconsistent with this, plantation forests were increased at the expense of agricultural land and natural vegetation from 1995 to 2015 in the upper and middle parts of the watershed (Yalew et al., 2016). The forest expansion is explained by the planting of Acacia mangium and eucalyptus in the upper and middle parts of the study watershed (Wondie & Mekuria, 2018; Figure 5b) and Eucalyptus camaldulensis in the lower part of the basin (Wondie & Mekuria, 2018; Figure 5b). Farmers prefer to plant Acacia mangium and Eucalyptus species as substitutes for cropland, mainly due to reduced crop yields, soil fertility, and adaptability to climate change (Yalew et al., 2016; Wondie and Mekuria, 2018). Acacia and Eucalyptus species are also planted around farms and community lands with moderate to steep slopes for fuelwood and cash income from coal sales (Wondie & Mekuria, 2018). The area of cultivated land increased as natural vegetation such as forests, shrubs and grasslands increased in the first period (1984–1998). Clearance of natural vegetation cover during cropland acquisition has been significantly observed in the upper moist highland watershed (locally known as “Dega”) and sub-humid highlands (locally named “Woina-Dega”) in the middle watershed (Figures 3, 4, and 5b). In sub-humid, humid, and cold highland agroecological zones, vegetation covers, such as forests, woodlands, and grasslands declined largely at the gain of cultivated land (Kindu et al., 2013). The highest ecosystem service value estimates were situated along the most inhabited humid highlands, and the least service value was found along the sub-humid highlands owing to the loss of vegetation cover at the gain of cultivated lands (Negash et al., 2020). (a) Percentage of LULC and total ESV from 1984 to 2021. (b) Plantation area from 1998 to 2021.
Land-Use/Cover Change and Ecosystem Service Values
The total value of ecosystem services decreased from $224.61 million in 1984 to $155.85 million in 1998, at a rate of $4.91 million per year. The results indicate that the expansion of cultivated land with the loss of natural vegetation and wetlands has led to a decrease in the total value of ecosystem services. The loss of natural vegetation and wetlands to cropland has significantly contributed to the total loss of ecosystem service value (Aneseyee et al., 2020; Berihun et al., 2021; Gashaw et al., 2018; Kindu et al., 2013; Shiferaw et al., 2019; Tolessa et al., 2016; Wang et al., 2017; Woldeyohannes et al., 2020). The decline in the value of natural shrublands ecosystem services of US$64.19 million, followed by a decline in the value of natural forest ecosystem services of US$26.54 million contributed significantly to the lowering the value of ecosystem services in 1998. The total and individual values of ecosystem services are negatively related to population growth and the loss of cropland expansion (Berihun et al., 2021). The clearing of natural forests and shrub ecosystems has reduced the quality and stability of water flows, carbon stocks, soil stabilization, and wild pollination services (Eguiguren et al., 2019; van Haaren et al., 2019). The total ecosystem service value of natural and shrub forests is significantly higher than that of plantations (Bremer & Farley, 2010; Chazdon, 2008; Paudyal et al., 2020).
Changes occurred in the values of individual ecosystem service functions, such as erosion control, climate regulation and waste treatment from regulating ecosystem services, and nutrient cycling from supporting ecosystem services were the most contributors to the loss of ecosystem service value in 1998. The expansion of cultivated land at the expense of forests, woodlands, shrublands, and wetlands has reduced the values of climate regulation, erosion control, and nutrient cycling (Kindu et al., 2013; Gashaw et al., 2018; Woldeyohannes et al., 2020). However, the value of food production followed by biological control and pollination service functions was increased as a result of the cultivated land expansion. The results agree with the findings of various studies (Aneseyee et al., 2020; Assefa et al.,2021; Berihun et al., 2021; Gashaw et al.,2018; Ketema et al.,2021; Kindu et al., 2013; Shiferaw et al.,2021; Sun et al., 2021; Woldeyohannes et al.,2020). Land degradation mainly due to deforestation and agricultural expansion could severely contribute to a significant loss of ecosystem services (Shiferaw et al., 2021). As a result, declining overall and individual ecosystem services require urgent response efforts to restore and manage the landscape for sustainable socio-ecological uses and services. Although agriculture is an important source of food, money, and raw materials production; its negative impacts on natural ecosystems and related services need to be urgently addressed (Woldeyohannes et al., 2020). Proper management and use of natural ecosystems are essential to prevent the continued loss of ecosystem services and to maintain the balance of processing, regulatory, and provisional ecosystem services(Sharma et al., 2019).
Contrary to the findings of the first period of the study, an increase in forests, shrubs, grasslands, and wetlands contributed to an increase in the total value of ecosystem services by US$73.3 million in 2013 and US$ 95.74 million in 2021 compared to 1998 (Tables 5 and 6; Figures 3–5). The expansion of the Acacia decurrens planting area has contributed to an increase in the total value of ecosystem services (Berihun et al., 2021). The protection of forests and shrubs as well as the conservation of wetland ecosystems is essential as they represent a high value of ecosystem services per hectare and are essential to preventing the loss of further ecosystem service values (Ketema et al., 2021; Sharma et al., 2019; Temesgen et al., 2018). The cultivation of acacia helps to increase the area of inland water catchment (Castro-Díez et al., 2021).
The total ecosystem service values were increased by 4.89 million US$ yr-1 from 1998 to 2013 and by 2.78 million US$ yr-1 from 2013 to 2021. From 1998 to 2021, regulating and supporting ecosystem service values contributed by 74.2% and 24.8%, respectively to the increase of total ecosystem service values (Table 8; Figure 6). Changes in individual ecosystem service functions, such as erosion control, climate regulation, waste treatment, and nutrient cycling were among the highest contributors to the total ecosystem service values. This agrees with the finding of Kindu et al. (2013). Erosion control, carbon sequestration, nitrogen fixation, and nutrient cycling are dependent on the aboveground and belowground flora and fauna diversity. The result of the study indicates that the synergistic relation between erosion control, climate regulation, and nutrient cycling was observed due to the plantation practice of eucalyptus and acacia species plantations. In association with this, Kearney et al. (2019) indicated synergies between water regulation, pest and disease control, soil composition, belowground biodiversity, and production value (Kearney et al., 2019). The proportion of major ecosystem service values (Million US$ ha-1yr-1) from 1984 to 2021.
Erosion control was the most contributor to regulating ecosystem service values. The plantation of denser canopies and deep-rooted trees can effectively regulate erosion by water, generation of surface runoff, and sediment discharge to rainfall characteristics in humid and sub-humid environments (Nigussie et al., 2021; Sun et al., 2021; Tang et al., 2021; Tully & Ryals, 2017). The plantation could reduce soil loss due to minimized soil disturbance, and branched taproots could keep the soil from being eroded (Castro-Díez et al., 2021; Chanie & Abewa, 2021).
Ecosystems regulate global and local climate by sinking greenhouse gases, as a source of aerosols, and enhancing evapotranspiration and thereby cloud formation and rainfall (Smith et al., 2013). The plantation ecosystem can affect the local microclimate through the provision of shelter, and regulation of humidity and temperature. Carbon sequestration in the vegetation biomass and soil is one indicator of climate regulation. The litter and wood debris layer of acacia and eucalyptus plantations on degraded soils contributed significantly to the increase in the total carbon stock of the ecosystem (Zhang et al., 2018). Nitrogen-fixing eucalyptus and acacia species have a high potential to grow in poor soils and improve climate regulation because their high growth makes them strong carbon absorbers (Boulmane et al., 2017; Castro-Díez et al., 2021).
Nutrient cycling is required to maintain soil productivity at the field scale and biogeochemical cycling at regional and global levels (Ghaley et al., 2014). This is the reuse of organic residues from agricultural biomass and soil vegetation (Schroder et al., 2016). Soil-specific properties can enhance one of the primary nutrient cycling processes. Nitrogen fixation by rhizobium, phosphorus supply by arbuscular mycorrhizal fungi, and litter degradation and mineralization are some of the major nutrient cycling processes (Ghaley et al., 2014). Reduced erosion and runoff, improved soil carbon storage, improved microbial biomass, low greenhouse gas emissions, improved water holding capacity, and high yields are key indicators of nutrient cycling and effective nutrition in agricultural systems (Tully & Ryals, 2017). Growing Acacia and eucalyptus species can capture nutrients, reduce nutrient leaching and improve soil water holding capacity sustainably compared to cropland (Tully & Ryals, 2017).
Cultivation of acacia species significantly restores nutrient cycling in degraded soils to improve their growth (Hamad-Sheip et al., 2021). Planting increased soil fertility in terms of nitrogen (N), potassium (P), and soil organic carbon (SOC) compared with adjacent control fields (Ahmed et al., 2020). Soil pH, cation exchange capacity, and phosphorus were also improved in acacia fields compared with adjacent soils (Amare et al., 2022; Hamad-Sheip et al., 2021). Improving soil fertility in acacia fields leads to increased annual crop yields (Chanie and Abewa, 2021). The addition of acacia leaf residue was more effective for nitrogen fixation, SOC accumulation, nutrient availability, and soil moisture improvement than acacia eucalyptus species (Castro-Díez et al., 2021; Hamad-Sheip et al., 2021; Nigussie et al., 2021; Zhang et al., 2018).
Compared with intensively cultivated land, the area planted with eucalyptus species can improve the physical and chemical properties of the soil by recycling nutrients through waste decomposition (Cuer et al., 2018; Liang et al., 2016; Mengistu et al., 2020). The soil nutrient status of the planting site is intermediate between degraded soil and native forest (Liang et al., 2016; Boulmane et al., 2017). Mixing eucalyptus with nitrogen-fixing plants helps prevent nutrient deficiencies caused by monoculture.
Growing a mixture of eucalyptus species and N-fixing acacia also helps to stimulate the cycle of soil organic matter (SOM), N, P, Ca, Mg, and K by breaking down leaf residues compared to monoculture (Bekele et al., 2021; Forrester et al., 2005; Pereira et al., 2018). Mixing N-fixing plants with eucalyptus is a good alternative for maintaining soil fertility by improving soil nitrogen cycling in fast-growing plantations established on tropical soils (Tchichelle et al., 2017; Voigtlaender et al., 2019). Higher nutrient cycling can promote a positive nutrient balance in mixed plantation ecosystems (Santos et al., 2017; Tchichelle et al., 2017).
In contrast to the regulation and processing of ecosystem services, the value of food production service functions has decreased as the expansion of the Acacia and Eucalyptus species has resulted in the loss of cropland (Figure 6). Loss of cropland represents a growing threat to food security in rapidly populated areas (Sharma et al., 2019). Therefore, to avoid this, maintaining an appropriate ratio of vegetation cover (plantation and natural forest), cropland, and wetland ecosystem is most important to provide optimal ecosystem services in the landscape (Kearney et al., 2019; Sharma et al., 2019).
Implications for Conservation
The degradation of biodiversity-ecosystem services could have important implications for the sustainable development agenda in the tropics. Despite the invaluable contribution of ecosystem services to the functioning of nature and sustainable livelihoods, the value of ecosystem services has been significantly reduced over time and space due to changes in land-use/cover. The expansion of planting of Acacia and Eucalyptus species at the expense of cultivated land affects ecosystem service values and has not received much attention. The results indicated that the expansion of cropland at the expense of natural forests and shrubs increased the service value of food production while reducing the total value of ecosystem services due to reduced service value of erosion control, climate regulation, nutrient cycling, and waste disposal. The expansion of plantations forests and shrublands and the development of wetlands have led to an increase in the total value of ecosystem services mainly due to an increase in the value of erosion control, climate change, waste treatment, and nutrients bicycle. Therefore, more attention should be paid to preventing deforestation of natural forests and shrubs to enhance the value of ecosystem services. Effective community management of natural forests is needed to enhance the value of ecosystem services, as the total value of ecosystem services of natural forests is higher than that of plantations (Bremer& Farley, 2010; Chazdon, 2008; Paudyal et al., 2020; Thammanu et al., 2021). The mosaic agricultural landscape consisting of plantations, natural forests, agroforestry, and heterogeneous agro-systems must be scaled up to maximize the multiple values of ecosystem services.
Footnotes
Acknowledgments
The study benefits from the different empirical literature
Declaration of Conflicting Interests
The author(s) declared no potential conflicts of interest with respect to the research, authorship, and/or publication of this article.
Funding
The author(s) received no financial support for the research, authorship, and/or publication of this article.