
Abstract
Assessing landscape connectivity allows us to identify critical areas that impede or facilitate the movement of organisms and their genes and to plan their conservation and management. In this article, we assessed landscape connectivity and ecological condition of the habitat patches of a highly biodiverse region in Chiapas, Mexico. We employed data of three cracid species with different characteristics in habitat use and mobility. The habitat map of each species was derived from a spatial intersection of the models of potential distribution and a high-resolution map of current land cover and land use. The ecological condition of vegetation types was evaluated using 75 field plots. Structure of landscape was estimated by fragmentation metrics, while functional connectivity was assessed using spatially explicit graph analysis. The extent of suitable habitat for Oreophasis derbianus, Penelopina nigra, and Penelope purpurascens correspond to 25%, 46%, and 55% of the study area (5,185.6 km2), respectively. Although the pine-oak forests were the most fragmented vegetation type, habitats of the three species were well connected, and only 4% to 9% of the fragments located on the periphery of the corridor had low connectivity. Landscape connectivity depends mainly on land uses with an intermediate and lower ecological condition (secondary forests and coffee agroforestry systems). Therefore, we suggest that in addition to promoting the improvement in connectivity in fragmented forests, conservation efforts should be aimed at preventing the conversion of mature forests into agricultural uses and maintaining agroforestry systems.
Keywords
Introduction
The persistence of species in a fragmented landscape has been the subject of study of island biogeography and metapopulation dynamics and can be interpreted as the result of the equilibrium of extinction and colonization processes (McArthur & Wilson, 1967). On this basis, species populations are more likely to occur in larger and well-connected habitat fragments than in small and isolated fragments (Dupré & Ehrlén, 2002; Hanski, 1998). However, recent research have shown evidence that this also depends on the patch context: the spatial heterogeneity, on permeability of the matrix (surface surrounding the habitat), and the behavior of each species in response to the landscape structure. If the matrix surrounding habitat fragments is not completely hostile, if it has usable resources for the species, island biogeography has limited application (Sekercioglu, Loarie, Oviedo Brenes, Ehrlich, & Daily, 2007; Tscharntke et al., 2012). The matrix can have variable levels of quality for species due to their structural and composition, resulting in different levels of permeability that provide wide-ranging risks and survival benefits for the animals that cross it. In this way, the matrix functions as a complete or a semipermeable barrier that can contribute to animal movement or as a habitat complement (Biz, Cornelius, & Metzger, 2017; Driscoll, Banks, Barton, Lindenmayer, & Smith, 2013).
Besides, species with different ecological needs and dispersal capacities may respond differently to habitat fragmentation, which may be determinant in ensuring the survival of the population (Liao, Bearup, & Blasius, 2017). Landscape connectivity can be explained as the physical arrangement of the vegetation structure in the landscape or by an organism’s response to that structure (functional connectivity; Tischendorf & Fahrig, 2000; Xun, Yu, & Wang, 2017). Different approaches have been applied to assess connectivity, including structural metrics and the network approach or graph theory. Structural metrics quantify heterogeneity, levels of fragmentation, and habitat isolation at different scales (Botequilha Leitão & Ahern, 2002). In addition, by using spatially explicit graph analysis, it is possible to estimate functional connectivity and model the possibilities of species movement in a network of habitat fragments spatially isolated in heterogeneous landscapes (Saura & Rubio, 2010; Urban & Keitt, 2001). According to this approach, habitat fragments are represented by nodes in a graph and the distance between them is represented by links, which in turn represent the dispersal possibilities of a species between two patches (Bodin & Saura, 2010; Saura & Rubio, 2010). Consequently, the results of the functional connectivity analysis will depend on the ecological requirements and the mobility capacity of the species studied.
Members of the Cracidae bird family are useful as an indicator species for forest connectivity since they inhabit tropical forests, their movement habits are predominantly arboreal, and they respond negatively to habitat fragmentation. They also play a vital role in the regeneration of tropical forests because they are seed dispersers (Thornton, Branch, & Sunquist, 2012). In this bird family, guans (genera Penelopina, Penelope, and Oreophasis) are the species with arboreal habits that are most sensitive to the conversion of forested landscapes to agriculture and to continuous hunting pressure, due to their low reproductive capacity (López et al., 2014).
Landscape connectivity analysis represents a valuable tool for planning landscape conservation and management actions and allows the identification and prioritization of critical areas for conservation; the identification of these areas is particularly necessary for biodiverse landscapes affected by high anthropic pressure, such as biological corridors that connect net of natural protected areas. Even though the goal of biological corridors is to facilitate the animal movement between fragments, thereby increasing gene flow, and eventually ensure the viability of populations (Evans, Levey, & Tewksbury, 2013; Simberloff, Farr, Cox, & Mehlman, 1992), few works have analyzed their degree of functional connectivity and ecological quality of their forest fragments.
In this article, we applied a landscape connectivity analysis to identify the critical areas for maintaining forest connectivity in a biological corridor of southeast Mexico. Species-distribution models, high-resolution land-cover maps, and the ecological requirements of the three cracids species (Penelope purpurascens, Penelopina nigra, and Oreophasis derbianus) were employed to elaborate habitat maps. Spatially graph analysis was carried out to calculate their functional connectivity; moreover, an ecological condition index of the habitats fragments was calculated using field data.
Methods
Study Area
The study area corresponds to the Sierra Madre del Sur Mesoamerican Biological Corridor (SMSMBC), a subsystem of the Mesoamerican Biological Corridor, which is an international initiative to coordinate and implement conservation and sustainable human development actions (Miller, Chang, & Johnson, 2001). SMSMBC is recognized as one of the world’s most important biodiversity hotspots due to host high richness and endemism of the species (Brooks et al., 2002; Myers, Mittermeier, Mittermeier, da Fonseca, & Kent, 2000). It covers an area of 5,185.6 km2 and it is located in southern Mexico, in the physiographic region of Sierra Madre de Chiapas (Müllerried, 1982); the relief of this area forms a mountainous landscape with hillside exposures facing the Pacific Ocean and the Central Chiapas Depression, with an altitudinal gradient ranging from sea level to 3,000 m asl (Instituto Nacional de Estadística y Geografía, 2017; Müllerried, 1982). Ten vegetation types were recorded, including one of the largest areas of cloud forest in Mexico (Challenger, 1998). Within the corridor, there are three Protected Natural Areas—El Triunfo (biosphere reserve), La Frailescana (natural resource protection area), and Cordón Pico El Loro Paxtal (state reserve)—and the remaining area is without specific protection. Productive human activities are not allowed in the El Triunfo core zones so the best conserved forests are found there. The buffer zone also includes areas with good conservation status but low-impact productive activities are practiced in this area (Figure 1).

Protected natural areas and management zones of the El Triunfo Biosphere Reserve located in the Sierra Madre del Sur Mesoamerican Biological Corridor in the state of Chiapas, Mexico. El Triunfo core zone is subdivided into five polygons: I (El Triunfo), II (Ovando), III (Custepec), IV (El Venado), and V (La Angostura). The black triangles represent the location of the 75 sampling sites in this study.
Habitat Maps
Three sources of information were employed to elaborate the current habitat maps of the species: (a) potential species-distribution models derived from presence-only records, (b) a high-resolution map of the vegetation types and current land use (scale 1:40,000) elaborated for this study, and (c) reviews of the literature and field data to identify the ecological requirements of the three species. Once all the maps were ready, a spatial intersection operation was applied to obtain the current distribution areas. After that, a filter was applied to select only the vegetation types, and land uses reported in the ecological requirements review.
Potential species-distribution model
The maximum entropy method was used to model species distributions with presence-only data and environmental layers. In this study, we obtained 137 visual and vocal records or other evidence such as feathers, nests, or eggs. Complementary records (4,145) of the three species in Chiapas were obtained from the following:
Biological information platforms (scientific collections) such as The Global Biodiversity Information Facility (GBIF.org, 2016) and CONABIO's National Biodiversity Information System (Enríquez, Rangel-Salazar, Vázquez Pérez, & Partida Lara, 2014); Species monitoring records (visual, auditory and camera traps): from the Secretariat of Environment and Natural History (Secretaría de Medio Ambiente e Historia Natural, 2017), the community monitoring coordination of La Frailescana (Bioconciencia, 2015, 2016), the Network of Community Monitors of the Sierra Madre and Coast of Chiapas (Pronatura Sur, 2017), the Campesinos Ecológicos de la Sierra Madre de Chiapas organization (Campesinos Ecológicos de la Sierra Madre de Chiapas, 2017), and PRONATURA Sur A.C. (Pronatura Sur, 2014).
To minimize doubtful georeferencing data in the potential distribution map, we eliminated duplicate records (records within the same grid cell, res of 100 m2) and only employed records from the period 2010 to 2017. The performance of the model was evaluated using the ROC statistic (Phillips, Anderson, & Schapire, 2006), a data set of 203 records of P. purpurascens, 740 of P. nigra, and 32 records of O. derbianus were used, of which 75% was used to calibrate the model of each species and 25% for validation. The variables used in the models were as follows: minimum and maximum temperature, precipitation (Fick & Hijmans, 2017), elevation (Instituto Nacional de Estadística y Geografía, 2017), and potential vegetation (Rzedowski, 1990). Potential vegetation has been described as “the natural vegetation that would exist in a given place if land use had never existed” (Levavasseur, Vrac, Roche, Paillard, & Guiot, 2013). The potential vegetation map was used to define the potential distribution area based on existing environmental conditions, regardless of changes in land cover and land use. The correlation between the predictor variables was calculated using Pearson’s correlation coefficient, using R’s packages (R Core Team, 2018). Data modeling was done on Maxent version 3.3.3k (Phillips, 2016).
High-resolution land-cover/land-use maps
Using high-resolution satellite images SPOTs 6 and 7 (El Colegio de la Frontera Sur, 2015; Secretaría de Marina, 2008), a map of vegetation types and land use in the study area was drawn up. All scenes included panchromatic (spatial resolution of 1.5 m) and multispectral (four bands with spatial resolution of 6 m) bands dated January 25, 2015, February 8, 2015, and February 14, 2014 (SPOT 6) and January 31, 2015, February 21, 2015, and February 26, 2015 (SPOT 7). The images were classified with an object-oriented approach, using the random forest algorithm (Breiman, 2001). Training samples were derived from information obtained in the field and from other sources such as the National Forest Inventory (Ricker, Villela, & Espinosa, 2019), coffee plantation census (COMCAFE, 2008), and the georeferenced records of woody species from the ECOSUR herbarium (ECO-CH-H). In addition to the spectral data of the satellite images, environmental data available in the following layers were used: digital elevation model, with spatial resolution of 30 m; exposure, slope, and solar radiation (derived from the digital elevation model); and precipitation and annual mean temperature generated from bioclimatic data from the State of Chiapas (Fick & Hijmans, 2017). At a later stage, errors in the automated classification were detected and corrected by visual inspection of the map. All satellite image processing was performed using the open software Python and QGIS (Clewley et al., 2014; QGIS Development Team, 2017).
Ecological requirements
The cracid species have different ecological niche widths but very similar requirements in their arboreal habits, the types of fruit in their diet, and the need to migrate altitudinally, following the fructification of the arboreal species, so they partially share habitat in some altitudinal ranges and types of vegetation (Table 1).
Ecological Requirements of the Three Studied Cracids Species.

Of the three species, O. derbianus is heavily dependent on the evergreen cloud forest and has a restricted geographic distribution and is endemic to Mesoamerica. Based on the International Union for Conservation of Nature categories, O. derbianus is classified as “Endangered” (EN), criterion C2a(i), while P. nigra is Vulnerable (VU), and P. purpurascens is classified as Least Concern (LC) (Birdlife International, 2016a, 2016b, 2016c).
Ecological Condition Index
From April to August 2017, 14 field trips were conducted to measure 75 sampling sites in nine municipalities (Figure 1). At each site, a circular plot of 1,000 m2 was established, and a set of indicator variables were recorded including vegetation type, canopy height, basal area of dominant tree species, and tree species richness. Forest disturbance factors were also recorded such as grazing and trampling, firewood and wood extraction, damages for fire, trails, and logging evidence. Disturbance qualitative data were classified into three classes depending on their intensity or frequency: absent or low, medium, and high. Finally, the qualitative and quantitative values assigned to the variables were processed to construct a multicriteria ecological condition index (Ochoa-Gaona et al., 2010), which range from 0 (worst condition) to 1 (best condition).
Landscape Fragmentation
Metrics of landscape fragmentation were calculated using raster format of habitat maps and the software Fragstats v. 4.3 (McGarigal & Marks, 1995). The metrics used to measure composition and structure at class and landscape level were as follows: percentage of landscape or percentage of habitat (PLAND), patch density (PD), largest patch index (LPI), mean patch size (Area_MN), interspersion and juxtaposition index (IJI), and contagion (CONTAG) (McGarigal & Marks, 1995; Vila, Vargas, Llausàs, & Ribas, 2006). Only the four-cell neighborhood criterion was used to calculate the above metrics.
Functional Connectivity
Statistics derived from spatial graph analysis
The functional connectivity of habitat fragments was evaluated using statistics derived from the analysis of spatial graphs. Two derived indices were used in the Conefor 2.6 program (Saura & Torné, 2009): the integral connectivity index (IIC) and the probability of connectivity (PC). The first is based on a binary connection model and is recommended for analyzing the structure and general pattern of long-term functional connectivity, while the second uses a probabilistic connection model and is useful for studying the flow of organisms regardless of their origin (Qi, Fan, Nam, Wang, & Xie, 2017). To calculate both indices, Conefor requires information on the node attribute, distances between them, and dispersion distances. As an indicator of node attribute, the size of the fragment was used, as well as the Euclidean distance between the edges of each fragment and the dispersal distances defined for each species (see next subsection).
Once the indices were calculated, their values were grouped into two categories according to their contribution to landscape connectivity, using the natural break method, which better groups similar values between classes that have considerable differences in data values (Smith, Goodchild, & Longley, 2018). The dIIC index corresponds to the ranking of each patch according to the proportion by which the value of the IIC decreases when this patch is removed (Decout, Manel, Miaud, & Luque, 2012). In the same way, dPC represents percentage of the variation in PC caused by the removal of each individual element from the landscape (Saura & Rubio, 2010). dIIC is divided into three fractions that indicate different aspects of connectivity (Crouzeilles, Lorini, Grelle, Lucia, & Eduardo, 2013):
dIICintra estimates available habitat based on the area provided by the patch; dIICconnect values critical patches that facilitate the flow of species between two other patches within the shortest path, and this fraction is used as a criterion for selecting priority stepping stones or corridors; and dIICflux evaluates fragments based on area-weighted dispersal flow and is used as a substitute for how well one fragment connects to another when it is the final or starting point of flow.
Dispersal distance
Based on the literature reviewed, no data were found on the specific range of action of the three species, so dispersal distances data from species of the same family or taxonomic genus with similar habits were used as a reference and experts were also consulted. For P. purpurascens, a range of 10 to 15 km for maximum dispersion distance was estimated; this range was based on the reported dispersion distances of another species of the same genus, the white-winged guan (Penelope albipennis), with similar body structure and habits, which moves a maximum of 13 km during an annual period to where food is more readily available (Pratolongo, 2004). For P. nigra, a range of 3 to 8 km was defined because it moves at a slower speed than P. purpurascens (Eisermann, 2012). For O. derbianus, a range of 0.5 to 1.5 km was estimated because it is a sedentary species and is no ability to fly, as it is a glider (González-García, 2011, 2012).
Results
Habitat Map
Potential distribution models
Potential distribution values were high for the three species, for O. derbianus was 90.6%, for P. nigra 90%, and for P. purpurascens was 83.4%. These values were acceptable because they were higher than .5 of a random model (Figure 2). Different environmental variables were related to the distribution of the three species. Precipitation was negatively related to the occurrence of P. purpurascens and P. nigra, elevation was also a positively related to P. nigra and O. derbianus, and minimum temperature was positively associated with O. derbianus.

Área under the receiver operating characteristic curve (AUC) to evaluate model performance for (a) P. purpurascens, (b) P. nigra, and (c) O. derbianus). The value of AUC ranges from 0 to 1. An AUC value of 0.50 indicates that model did not perform better than random, whereas a value of 1.0 indicates perfect discrimination.
We found a high correlation (r ≥|.5|) between elevation and maximum and minimum temperatures, also between maximum and minimum temperatures. The other variables have a low correlation with each other (|0.1| < r ≤ |.3|). Despite of this correlation, these variables were used as predictors of the model, based on Braunisch et al. (2013) that it is preferable to include correlated variables, but potentially relevant to the current distribution model, when the “true” predictor of a set of correlated variables cannot be identified.
High-resolution land-cover/land-use maps
We identified 11 forest land-cover types that account for 66.5% of the study area, of which 3 correspond to mature forests (89,150 ha), 6 secondary or disturbed forests (178,641 ha), and 2 agroforestry systems of coffee and cocoa (77,584 ha) (Figure 3). Six land uses were also identified, including different types of agriculture, human settlements, areas without vegetation, and bodies of water, which account for 174,094 ha (33.5% of the study area).

High-resolution map showing the most important vegetation types and land uses in the study area. Vegetation types covering less than 1% of the study area are not included. EverClou_M = mature evergreen cloud forest; EverClou_S = secondary evergreen cloud forest; EverTrop_M = mature evergreen tropical forest; EverTrop_S = secondary evergreen tropical forest; PineOakF_M = mature pine-oak forest; PineOakF_S = secondary pine-oak forest; PineOakF_D = disturbed pine-oak forest; RiparVeget = riparian vegetation; CoffeAgro = coffee agroforestry systems.
Habitat map
The current habitat for the indicator species was a mixture of mature and disturbed forests and agroforestry systems (Figure 4). The habitat of P. purpurascens occupied 282,893 ha (55% of the study area), P. nigra occupied 238,435 ha (46%), and O. derbianus only 127,233 ha (25%). The coffee agroforestry system, mature pine-oak forest, and secondary evergreen cloud forest conformed the habitat of the three species mainly. In the habitat of O. derbianus, the mature evergreen cloud forest was also one of the largest (Figure 5). In terms of protection levels, a high proportion of the habitats of P. nigra and P. purpurascens were out of the protected natural areas, with a low level of legal protection (Figure 6).

Distribution of forests and agroforestry systems in the current habitat of the three cracid species in the study area.
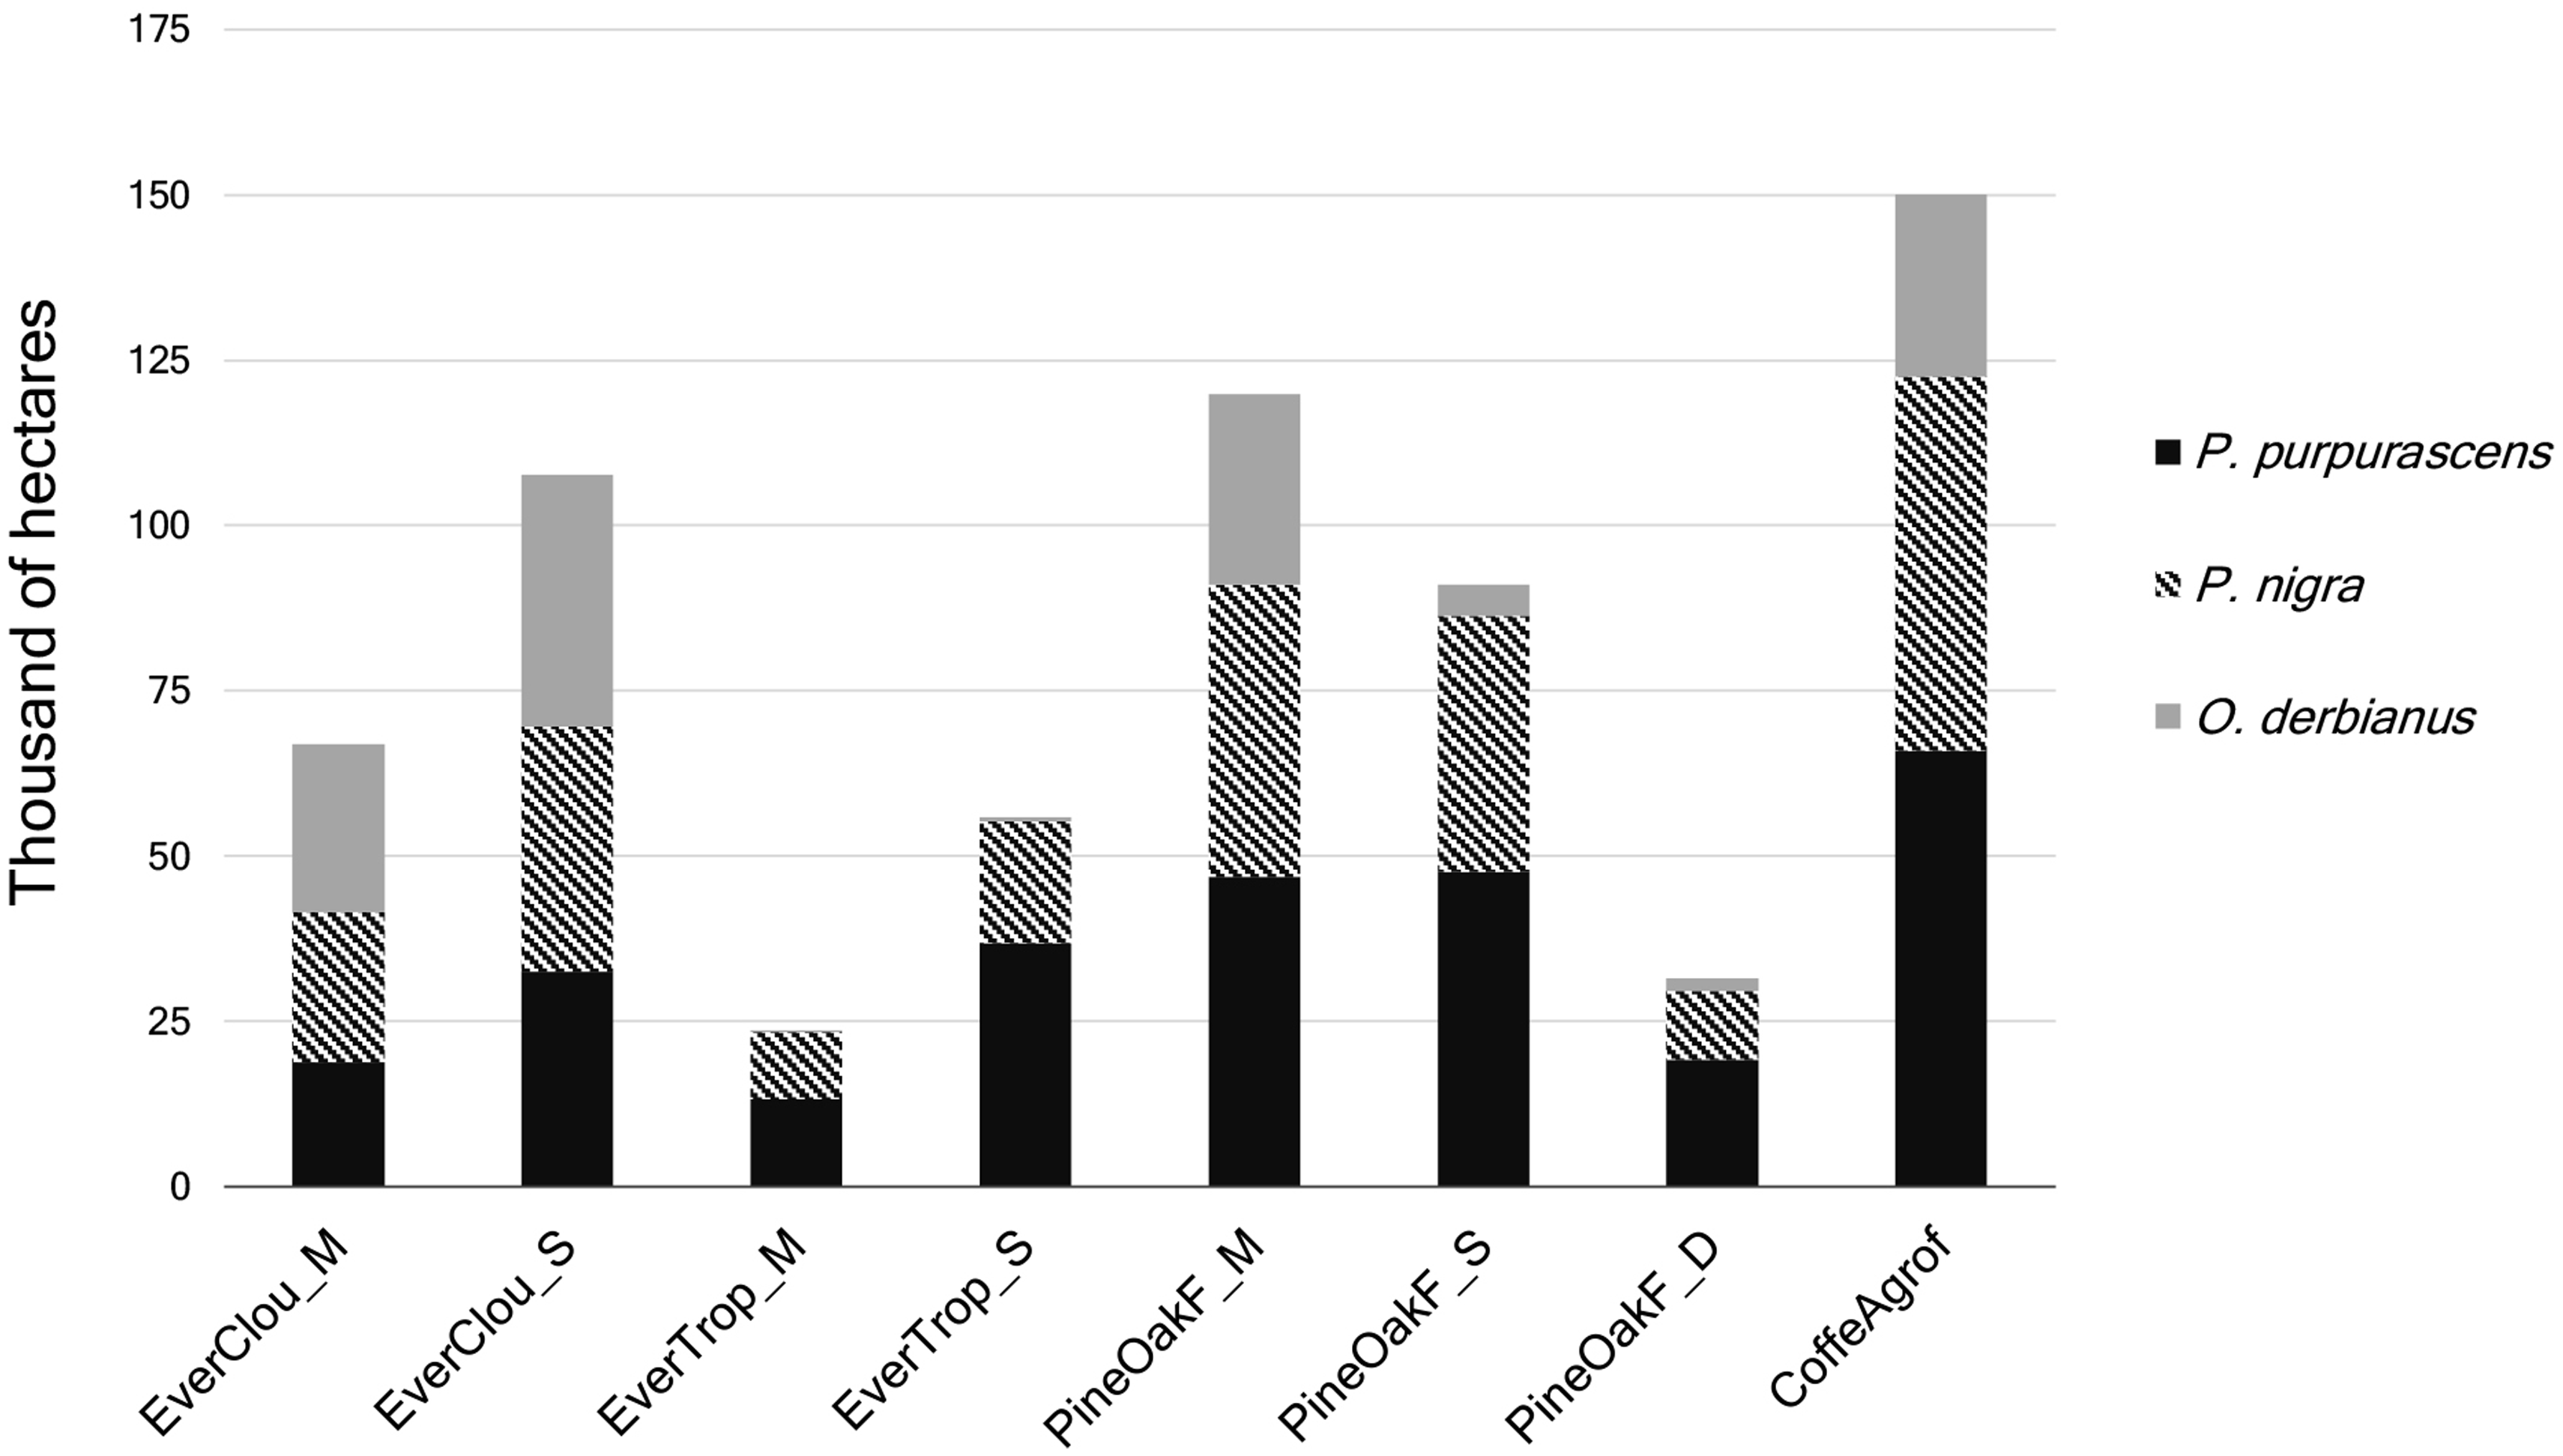
Main vegetation types and land uses in the habitats of the three cracid species. Land cover and land uses of less than 1% of the study area were not included. EverClou_M = mature evergreen cloud forest; EverClou_S = secondary evergreen cloud forest; EverTrop_M = mature evergreen tropical forest; EverTrop_S = secondary evergreen tropical forest; PineOakF_M = mature pine-oak forest; PineOakF_S = secondary pine-oak forest; PineOakF_D = disturbed pine-oak forest; CoffeAgrof = coffee agroforestry systems.

Surface area occupied by the three cracid species in each protection or management zones in the study area.
Ecological Condition Index
The ecological condition index showed that mature forests provided the highest richness of tree species, the most significant vertical and horizontal structure, lowest levels of disturbance, and, in general, best habitat quality, while agroforestry systems presented the most considerable disturbance and lowest quality of habitat (Figure 7).

Index of the ecological condition of the sites grouped by land-cover/land-use type. 733 × 388mm (120 × 120 DPI).
Landscape Fragmentation
According to the fragmentation indexes, the structural connectivity of the habitat of the three species is still at an intermediate level; for example, in all cases, the contagion index was higher than 50% (Table 2). At the class level, mature evergreen cloud forest was the least fragmented, while mature, secondary, and disturbed pine-oak forests and secondary evergreen cloud forest were the highest fragmented classes, consistently both IJI and PD had higher values (Table 3).
Landscape-level metrics for three cracid species in the SMSMBC.

Note. SMSMBC = Sierra Madre del Sur Mesoamerican Biological Corridor; CONTAG = Contagion; PD = patch density; NP = patch number; ED = edge density; IJI = interspersion and juxtaposition index.
Structural Class-Level Metrics for the Habitat of the Three Cracid Species in the Study Area.

Note. EverClou_M= mature evergreen cloud forest; EverClou_S = secondary evergreen cloud forest; EverTrop_M = mature evergreen tropical forest; EverTrop_S = secondary evergreen tropical forest; PineOakF_M = mature pine-oak forest; PineOakF_S = secondary pine-oak forest; PineOakF_D = disturbed pine-oak forest; TropDeci_S = secondary tropical deciduos forest; RiparVeget = riparian vegetation; CoffeAgro = coffee agroforestry systems; CocoaAgrof = cocoa agroforestry systems.
Coffee agroforestry systems had the largest fragment size (LPI) in the habitat of P. purpurascens (6,211 ha) and P. nigra (4,271 ha). The mature evergreen cloud forest for O. derbianus had the largest continuous forest fragment size (LPI = 6,072 ha). For the P. purpurascens habitat, the main land cover were coffee agroforestry system, mature and secondary pine-oak forest. Mature evergreen cloud forest and coffee agroforestry systems had the largest mean patch size (Area_MN = 24 ha and 22 ha, respectively), which represented habitat availability for this species (Table 3).
In the P. nigra habitat, mature and secondary pine-oak forests and secondary evergreen cloud forests were widespread but very fragmented, the coffee agroforestry systems presented a more compact area and the largest mean patch size (85 ha). In O. derbianus habitat, mature evergreen cloud forest, secondary pine-oak forest, and coffee agroforestry systems were predominant. The latter presented the largest mean patch size (35.5 ha), indicating opportunities for movement and resources but also a lower quality habitat for this species, which is dependent on specific cloud forest conditions. Mature evergreen cloud forest had the second largest mean patch size (24 ha) and the largest continuous forest patch size (6,072 ha), this implies availability of habitat that is suitable for this species (Figure 3).
Functional Connectivity
The habitat of the three species was connected through a single node or patch that almost occupied the entire area. In the P. purpurascens habitat, the central node (243,703 ha) corresponded 50% to 35% of the dIIC and 95% to 93% of the dPC for dispersal distances of 10 to 15 km. The main contribution of this node was as a flow facilitator and as a priority corridor (Figure 8). In addition, three zones with low values of dIIC were identified (Figure 8, Zones a to c). Zone a in Figure 8 is composed of 24 patches (ranging from 20 to 1,149 ha) that function as flow facilitators; the largest node in this zone also acts as a stepping stones connecting the north of the study area. Finally, Zones h and i in Figure 8 are composed of patches ranging from 21 to 171 ha and 20 to 1,059 ha, respectively, function as flow facilitators. These zones and patches with less connectivity as a whole comprise an area of 20,557 ha, composed by secondary tropical forest (37%), secondary pine-oak forest (16%), disturbed pine-oak forest (13%), coffee agroforestry systems (8%), and other forest types (26%).
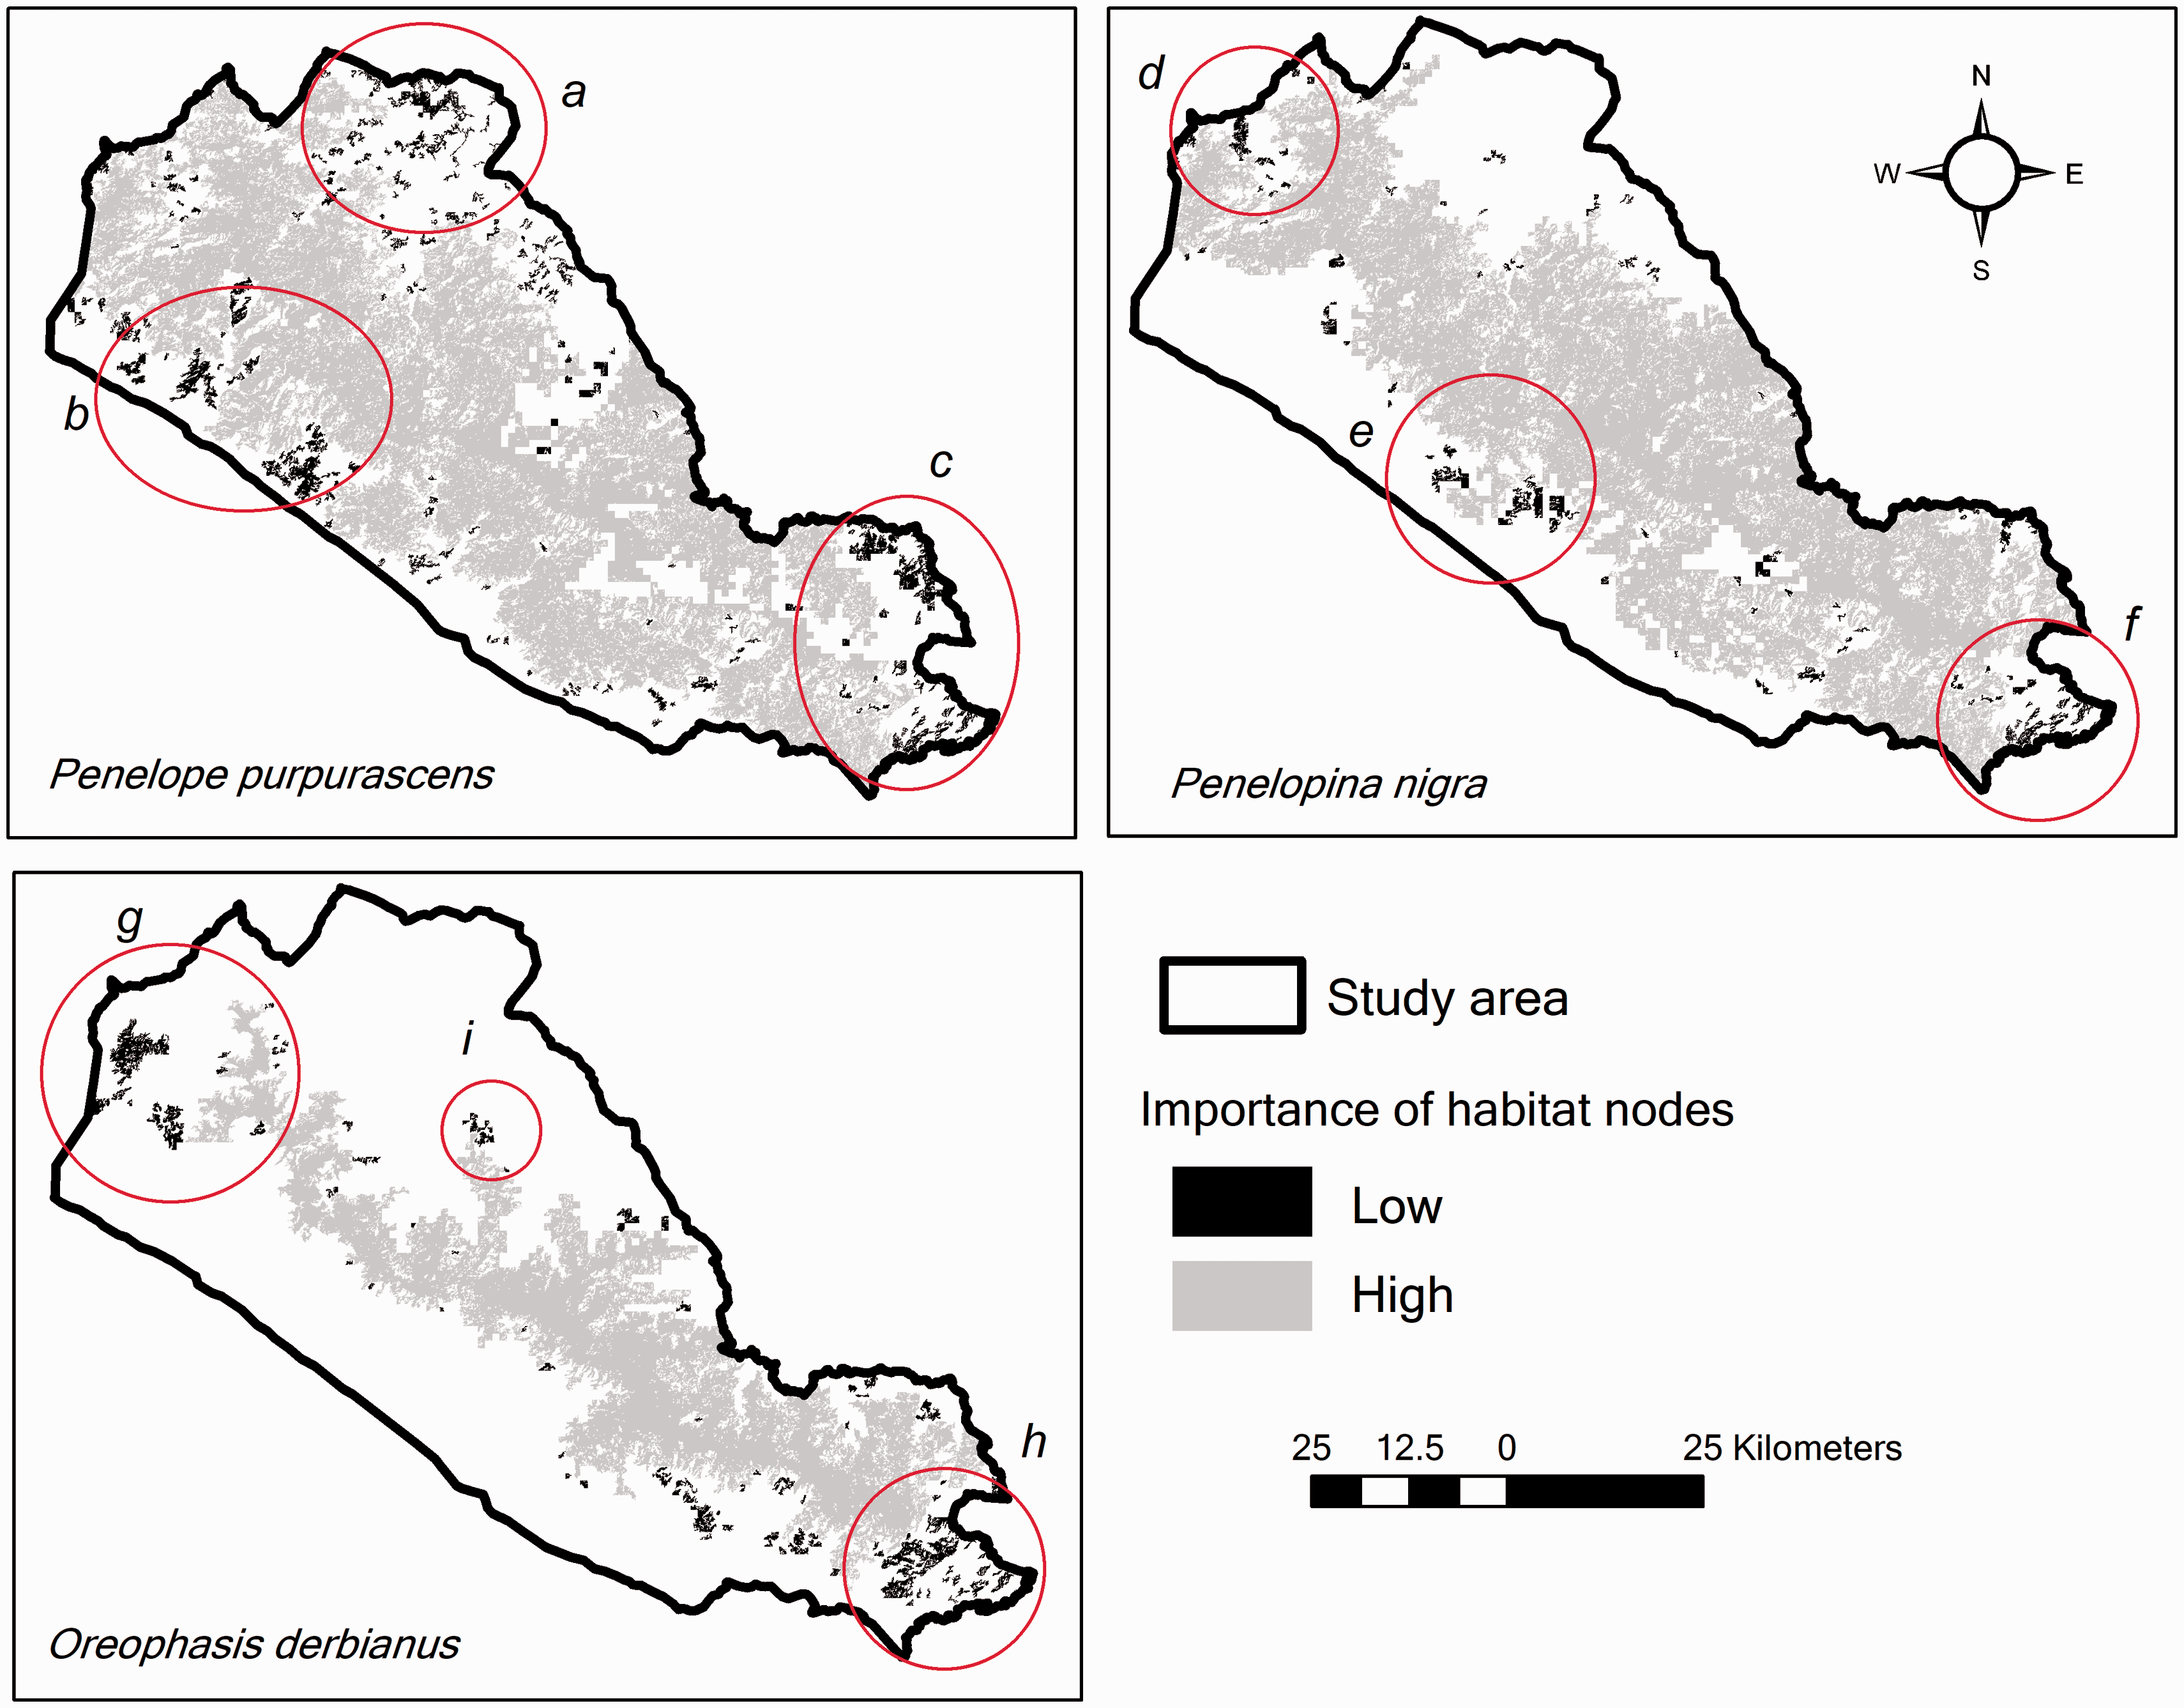
Connectivity level (dIIC) of habitat nodes for functional connectivity of P. purpurascens, P. nigra, and O. derbianus, based on three dispersion distances for each species. The red circle indicates the areas with lower functional connectivity for each species.
In the P. nigra habitat, one single node (229,923 ha) represented 99.9% of the dIIC and dPC in the network. This node contributes as a habitat provider (dIICintra) and as a priority corridor for this network (dIICconnect). Besides, three main zones with low connectivity values (dIIC) were identified (Figure 8, Zones d to f). Zone d in Figure 8 is composed of nodes (ranging from 41 to 572 ha) that function as flow facilitating elements. Zone e in Figure 8 functions as flow facilitator and it is made of four nodes (128 to 517 ha) with abandoned coffee-growing areas now under regeneration process due to the inhabitants being relocated to other areas after they were affected by Hurricane Stan. Zone f in Figure 8 had nodes (58 to 493 ha) that function as connectors to the south of the Sierra Madre de Chiapas. The nodes of lowest connectivity values occupy a total area of 8,510 ha and area composed mainly by secondary tropical forest (23%), coffee agroforestry systems (23%), secondary pine-oak forest (16%), disturbed pine-oak forests (10%), and, to a lesser extent, other types of forests (27%).
In the O. derbianus habitat, a single node of 115,702 ha represented connectivity value higher than 99% for dispersion distances of 0.5 to 1.5 km (Figure 8). The main roles of the nodes were as habitat providers (dIICintra) and as facilitators of the flow of the species between fragments (dIICflux). Besides, three zones with less connectivity were identified (Zones g to i in Figure 8); Zone g in Figure 8 functions as flow facilitators toward La Frailescana and the north of the Sierra Madre. Zone h in Figure 8 functions as a stepping stones (dIICconnect) to the south of the Sierra Madres; this zone was made up for one larger node and several smaller, isolated, and heterogeneous patches. Small patches without connection compose Zone i in Figure 8. The nodes with the least connectivity occupy a total of 11,529 ha and are composed mainly of coffee agroforestry systems (40%), mature pine-oak forest (27%), secondary evergreen cloud forest (14%), and, to a lesser extent, other types of forest (19% overall).
Discussion
Habitat Map and Ecological Condition
Analysis of the ecological condition data showed that mature forests presented the best habitat quality, because of their higher structural complexity, higher tree species richness, and lower levels of disturbance. Coffee agroforestry systems presented higher levels of anthropic disturbance. In the study area, although forest cover occupied between 41% and 86% of the potential distribution areas of the species studied, only 11% to 15% of this coverage corresponds to mature forest; disturbed forests, and agroforestry systems occupy the rest. The ecological condition will have a differentiated impact on the species studied.
O. derbianus is recognized as being dependent on evergreen cloud forest and sensitive to disturbance (González-García, 2012), but most of the information is restricted to the breeding season (González-García, 2017). Nevertheless, in this study, we include other types of forests and coffee agroforestry systems in their habitat due to recent evidence of their presence in these forests and land use in El Triunfo and La Frailescana (Ciro Mejía Martínez, personal comm., June 29, 2017; Francisco Murguía Community Monitoring Brigade, June 21, 2018). In La Frailescana, O. derbianus has been recorded in lower elevations of its altitudinal range (900 m asl), which still requires further investigation (Bioconciencia, 2016).
Factors causing a decline in O. derbianus populations in addition to those mentioned earlier include the establishment of new coffee plantations and the effects of climate change (González-García, 2017; Peterson et al., 2001). Our results indicated that only 20% of its habitat remains as mature evergreen cloud forest, other types of forests with different degrees of fragmentation and disturbance and coffee agroforestry systems occupy the rest. However, these alternative forms of land use conserve relative permeability of movement between fragments of mature forest, which could be buffering the habitat as a whole, mitigating disturbance and improving connectivity (Cayuela, Golicher, & Rey-Benayas, 2006). Nevertheless, more studies are needed to define the impact that the lower quality of resources provided by these fragments could have on the health of populations of this species.
On the other hand, P. nigra can be considered as the species with the most optimal habitat conditions because it has the higher tolerance for disturbed forests and shaded coffee agroforestry systems of native trees, some of which produce the fruits on which this species feeds. In El Triunfo, it has been reported as common in moderate-sized populations, but it is recognized that in some sites these birds require adequate protection against hunting and deforestation (González-García, 2009; López et al., 2014). P. purpurascens prefers mature or slightly disturbed forests with a high proportion of vegetation cover in which it is rare (González-García & Martínez-Morales, 2010).
Habitat Connectivity
The study area presents an intermediate level of connectivity (Contag ≥55.9 and ≤68.6, IJI ≥ 57.3 ≤ 72.1%) for the three species. In particular, the mature, secondary, and disturbed pine-oak forests; the secondary evergreen cloud forest; and the mature and secondary evergreen tropical forests present the highest degree of fragmentation. On the other hand, functional connectivity analysis showed that habitats are connected for all three species through a main node, due to the large proportion of coffee agroforestry systems that connect forests in the middle and high elevations of the Sierra Madre de Chiapas. The patches with less functional connectivity are located toward the periphery of the habitat of each species and are immersed in an inhospitable matrix of agricultural land use and occupy a large area: For P. purpurascens, this was 20,557 ha (Figure 8, Zones a to c), for P. nigra of 8,510 ha (Figure 8, Zones d to f) and for O. derbianus of 11,529 ha (Figure 8, Zones g to h), occupied by mosaics of forests and agroforestry systems. It is important to conserve these fragments insofar as they connect with other larger areas and for the value of their coverage for the conservation of each species, so it would be advisable to apply restoration strategies that maintain the connectivity of the species to these habitat remnants.
An improvement in the structural connectivity of these species would require establishing stepping stones patches with tree species that produce the fruits on which this especies feed and other types of links between the areas of remaining tropical forests in social (ejidos) and private properties in the lower parts of both slopes of the Sierra Madre. On the other hand, since these are landscapes managed by humans, fruit trees can be maintained or augmented in these systems to ensure the long-term survival of these frugivorous species (Sekercioglu et al., 2007). This can only be achieved by creating agreements with local landowners and stakeholders through land-use policies and conservation incentive schemes (Sibelet, Chamayou, Newing, & Montes, 2017).
Implications for Conservation
The landscape mosaic is predominantly connected by a matrix of coffee agroforestry systems in which the habitat fragments of the three species are immersed, so the maintenance of the connectivity of the species depends to a great extent on improvement in the structure of these systems. However, the incidence of pests and diseases in coffee plants have increased, and government policies have promoted rust-resistant varieties that do not require shadow of the canopy, as a strategy to counteract these problems. As a consequence, in recent decades, shaded coffee plantations (i.e., with a native tree coverage than regulate light quantity reaching coffee plants) in the Sierra Madre de Chiapas have been transforming to different management intensities, from monospecific leguminous shade trees (Inga), to industrial plantations with little or no shade (Dietsch, 2000; Williams-Guillén & Perfecto, 2010). With this trend, agroforestry systems could themselves be expanding the frontier of matrices hostile to forest-dependent species and also exerting intense pressure to change land use in adjacent areas to current connectivity. In that sense, it is essential that these kinds of agroforestry systems do not continue to increase at the expense of the primary and secondary forests.
Another threat to functional connectivity of these species is illegal hunting, because it reduces the efficiency of these areas to supporting wildlife movement, turning them into ecological traps that reduce the viability of the populations (Brodie et al., 2016). Illegal hunting is a common practice in the unprotected SMSMBC area and in Paxtal (where there is no staff to manage and prevent it) and to a lesser extent in all other SMSMBC protected areas (Figure 5). This situation is worrying because most of the habitat of P. purpurascens and P. nigra and a significant proportion of the habitat of O. derbianus are outside the protected natural areas. In some sites south of the SMSMBC, no individuals of these species have been observed for several years. Therefore, it may be necessary to establish environmental education strategies for the population living in these areas to ensure the management, survival, and flow of the populations of these species in their remaining habitats.
Additional threats include deforestation due to agricultural activities, poor management of forest exploitation, urban expansion, soil pollution by agrochemicals in the upper basin, and cattle expansion in unsuitable areas (Domínguez-Cervantes, 2009; Juan Pérez, 2017). Finally, it has been estimated that 13% of Mexico’s temperate forests, especially pine-oak forests, will be lost because of climate change. This is particularly significant for O. derbianus since it has been estimated that its distribution will be reduced due to fragmentation, loss of habitat, and effects of climate change (Peterson et al., 2001; Rojas-Soto, Sosa, & Ornelas, 2012; Villers, 1998).
Footnotes
Acknowledgments
The authors are grateful to the staff of the ECOSUR’s Geographic Analysis Laboratory for their support in the classification of satellite images. The authors also thank Guillermo Velasco Barajas for his logistical support during the design of this project, for his intermediation with other organizations, and for the information provided about the study area; the directors, technical, and operational staff of La Frailescana and El Triunfo for their collaboration and logistical support in the field; and the following institutions in the study area: CONABIO (Regional coordination in Chiapas and Tabasco, and Territorial analysis coordination), CentroGeo, and Secretaría de Medio Ambiente e Historia Natural for the databases and geographic information provided; Cooperative AMBIO, El Triunfo Conservation Fund (FONCET, from its designation in Spanish), Pronatura Sur, A.C., Comon Yaj Noptic, Intercommunity group of territorial action of micro-watershed La Suiza, the coffee organization CESMACH, and Regional Association of Silviculturists Sierra Motozintla A.C. for their collaboration and logistical support and for providing the databases and useful documentary and geographical information. The authors thank community monitoring brigades of the Piedras Negras, Plan de Ayala, Nuevo Reforma Agraria, San Juan de los Ángeles, and Francisco Murguía for their support with the fieldwork; Israel Cárdenas Mayorga for the technical and logistical support during the fieldwork; the authorities and inhabitants of ejidos and communities; small and large landowners for allowing to carry out the tours and fieldwork.
Declaration of Conflicting Interests
The author(s) declared no potential conflicts of interest with respect to the research, authorship, and/or publication of this article.
Funding
The author(s) disclosed receipt of the following financial support for the research, authorship, and/or publication of this article: Socio-environmental Innovation GIEZCA provided financial support for field data collection. Ecometrica and the British Space Agency provided the financial support through the Forests2020 project for the production of high-resolution maps and for the publication of this article. The National Council for Science and Technology, Mexico (CONACyT, from its designation in Spanish) granted a scholarship to the first author to pursue PhD studies.