
Abstract
A change in seasonal flooding cycles in the Amazon may negatively impact nesting success of the Giant South American Turtle (Podocnemis expansa). Our aim was to devise a technique that could be replicated in the entire Amazon basin, for monitoring alterations in fluvial cycles and their effects on turtle nest mortality. We mapped the spatial distribution and height of P. expansa nests and tested the effects of different inundation scenarios within the Trombetas River Biological Reserve, Para state, Brazil. We also used historical data on water level and hatchling production to test whether the sharp decline in the Trombetas River P. expansa population over the past thirty years was related to detected changes in the flood pulse. Our models indicate that an increase of 1.5 m in the water level is sufficient to decrease the time of exposure to less than the minimum required for incubation and hatching (55 days above the water) in 50% of the nesting area. This model explains the low hatchling production in dry seasons when the total nesting site exposure was less than 200 days. Since 1971, there was an average decline of 15 days per decade in sandbank exposure during the nesting season (a total of 62 days from 1971 to 2015). However, the decrease in sandbank exposure was not significantly correlated with the sharp decline in hatchling production. Changes to the water cycle in combination with the main sources of decline (overharvest, construction of dams, and dredging of riverbeds) might have an accumulative effect on P. expansa populations.
Introduction
Global warming and associated climatic change are unequivocal, and are likely to alter global and regional precipitation and atmospheric pressure patterns (IPCC, 2013). The Amazon basin is highly vulnerable (Fearnside, 2009; Marengo, 2004; Nobre, Sampaio, & Salazar, 2007), because climate change can potentially affect not only temperature but also regional hydrology (Costa & Foley, 2000; Costa, Botta, & Cardille, 2003; Foley, Botta, Coe, & Costa, 2002; Foley et al., 2005; Guimberteau et al., 2013; Schöngart & Junk, 2007). The periodic inundation of Amazon rivers, called the flood pulse, is vital to the continuation of its ecological processes (Junk, Bayley, & Sparks, 1989). Alterations in the pulse in extremely dry or wet years may seriously impact the region’s flora and fauna (Schöngart et al., 2004; Vale, Filizola, Souza, & Schongart, 2011). Furthermore, interactions between deforestation and climate change might result in drastic changes in the river flooding regime and increase the frequency and amplitude of extreme events (Cook & Vizy 2008; Fearnside, 2006; Gentry & Lopez-Parodi, 1980; Nijssen, O'Donnell, Hamlet, & Lettenmaier, 2001; Nobre et al., 2007; Shukla, Nobre, & Sellers, 1990).
A change in rainfall and flood cycles will have direct impacts on Amazon freshwater turtles. The length of the dry season dictates the reproductive success of riverine turtles. The nesting biology of the Giant South American Turtle (Podocnemis expansa), and other riverine species of the family Podocnemididae is closely synchronized with the flood pulse (Alho & Pádua, 1982a). Nesting and incubation occur during the dry season, and hatching coincides with rising water levels (Alves-Júnior et al., 2012; Pantoja-Lima et al., 2009; Pezzuti & Vogt, 1999; Thorbjarnarson, Perez, & Escalona, 1993). Nesting can only take place during relatively dry periods because riverine sandbanks are under the water during the wet season (Alho, Danni, & Padua, 1985; Pantoja-Lima et al., 2009; Pezzuti & Vogt, 1999) A premature rise in water level at the end of the dry season causes flooding of nesting areas and consequent death of embryos (Vanzolini, 2003). Nest mortality due to flooding ranges from zero to 100%, depending on the year, area, and species (Alho & Pádua, 1982b; Ferreira-Júnior & Castro, 2010; Hildebrand, Bermúdez, & Peñuela, 1997).
Riverine turtles from the family Podocnemididae are an important source of protein for local human populations and have a long history of overexploitation (Bates, 1876; Johns, 1987; Mittermeier, 1978). The obvious decline of riverine turtles in the Amazon, in particular the P. expansa, was recognised in the 1970s, prompting various government and community projects to protect and manage their populations (Rodrigues, 2005). Their efforts for the conservation of P. expansa in the Brazilian Amazon were pioneering and are remarkable in that they have been long-term and widespread (Rylands & Brandon, 2005; Rylands & Pinto, 1998). Such efforts include forty years of monitoring and management of nesting areas, and the creation of Biological Reserves with the primary purpose of protecting nesting sandbanks. These Reserves are, theoretically at least, protected areas for the sole purpose of conservation and research (Cantarelli & Herde, 1989).
Currently there are a series of programs managed by national and state governments, local communities, and NGOs focused on the conservation of P. expansa. The Brazilian national government program alone is probably the most extensive wildlife conservation endeavour focused on a single group of animals in the Amazon. It may also be the largest conservation program for any species of freshwater turtle in the world. The “Reserva Biológica do Rio Trombetas” (Trombetas Reserve) is one of the best examples of long-term wildlife conservation in the Amazon (IBAMA, 1989; RAN-IBAMA, 2003). The management and protection of turtles in this area began in 1976. The Reserve was created in 1979 with the almost exclusive aim of protecting P. expansa in the Trombetas River (IBAMA, 1989). However, despite the long-term management and protection of nests and turtles, a sharp decline in the number of nesting females (based on regular surveys of the protected beaches) has been observed in the past 30 years in the Trombetas River (RAN-IBAMA, 2003).
Changes in the annual flooding cycle of the Amazon River and its tributaries due to climate change could increase the number of years with a short dry season. Shorter dry seasons would affect the availability of nesting sandbanks and negatively influence reproductive success. Therefore, it is vital to assess the vulnerability of P. expansa nests to changes in the flooding cycle. The use of Geographic Information Systems (GIS) to map and identify vulnerable nesting areas is a powerful management tool. It can also be used to test the relationship between nest site choice and the probability of nest survivorship under different inundation scenarios. A similar technique was successfully used to model the impact of climate change on sea turtle nesting beaches (Fish et al., 2005; Fuentes, Dawson, Smithers, Hamann, & Limpus, 2010; Fuentes, Limpus, Hamann, &Dawson, 2010); while sea turtle nests are threatened by sea level rise, freshwater turtles are threatened by changes in annual water level cycles, including flood pulses.
We used a simple and inexpensive technique to gauge the effect of alterations in fluvial cycles on P. expansa nest mortality within the Trombetas Reserve. This technique can be replicated and applied throughout the entire Amazon basin. We mapped the spatial distribution and height of P. expansa nests within the Trombetas Reserve and tested the effects of different inundation scenarios on nest mortality. We also used historical data to test whether changes in the water level cycle are related to the sharp decline observed in the Trombetas Reserve P. expansa population over the past thirty years.
Methods
Study site
The Trombetas Reserve is located on the northeast side of the Trombetas River (1°22′19″S; 56°51′30″W), a tributary of the Amazon River in Para state, Brazil. The Reserve encompasses an area of 385,000 ha (Haller & Rodrigues, 2006), incorporating nesting sandbanks and adjacent floodplain and seasonally inundated forest habitats. Podocnemis expansa have been protected from human harvest in this area to some degree since 1963. Protection was initially provided by the Brazilian government “Harvest and Fisheries Department” (Departamento de Caça e Pesca; 1963 to 1965) followed by the “Pará State Ministry of Agriculture” police (Ministério da Agricultura do Pará; 1965 to 1975). In 1976 the Amazon Turtles Project or “Projeto Quelônios da Amazônia” (PQA) was created. Protection efforts under this program were coordinated by the now defunct Brazilian Institute for Forestry Development (IBDF) and then the Brazilian Institute of Environment and Renewable Natural Resources (IBAMA) (RAN-IBAMA, 2003). In 1979 the Trombetas Reserve was created with the central objectives of protect riverine turtles, maintain their genetic diversity, and facilitate research toward best management practices (IBAMA, 1989).
Currently, Podocnemis expansa, the Yellow-spotted River Turtle (Podocnemis unifilis), the Six-tubercled Amazon River Turtle (Podocnemis sextuberculata), and the Big-headed Amazon River turtle (Peltocephalus dumerilianus) are protected from harvest throughout Brazil (Alho, Carvalho, & Pádua, 1979; Haller & Rodrigues, 2006; Vismara, 2009).. Nesting of P. expansa in the Trombetas River occurs from September to November when water levels are low, and nesting sandbanks are exposed and therefore available (Alho & Pádua, 1982b; Haller & Rodrigues, 2006). The main nesting sandbanks for P. expansa in the region are Leonardo, Farias, Jacaré, Uerana, Abuí, Jauary, and Rasa ‘beaches’. The sandbanks are large, over a kilometre long and up to 500 m wide in the nesting season (Figure 1). The Trombetas River is considered a clear water river, originating from the Guiana Shield, with a drainage area of 125,000 km2 (Peña, 2002).
Turtle nesting beaches (Leonardo, Farias and Jacaré) protected in the Trombetas Reserve. Sampled area was defined as the area that encompassed all Podocnemis expansa nests during the 2014-2015 nesting season in the Farias and Jacaré beaches (1°22'19″S; 56°51'30″W).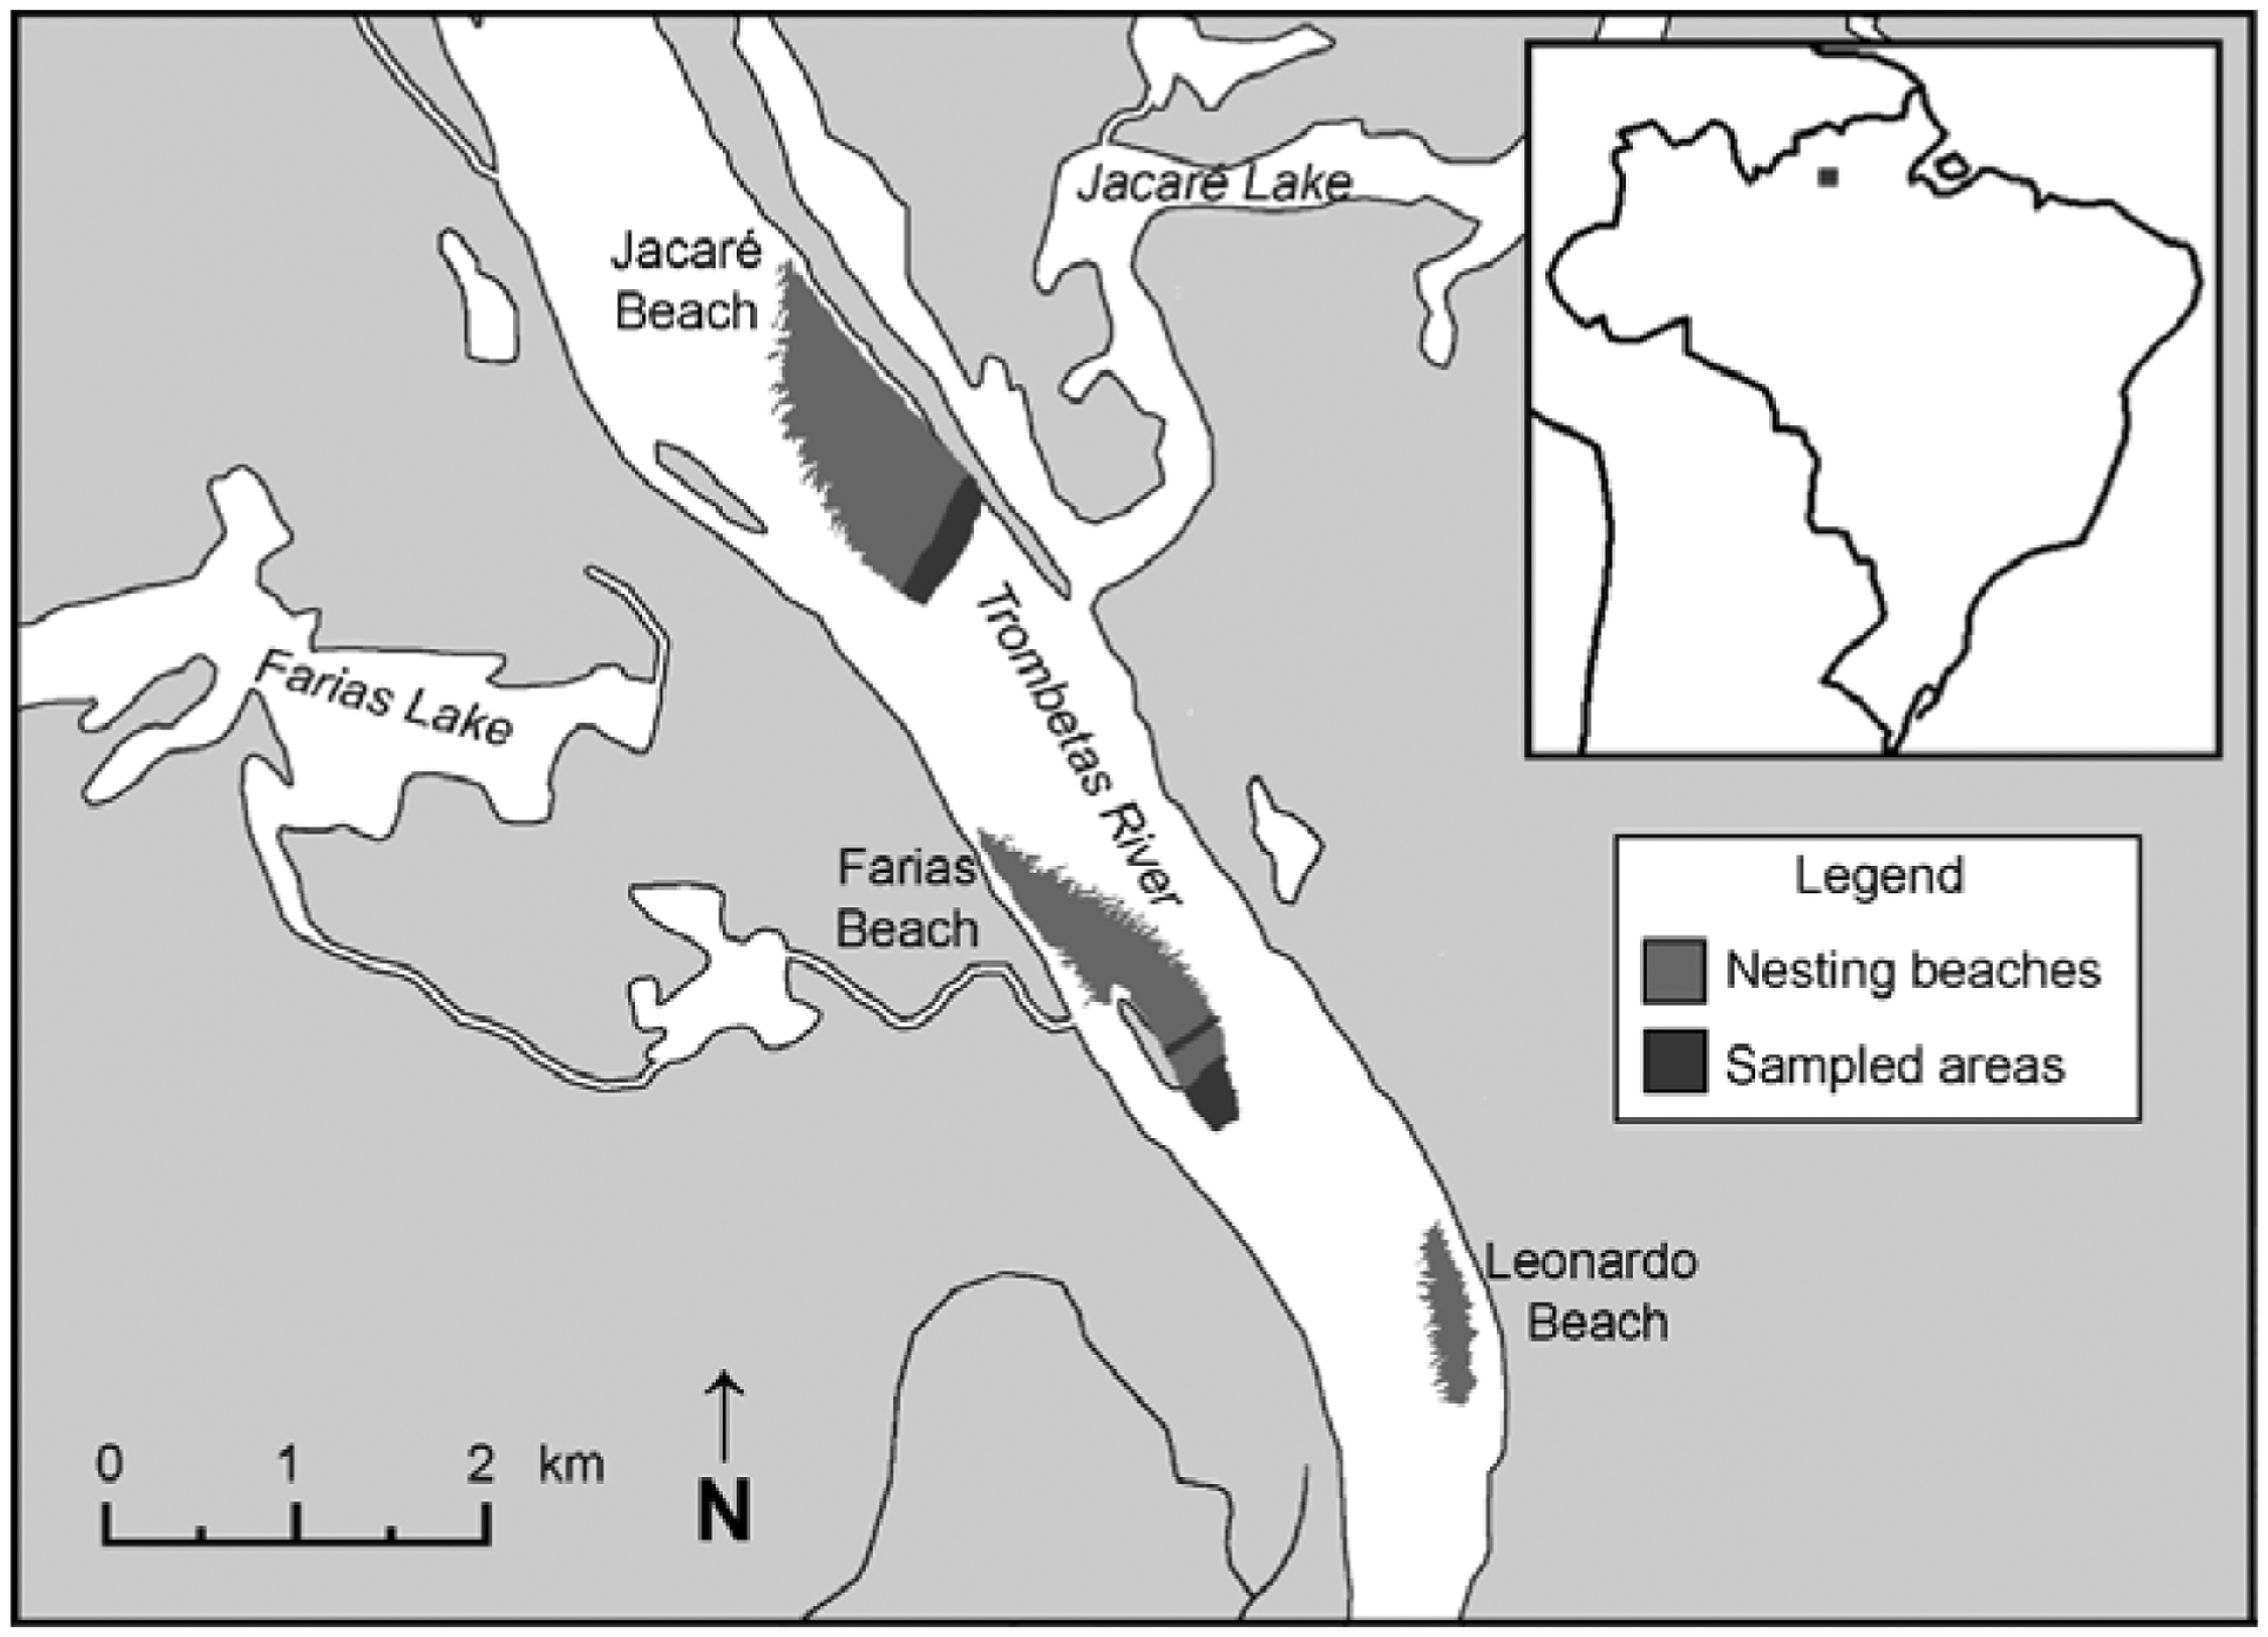
Study design and analyses
We estimated the area of the three main protected sandbanks in the Trombetas Reserve (Leonardo, Farias, and Jacaré: 1°22′19″S; 56°51′30″W; Figure 1) by walking the boundary with a GPS (Garmin GPSMAP 62 S). Although few or no nests have been observed at Leonardo in the past two decades, this sandbank was included in our study because of its importance as a nesting site in the 1970s (Alho et al., 1979)..
To compare the topography of the general nesting area with the height of individual nest sites, we obtained heights above water level (sample points) in a grid pattern over the entire nesting area. Sample point heights were recorded every 10 m along parallel lines spaced 10 m apart, forming a series of 10 m2 quadrats. We used a compass, a tape measure and a line level (precise to 0.5 cm) to establish the grid and measure the points. Measurements were taken during the peak of the dry season, following P. expansa nesting, and did not interfere with egg laying. Nest sites could be easily identified after egg laying due to the conspicuous depression left by the nesting female. Most nests were also marked with stakes by park rangers who monitor and protect the sandbanks. The sample areas were defined as the part of the sandbanks where P. expansa nests were observed in 2014 (Figure 1).
We calculated nest height using the average of the four corners of the 10 m2 quadrat where each nest was located. Sample points and nest site locations were georeferenced with a GPS and mapped using the freeware GIS Viewer ESRI ArcGIS Explorer Desktop (available from http://www.esri.com/software/arcgis/explorer-desktop). A two-way analysis of variance (ANOVA) was used to test whether total height (dependent variable) differed between sample points and nests, and between Farias and Jacaré beaches.
To allow comparisons of nest height among years and studies, we converted the measured height to total height (total height = measured height + water level during the sampling period). This was used to standardize height against zero water level (Ferreira Júnior & Castro, 2005, 2010). Since 2007 the water level has been recorded twice a day (early morning and late afternoon) by the park rangers at the Trombetas Reserve Station, using a water-level pole (precision of 1 cm). The pole is located on the opposite side of the river from Farias beach. We used an average river height of 441 cm (sampling period of 30 November to 7 December 2014; water level ranged from 436 cm to 450 cm) to calculate total height.
We used 50% and 100% flooding thresholds to compare nest survivorship among different sandbanks, years, and water level scenarios. Flooding threshold was defined as the water level heights in which 50% and 100% of the nest sites would be completely inundated. In the case of Amazon riverine turtles, an increase in water level could potentially occur at any time during the nesting period; nest mortality by flooding could be the outcome of a short dry season caused by an extreme wet year, or stochastic events such as the “repiquete”, a fast flooding event caused by atypical high precipitation during the dry season (Alho & Pádua, 1982b; Ferreira-Júnior & Castro, 2010; Hildebrand, et al., 1997) To assess nest vulnerability to changes in water level during the incubation period, we assessed nest survivorship on Farias and Jacaré in five different scenarios of river water level (0, +50, +100, +150 and +200 cm).
A nesting site was considered viable if it was outside the water for a minimum of 55 days during the dry season. The 55 days mininum was used because the average incubation period for P. expansa in the Trombetas River is 48 days(Alho & Pádua, 1982a, 1982b), and once the site is outside the water, it takes seven days for the water to drain from the sand and make the site suitable for nesting. These scenarios probably overestimate nest success, since our model does not take into account nest depth. Survivorship is usually compromised before the water level reaches the top of the nest, because P. expansa nests have a mean depth of 82 cm (Alho & Pádua, 1982b; Vogt, 2008).
We used historical water level data from the “Brazilian Water Agency” (Agência Nacional de Águas: ANA – http://hidroweb.ana.gov.br/) to estimate nest site flooding for previous years. Data on water level were available for the Trombetas Reserve from 2007 to 2015. Longer-term water level data were obtained from the nearest available station (downstream of the Reserve) in Oriximiná municipality (1°46′35″S; 55°51′44″W), where records have been kept since 1971. We performed a simple regression to test the relationship between the Trombetas Reserve and Oriximiná water level records. The regression equation was used to determine the Oriximiná water level threshold that would correspond to 100% of nest sites flooding at the REBIO-Trombetas Reserve.
To test the relationship between nest site flooding and P. expansa hatchling numbers, we used historical data from the Brazilian National Centre for Research and Conservation of Reptiles and Amphibians (RAN-IBAMA). Hatchling production data (number of hatchlings recorded from protected sandbanks) were available from 1982 to 2007, with the exception of 1983, 1986, 1989, 1990, 1995, 2004 and 2006. Data were based on the total number of hatchlings at Farias, Leonardo and Jacaré. Nests were protected collectively using a fence or individually using a wooden box with mesh over the top. The proportion of nests protected in these three sandbanks was high and usually greater than 90%. In 2014, 94% of nests at Farias, Leonardo, and Jacaré were protected. We used Spearman correlations to test the relationship among year, the number of hatchlings, and the number of days when 100% of nesting sites were above the water. Statistical analyses were performed using the open-source statistics program R (R Development Core Team 2014 – http://www.r-project.org) and Microsoft Excel 2013.
Results
2014–2015 nesting season
During the 2014–2015 nesting season, the main protected sandbanks (praia or “beaches”) in the Trombetas Reserve were Leonardo (13.6 ha), Farias (49.8 ha) and Jacaré (77.4 ha; Figure 1). The sampled area corresponded to sites where P. expansa nesting was observed in 2014, and encompassed 9.4 ha at Jacaré beach and 6.4 ha (5.2 + 1.2 ha) at Farias beach. No nesting was recorded at Leonardo in 2014. The sampling period (30 November to 7 December) was the peak of the dry season, when the Trombetas River was near its lowest level (Figure 2). During this period, average water height was 441.4 ± 5.4 cm (SD; range 436–452 cm; n = 16). Yearly water level variation (from June 2014 to the end of May 2015) ranged from 402 cm to 1,180 cm.
Water levels in the Trombetas River during the low level season. Lines are individual years for August to April, 2007 to 2015. Straight lines represent the water level threshold when 50% and 100% of Podocnemis expansa nesting sites from Jacaré and Farias sandbanks are flooded. Nesting and hatching periods for the Trombetas River are based on Alho and Pádua (1982).
In total, we recorded 901 grid sample points and 103 nest site locations for Jacaré beach, and 699 sample points and six nest locations for Farias beach. There was an effect of nesting beach (two-way ANOVA, F1,1705 = 117.97, p < 0.001), whereby Jacaré sample points (mean ± SD: 627.9 ± 2.6 cm, range: 441–882, n = 901) were significantly greater than Farias (586.5 ± 3.0, range 441–799, n = 699). There was also an effect of nesting site location (F1,1705 = 146.24, p < 0.001), indicating that nest sites were significantly greater than sample points. Jacaré nests (704.6 ± 5.2, range 587–798, n = 103) were on average 57 cm higher than Farias nests (648.1 ± 25.1, range 540–697, n = 6). We did not find a significant interaction between nesting beaches and sample heights (F1,1705 = 0.22, p = 0.64; Figure 3).
Average and standard error of grid sample points and Podocnemis expansa nest site total heights at Farias and Jacaré nesting beaches during the 2014–2015 nesting season. Nest site heights were significantly higher than sample points (F1,1705 = 117.97, p < 0.001). Jacaré nests were significantly higher than Farias nests (F1,1705 = 146.24, p < 0.001).
Based on recorded nest heights, 100% of nests would be flooded when water levels were higher than 882 cm and 799 cm for Jacaré and Farias beaches, respectively. Inundation of 50% of nests would occur with water levels of 620 cm for Jacaré and 589 cm for Farias. Nesting sites on Jacaré were available for 28 days longer than for Farias (Figures 2 and 4). At the beginning of the dry season nesting sites started to emerge on Jacaré on 28 August 2014, 14 days earlier than Farias (11 September 2014). At the end of the dry season Jacaré nesting sites were completely flooded 14 days after Farias nesting sites (21 March 2015 versus 7 March 2015).
Model for two inundation scenarios (50 and 100% nest survivorship) at two sites, Farias and Jacaré nesting beaches, based on nest site total heights recorded during the 2014–2015 nesting season. Podocnemis expansa nest sites were considered above the survivorship threshold if they were above the water for 55 days or more during the low water season. Increases in water level of +50, +100, +150 and +200 cm are highlighted with symbols.
Water levels and hatchling production
Water levels in the studied nesting season (2014–2015) dropped later than in the previous eight dry seasons (2007 to 2015; Figure 2), but sustained low levels for several months. When we extrapolated nest site heights to previous years, we found that nesting sites on Jacaré emerged on average for 208 days (208 ± 9.7 days; range 195–222) during the dry season. Farias nests were exposed to the air on average 30 days less (177.7 ± 15.1 days; range 158–204). Under the 50% scenario, Farias nesting sites were exposed on average for ten days less (108.0 ± 16.6 days; range 82–126) than on Jacaré (117.7 ± 12.4 days; range: 101–131) (Figure 4).
The regression between the Oriximiná and Trombetas water level stations was highly significant (R2 = 0.97; p < 0.0001; df = 1 241; y = 0.9372x – 166.64). Based on this equation a water level of 660 cm at the Oriximiná station would cover 100% of the Trombetas Reserve nesting sites.
A significant decline was observed in the number of hatchlings produced in the Trombetas Reserve (Spearman rank correlation: ρ = −0.92; p < 0.0001; Figure 5a). There was also a significant decline in the number of days that 100% of nesting sites were exposed during the dry season (Spearman rank correlation: ρ = −0.58; p < 0.0001; Figure 5b). We observed an average decline of 15 days per decade (62 days from 1971 to 2015) of sandbank exposure during the nesting season since 1970.
Number of Podocnemis expansa hatchlings produced and flooding threshold from 1970 to 2007. The number of P. expansa hatchlings was recorded in the Trombetas Reserve from 1982 to 2007. Over the years, there was a significant decline in (a) hatchling production (ρ = −0.92; p < 0.0001) and (b) the number of days nesting areas were above flooding threshold (water level below 660 cm and 100% nest availability) (ρ = −0,58; p < 0.0001). Water level data according to Oriximiná water level station from 1970 to 2015.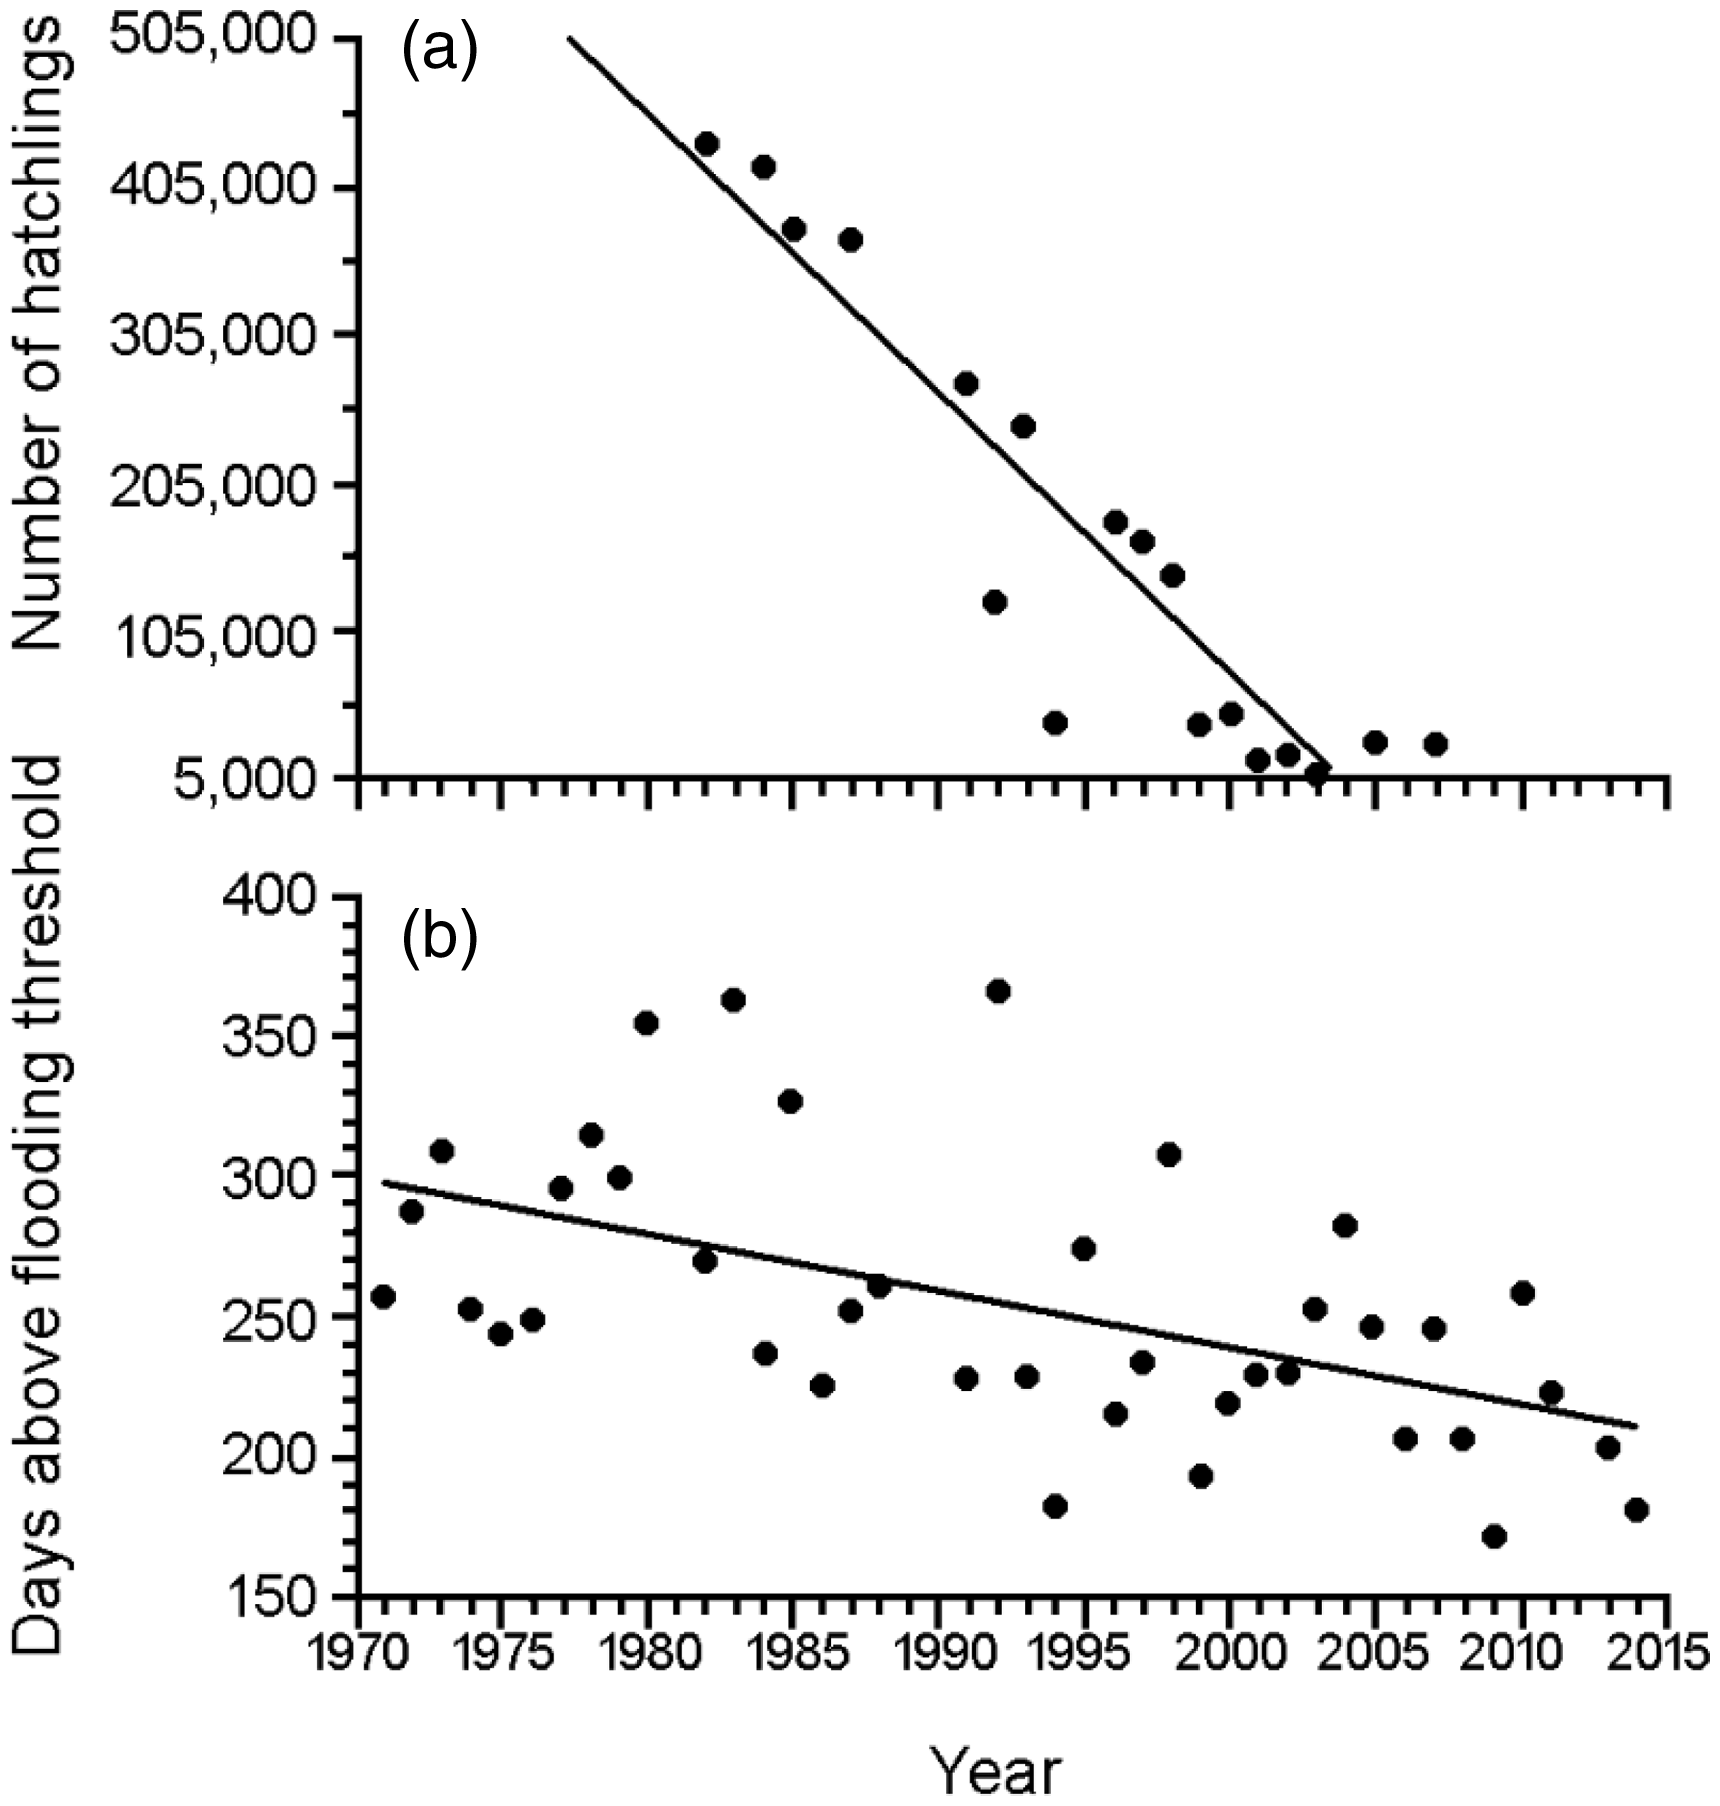
There was no correlation between the number of days when 100% of nesting sites were inundated (Oriximiná water level > 660 cm) and the number of hatchlings produced during the years 1982 to 2007 (Spearman rank correlation: ρ = 0.23; p = 0.35). However, very wet years, when 100% of nesting sites remained flooded for more than 200 days, had reduced number of hatchlings (Figure 6).
Relationship between the number of hatchlings produced at the Trombetas Reserve and the number of days the water level was below 660 cm, and therefore nesting areas were above the flooding threshold (100% of nests inundated). Water level data (1970 to 2015) derived from the Oriximiná water level station.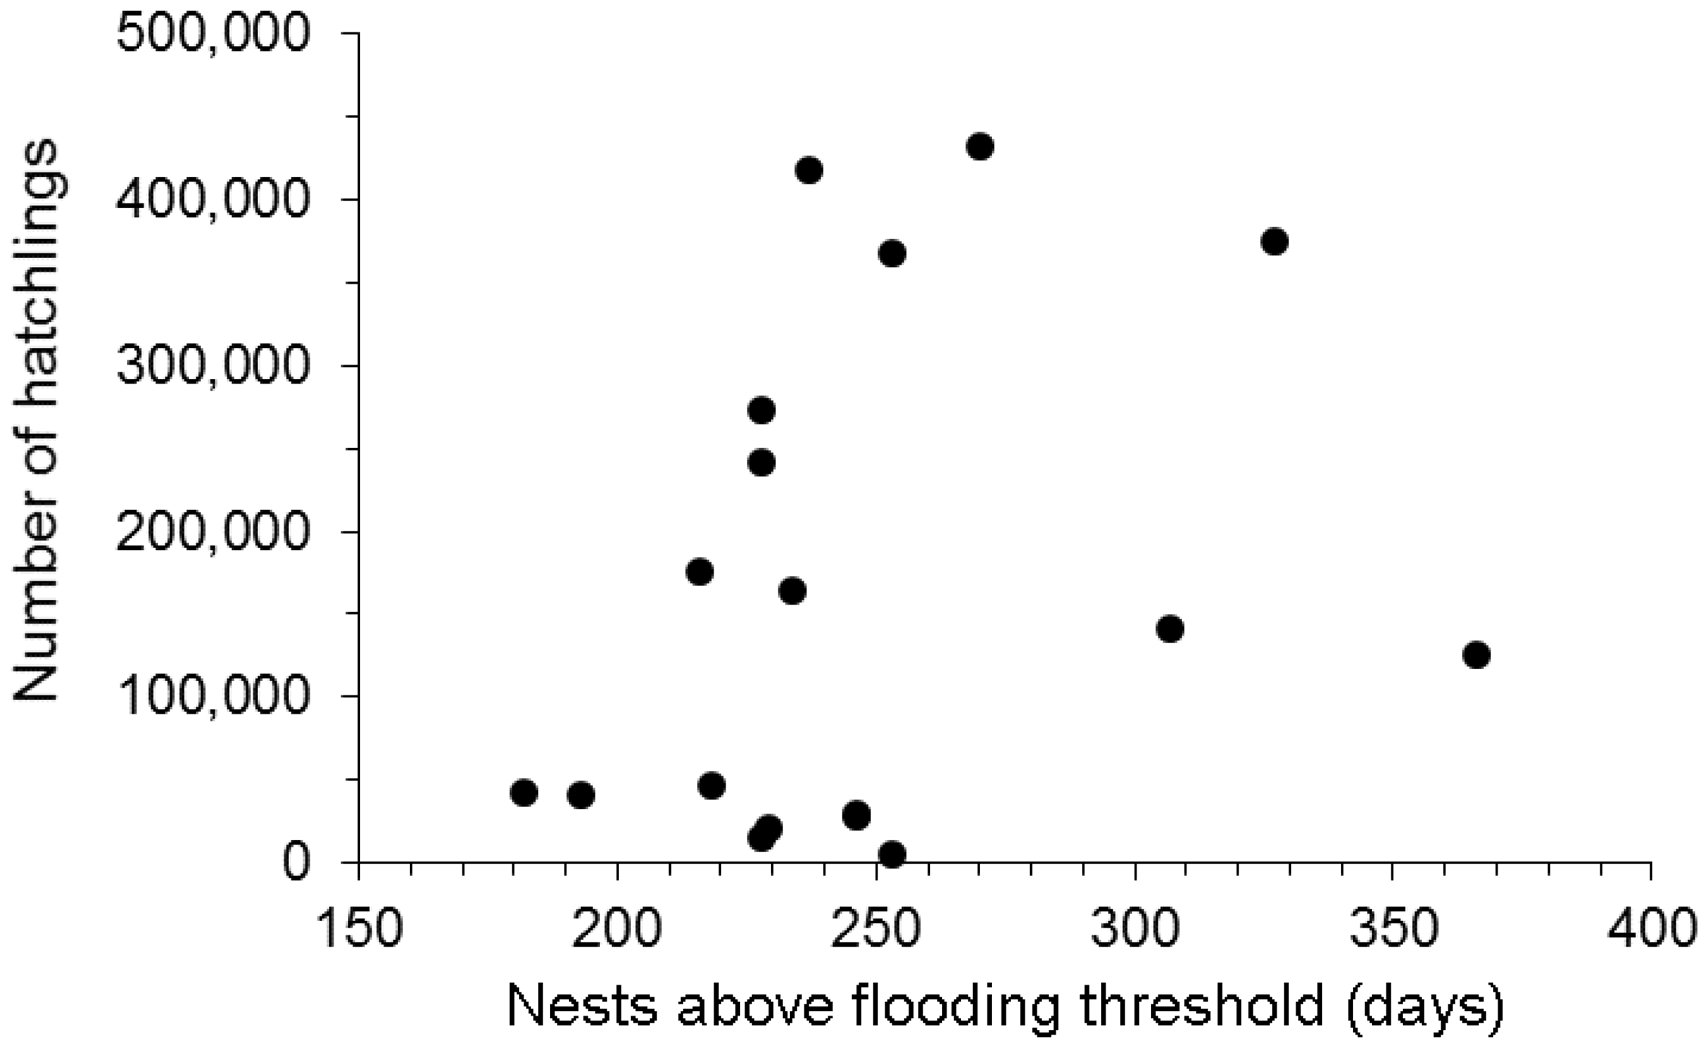
Discussion
2014–2015 nesting season
Because higher water levels result in shorter periods of sandbank availability in the dry season, an increase of 423 cm at Jacaré and 341 cm at Farias above the observed daily level would result in 100% of nest sites not reaching the necessary minimum period required for successful hatchling production (55 days). An increase of only 137 cm at Jacaré and 105 cm at Farias would be enough to place 50% of nest sites below the survivorship threshold (Figure 2).
Maternal nesting behavior has the potential to compensate for climatic changes (Doody, Stewart, Camacho, & Christian, 2012; Urban, Richardson, & Freidenfelds, 2014). According to our results, females of P. expansa nest mostly in the highest sites on the highest beaches. Similar results were found for nesting heights in other parts of Amazon for P. expansa (Ferreira Júnior & Castro, 2005, 2003), P. sextuberculata (Pezzuti & Vogt, 1999) and P. unifilis (Escalona & Fa, 1998; Mitchell & Quiñones, 1994; Thorbjarnarson, Perez, & Escalona, 1993). Choosing the highest possible site is a common strategy for freshwater turtles that nest in riverine sandbanks (Cox & Marion, 1978; Doody, West, Georges, 2003) Nest site selection is usually driven by microhabitat characteristics such as temperature, moisture, substrate, and surrounding vegetation (Brown & Shine, 2004; Clark & Shutler, 1999; Villamarín et al., 2011; Wood & Bjorndal, 2000). Such factors can influence egg survivorship (Ferreira-Júnior, 2009; Ferreira-Júnior & Castro, 2010) and will also be influenced by changes in water level.
Different species of Amazon riverine turtle have distinct nesting site preferences (Vogt, 2008), hence other species of Podocnemis might be more or less vulnerable to changes in the flood pulse than P. expansa. In areas such as the Trombetas Reserve where different species of Podocnemis coexist, P. expansa usually nest higher than P. unifilis and P. sextuberculata (Ferreira-Júnior & Castro, 2010; Souza & Vogt, 1994). Furthermore, the average incubation periods of P. unifilis (68 days) and P. sextuberculata (57 days) are longer than P. expansa (45 days) (Alho et al., 1982b; Fearnside, 2006; Haller & Rodrigues, 2006). However, P. sextuberculata and P. unifilis start laying eggs earlier and their nests are shallower than P. expansa (Fearnside, 2006; Ferreira-Júnior & Castro, 2010; Haller & Rodrigues, 2006; Souza & Vogt, 1994). Detailed studies on nest site heights of other species are needed to assess their vulnerability to an increase in water levels.
Water levels and hatchling production
In extrapolating 2014 nest site data to previous nesting seasons, our model assumed no major changes in nest height distribution over the years. Among years comparisons would only be legitimate if overall nest heights were relatively stable over the years, even with changes in sandbank architecture. Pádua (1981)recorded nest height to water levels of 167 cm, 162 cm, 179 cm and 178 cm on the 24th October 1979 at Leonardo beach in the area where most nests were laid during the 1979–1980 dry season. Taking into account a water level average of 497 cm in October 1979, total height ranged from 575 to 659 cm. These values are within the nest total height range of the 2014–2015 nesting season (540 cm to 798 cm), suggesting that nest heights have been consistent over the years.
Nesting sandbanks in Amazon are usually very dynamic. Sandbank architecture changes following flooding events, even within a breeding season. Therefore, in locations with highly unstable sandbanks, one-year values for nest height distribution might not apply to other years. In such locations nest height should be measured every nesting season, and any extrapolation of the data should be done with caution. However, our study at the Trombetas Reserve suggests that although sandbank topography may change in this area, appropriate height nest sites persist between years.
In addition to water level considerations, the total number of hatchlings produced in a given year is influenced by the number of females laying nests, incubation temperatures, and humidity. To better understand the effect of water level on the decline of hatchling production, we recommend that future sandbank monitoring protocols in Amazon collect data on hatchling success (number of hatchlings in relation to the number of eggs per nest) and nest height.
In comparison to the past seven dry seasons (2007 to 2014), the 2014–2015 nesting season water levels rose and fell later than the average times for these variables. Changes in flooding cycles are likely to affect the number of hatchlings. A premature increase in water levels and consequent nest flooding will result in 100% egg mortality (Ferreira Júnior, 2009; Ferreira Júnior & Castro, 2003). However, a delay in the water level receding at the beginning of the dry season will also have negative effects. It might delay egg laying and induce females to nest on inappropriately steep sites. This would result in an increase in nest loss due to erosion, and excavation of existing nests by females nesting later on the same site (Alho & Pádua, 1982a; Pantoja-Lima et al., 2009).
Changes in nesting season timing might also affect the thermal characteristics of the nest, which can affect incubation period, success rate, and sex ratio of hatchlings (Ferreira-Júnior & Castro, 2010). The sex of Podocnemis species is determined during the incubation period, and nest temperature might be altered by rising water levels, which could potentially skew nest sex ratio (Alho et al. 1985; Souza & Vogt, 1994; Valenzuela, Botero, & Martínez, 1997). Furthermore, stochastic events such as unseasonal flooding during the dry season, a reportedly common source of nest mortality in several regions of Amazon (Caputo, Canestrelli, & Boitani, 2005), might become more frequent with climate change, deforestation, and siltation.
Hatching success is highly variable among nesting seasons at Trombetas Reserve. For example, from 1986 to 1989 hatching success was 88.4%, 51.6%, 86.3% and 76.6% (RAN-IBAMA, 2003). The average success rate for nests protected from predators is 86% (Alho et al., 1982b) and it is suspected that rainfall and hydrology influence egg mortality (ENGE-RIO/Eletronorte, 1998). Water cycles are unlikely to rise over 3.5 m, which is the point where 100% of the nesting sites are flooded. However, an increase of 1.5 m in the water level is sufficient to make half of the nesting sites unsuitable, which might explain the low hatchling production in years when water levels remain high (over 200 days of sandbank flooding, Figure 6). Therefore, our study is novel because for the first time, long-term data were used to link hydrological changes, presumably related to climate change, to a negative impact on the nesting ecology of P. expansa.
Implications for conservation
Implications for turtle conservation at REBIO-Trombetas
From 1981 to 2000 the Amazon Turtles Project (PQA) at REBIO-Trombetas released over five million hatchlings (Figure 7). Despite annual conservation actions, a sharp decline in the number of nests and hatchlings at the protected sandbanks was observed over the past 30 years. Understanding and stopping this decline has been one of the main goals for wildlife managers, park rangers and researchers working on this Reserve (RAN-IBAMA, 2003). We observed a significant decline in sandbank availability during the dry season over the past 40 years. However, hatchling production decline was considerably greater and was not related to sandbank availability. Nevertheless, water cycle changes could combine with the key sources of decline and produce a cumulative effect on P. expansa decline.
(a) Nesting females, (b) nests and (c) hatchling of Giant South American Turtle (Podocnemis expansa) protected at the Trombetas Reserve.
Overharvest is still the main cause of P. expansa decline in the Amazon (Andrade et al., 1988; Kemenes & Pezzuti, 2007; Ojasti, 1967; Schneider, Ferrara, Vogt, & Burger, 2011). Podocnemis expansa is a highly mobile species that can travel over 200 km between feeding grounds and nesting beaches (Hildebrand, Saenz, Pehuela, & Caro, 1988; Pearse et al., 2006). Illegal harvest outside and inside the Trombetas Reserve is probably the main reason behind the population decline. While one side of the Trombetas River is a protected Reserve, the other side is not protected. The area is inhabited by local communities, which continually invade the Reserve with impunity. Based on radio tracking studies, about 20% of the nesting population is lost to poachers (Pearse et al., 2006). There was also evidence that hatchlings produced in the protected beaches were sold illegally to turtle ranchers downstream (Vogt, 2014).
Another management issue which could be affecting P. expansa is the indiscriminate use of hatchling headstarting, a management strategy commonly used by many PQA programs, whereby hatchlings are held in captivity for several months before their release (Alho et al., 1979). However, the biological benefits of headstarting may be exaggerated (Heppell, Crowder, & Crouse, 1996) According to Andrade (2015), when one-year-old P. expansa hatchlings are released, they do not migrate to the feeding grounds. The long-term use of this technique might produce thousands of hatchlings unable to survive in the wild.
Other anthropological disturbances such as hydroelectric dams, roads, and dredging can also negatively impact populations of Podocnemis and their nesting habitats (Alfinito, 1975; Mittermeier, 1978; Smith, 1975). The Trombetas River has been dredged to facilitate boat access to a Bauxite mine (Mineração Rio do Norte) located at Porto Trombetas (Oriximiná), 70 km downstream from the Trombetas Reserve. Dredging of river beds can affect Podocnemis turtles (Haller & Rodrigues, 2006; Moretti, 2004) since it disturbs fluvial sediment dynamics and destroys nesting sites (Rodrigues, 2005).
Another reason for the decline in the number of hatchlings could be the prioritization, monitoring and protection of sandbanks no longer preferred by females. Nesting females respond to erosion of one particular sandbank by nesting in another sandbank with more suitable characteristics. In the past, Leonardo beach was the main nesting sandbank (Valle, Alfinito, & Silva, 1973; Vecchi, 1978), with over 5,000 females nesting in 1978 (Alho et al., 1979). As of 1982, Jacaré beach became the most frequented nesting sandbank in the area (Alho et al., 1982b; RAN-IBAMA, 2003; Valle, et al., 1973; Vecchi, 1978). Jacaré was the beach with the largest area in 2014, and had elevated sample points and consequently higher nesting sites. Due to these features, Jacaré is currently the most suitable sandbank for P. expansa.
Monitoring of sandbanks outside the protected areas should be a priority. Managers should ensure the protection of sandbanks with the highest hatchling production. Otherwise, conservation efforts might prioritize unproductive sandbanks and erroneously infer P. expansa population decline. Studies on P. expansa population structure and females’ movements would also provide valuable information for sandbank prioritization.
Implications for turtle conservation in Amazon
The Amazon Turtles Project (PQA) has protected nesting sandbanks in nine Brazilian states and released over 46 million hatchlings from 1975 to 2004 (Cantarelli, Malvasio, & Verdade, 2014). Its approach ensured a greater degree of protection for P. expansa. Because of logistical and economic constraints, it is crucial to prioritize sites with the highest potential for nesting and hatching success. Therefore, future action plans should consider the impacts of complexities arising from climate and geomorphological changes on key P. expansa habitats, such as nesting beaches (Rodrigues, 2005a, 2005b). Flexible strategies should be developed to mitigate negative effects from both natural and anthropogenic sources.
Controversial translocations of nests are part of many PQA programs. Nests are removed from their original sites and placed in “safer” areas, where mortality is less likely to occur from flooding, natural predation, and human harvest (Pantoja-Lima et al., 2009). However, in many cases, this procedure decreases egg survivorship (Fachín Terán & von Mülhen, 2003; Haller & Rodrigues, 2006; Malvasio, Salera-Júnior, Souza, & Modro, 2005; Vanzolini, 2003; Vogt, Cantarelli, & Carvalho, 1994), and skews hatchling sex ratios (Alho et al., 1985; Souza & Vogt, 1994; Valenzuela et al., 1997). Therefore, the removal of nests from their original site should be avoided. The methods presented in this study can help managers to monitor and predict nest mortality due to flooding. Nests should be translocated only when flood mortality is certain. Nest height data and water level stations can be used for remote monitoring and decision making. Managers should be able to determine water level flooding thresholds and protocols for nest translocation. Water level and nest height monitoring are particularly important in protected areas, where strategies for the conservation of endangered species are applied annually.
Although total nest height is a measurement used in previous studies of Podocnemis nesting habitat (Ferreira-Júnior & Castro, 2003, 2005, 2010), these studies did not extrapolate their results to previous and future nesting seasons. We suggest the methods proposed in our study can be adapted to many riverine turtle conservation programs in the Amazon. The computer programs used in our methods are open-source, and the historical water level data for Brazilian rivers are freely available at ANA’s website (http://hidroweb.ana.gov.br/).
Climate change can modify the Amazon basin hydrology substantially (Guimberteau et al., 2013). Our study and its applications to other areas and species in Amazon can help future conservation programs to predict and respond to changes in the flood pulse. In comparison to other endangered species, the allocation of resources for the protection of riverine turtles has been considerable in the past 30 years. The monitoring and management tools presented in this study are vital for the conservation of Amazon riverine turtles. These techniques can help improve hatchling production and avoid further P. expansa population decline.
Footnotes
Acknowledgments
This study was financed by CNPq (National Council for the Scientific and Technological Development). CCE (process numbers 506128/2013-0 and 233418/2014-8) is a researcher from CNPq. We thank the Tartarugas da Amazônia Project and the Chico Mendes Institute for the Conservation of Biodiversity (ICMBio)/REBIO-Trombetas for logistic support. We are thankful to Manuel Raimundo Santos (Maneco) and the REBIO-Trombetas staff for assistance in the field. Long-term data related to hatchling production were supplied by RAN/ICMBio (Brazilian National Center for Research and Conservation of Reptiles and Amphibians). We are grateful to Dr Stephen Reynolds (CDU), who provided valuable editorial comments on the manuscript.
Declaration of Conflicting Interests
The author(s) declared no potential conflicts of interest with respect to the research, authorship, and/or publication of this article.
Funding
The author(s) disclosed receipt of the following financial support for the research, authorship, and/or publication of this article: The author(s) received financial support from CNPq (National Council for the Scientific and Technological Development, Brazil) for the research presented in this article.