
Abstract
Online travel agencies (OTAs) have become an important driver of business, although their utility remains controversial. While hotels appreciate the resulting bookings, many resent the resulting commissions. While extensively debated in the literature, considerable uncertainty remaining as to whether OTA participation is beneficial or detrimental to hotel profitability. To address this gap, we adopt a transaction cost economics approach, analyzing property-level data from the income statements of 644 U.S. hotels from Smith Travel Research. Findings suggest that OTA participation is positively and significantly related to occupancy, REVPAR and EBITDA at a macro level, with each dollar increase in commission resulting in a 1.123%, $20.20 and $7.08 increase, respectively (2019$s). However, analysis by class reveals that while working with intermediaries drives top-line revenues for all hotels, it is associated with lower profitability for economy properties, implying that OTA participation is not universally good.
Introduction
With hotel owners focused on return on investment, maximizing profitability has become an important issue (Kim et al., 2013; O’Neill et al., 2006). To ensure profitability, given their high fixed cost nature, hotels need to focus on maximizing top-line revenues (Beritelli & Schegg, 2016). However, hotel rooms’ perishable nature means an unoccupied hotel room cannot be stored and subsequently offered for sale at the late date. As a result, selling each and every room each night for the highest possible price is critical to the hotels’ profitability and success (O’Connor & Frew, 2002). To help achieve this, hotels have traditionally made use of multiple simultaneous channels of distribution to reach out to the marketplace (O’Connor, 1999). While previously relying heavily on traditional intermediaries such as high street travel agents and tour operators (Del Chiappa & Balboni, 2019), widespread consumer adoption of digital media has resulted in online channels coming to the fore (Huang et al., 2020), with an estimated 62%, 63%, and 52% of travel revenues originated through online channels in Europe, the United States, and Asia, respectively, in 2022 (PhocusWright, 2023a, 2023b, 2023c).
At a simplistic level, hotels can access the online marketplace in two ways—directly through their own online presence(s) or indirectly through online travel agencies (OTAs; Wynne et al., 2001). These are online platforms that consolidate information, inventory, and pricing from multiple hotels (as well as other travel products), allowing consumers to find appropriate solutions for all their travel needs quickly and easily in a one-stop online travel shop (O’Connor, 2016). Participating on OTA platforms gives hotels visibility, irrespective of their size or location (Pal & Mishra, 2017), allowing them to be sold in markets and to customer segments they would struggle to address otherwise on a pay-per-performance (no sale, no cost) basis.
Overall, the proliferation of OTA channels has had a significant effect on how hotels market and distribute their products (Gazzoli et al., 2008). However, working with OTAs is controversial (Tan & Dwyer, 2014). While hotels appreciate the visibility and resulting bookings (and thus increased top-line revenues) they get from working with OTAs (O’Connor & Murphy, 2008), many resent the subsequent commissions of 15% to 30% that must be paid on each booking delivered (Ling et al., 2015), claiming that such commissions are too expensive and negatively affect profitability (Lv et al., 2020). There are also concerns about channel cannibalization, with critics maintaining that distribution is a zero-sum game, with OTAs, through superior marketing spend as a result of economies of scale, simply displacing bookings that would otherwise go through direct channels, increasing costs unnecessarily (Enz & Canina, 2010; Enz & James, 2017). In contrast, research has shown that, as well as generating indirect bookings, simply being included on OTA channels results in additional direct bookings through the supposed billboard effect, whereby consumers identify suitable solutions through the OTA site but then book directly (Anderson, 2009).
Thus, while the hotel/OTA nexus has been the subject of much conceptual debate and industry speculation, and, with the limited extant literature in disagreement and offering inconclusive findings regarding how OTA participation effects hotel performance, uncertainty remains as to whether working with OTAs is beneficial or detrimental for hotels. Although O’Connor and Frew (2004), in their study establishing how to evaluate distribution channel options, highlighted how financial aspects were the most important decision-making criteria, the question as to whether OTA participation is economically favorable for hotels has yet to be examined empirically.
This study, therefore, sets out to address this deficiency by empirically investigating the association between OTA participation and firm top-line and bottom-line performance in the context of the U.S. hotel sector, leveraging detailed income statement data on 644 hotel properties obtained from Smith Travel Research (STR) to establish whether OTA participation is financially beneficial for hotels. Our findings show that working with OTAs is positively and significantly associated with higher occupancies, higher top-line revenues, revenue per available room (REVPAR), and, except for economy properties, higher profitability. At a macro level, travel agent commissions are positively related to occupancy, REVPAR, and earnings before interest, tax, depreciation, and amortization per available room (EBITDA PAR), with each dollar increase in commission resulting in a 1.123%, $20.20 and $7.08 (at 2019 prices) in each metric, respectively. However, deeper analysis reveals that while working with intermediaries drives top-line revenues for all types of hotel properties, it typically results in lower profitability for economy properties, suggesting that OTA participation may not be for everybody.
The remainder of this article is structured as follows. First, the theoretical foundations of the study are discussed, and research hypotheses are developed. Second, the research methodology is described; the analyses and research findings are discussed; and finally, the conclusions, implications for further research, and limitations are presented.
Literature Review and Hypothesis Development
The study’s theoretical underpinnings can be found in the well-established organizational economics theory of transaction cost (Williamson, 1979). Used extensively in both management (Krzeminska, 2009) and tourism literature (Huang Yin et al., 2019; Stumpf & Swanger, 2017), transaction cost economics conceptually is based on the value chain—the portfolio of value-adding activities carried out by companies to produce their products and services (Kumar & Rajeev, 2016; Porter, 1985). Each activity generates coordination costs, which may be formal (as in the aforementioned OTA commissions) or informal (as in the costs, complexity, and power asymmetry of contract negotiations) (Cetin et al., 2016). Since its boundaries are not fixed, each firm must choose between performing activities internally or purchasing them from the market (commonly known as the build, borrow, or buy dilemma), with the primary decision criterion often the efficiency (in the economic, rather than the accounting, sense) of alternative options (Williamson, 1981; Yin et al., 2019).
Thus, the transaction cost theory fits well with the question of distribution channel optimization, where hotels must choose between driving bookings directly or exploiting the industry value chain partners such as OTAs (Akbar & Tracogna, 2018). According to Iazzi et al. (2018), from a transaction-cost theory perspective, hotels would be better off benefiting from this latter collaborative relationship where experts (i.e., the OTA) can more economically and efficiently perform the distribution function due to economies of scale and scope, allowing the hotel to instead focus on its core customer service function (Donaldson, 1990). However, as highlighted earlier, many disagree, citing the high costs (both financial and strategic) associated with OTA participation.
Despite its importance, issues related to distribution channel management remain an under-researched topic within hospitality and tourism marketing literature (Leung et al., 2015). While Hua et al. (2015) carried out a series of empirical studies in the context of direct (as opposed to indirect) distribution, the limited work on the hotel/OTA relationship (see, for example, Carroll & Siguaw, 2003; Christodoulidou et al., 2010; Ford et al., 2012; Iazzi et al., 2017; Law et al., 2015; Myung et al., 2009; O’Connor & Frew, 2004; Yin et al., 2019) remains primarily conceptual, with few studies testing their resulting proposals empirically.
The limited empirical work that has been done focuses on top-line metrics such as reservations, gross revenues (in effect occupancy by average daily rate [ADR]), or REVPAR. For example, in his landmark Billboard Effect 2009 study, Anderson (2009), using an experimental approach that varied OTA participation and leveraging detailed daily performance data from four hotels over a 3-month period, established that simply being listed on Expedia (one of the major global OTAs) resulted in significantly higher direct reservations by between 7.5% and 26% (in addition to the indirect bookings also generated), thus increasing participating hotels’ top-line revenues. Similarly, in another small-scale study, Majó et al. (2020) demonstrate how increased volumes of OTA reservations for 10 branded hotels in Bogota (Colombia) consistently result in increased direct bookings.
In contrast, using a large-scale, multi-year, survey Beritelli and Schegg (2016) fail to confirm this Billboard Effect in the European context, but do identify that hotels making use of a higher number of online distribution channels typically receive higher volumes of reservations. And, finally, Lei et al. (2019), using a dataset based on 100 budget hotels in China, similarly failed to confirm the positive effect of working with OTAs on top-line revenues, although in this case the peculiarities of the Chinese market, where direct customer contact through WeChat has become the preferred e-commerce channel, must be acknowledged. Thus, despite the potential theoretical benefits highlighted by transaction cost theory, empirical evidence on the positive association between OTA participation and hotel property top-line revenues currently remains comparatively weak. Since wider exposure to potential customers on such powerful distribution channels should lead to increased sales, the following hypotheses are proposed:
However, driving these top-line revenues does not come without associated costs. In addition to the commissions that must be paid on each booking delivered, hotels may need to invest in software and other systems to connect to and power their OTA connectivity, as well as hire the expertise to exploit them effectively (O’Connor & Frew, 2004). In addition, the range of potential online routes to the marketplace continues to expand, increasing system complexity and thus the management overhead (i.e., transaction costs) associated with distribution (Christodoulidou et al., 2007). Finally, channel cannibalization and consumer confusion due to the increased number of options available may have a negative effect on the performance (Gazzoli et al., 2008). Thus, even if OTA participation indeed helps drive top-line revenues, the arguably more important question of whether it succeeds in terms of increased profits and thus the generation of shareholder value remains unanswered.
To date, few extant studies have specifically investigated this issue, particularly in tourism. One reason for this is the difficulty in accessing appropriate financial data at the firm level to reliably establish the costs associated with each distribution channel (Basuroy et al., 2003; Wang et al., 2021). Particularly within the U.S. market, most hotels use the Uniform System of Accounts for the Lodging Industry, which, except for commissions paid, largely fails to adequately represent the real costs of indirect distribution in a manner that could be used to perform such evaluations (Abdullah et al., 2022). However, by basing the analysis on transaction cost theory, whereby hotels will only continue to leverage specific distribution channels if the benefits exceed the costs (Young, 2013), and considering the accounting bottom-line rather than focusing on difficult to identify individual expenses, the available data can be used to evaluate the net effect of such cooperation, establishing at the macro level whether OTA distribution results in a better net economic outcome. As a result, the following hypothesis is proposed:
With more extensive and comprehensive analysis of the association between, on one hand, OTA participation and, on the other, firm-level top-line performance and profitability, this study, therefore, answers the multiple calls for further research into intermediation and the tourism value chain (Benckendorff et al., 2014; Buhalis et al., 2019; Huang Yin et al., 2019; Zhang et al., 2009), as well as specific calls to empirically examine the hotel/OTA relationship (Denizci Guillet & Ibrahim, 2015; O’Connor & Frew, 2004; Pal & Mishra, 2017), helping to demystify the often confrontational hotel–OTA relationship from a transaction cost perspective.
Research Methodology
Occupancy, REVPAR, and full income statement data for a random sample of 800 U.S. hotels for were obtained from STR, a leading global data intelligence and benchmarking company. STR’s database includes data on 88,000 of the approximate 90,000 to 110,000 hotel/motel properties in the United States, has previously been extensively used in hospitality research (see, Beritelli & Schegg, 2016; Kubickova et al., 2019; Mao & Mi, 2014; Price-Howard & Crossley, 2019), and has proven to be representative and reliable. To avoid analyses being influenced by the COVID effect, data for the 2019 financial year were used in the study. Key data were missing in 132 cases, and there were data anomalies in two cases, resulting in 134 cases being removed from the analysis. This resulted in a usable sample of 644 properties. Using contemporary sample size calculators, the minimum sample for our desired 95% confidence level was 383, with the usable sample of 644 coming close to the size required for a 99% confidence level. For each property in the sample, we wished to investigate the effect of TA Commissions on occupancy, revenue, and profitability.
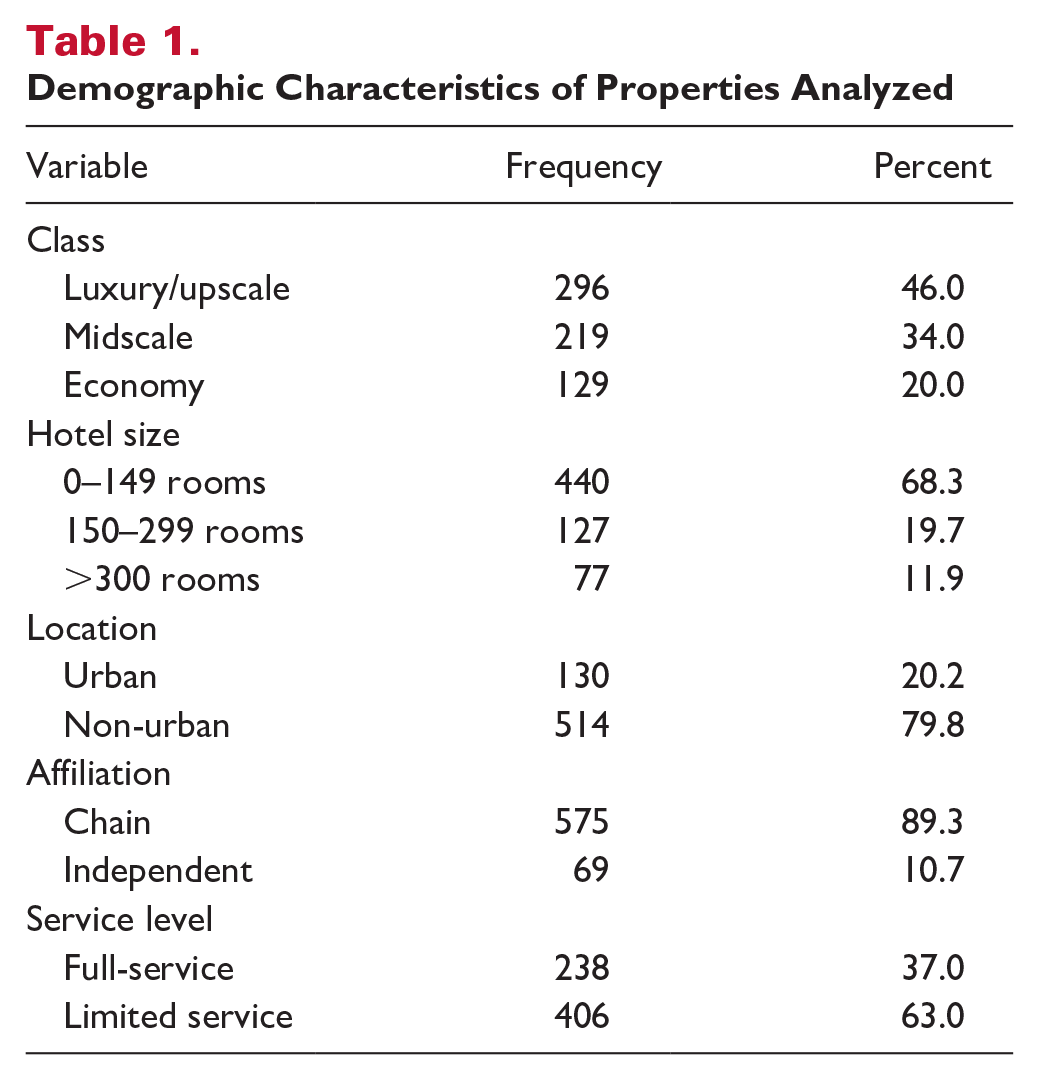
Initial analyses of the dataset revealed high deviation from normality along with high heteroscedasticity in many variables. To correct for this, we used Cook’s distance (see McDonald, 2002) to identify and eliminate outliers/extreme observations associated with high residual variabilities, removing another 97 observations from the dataset accordingly, resulting in a final dataset/sample of 644 observations with normal homoscedastic residuals. Table 1 presents the demographic characteristics of the properties analyzed, which can be seen to be broadly representative of the U.S. hotel industry. According to STR, 23%, 36%, and 38% of U.S. properties fall into the Luxury/Upscale, Midscale, and Economy classifications. The respective proportions in our sample are 46%, 34%, and 20%, with the economy grouping lower (and thus the mix less representative) due to having to eliminate 132 properties who reported no commission. Proportions for the other demographics are less distorted and a closer match to the population.
Demographic Characteristics of Properties Analyzed
While comprehensive income statement data for the sample properties were obtained from STR, a subset of the available variables was used in the study. These included standard measures such as occupancy, REVPER and EBITDA PAR, which are typical performance measures used by hotel operators (Aissa & Goaied, 2016). OTA usage was operationalized using travel agent commission, which, with almost all commissionable bookings in the United States now originating through OTAs, can be considered a reasonable proxy for OTA activity. In addition, key demographic variables identified in prior research studies (see Table 1) were incorporated as control variables into the model as to check for robustness and examine possible interaction effects. The variance inflation factor (VIF) for all aforementioned variables was below the recommended threshold of 5 (see Table 2), suggesting the absence of multicollinearity and supporting the addition of all these variables to the model. Finally, TA Commissions per available room were centered to control for any possible multicollinearity issues when subsequently adding the interaction terms to the model and to facilitate the interpretation of such interaction effects (see Afshartous & Preston, 2011).
Results of Variance Inflation Factor (VIF)
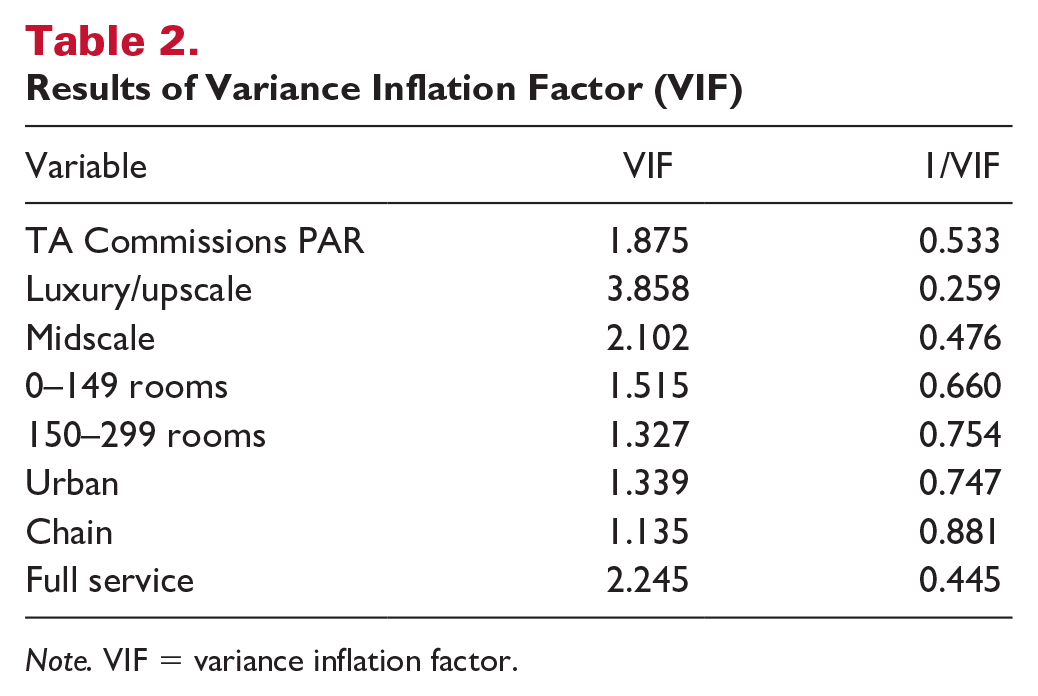
Note. VIF = variance inflation factor.
All variables are summarized in Table 3 along with their summary statistics where applicable. In particular, the 644 examined properties had an average occupancy of 73.66%, with a minimum occupancy of 35% and maximum of 95.6%. The average REVPER (in 2019$s) was $95.29, with a minimum and maximum of $21.00 and $258.00, respectively. An average EBITDA PAR was $26.24 with a minimum and maximum of −$49.00 and $126.00, respectively. Finally, hotels on average paid TA Commissions per available room of $2.21, with this latter ranging from $0.00 to $9.00. Moreover, skewness and kurtosis measures were all between −2 and +2 in absolute values, suggesting data normality following application of Cook’s distance, as discussed earlier (Hair et al., 2009).
Study Variables
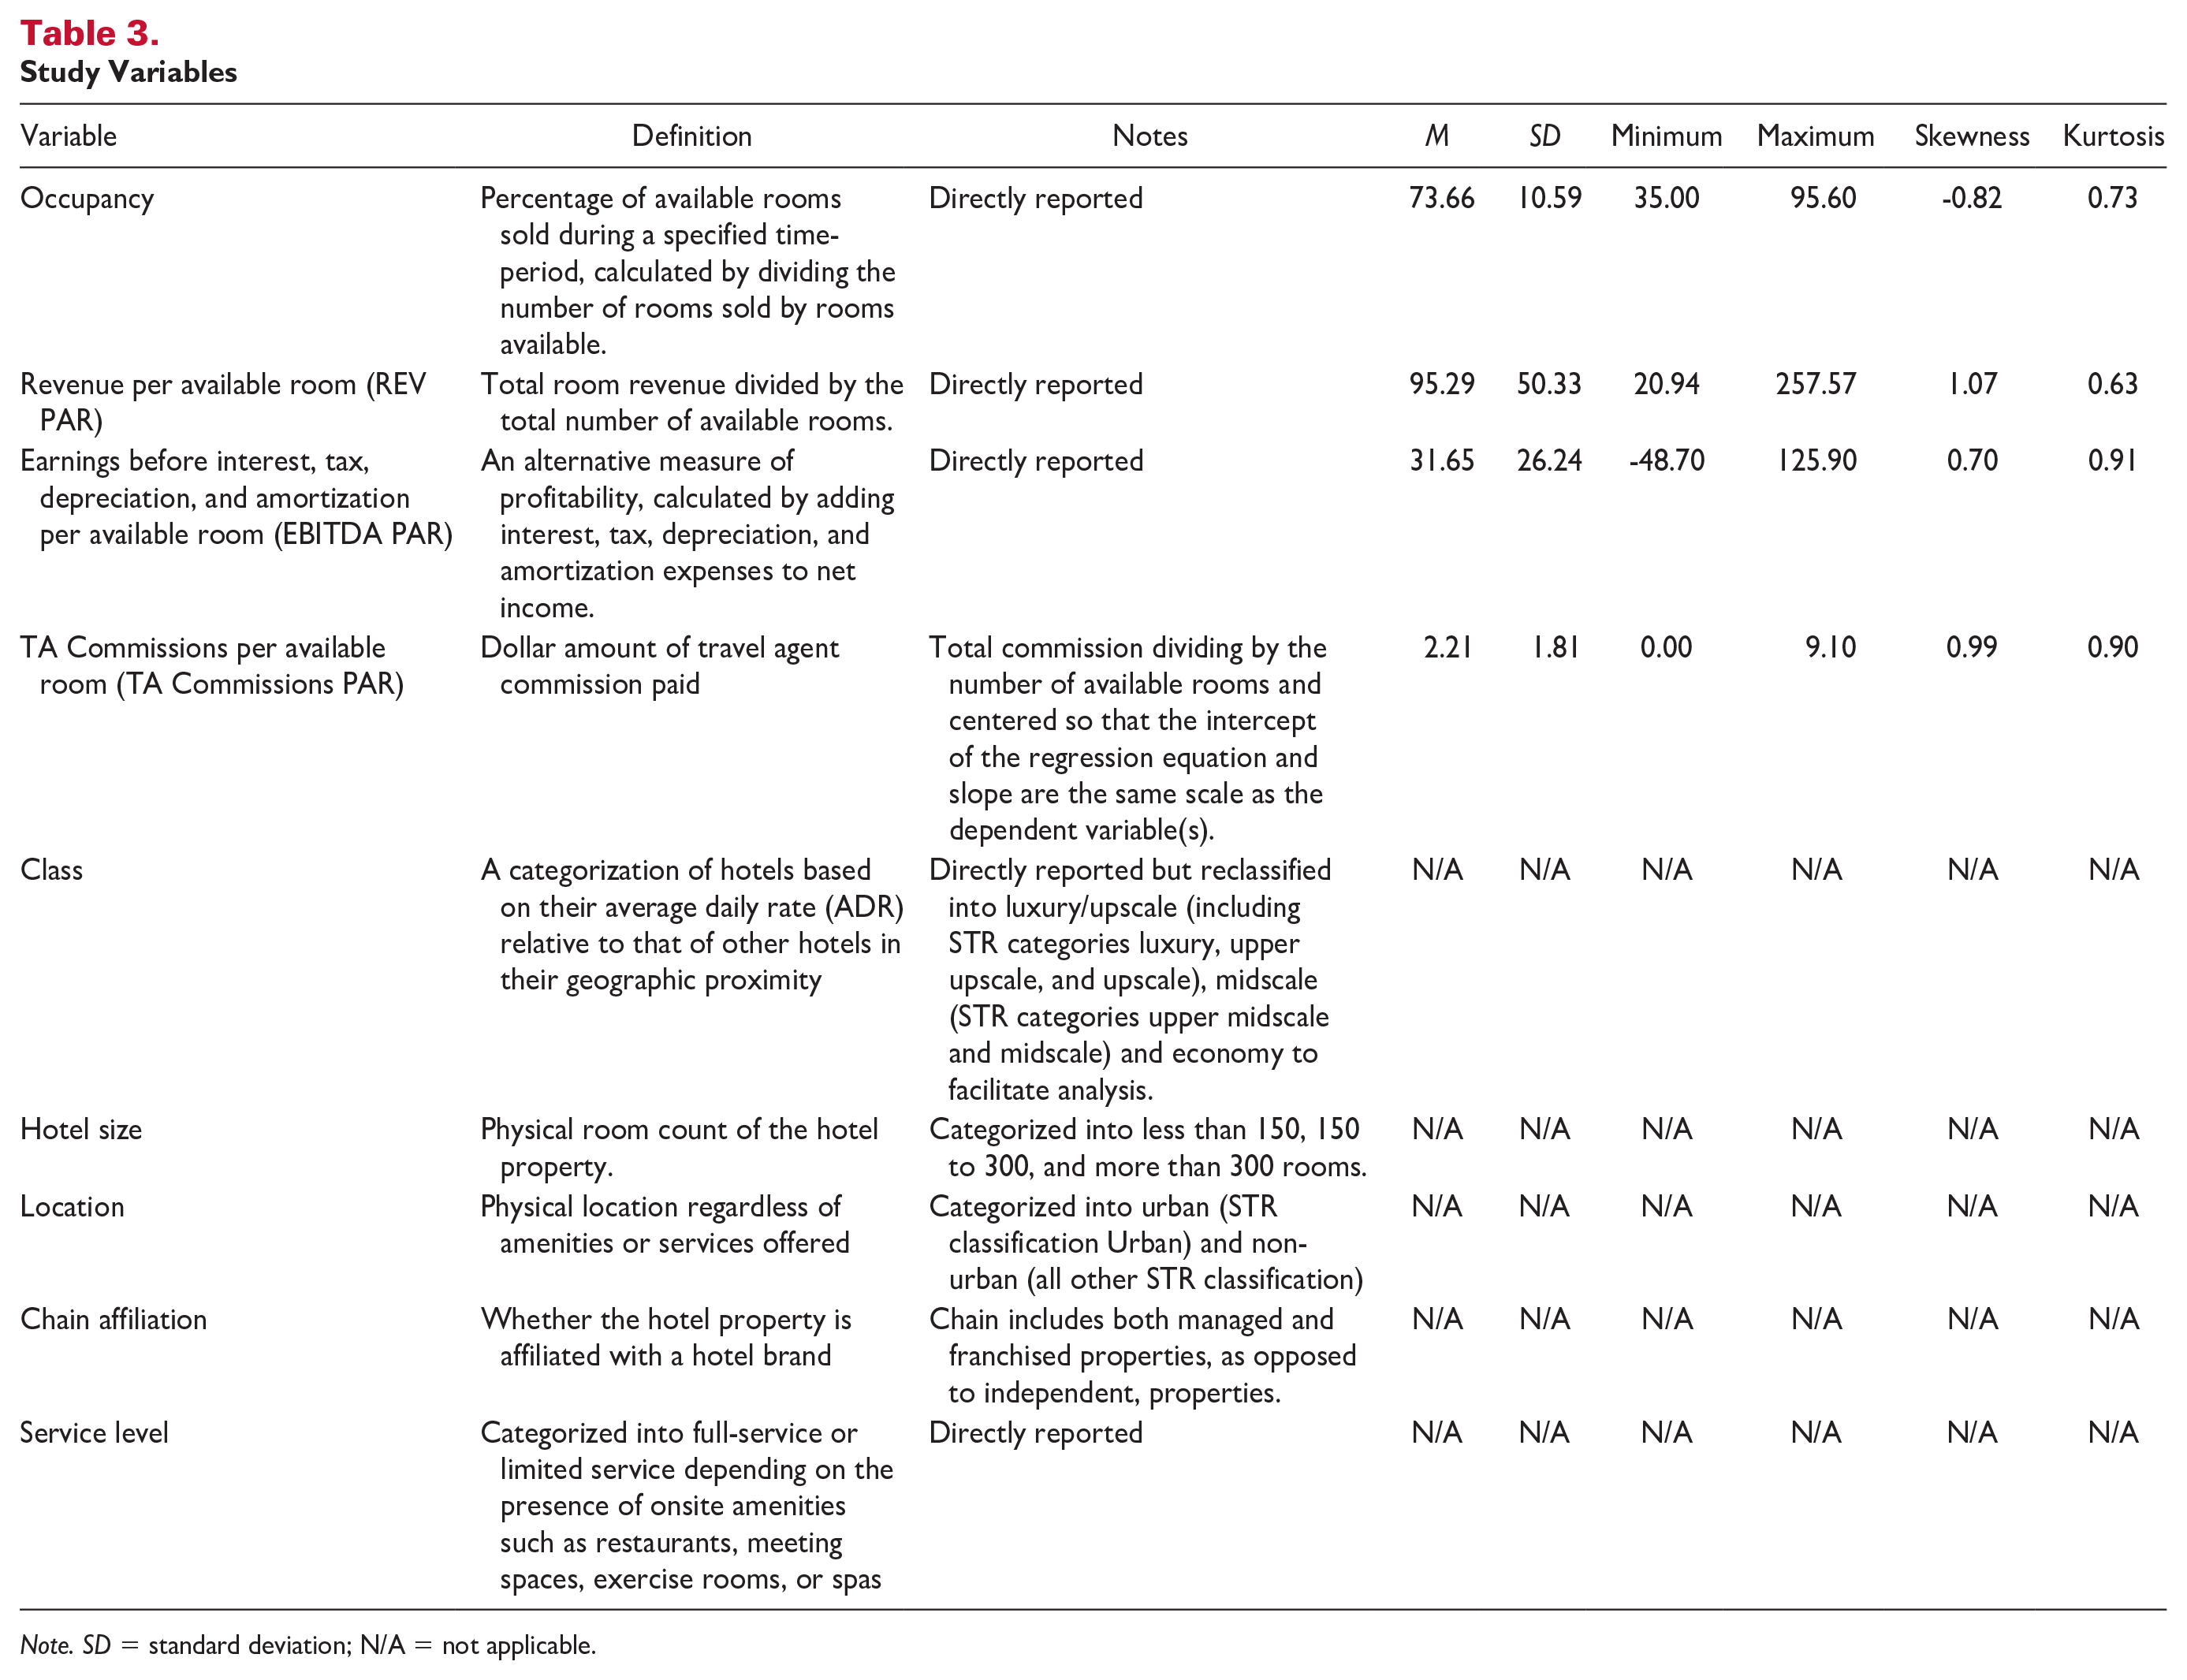
Note. SD = standard deviation; N/A = not applicable.
Results
Ordinary least squares (OLS) regression was used to analyze both the initial and interaction models. Initially, each of the hotel performance variables were regressed on TA Commissions PAR to test the stated hypotheses (note that control variables will be added later as robustness checks). The correlation results for the initial variables taken two-by-two are shown in Table 3, with results of the initial regression analyses shown in Table 4. Durbin–Watson measures for all three equations are between 1.5 and 2.5, suggesting independence of regression residuals.
The Correlation Matrix
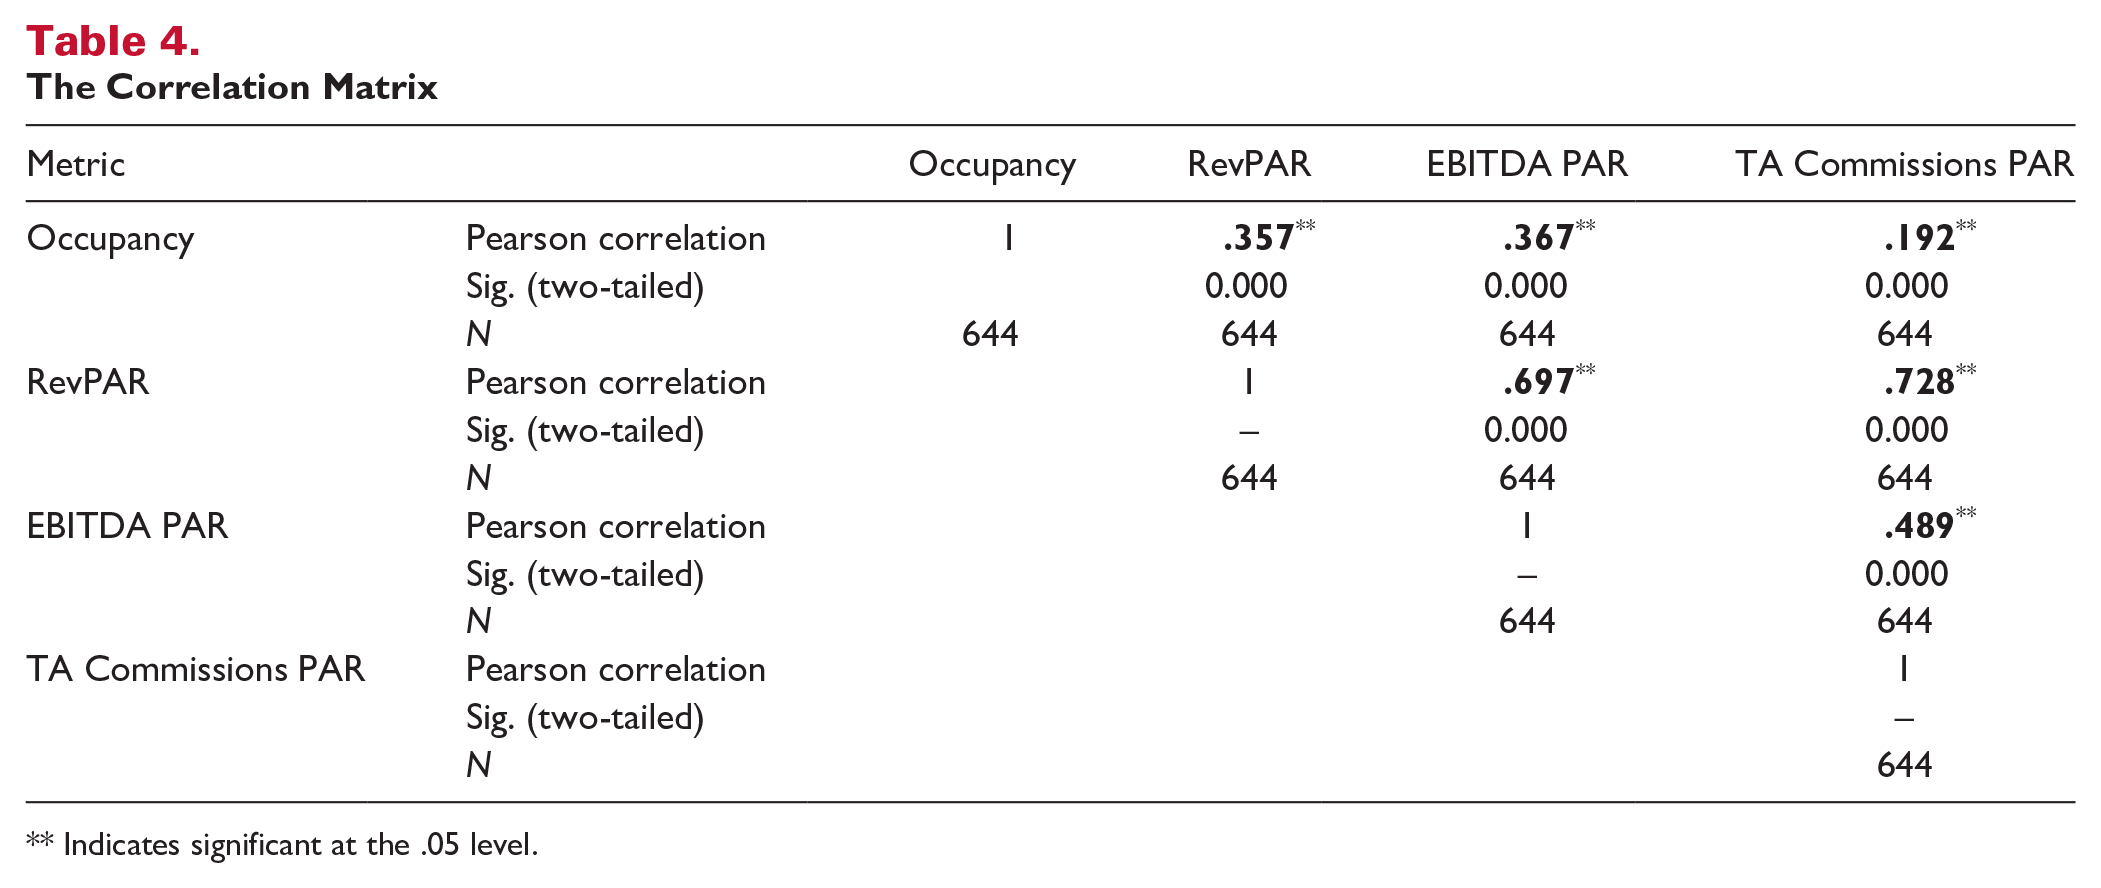
Indicates significant at the .05 level.
These initial analyses suggest mixed results (see Table 5). While TA Commissions PAR is a significant predictor of occupancy, its R2 is low (.037), suggesting weak explanatory power. However, spending on travel agent commission appears to be associated with occupancy, with each one-dollar increase resulting in an increase in occupancy of 1.123 percentage points, which could have a major effect on a hotel property’s top-line and bottom-line performance. Findings on the association between spending on travel agent commission and both overall revenue and profitability are even stronger, with both relationships positive and significant and each one dollar increase in commission resulting in an increase in Rev PAR and EBITDA PAR by $20.20 and $7.08, with high R2 of 53% and 24%, respectively. Such findings suggest that a positive relationship between OTA participation and hotel performance, driving both top-line revenues and bottom-line profitability.
Regression Results
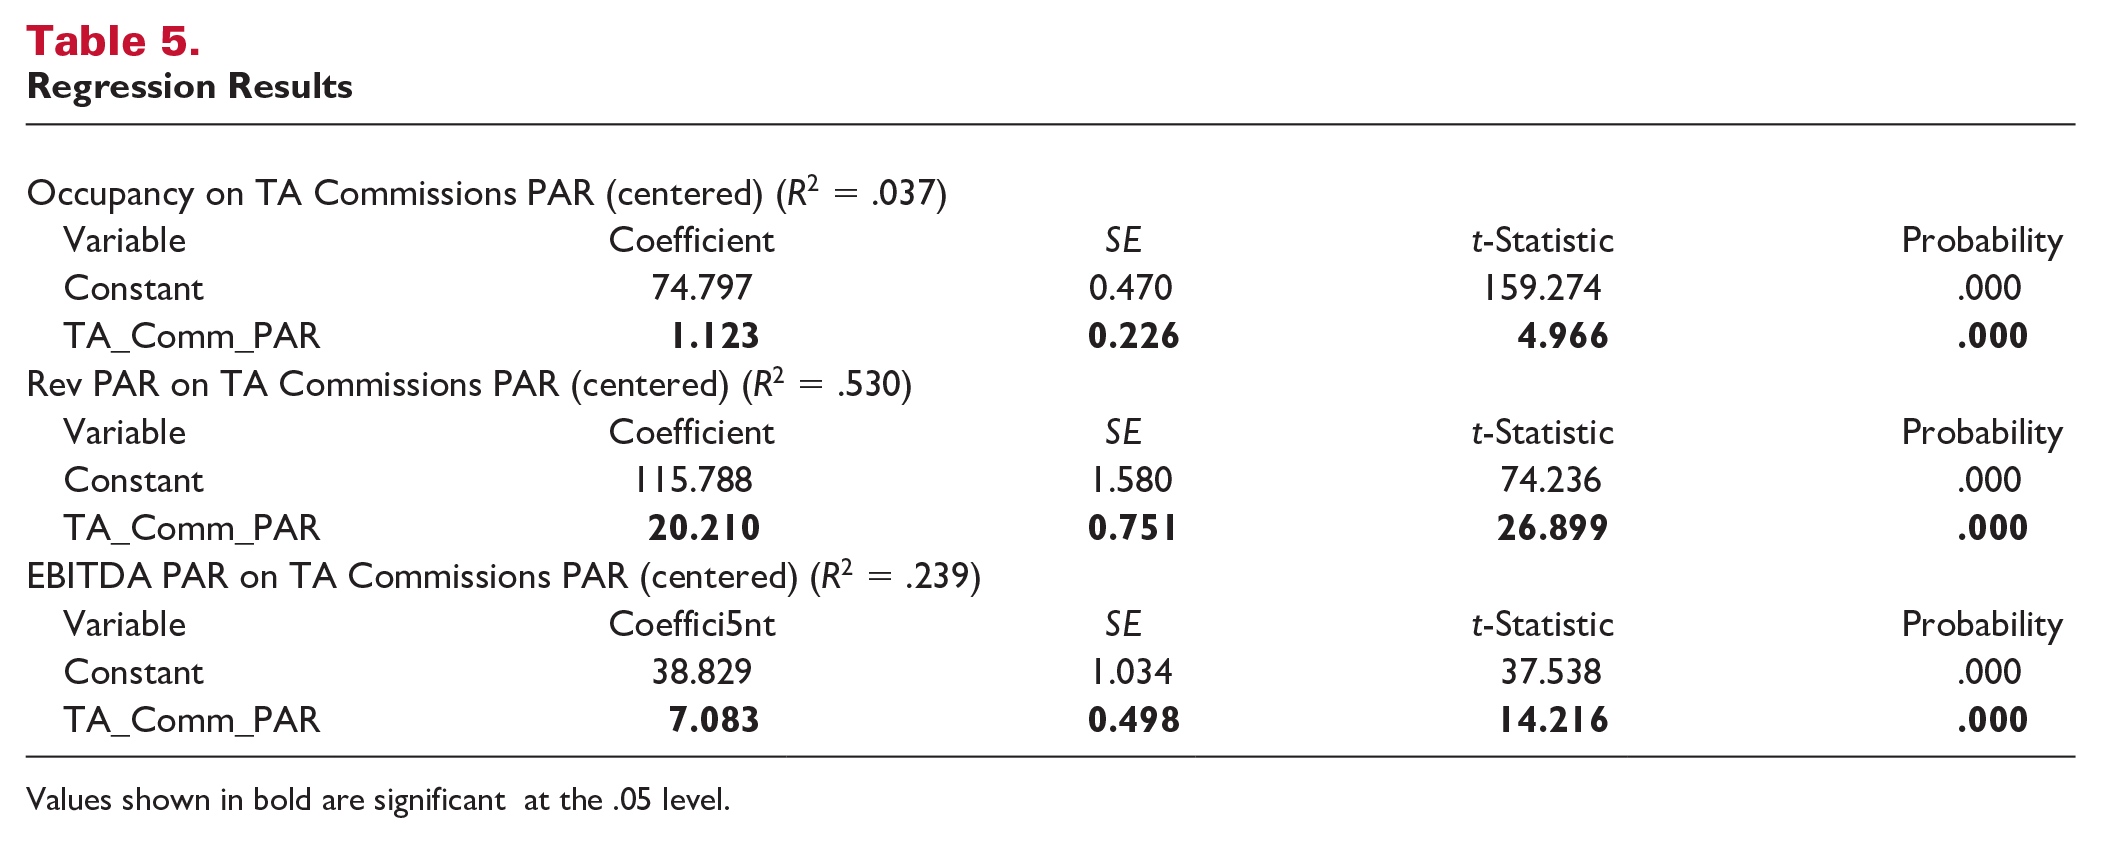
Values shown in bold are significant at the .05 level.
To gain a deeper level of insight, the same dependent variables were again regressed against TA Commissions PAR with the addition of several control variables to assess their moderating effect. Interaction terms were created for each control variable and TA Commissions PAR and then incorporated into the regression analyses. These included Class (luxury/upscale and midscale vs. economy), Size (0–149 rooms and 150–299 rooms vs. 300 rooms and above), Location (urban vs. non-urban), Affiliation (chain vs. independent), and Service-level (Full vs. limited service). Results of the analyses for occupancy, REVPAR, and EBITDA PAR, respectively, are shown in Tables 6–8, respectively.
Regression Interaction Results—Occupancy on TA Commissions PAR (Centered)
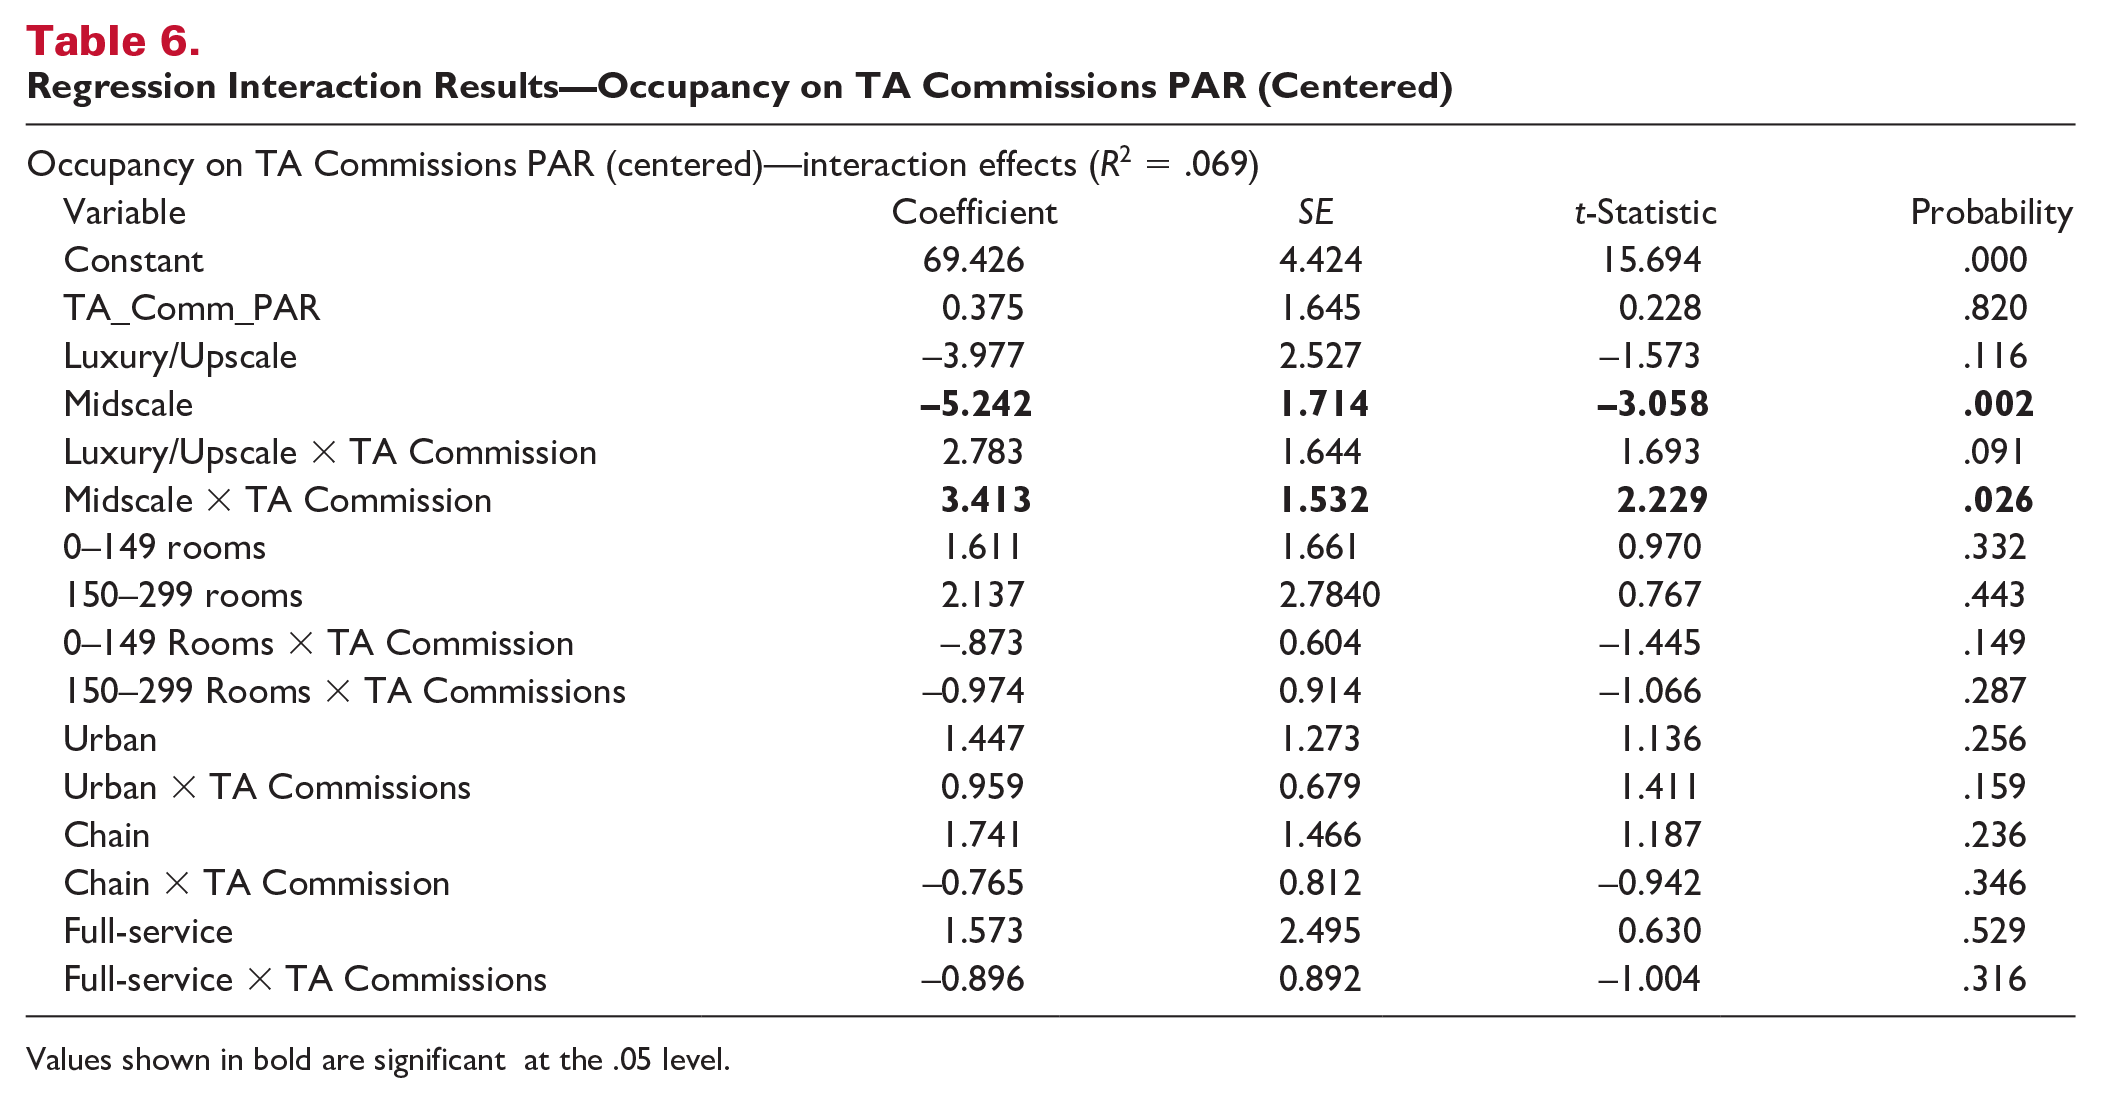
Values shown in bold are significant at the .05 level.
Regression Interaction Results—REVPAR on TA Commissions PAR (Centered)
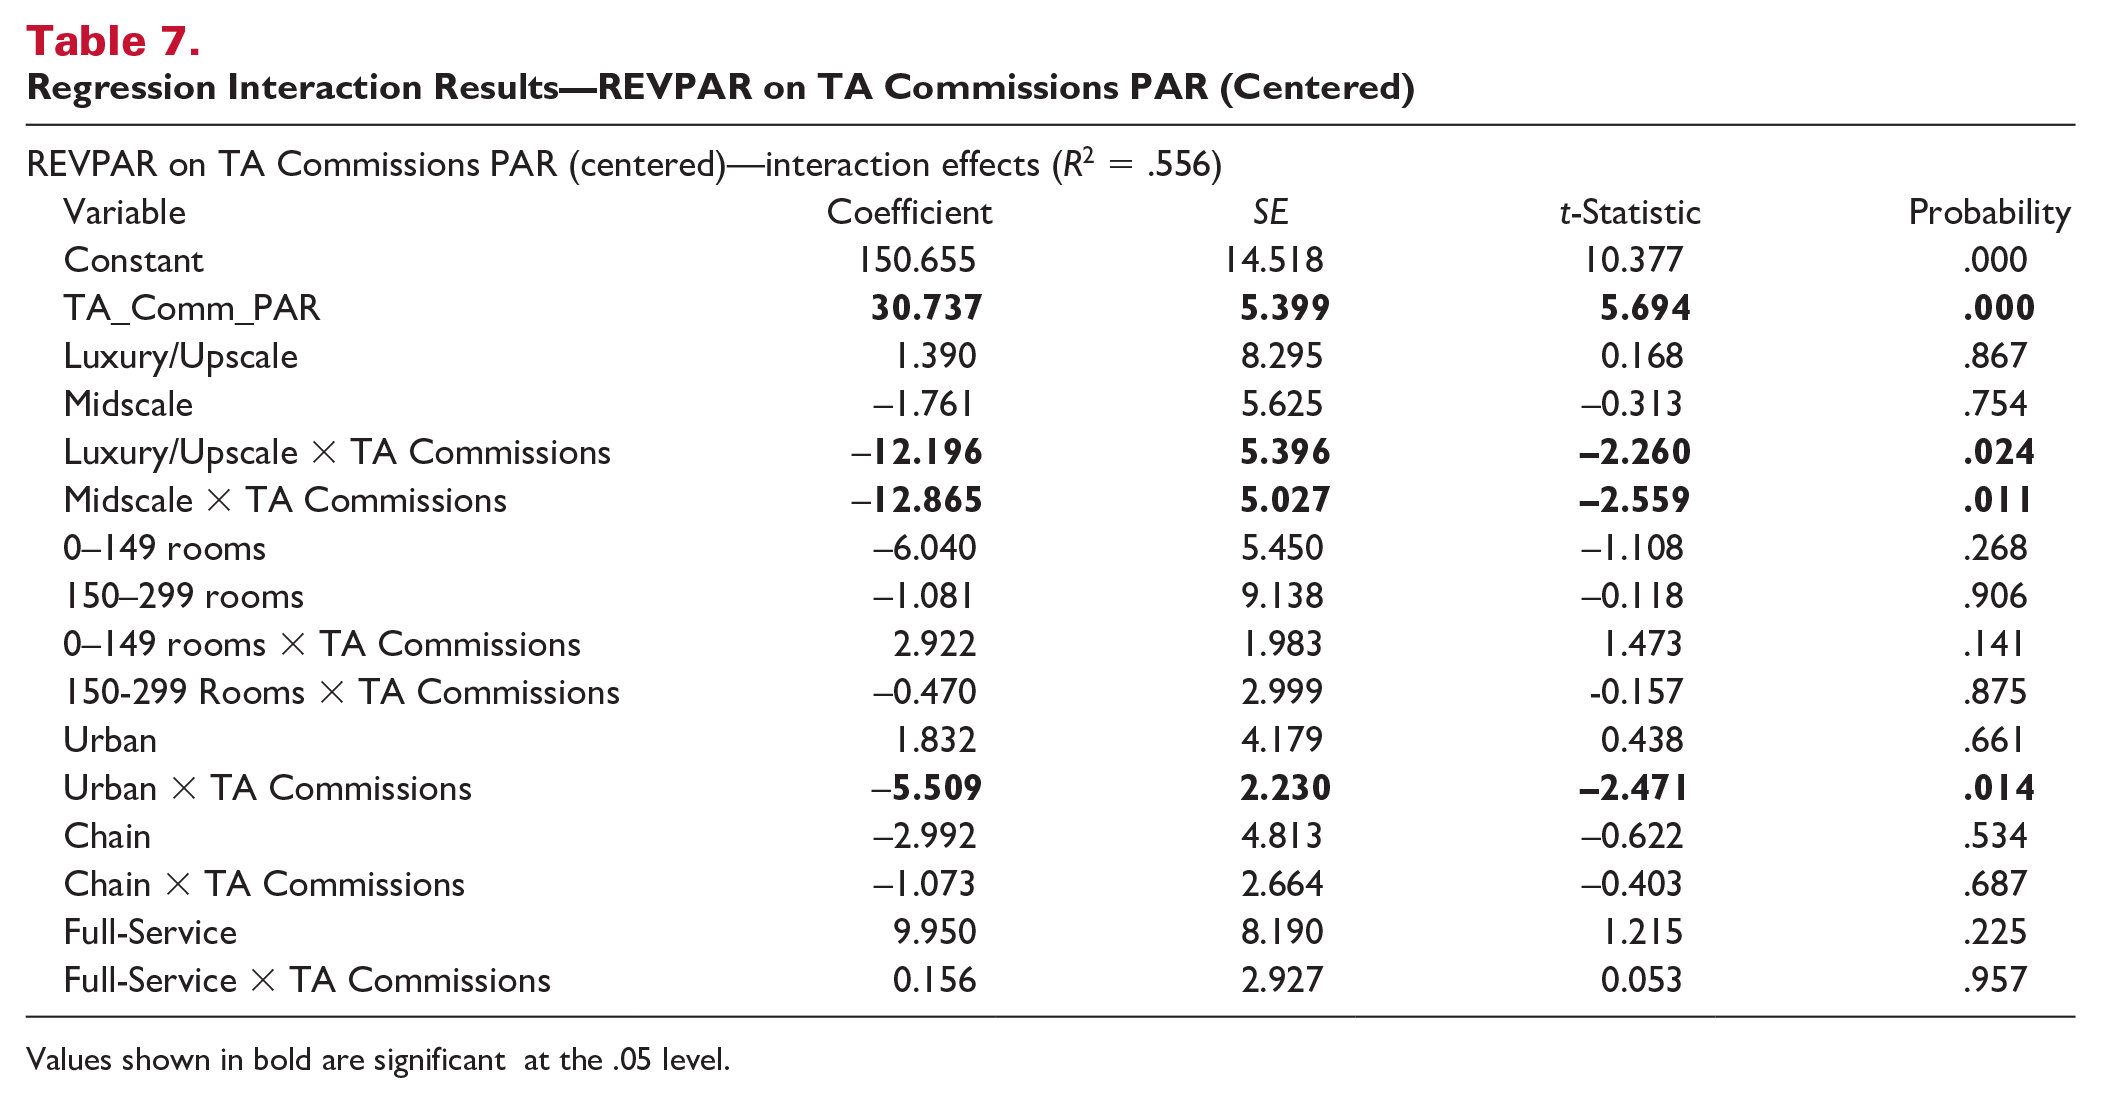
Values shown in bold are significant at the .05 level.
Regression Interaction Results—EBITDA PAR on TA Commissions PAR (Centered).
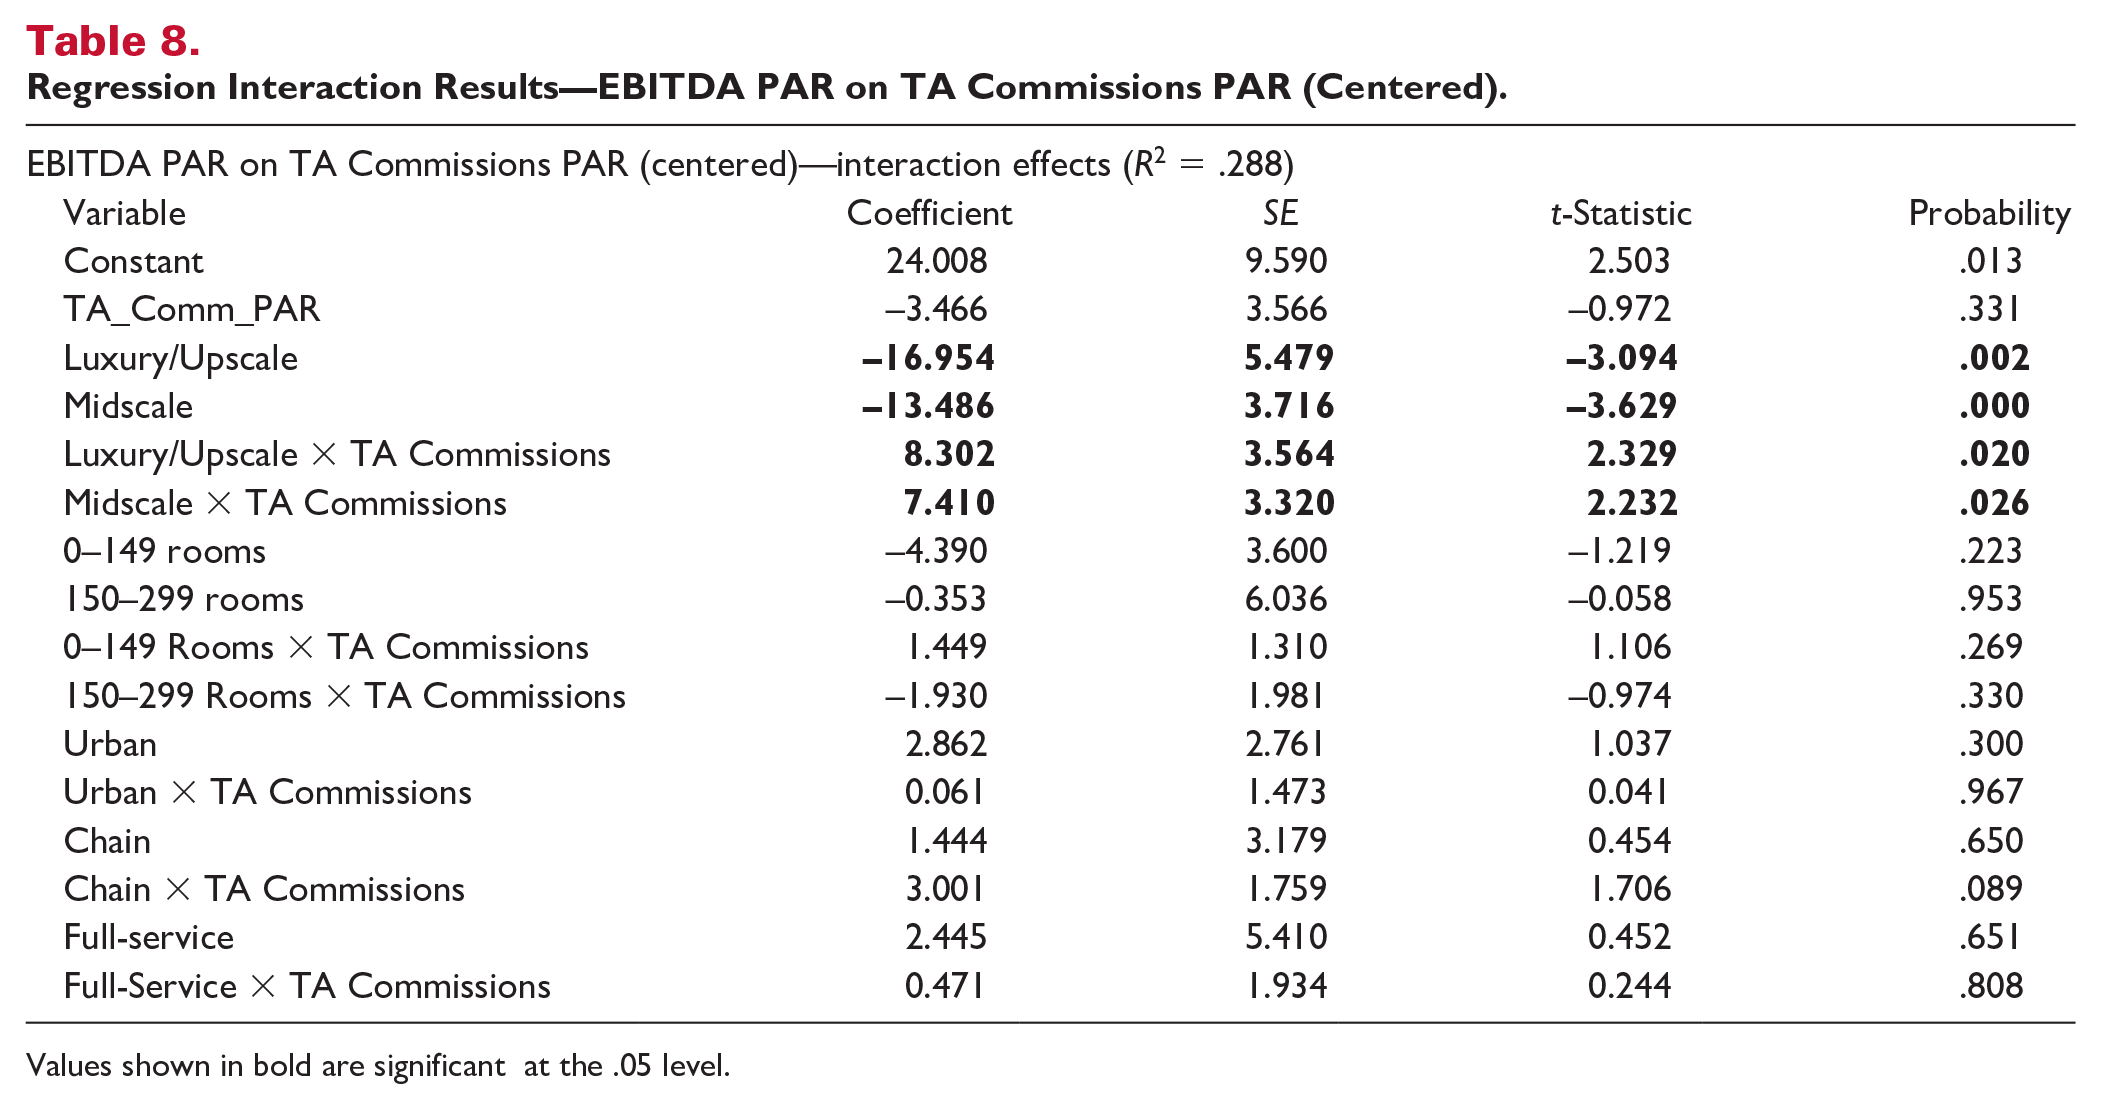
Values shown in bold are significant at the .05 level.
On examining Table 6, it can be observed that only the interaction between midscale properties and TA Commissions PAR is significant. For midscale properties, and for an average level of commission, the resulting effect on occupancy is greater by 3.4 percentage points compared with upscale and economy properties, suggesting that participating in OTAs is especially beneficial for midscale properties in terms of occupancy. In addition, looking at the table in the macro sense, overall explanatory power remains low (R2 = .069), highlighting the limited effect on occupancy of working with OTAs for U.S. hotels.
In contrast, OTA participation seems to have a more extensive effect on REVPAR. As can be seen from Table 7, the interactions between luxury/upscale and midscale with TA Commissions PAR are significant. While for average levels of TA Commissions PAR, REVPAR for the base Class (economy) increases by (in 2019$s) $30.70, the corresponding uplift for both luxury/upscale and midscale properties is lower ($18.50 and $17.90, respectively), suggesting that while participation in OTAs helps drive REVPAR for all classes of hotel, it is especially beneficial for improving the REVPAR of economy properties. Table 7 also highlights a significant interaction effect for location. For an average level of TA Commissions PAR, the interaction effect on REVPAR is lower by $5.50 for urban properties, suggesting that OTA participation is less beneficial for urban compared with non-urban ones in terms of driving REVPAR.
Since OTA participation may drive top-line revenue but also has associated costs, the interaction effects between EBITDA PAR, TA Commissions, and the control variables were also tested. As can be seen from Table 8, for EBITDA PAR, the interactions between luxury/upscale and midscale properties with TA Commissions are significant. In this case, for luxury/upscale and midscale properties, and for an average level of TA Commissions PAR, its effect on EBTIDA PAR is positive and equal to $4.80 (−3.466 + 8.302) and $3.90 (−3.466 + 7.410), respectively, while the effect of OTA participation on EBITDA PAR for economy properties is negative (−$3.466). For this latter class of hotels, while OTA participation appears to help drive top-line revenues, its associated costs make up too high a percentage of revenue, leading to lower profitability.
Discussion
With online channels driving the majority of reservations for hotels, understanding which portfolio of distribution channels to exploit has become essential (Aissa & Goaied, 2016). Given their dominance of the online travel marketplace, online travel agents have become a useful tool in the arsenal of hotel managers. However, participating in OTAs distribution remains a controversial issue, with industry and academia alike in disagreement as to their ultimate effect on hotel performance and profitability. Leveraging transaction cost theory, this study represents the first large-scale attempt to empirically address this question. Analyzing comprehensive firm-level data from 644 U.S. hotel properties, the study demonstrates that OTA participation seems to have a significant and positive effect on hotel performance, at both the top-line (occupancy and gross revenue REVPAR) and bottom-line (EBITDA PAR) levels.
First, OTA participation is positively and significantly associated with the two measures of top-line performance, with each one dollar increase in TA Commissions resulting in an increase of 1.12% in occupancy and $20.20 (in 2019$s) in REVPAR, respectively. Given speculation in the literature that OTA participation drives an increased volume of room sales, the low percentage boost in occupancy is surprising, with the effect of OTA participation on occupancy in practice marginal. Although not directly addressed in the research, one possible explanation could be that demand is finite, and thus, despite increased reach and visibility, OTA participation can only have a limited effect. In addition, the R2 of the TA Commissions PAR to occupancy relationship is low (.037), suggesting that factors not included in the model (e.g., marketing expenses and online reputation) help drive occupancy. In contrast, the R2 associated with the REVPAR relationship is high, suggesting that OTA participation is associated with being able to charge higher rooms rates.
Second, despite its associated costs, OTA participation is positively and significantly associated with REVPAR, with each one dollar increase in TA Commissions resulting in an increase of $7.08 in profitability (2019$s). In other words, despite the transaction costs of effectively outsourcing the distribution function to a third party, when examined in the macro sense, this results in a positive net return to the firm. As such, the study reconfirms the findings of Abdullah et all (2022) and Anderson (2009), providing empirical evidence to support the use of OTAs as distribution tools and confirming the positive relationship between OTA participation and hotel performance, driving both top-line revenues and bottom-line profitability.
However, OTA participation does not appear to affect all types of hotels equally. Examining the interaction effects by the hotel class reveals different insights. For luxury/upscale properties, OTA participation has a significant and positive effect (note all figures in 2019$s) on REVPAR (+$18.50 for an average level of commission), which ultimately translates into higher EBITDA PAR (+$4.80 for an average level of commission). For midscale properties, the effect is even stronger, with OTA participation having a significant and positive effect on both occupancy (+3.4 percentage points) and REVPAR (+$17.90), again translating into higher EBITDA PAR (+$3.90). However, OTA participation appears to have a notably different net effect on economy properties. In particular, it is associated with significantly higher REVPAR (+$30.70), which is a significant improvement considering the typical low room rates associated with economy hotels. However, this top-line improvement ultimately fails to translate into higher profitability, with economy properties that participate having lower EBITDAs (−$3.46). This latter finding provides insight into why many economy properties (in contrast to mid and luxury/upscale properties) do not leverage intermediaries. For such properties, while participation might help drive top-line revenues, the associated transaction costs make up too high a percentage of resulting revenue, ultimately leading to lower profitability.
Conclusion and Recommendations
The study’s results extend the literature on online distribution in the following ways. While prior studies have for the most part conceptually debated the role of OTAs in hotel distribution, or attempted to empirically test its effects on hotel top-line revenue using small-scale surveys, this study represents the first large-scale, comprehensive, empirical study that investigates the relationship between OTA participation with both top-line hotel performance and bottom-line profitability in the context of the U.S. hotel sector. Using a transaction cost approach, the study highlights how when considered at a macro level, OTA participation has a positive effect on hotel performance, driving both top-line revenues and bottom-line profitability, and informing the debate on whether working with OTAs is financially attractive to hotels.
Second, the study takes analyses to a deeper level than prior work, examining the interaction effect of OTA participation with a variety of hotel characteristics including size, chain affiliation, location, and hotel class, thus deepening our understanding of when OTA distribution should, and should not, be used. Most notably, analysis by class revealed that while OTA participation has a significant positive effect on the top-line revenues of economy properties in the sample, its net effect on profitability was negative, highlighting how OTA participation may not be for everyone and that hotel managers need to pay particular attention to understanding and actively managing their portfolio of distribution channels.
As such, the study has important implications for theory and practice. In addition to providing novel insights into the financial aspects of the OTA/hotel relationship, it contributes to the advancement of knowledge by adding the theoretical perspective of transaction cost economics to the OTA participation debate, clearly demonstrating that, except for economy hotels with their more fragile cost structure, the resulting benefits outweigh the associated formal and informal costs. However, the financial aspects of OTA participation should just be one element in the strategic decision of whether to actively work with OTAs, (O’Connor & Frew, 2004). Other issues, in particular, ownership of the customer and their associated first-party data, also need to be taken into account in the decision as to whether, or not, to engage with OTAs. Having direct contact and direct access to customers’ preferences pre-, during, and post-stay allows hotels to market themselves more efficiently, potentially helping to drive higher revenue, and repeat business in the long term. Given the small gains in both revenue and profitability identified in this study, particularly when considered in percentage terms, such issues also need to be considered when evaluating the OTA/hotel relationship.
The present study has several limitations, which may provide interesting avenues for further research. First, the study uses cross-sectional data from a single year and a single market and thus should be interpreted with caution at several levels. Cross-sectional data provide a snapshot of a particular point in time, offering a static view of a phenomenon. To validate and enhance the robustness of the findings, a longitudinal study with a higher level of granularity, preferably on a daily basis and using data from multiple markets, should be undertaken. Such a longitudinal approach could analyze the phenomenon over an extended period, allowing for a more in-depth understanding of its dynamics and potential changes over time. Second, several economy properties included in the sample reported travel agent commission levels of zero. One reason for this may be that OTAs tend not to work with economy properties as their low ADR results in very small commissions, while economy properties tend to avoid using third-party distribution resulting commissions negatively affect their already tight margins (Stangl et al., 2016). Thus, from an industry perspective, having many economy properties report zero commission is not surprising. However, from the data, we are unable to determine the underlying cause and there is a possibility that some have incorrectly reported their figures, incorporating commission into other rooms-related expenses, which would adversely affect the study’s findings. A supplemental analysis, removing these properties from the analyses, did not substantially alter the results. Third, the study only considers bookings from OTAs that utilize the agency model and receive commissions from the hotels to whom they deliver business. Some OTAs make use of the net-rate based merchant model and as a result do not receive commissions and are thus not considered in this study. Future studies could investigate whether hotels dependent on merchant bookings have results substantially different from those found in this study. Fourth, given that all data used in the study originates from unit level property’s income statements, the potential exists for endogeneity which could potentially bias the results. Fifth, these data questions highlight to a further limitation in that the study solely uses quantitative secondary data. Adding additional data, and in a particular qualitative data, collected directly from hotel properties would help address this challenge and add another layer of sophistication to the analyses. Finally, the minor effect of OTA participation on hotel occupancy, which contrasts sharply with extant literature, as well as the low R2 of the TA Commissions PAR to occupancy relationship (.037), suggesting issues that are currently not included in the tested model, is affecting the relationship. Given the importance of occupancy to the success of highly operationally geared organizations such as hotels, this anomaly merits further investigation and should be explored more comprehensively in future studies.
Footnotes
Declaration of Conflicting Interests
The author(s) declared no potential conflicts of interest with respect to the research, authorship, or publication of this article.
Funding
The author(s) received no financial support for the research, authorship, or publication of this article.