
Abstract
The aim of this study is to investigate the long-term determinants of China’s imported wine demand and to forecast wine imports from 2019 to 2023 using econometric methods. Auto-regressive distributed lag models are developed based on neoclassical economic demand theory to investigate the long-term determinants of China’s demand for imported bottled, bulk, and sparkling wine from the top five countries of origin. The empirical results demonstrate that income is the most important determinant of China’s imported wine demand, and that price only plays a significant role in a few markets. Substitute and complement effects are identified between wines from different countries of origin and between imported wines and other liquids. China’s imported wine demand is expected to maintain its rapid growth over the forecast period. Bottled wine will continue to dominate China’s imported wine market. France will have the largest market share in the bottled wine market, Spain will be the largest provider of bulk wine, and Italy will hold the same position for sparkling wine. This is the first study to use a single equation with the general to specific method rather than a system of equations to estimate and forecast China’s demand for imported bottled, bulk, and sparkling wines from different countries of origin. The more specific model setting for each country of origin improves forecasting accuracy.
Introduction
China’s wine consumption has attracted global attention in recent years as its wine imports soared from 286 million liters in 2010 to 679 million liters in 2018, with an average annual growth rate of 11.4% (China Customs Statistics, 2016). Meanwhile, China has become the 10th largest wine-producing country (Karlsson, 2019) and the fifth largest wine consuming country in the world (Statista, 2019). Although around 80% of China’s wine consumption is domestic, its imported wine market was the fourth largest worldwide in 2018 (Workman, 2019). Given the impressive volume of total consumption, wine exporters across the world have embraced the Chinese market (Anderson & Wittwer, 2015).
China’s sustained economic growth and rising incomes over the last few decades have stimulated the growth of its wine consumption (H. Liu & McCarthy, 2017). In addition to economic forces, the expansion of the upper middle class and a well-educated younger generation play important roles in the increasing market share of wine in the Chinese alcohol consumption market (Capitello et al., 2015; Muhammad et al., 2014). A few studies have found that Chinese culture facilitates wine consumption because drinking wine, particularly drinking imported wine, is a symbol of wealth and social status (Banks & Overton, 2010; J. G. Li et al., 2011; F. Liu & Murphy, 2007; Xu et al., 2014). Such factors provide the foundation for the rapid growth of imported wine consumption in China. However, factors such as the anti-corruption campaign that began in 2012, the slowing of economic growth, the depreciation of the RMB and the trade war between China and the United States have also caused fluctuations in the imported wine market.
This study investigates the long-term determinants of China’s imported wine demand and generates forecasts for 2019 to 2023 wine imports using econometric methods. The determinants and forecasts of China’s imported wine demand are essential for both domestic and foreign winemakers. If winemakers know the key influencing factors of demand, they can use the forecasts to plan their production and to develop sales strategies in advance to save on production costs and increase their profits.
The remainder of the study is organized as follows. In the next section, studies related to China’s wine consumption and wine demand modeling are briefly reviewed. This is followed by the introduction of the methodology and data used in this article. The findings and discussions are presented in section “Findings and Discussion” and Section “Conclusion” concludes the study.
Literature Review
Compared with the traditional wine consumption countries in the Americas and Europe, research focusing on China only began in 2006. Studies of China’s wine market are limited and most shed light on consumption motivations and the determinants of wine selection.
Wine Consumption Motivation of Chinese Consumers
Pioneers in this area, F. Liu and Murphy (2007) conducted 15 in-depth interviews of Chinese wine consumers to explore consumer behavior and the factors influencing wine purchases. The interviews revealed that drinking wine in China is a symbol of social status. Wine, particularly imported wine, is still an image product in China that indicates elegant taste and upper social class (Capitello et al., 2015; Muhammad et al., 2014). This outcome has been confirmed by almost every study of the Chinese wine market (Capitello et al., 2017).
Gift giving is another key motivator of wine consumption in China (Hu et al., 2008). Chinese consumers prefer imported red wine from the Old World, particularly France, as a gift for business and private occasions (Lin & Tavoletti, 2013; Muhammad et al., 2014; Yu et al., 2009). Red wine is more popular than white in China because red represents luck in traditional Chinese culture (Capitello et al., 2017) and people believe drinking red wine is good for one’s health (J. G. Li et al., 2011; Somogyi et al., 2011), making red wine more appropriate as a gift. Due to the association between wine drinking and social status, choosing an imported fine wine as a gift gives face (mianzi) to both the gift giver and the receiver (Camillo, 2012; Yu et al., 2009). However, the recent anti-corruption campaign has resulted in a significant decline in the purchase of imported fine wine as a gift (Seidemann et al., 2017).
Attributes of Wine Selection Among Chinese Wine Consumers
As an emerging market, Chinese consumers have started to gain wine knowledge from different sources (Pettigrew & Charters, 2010) and are interested in wine tourism to improve their wine tasting ability (Zhang Qiu et al., 2013). College students who are involved in wine education classes show considerable wine knowledge, which is beneficial for the sustainable development of China’s wine industry (Fountain & Zhu, 2016). Although the increasing willingness of Chinese consumers to learn about wine could lead to a transition in the Chinese wine market from wine as a social status symbol and gift to daily drinking (Fountain & Zhu, 2016), the knowledge of most Chinese consumers is relatively poor (H. Lee et al., 2009; J. G. Li et al., 2011; F. Liu & Murphy, 2007).
Scholars have found that Chinese consumers rely more on extrinsic clues when they select wine due to their lack of wine knowledge (H. Liu & McCarthy, 2017). Many studies have revealed that the country of origin (COO) plays an important role when Chinese consumers purchase wine (Balestrini & Gamble, 2006; Camillo, 2012; Hu et al., 2008; Yang & Paladino, 2015; Yu et al., 2009). Drinking wine is considered a symbol of an elegant Western lifestyle, so wine from the Old World, particularly from France, is popular in China (Xu et al., 2014). A wine’s quality, brand, tasting experience, and recommendation have also been identified as attributes affecting Chinese consumers’ wine purchases (Balestrini & Gamble, 2006; Yu et al., 2009). Although the quality of a wine is considered in the wine selection process of Chinese consumers, Chinese consumers usually evaluate quality based on the COO and brand due to their limited wine knowledge (H. Liu & McCarthy, 2017). Based on an online survey of Chinese consumers from different regions, H. Liu et al. (2014) found that wine recommendations come from traditional word-of-mouth, the media and social networks.
Imported Wine Demand in China
The few studies that have focused on Chinese wine consumption have mostly used microlevel data such as survey data for quantitative research and interviews for qualitative research. However, conclusions based on one-off surveys and interviews are not easily generalized and the literature looking at the Chinese wine market at a macrolevel is underdeveloped. Muhammad et al. (2014) were the first to explore imported wine demand from an economic perspective. They used the Rotterdam demand system to investigate the demand for wine from France, Spain, Italy, Australia, Chile, and the United States and found that the price elasticities for these COOs ranged from −0.667 (Australia) to −2.023 (United States) while the expenditure elasticities ranged from 0.771 (Chile) to 1.363 (Spain). Capitello et al. (2015) further split the imported wine demand into bulk, still bottled, and sparkling wine from France, Italy, Australia, and Chile using the almost ideal demand system (AIDS). Their findings were similar to those of Muhammad et al. (2014); Capitello et al. (2015) also found that the price elasticities of bulk wine were higher than those of still bottled and sparkling wine.
The wine demand analysis performed in wine consumption research is dominated by system modeling methods. The Rotterdam model and AIDS were used by Carew et al. (2004) for Canada, Y. Lee et al. (2009) for Korea, Seale et al. (2003) for the United States and Muhammad (2011) for the United Kingdom. However, a disadvantage of system models is that the determinants of wine demand for each COO must be the same, yet this is a strong assumption. To overcome this issue, a single equation is used in this study to estimate Chinese demand for imported bottled, bulk, and sparkling wine from different COOs. Income level is also included as a determinant of demand. According to economic theory, income elasticity is more appropriate than expenditure elasticity when measuring the long-term relationship between demand and income. More importantly, to the best of our knowledge, this is the first study to forecast foreign wine demand using econometric methods. The more specific model setting for each COO improves the forecast accuracy.
Method and Data
Method
According to economic theory, demand is determined by the income of the customer, the price of the good, and the price of substitute goods. In international trade, particularly for wine imports, the exchange rate is also an influencing factor (Anderson & Wittwer, 2013). Chinese imported wine demand can be specified as
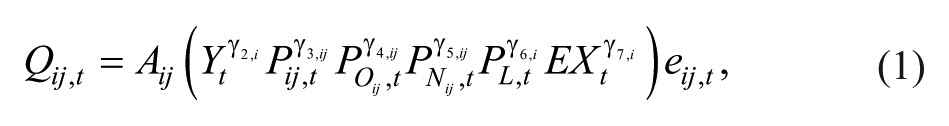
where
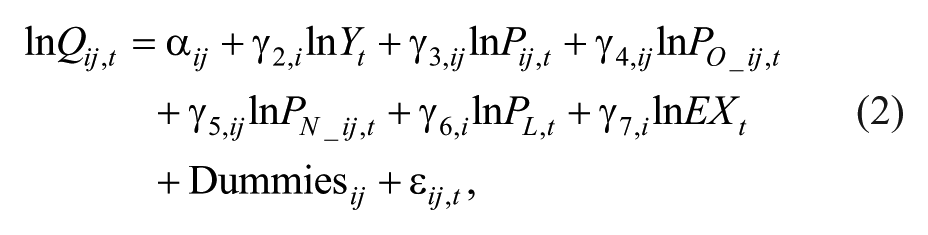
where
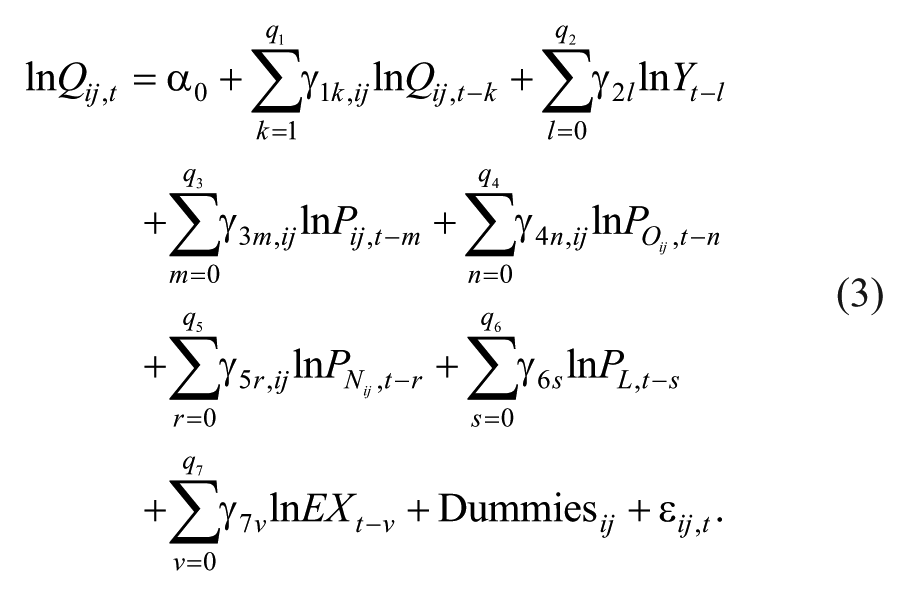
To ensure time-series regressions are not spurious, unit root tests must be conducted to examine the stationarity of all variables. This should be followed by a cointegration test such as the bounds testing approach proposed by Pesaran et al. (2001) to investigate the existence of the long-term relationship between the dependent variable and its determinants. For the bounds testing procedure, Equation 2 can be rewritten in the autoregressive distributed lag-error correction model (ADLM-ECM) form as
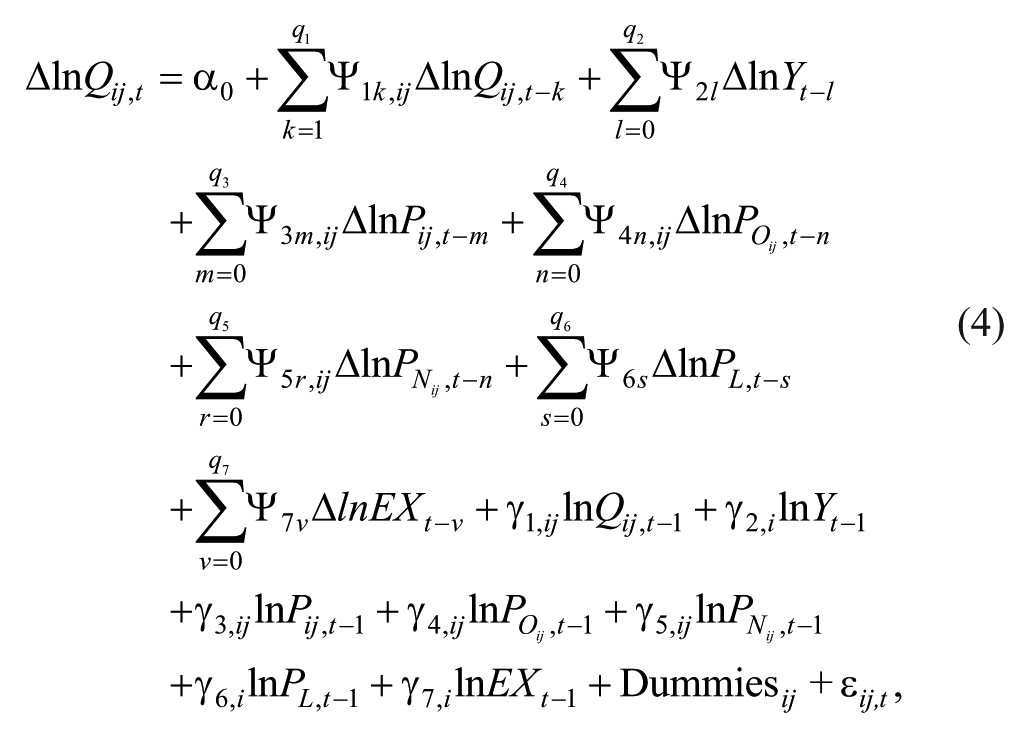
where ∆ is the first difference operator and the lagged order q is decided by the Akaike information criterion. In Equation 4,
The general to specific method (Hendry, 1995) is used to eliminate statistically or economically insignificant variables in Equation 4 sequentially to specify the determinants of the jth type of imported wine from source market i. If the estimated model passes diagnostic tests for normality, autocorrelation, and heteroscedasticity, the model can be used for forecasting.
Data
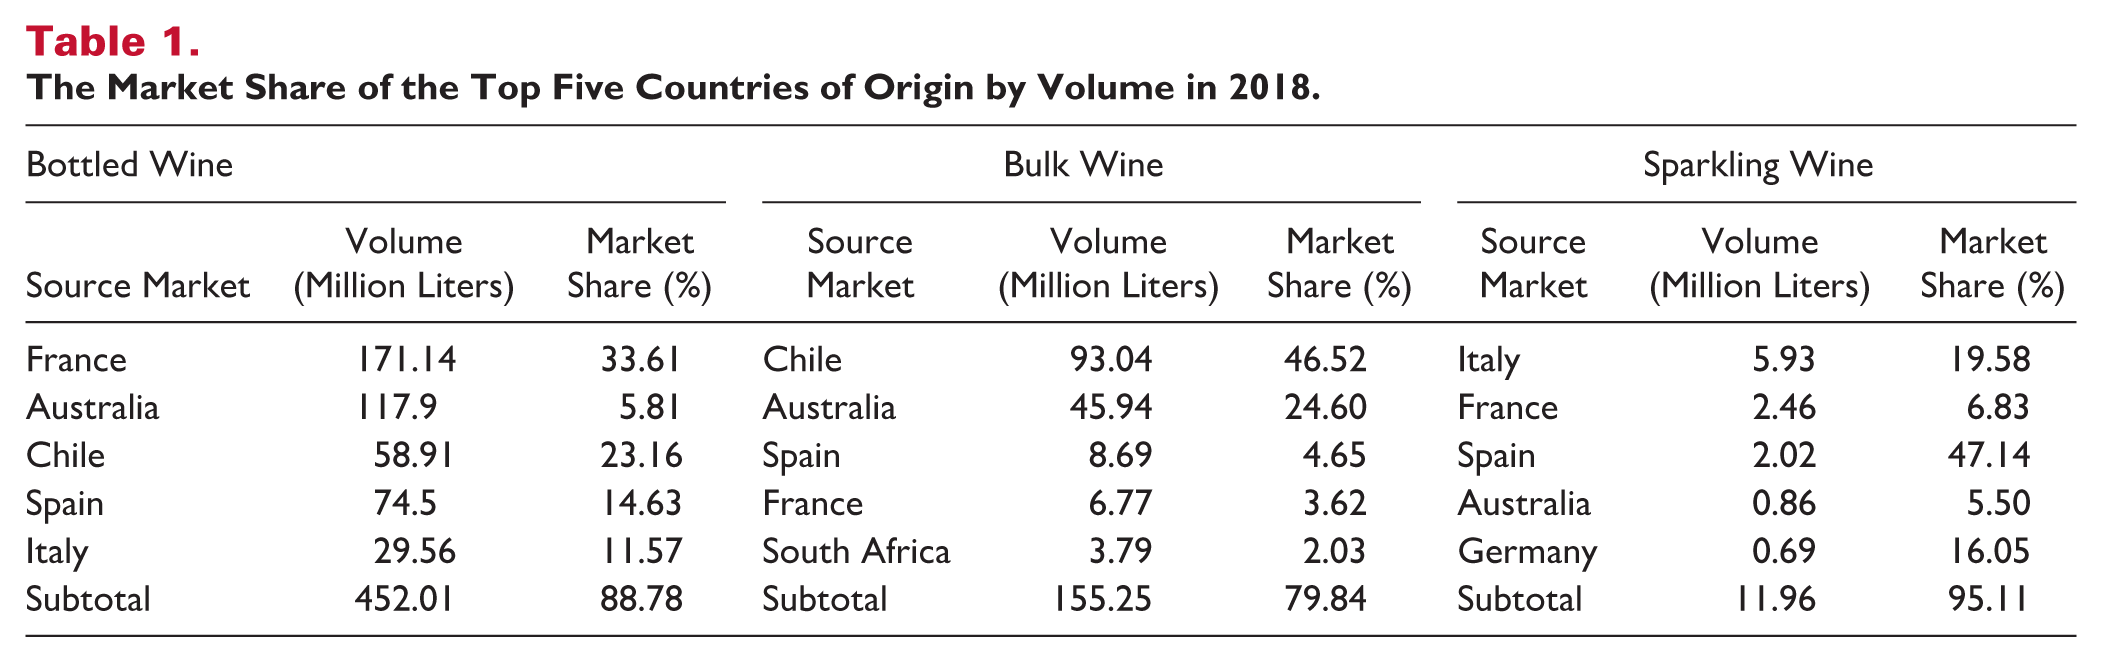
Demand for imported wine is measured by volume, and the quarterly data on imported bottled, bulk, and sparkling wine from the top five source markets are obtained from China Custom Statistics. The sample period is 2002 to 2018 for bottled wine, 2007 to 2018 for bulk wine, and 2004 to 2018 for sparkling wine. The market shares of the top five countries of origin by volume in 2018 are presented in Table 1. Bottled wine is the dominant product imported by Chinese consumers. In 2018, China imported 452.01 million liters of wine from the selected markets, accounting for 8.78% of the total. French wine was the most popular imported bottled wine in China with a volume of 171.14 million liters, accounting for 33.61% of the bottled wine market. The volume of imported bulk wine from the top five source markets was 155.25 million liters and accounted for 79.84% of the imported bulk wine market; 49.92% of the imports came from Chile. The sparkling wine market was even smaller. Although the top five COOs account for 95.11% of the sparkling wine market, the volume of imported sparkling wine was only 11.96 million liters, with 5.93 million liters coming from Italy. France, Australia and Spain were the key source markets for China across the three types of wine; Chile was the key COO for bottled and bulk wine and Italy for bottled and sparkling wine. South Africa and Germany only played significant roles in the bulk and sparkling markets, respectively.
The Market Share of the Top Five Countries of Origin by Volume in 2018.
In Equation 4, income is measured by the Gross Domestic Production (GDP) index (2010 = 100), data on which are provided by the International Monetary Fund (IMF). The import price index (2010 = 100) equals the imported value divided by the imported volume adjusted by the real effective exchange rate index (2010 = 100). Data for the exchange rate index are also from the IMF. The cross prices of Old (New) World wine are weighted indexes of imported Old (New) World wine prices in the top five COOs and can be written as
It is assumed that the anti-corruption campaign launched by the President Xi Jinping at the end of 2012 had an impact during the forecasting period. A structural dummy is introduced to reflect this influence. This dummy takes the value one from 2013 to 2023 and zero otherwise. Due to heterogeneity in its impact and the speed with which the campaign spread across various markets, the starting points of the observations differ by setting. In addition to the seasonal dummies, another common variable used in such forecasting models captures the dramatic decline in imported wine in the fourth quarter of 2018, which resulted from the trade war between China and the United States and its impact on the global economy. The specifics of the dummy variable differ across models due to variation in its degree of influence. Other dummy variables are set to capture events in specific markets, including the cancelation of the Australian and Chilean wine tariff at the end of 2015, fluctuations in production by country of origin and actions taken by key importers.
Findings and Discussion
Unit Root Test
The Augmented Dickey–Fuller (ADF) and Phillips–Perron (PP) tests and the Covariate Augmented Dickey–Fuller (CADF) test (which was designed for the examination of data with structural breaks) are used to examine the integration order of all variables in the proposed models. The null hypothesis of all three tests is that the data contain unit roots, which would mean that the data are not stationary. Only if more than two tests suggest the same integration order can the order be determined. The variables involved in the model of imported bottled wine from France are used as an example to demonstrate the results of the unit root tests, which are listed in Table 2. The results of other models are available upon request but left untabulated due to space limitations. The level data for
Unit Root Test Results of France.
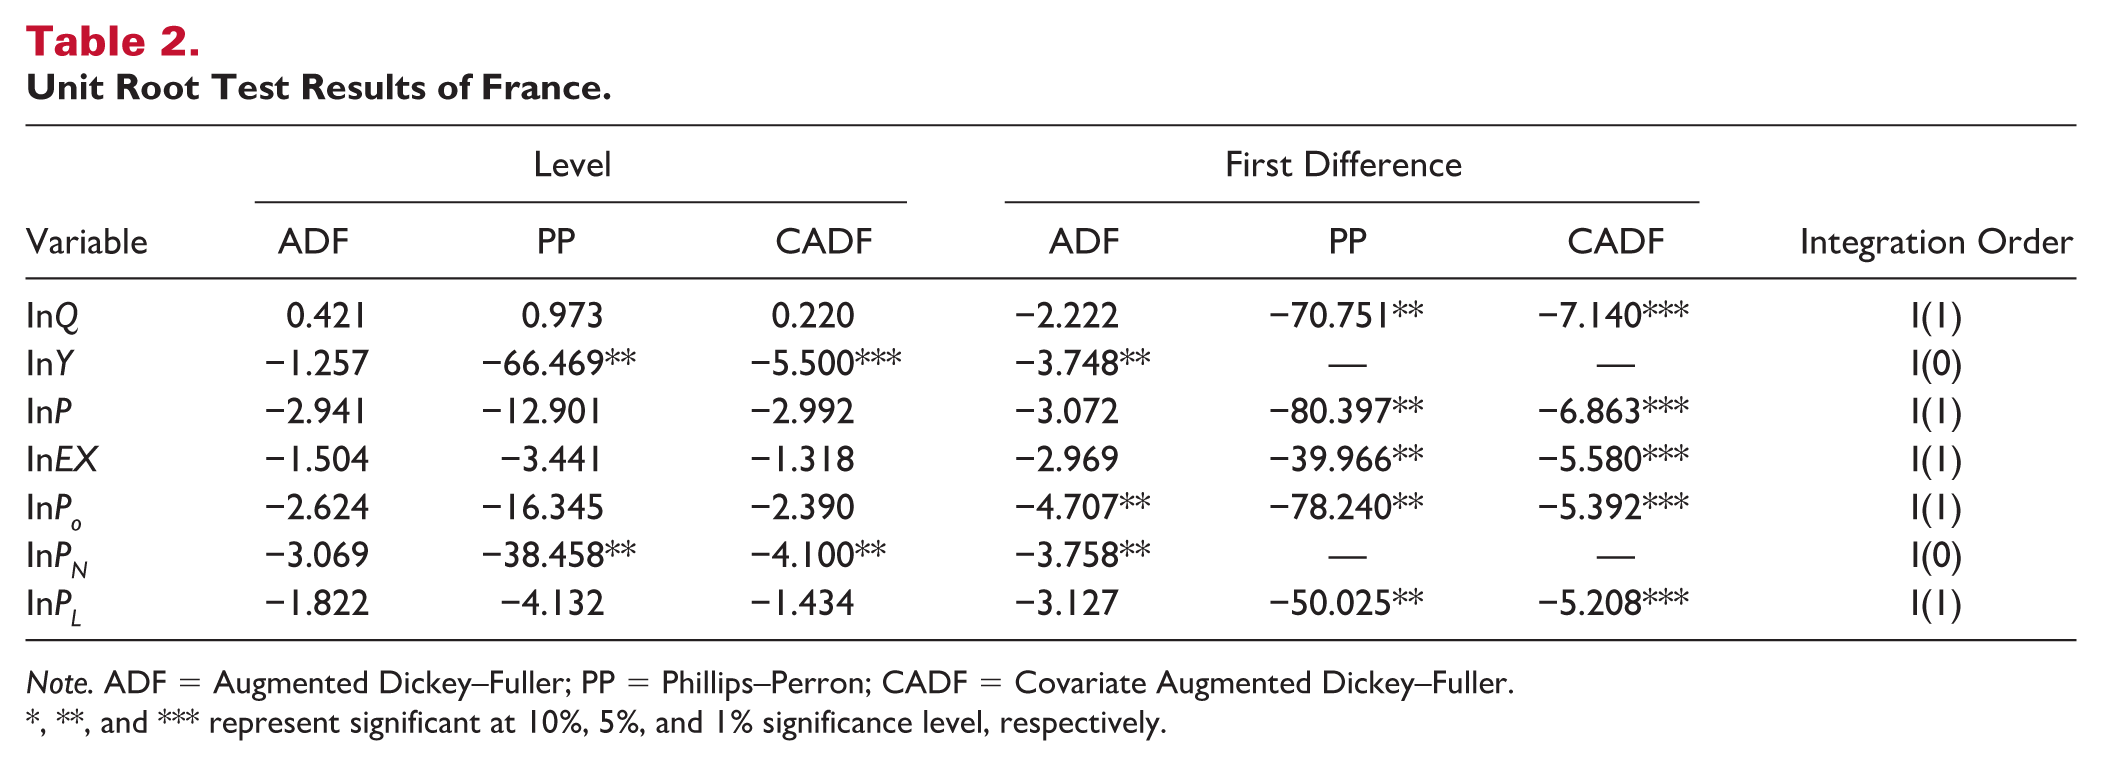
Note. ADF = Augmented Dickey–Fuller; PP = Phillips–Perron; CADF = Covariate Augmented Dickey–Fuller.
**, and *** represent significant at 10%, 5%, and 1% significance level, respectively.
Cointegration Test
To examine the cointegration relationship between the dependent and independent variables, the bounds test proposed by Pesaran et al. (2001) is used. The main procedure of the test are as follows. After estimating the model using the general to specific approach, the long-term variables left in the model should pass a joint test with the null hypothesis that all coefficients of the long-term variables equal zero. If the calculated F-statistic is larger than the upper bound set by Pesaran et al. (2001), the null hypothesis can be rejected. The coefficient of the lagged dependent variable should be large enough that its t-statistic is larger than the upper bound of the selected threshold interval in absolute value. Only if the F- and t-tests are satisfied can the long-term relationship between the dependent variable and the determinants be identified. The details of the introduction of the bounds test are given by Song and Lin (2010).
The results of the bounds tests (the F- and t-statistics) are presented in Table 3. Different long-term variables are kept by the general to specific approach in various models, so different criteria intervals are specified for the different numbers of explanatory variables. The F- and t-statistics of 11 out of 15 models exceed the upper bound at the 5% or 1% significance level; the French and Italian bottled and sparkling wine coefficients do not pass the t-test. It can be argued that 11 out of 15 models confirm the existence of long-run relationships between imported wine demand and its determinants. The models for the demand for French and Italian bottled and sparkling wine fail to reject the null hypothesis of the bounds test, indicating that long-run relationships between the demands for these products and their influencing factors do not exist. This result could be caused by the tremendous growth in imported French and Italian wine and the relatively small sample size used in this study; caution is needed when explaining the results for these four markets.
Cointegration Test Results.
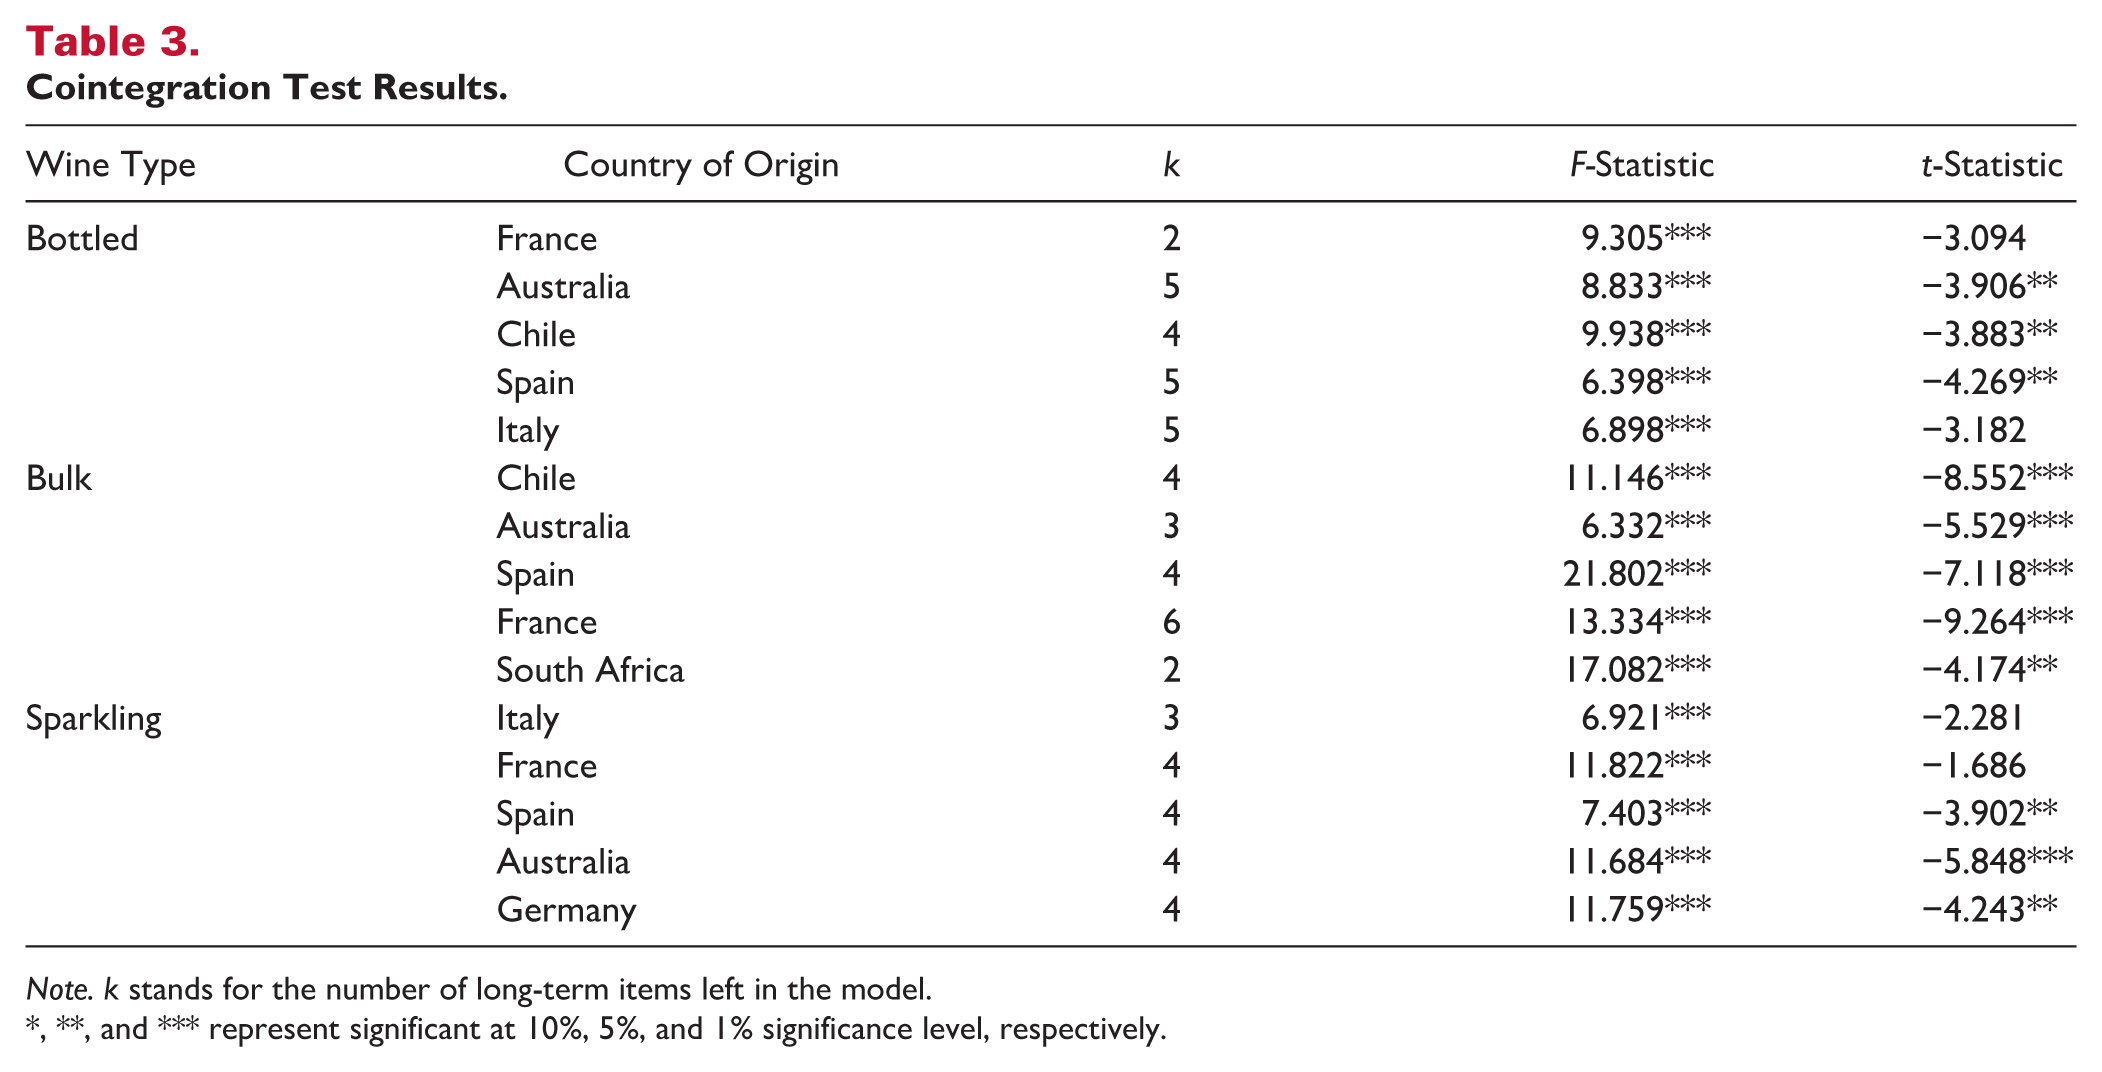
Note. k stands for the number of long-term items left in the model.
**, and *** represent significant at 10%, 5%, and 1% significance level, respectively.
Diagnostic Tests
The results of the diagnostic tests are shown in Table 4. There are good model fits for all 15 models as all R2s are above .61, indicating that at least 61% of the variation in the demand for imported wine in the sample period can be explained by the independent variables. The adjusted R2s range from .52 to .91, meaning that after eliminating the effect of the number of variables on the R2s, the model fits are still good. The model fits the bulk wine market the best with R2s ranging from .69 for Australia to .95 for Spain, followed by the bottled wine market with R2s ranging from .61 for France to .85 for Chile and the sparkling wine market with R2s ranging from .61 for Italy to .87 for Germany. In addition, all F-statistics are significant at the 1% level, with the exceptions of F-statistics that are not available because the constant terms are not significant and were removed from the models. Eight out of 15 models pass all diagnostic tests including the normality, autocorrelation, heteroscedasticity and autoregressive conditional heteroscedasticity (ARCH) tests. In the other seven models, six fail to pass the heteroscedasticity test and three fail the ARCH test; the models of the demand for bottled wine from Australia and sparkling wine from Spain fail to pass both tests. Overall, the diagnostic test results show that the estimation results of the models are valid and reliable and can be used to calculate elasticities and generate forecasts.
Diagnostic Test Results.
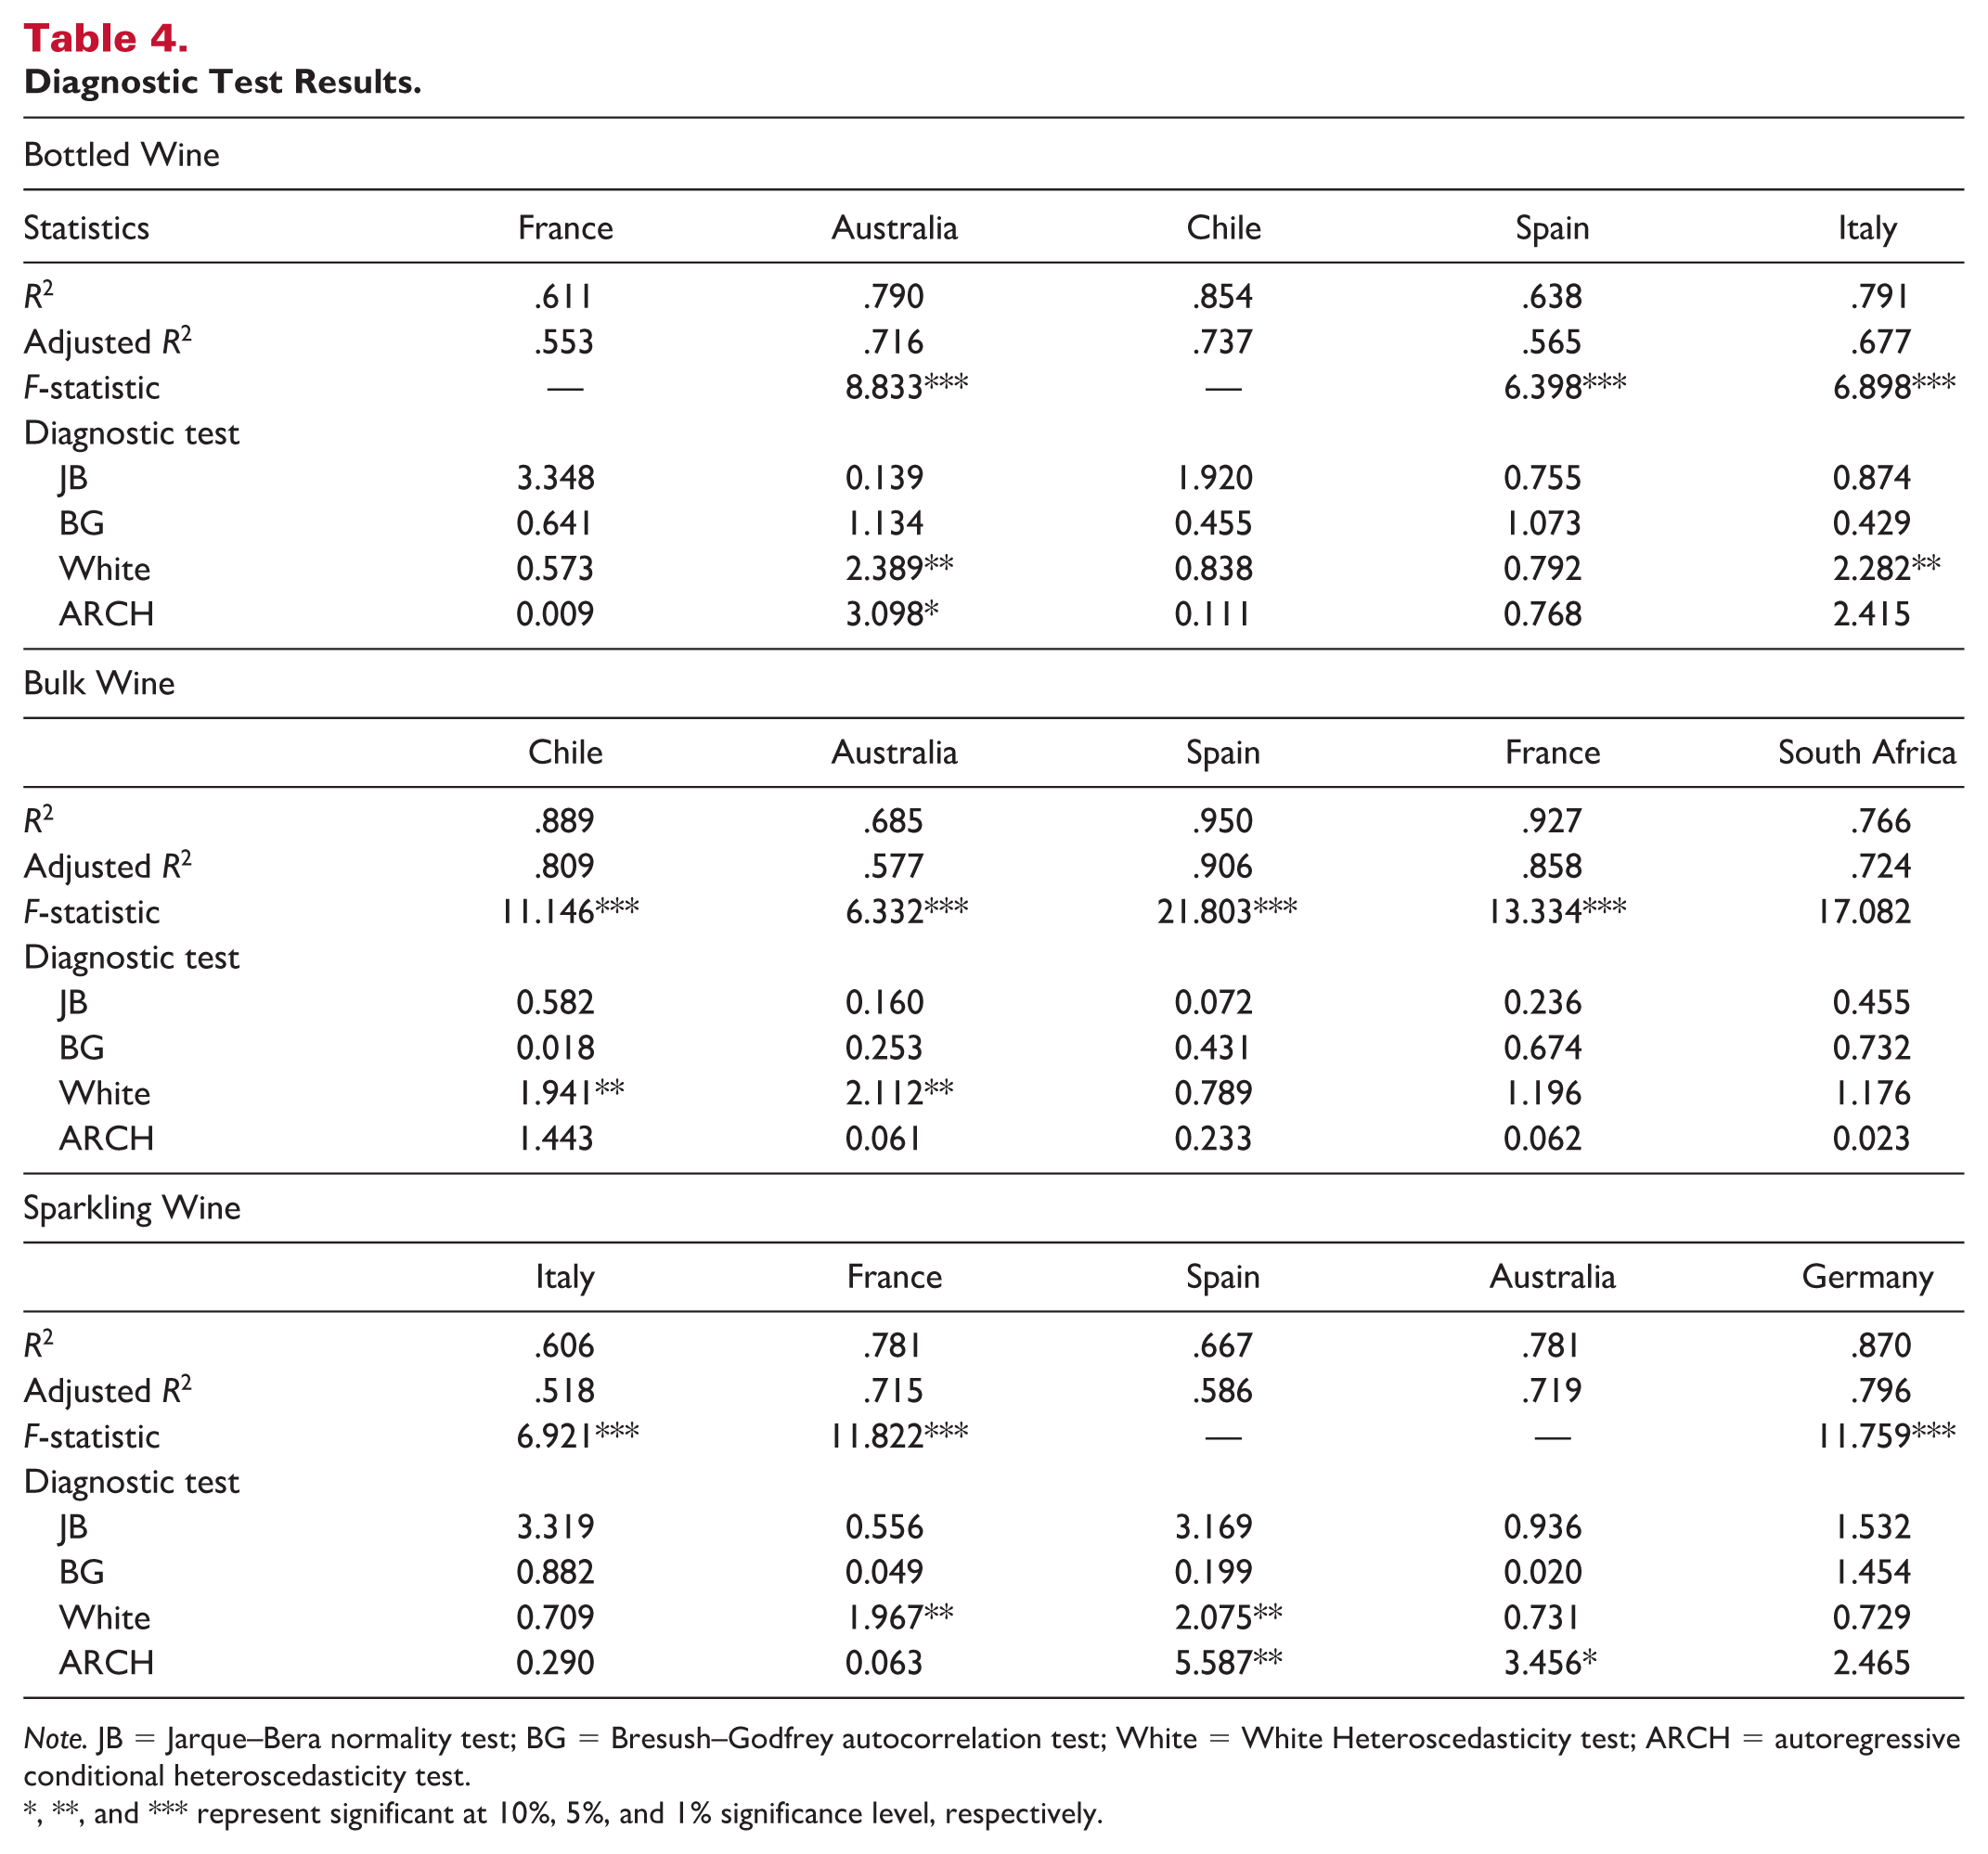
Note. JB = Jarque–Bera normality test; BG = Bresush–Godfrey autocorrelation test; White = White Heteroscedasticity test; ARCH = autoregressive conditional heteroscedasticity test.
**, and *** represent significant at 10%, 5%, and 1% significance level, respectively.
Demand Elasticities
The calculated demand elasticities based on the estimation results using the general to specific approach are presented in Table 5. Income and price elasticities are significant in 10 and eight out of the 15 models, respectively, indicating the important role that income and price play in determining imported wine demand. In line with economic theory, all of the income elasticities are positive and all of the available price elasticities are negative. All of the exchange rate elasticities are insignificant except for Spanish bottled wine, indicating that the exchange rate is not a long-term determinant of Chinese consumers’ demand for imported wine. Both the positive and negative cross elasticities of other wine and spirits and Old and New World wine are obtained, which means that there are different market positions for different wines. When the cross-price elasticity is positive, the products are competitors; when the cross-price elasticity is negative, the products are complements.
Demand Elasticities of Imported Wine of China.
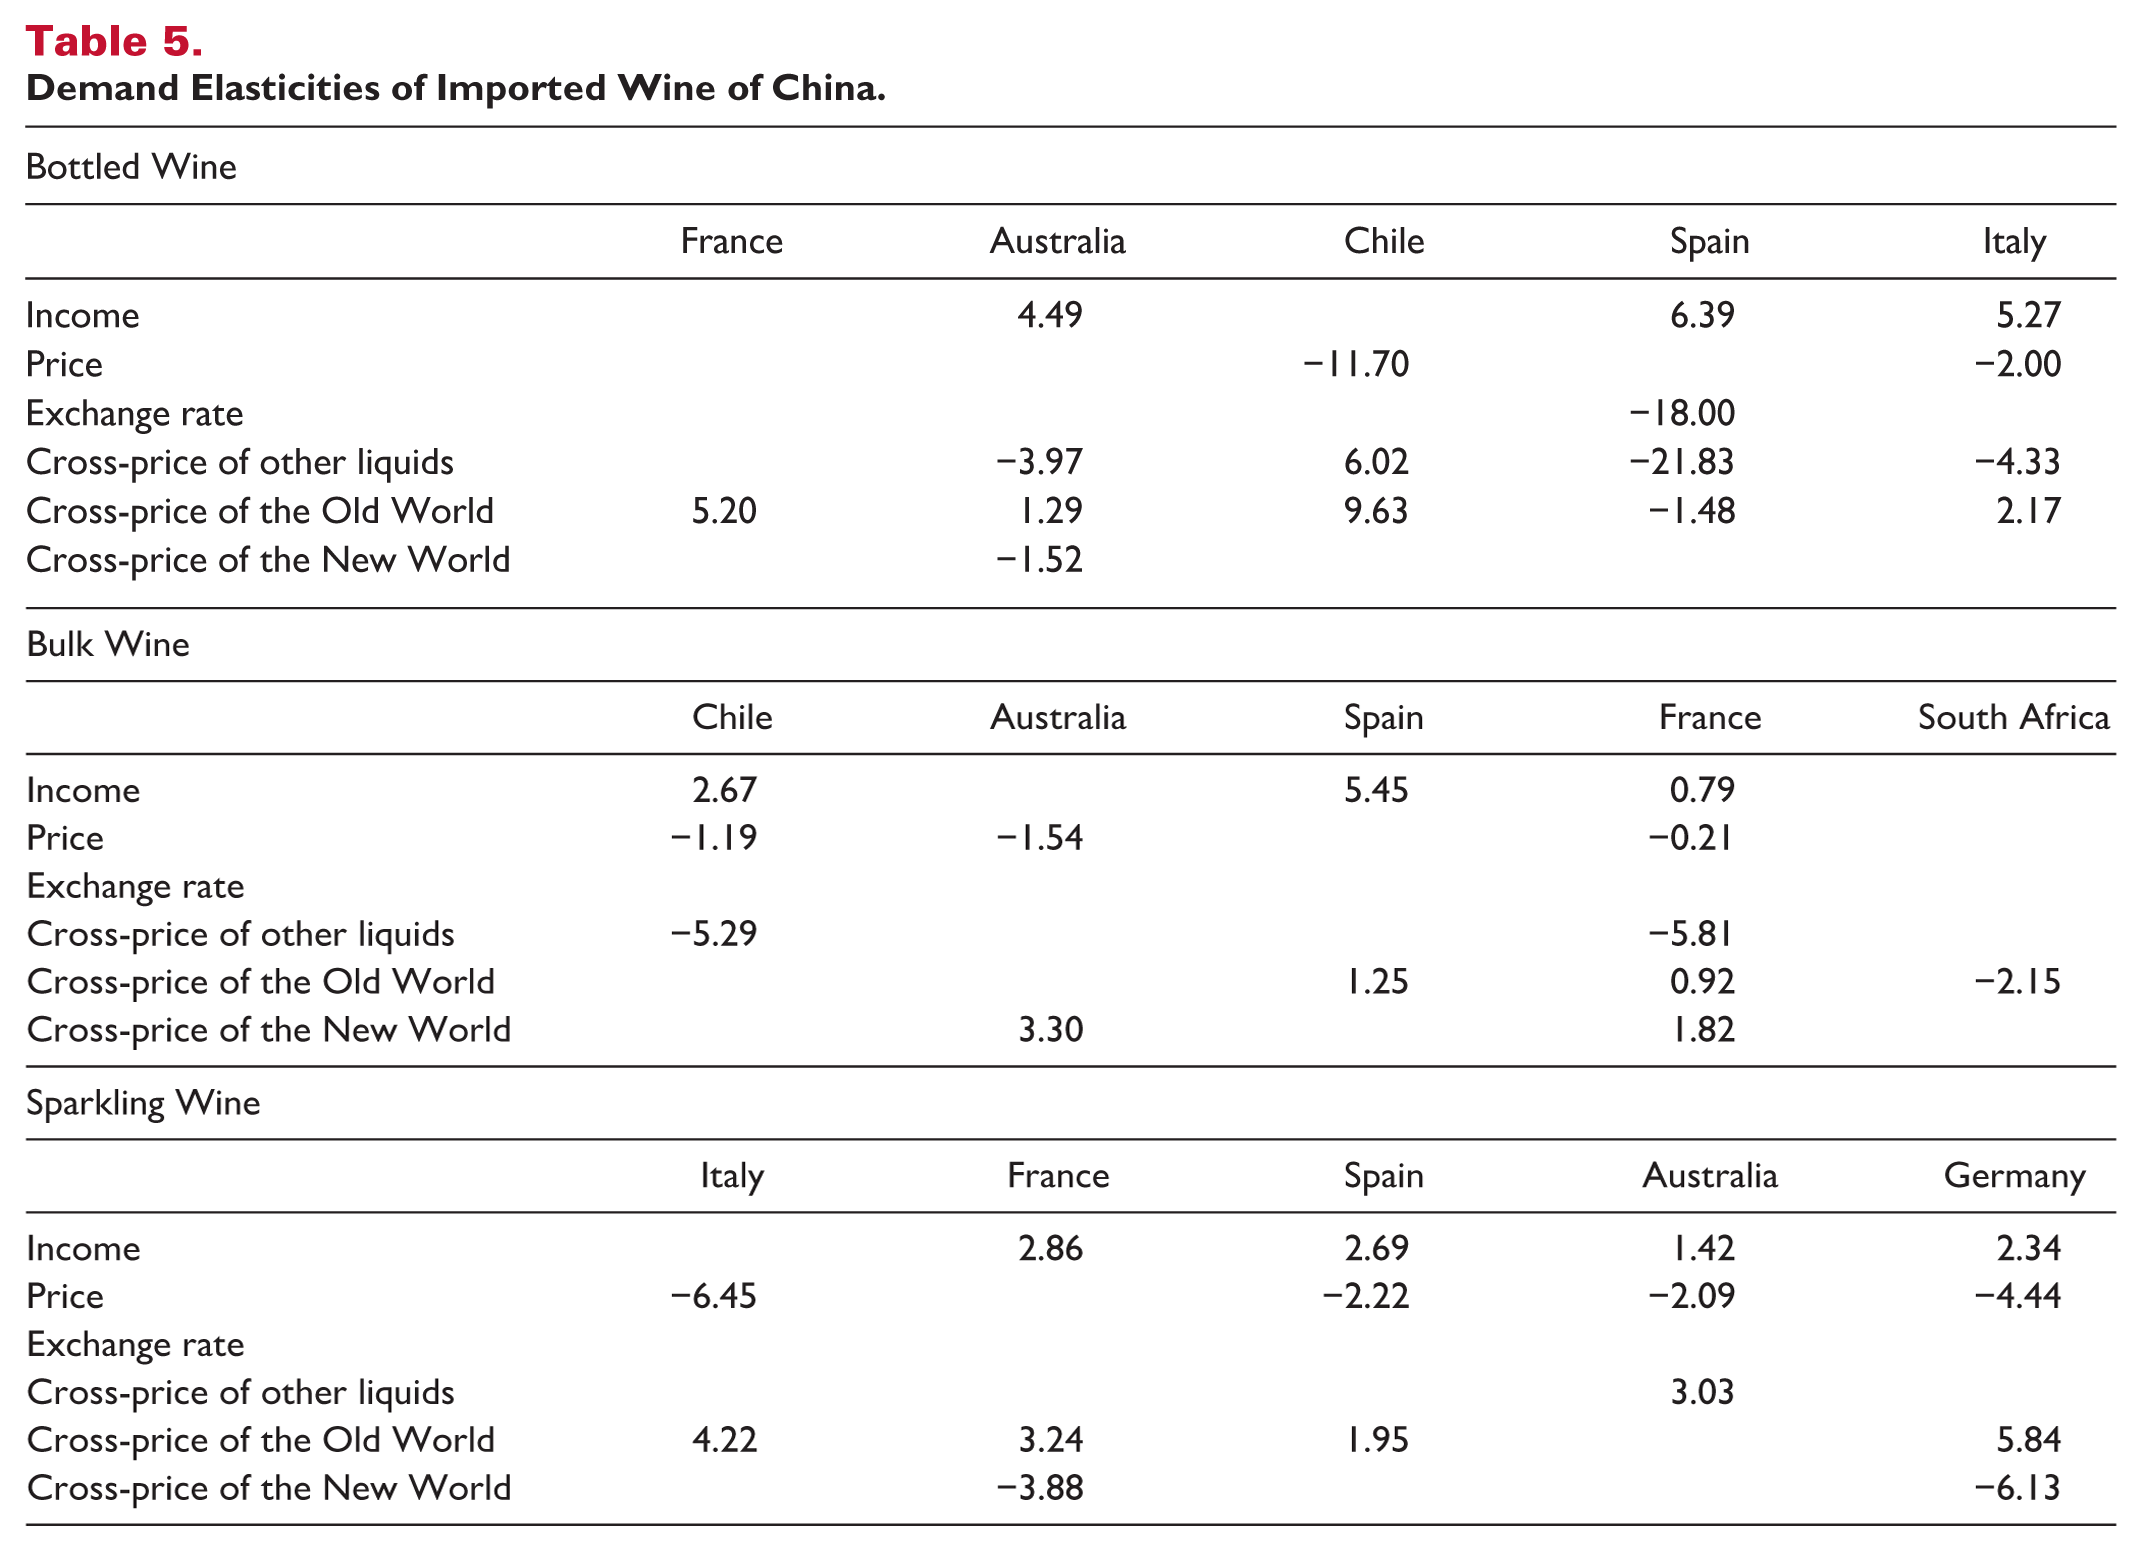
In the bottled wine market, demand for French wine is only determined by the cross-price elasticity of Old World wine (5.20); if the price of Old World wine increases by 1%, the demand for French wine increases by 5.20%. Surprisingly, income and price do not influence demand significantly. A possible reason for this lack of influence is that Chinese consumers prefer to choose wine by COO, particularly for Old World wine (Balestrini & Gamble, 2006; Camillo, 2012; Hu et al., 2008; Yang & Paladino, 2015; Yu et al., 2009). Moreover, Old World wine, and particularly French wine, is the symbol of wine in China, so the consumption of French wine is more likely to be determined by word of mouth and the substitute price elasticity of Old World wine. Income is not a significant influencing factor for Chilean wine either, but price plays a more important role in the import market for Chilean wine, demonstrating the impact of competitors’ prices on the demand for Chilean wine. Although previous studies have suggested that Chinese wine consumers in general lack basic wine knowledge (H. Lee et al., 2009; J. G. Li et al., 2011), the cross elasticities of Chilean wine indicate that Chinese wine consumers consider Chilean wine to be a competitor of Old World wine and other alcoholic beverages, which shows the increasing reputation of Chilean wine in China.
The income elasticities for Australian, Spanish, and Italian wine are significant and range from 4.49 for Australia to 6.39 for Spain. All of the income elasticities are much larger than 1, meaning that demand for imported bottled wine from these three COOs by Chinese consumers is very sensitive to changes in income. The sustained and rapid growth of the Chinese economy over the last few decades explains the impressive expansion in the demand for imported wine from these three markets. Compared with income, prices and exchange rates do not play an important role in determining the demand for imported bottled wine because Chinese consumers consider drinking foreign wine as a symbol of social status or buy imported wine as gifts (Lin & Tavoletti, 2013; F. Liu & Murphy, 2007).
The negative cross-price elasticities of other wine and spirits in the Australian, Italian, and Spanish models show that Chinese consumers consider these wines to be complements for other wine and spirits. These elasticities also suggest that Chinese consumers treat these wines the same as other wine and spirits in terms of daily alcoholic beverage consumption. Like French and Chilean wine, Chinese consumers prefer to import more Australian and Italian wine but less Spanish wine when the prices of Old World wines increase. This shows that the first two COOs are competitors of the Old World while Spanish wine is a complement. In addition, Australian wine is considered a complement of New World wine, indicating the significant difference in preferences of Chinese consumers between Old World and New World wine and the development of the Chinese market.
In the bulk wine market, income plays an important role to determining the demand for imported Chilean, Spanish, and French wine, with elasticities of 2.67, 5.45, and 0.79, respectively. These elasticities indicate that the sustained economic growth of China is the cause of the expansion of imports from these three COOs. Imports of bulk wine from Chile, Australia, and France are influenced by price. The first two COOs are more sensitive to price changes as the price elasticities of the two markets are greater than unity in absolute value. This may explain the dramatic expansion of the two markets over the last few years due to the cancelation of tariffs. Imported French bulk wine is not sensitive to either income or price changes, suggesting that Chinese consumers consider French wine a necessary alcoholic beverage in their lives. Spanish and French wines are competitors in the Old World bulk wine market, and Australian wine is the competitor in the New World bulk wine market, which indicates the differences in preferences for wine between the Old and New World COOs. However, some of the signs of the cross-price elasticities are not consistent with expectations. For example, Chilean and French bulk wine are complements for other liquors in China, and French bulk wine is also a competitor of New World bulk wine. This may be because most importers of bulk wine are wine producers rather than wholesalers, so purchase decisions are made to maximize profits rather than in the pursuit of preferences for certain wine.
Although sparkling wine has the lowest market value of the three types of imported wine, the income elasticities for four out of five COOs are significant, with Italy as the exception. The elasticities range from 2.86 for France to 1.42 for Australia. All income elasticities are larger than one, indicating that Chinese consumers consider imported sparkling wine to be a luxury rather than a necessity, although not to the extent of bottled wine. Four out of five COOs present significant price elasticities: Italy (−6.45), Spain (−2.22), Australia (−2.09), and Germany (−4.44). This means that Chinese consumers are sensitive to changes in the price of sparkling wines from these four countries and are loyal to champagne because price is not a significant determinant of the demand for sparkling wine from France. Australian sparkling wine is considered a competitor of other alcoholic beverages, which means that it is drunk more regularly by Chinese consumers. Italian, French, Spanish, and German sparkling wines are substitutes for other Old World sparkling wines, and French and German sparkling wines are also complements of New World sparkling wines, which may represent preference for different wine-producing techniques.
Forecasts
Before forecasting imported wine demand, it is necessary to forecast the independent variables over the forecasting period. Forecasts for GDP are obtained from the World Bank, and other explanatory variables are predicted using the exponential smoothing method. The dummy variables for the anti-corruption campaign and the cancelation of the Australian and Chilean wine tariffs are set to one over the forecasting period as the impacts of these policy changes continue to be felt in the market. The predicted values are used to generate imported wine demand from 2019 to 2023 using the relationships estimated by Equation 4. Quarterly forecasts are presented in Figures 1 to 3 and annual forecasts are shown in Table 6.
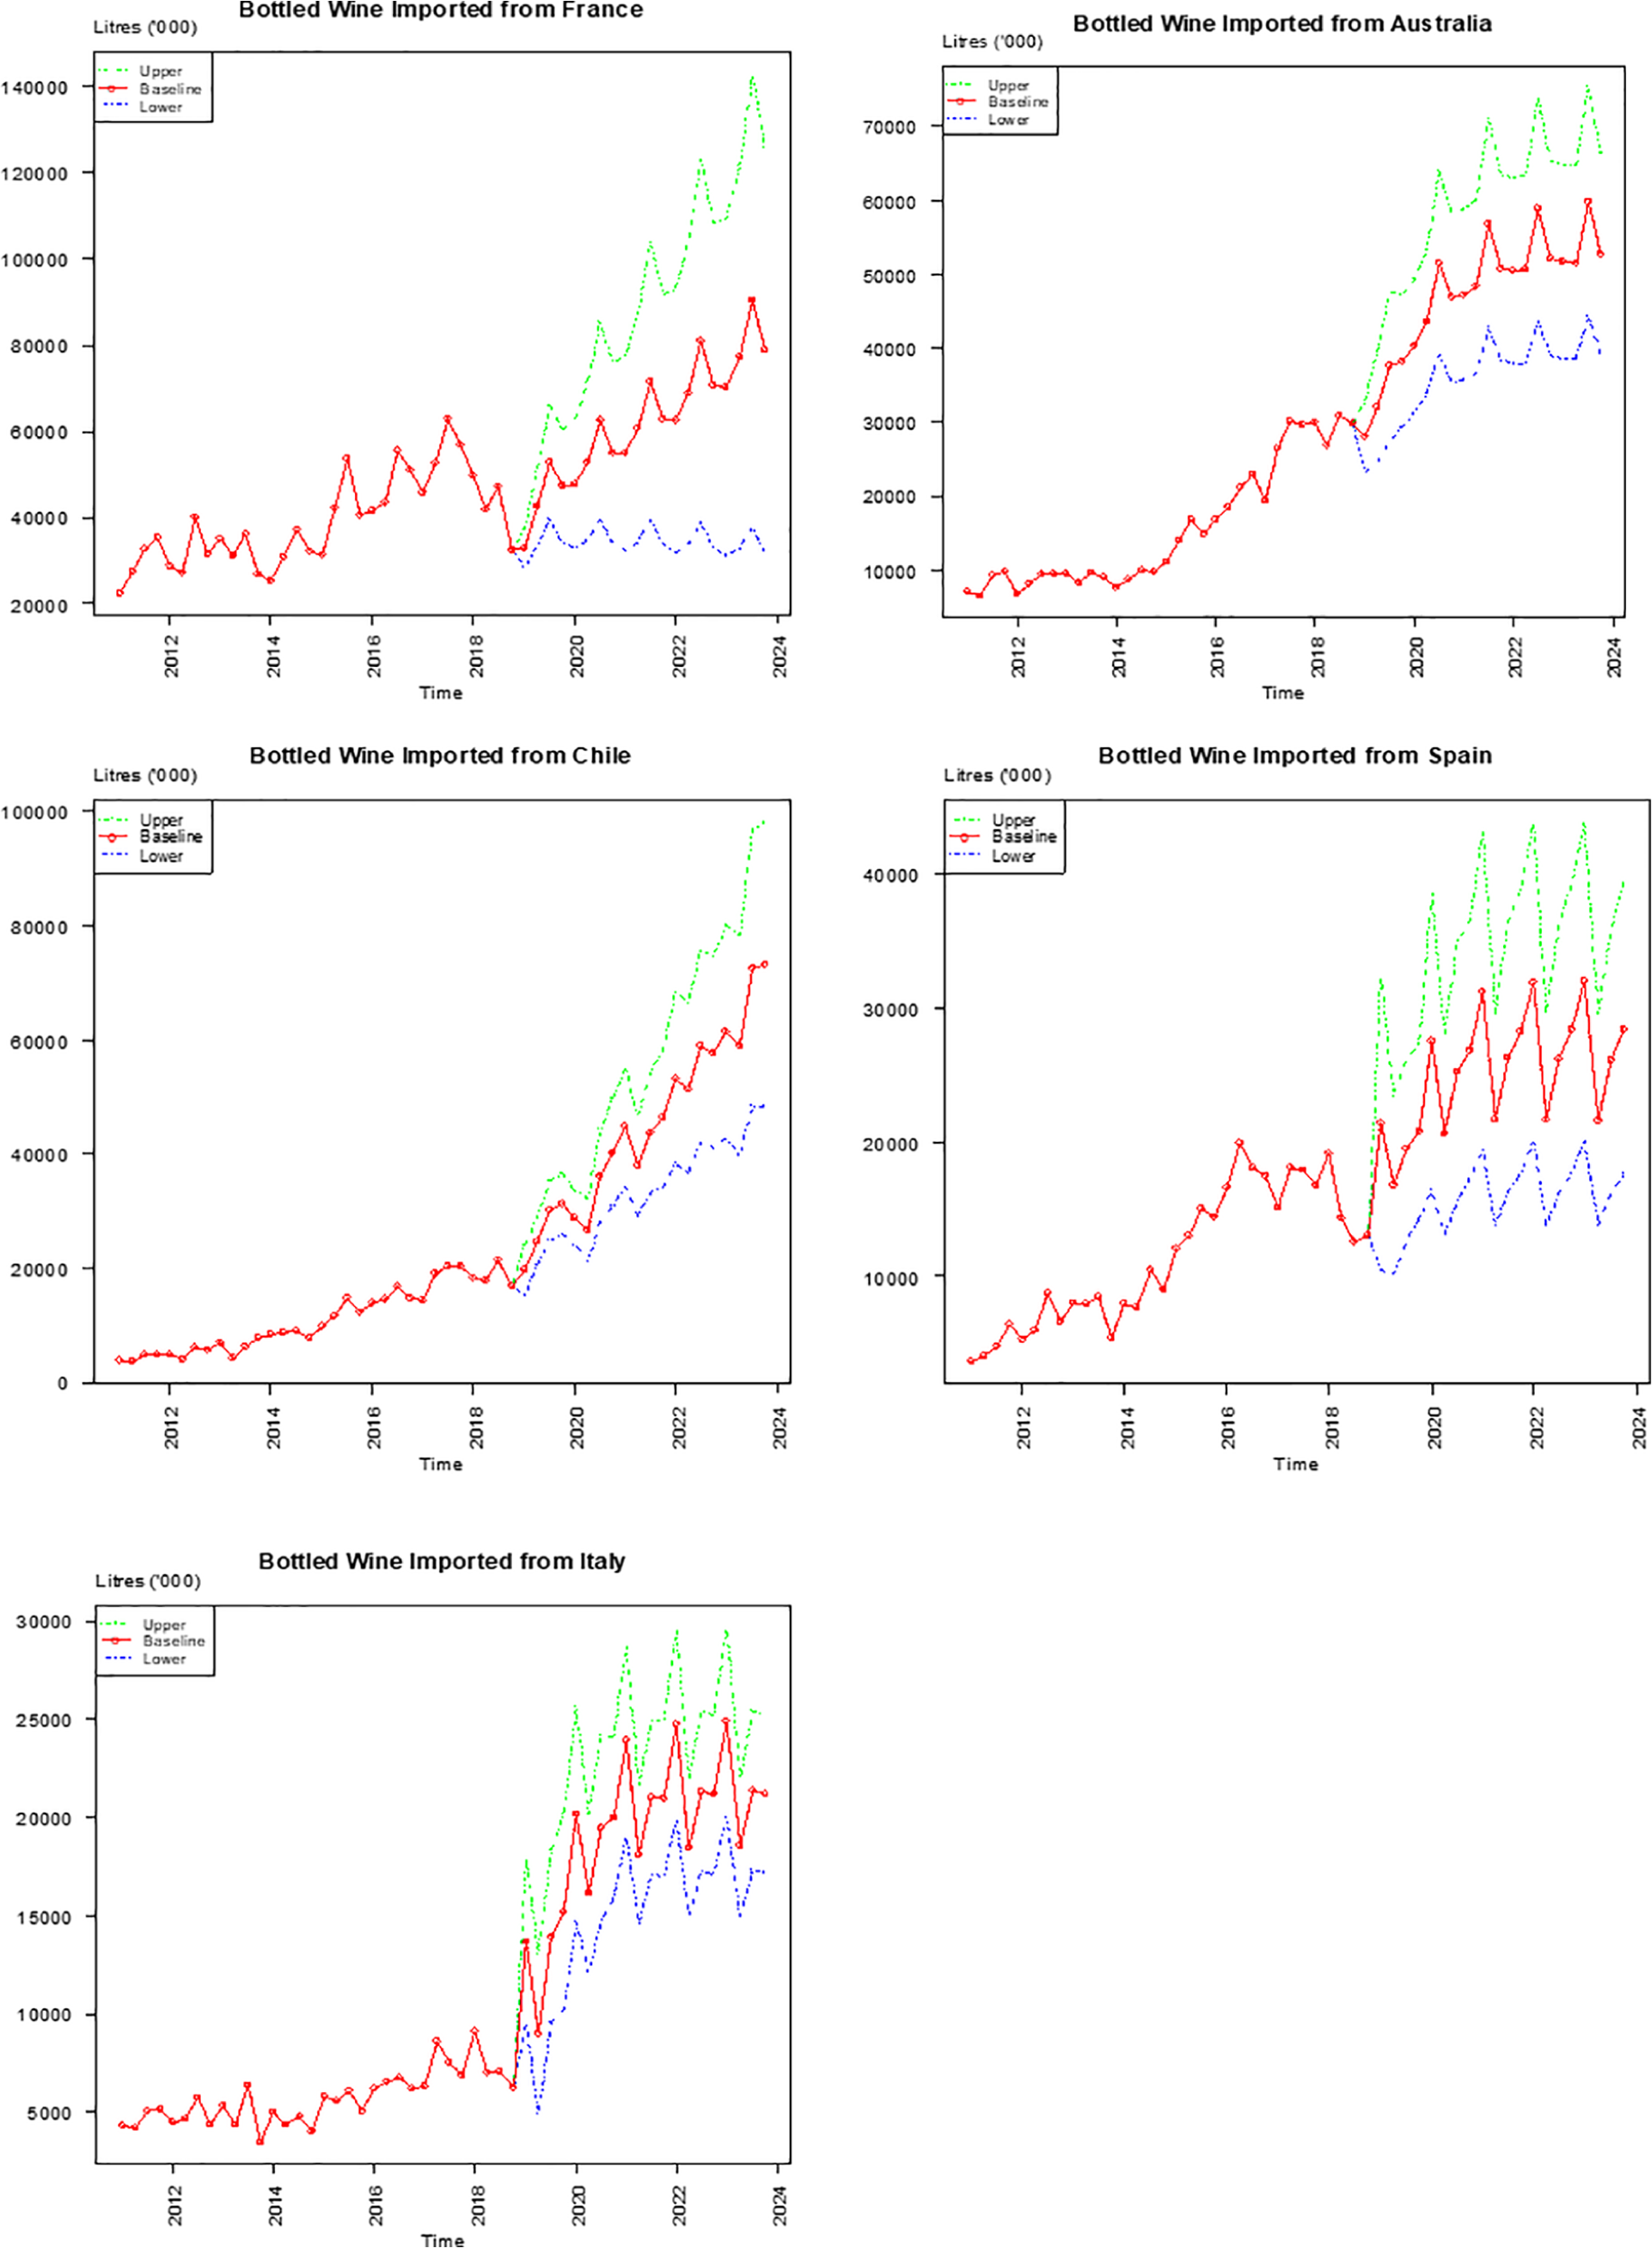
Forecasts of imported bottled wine to China (in thousands).
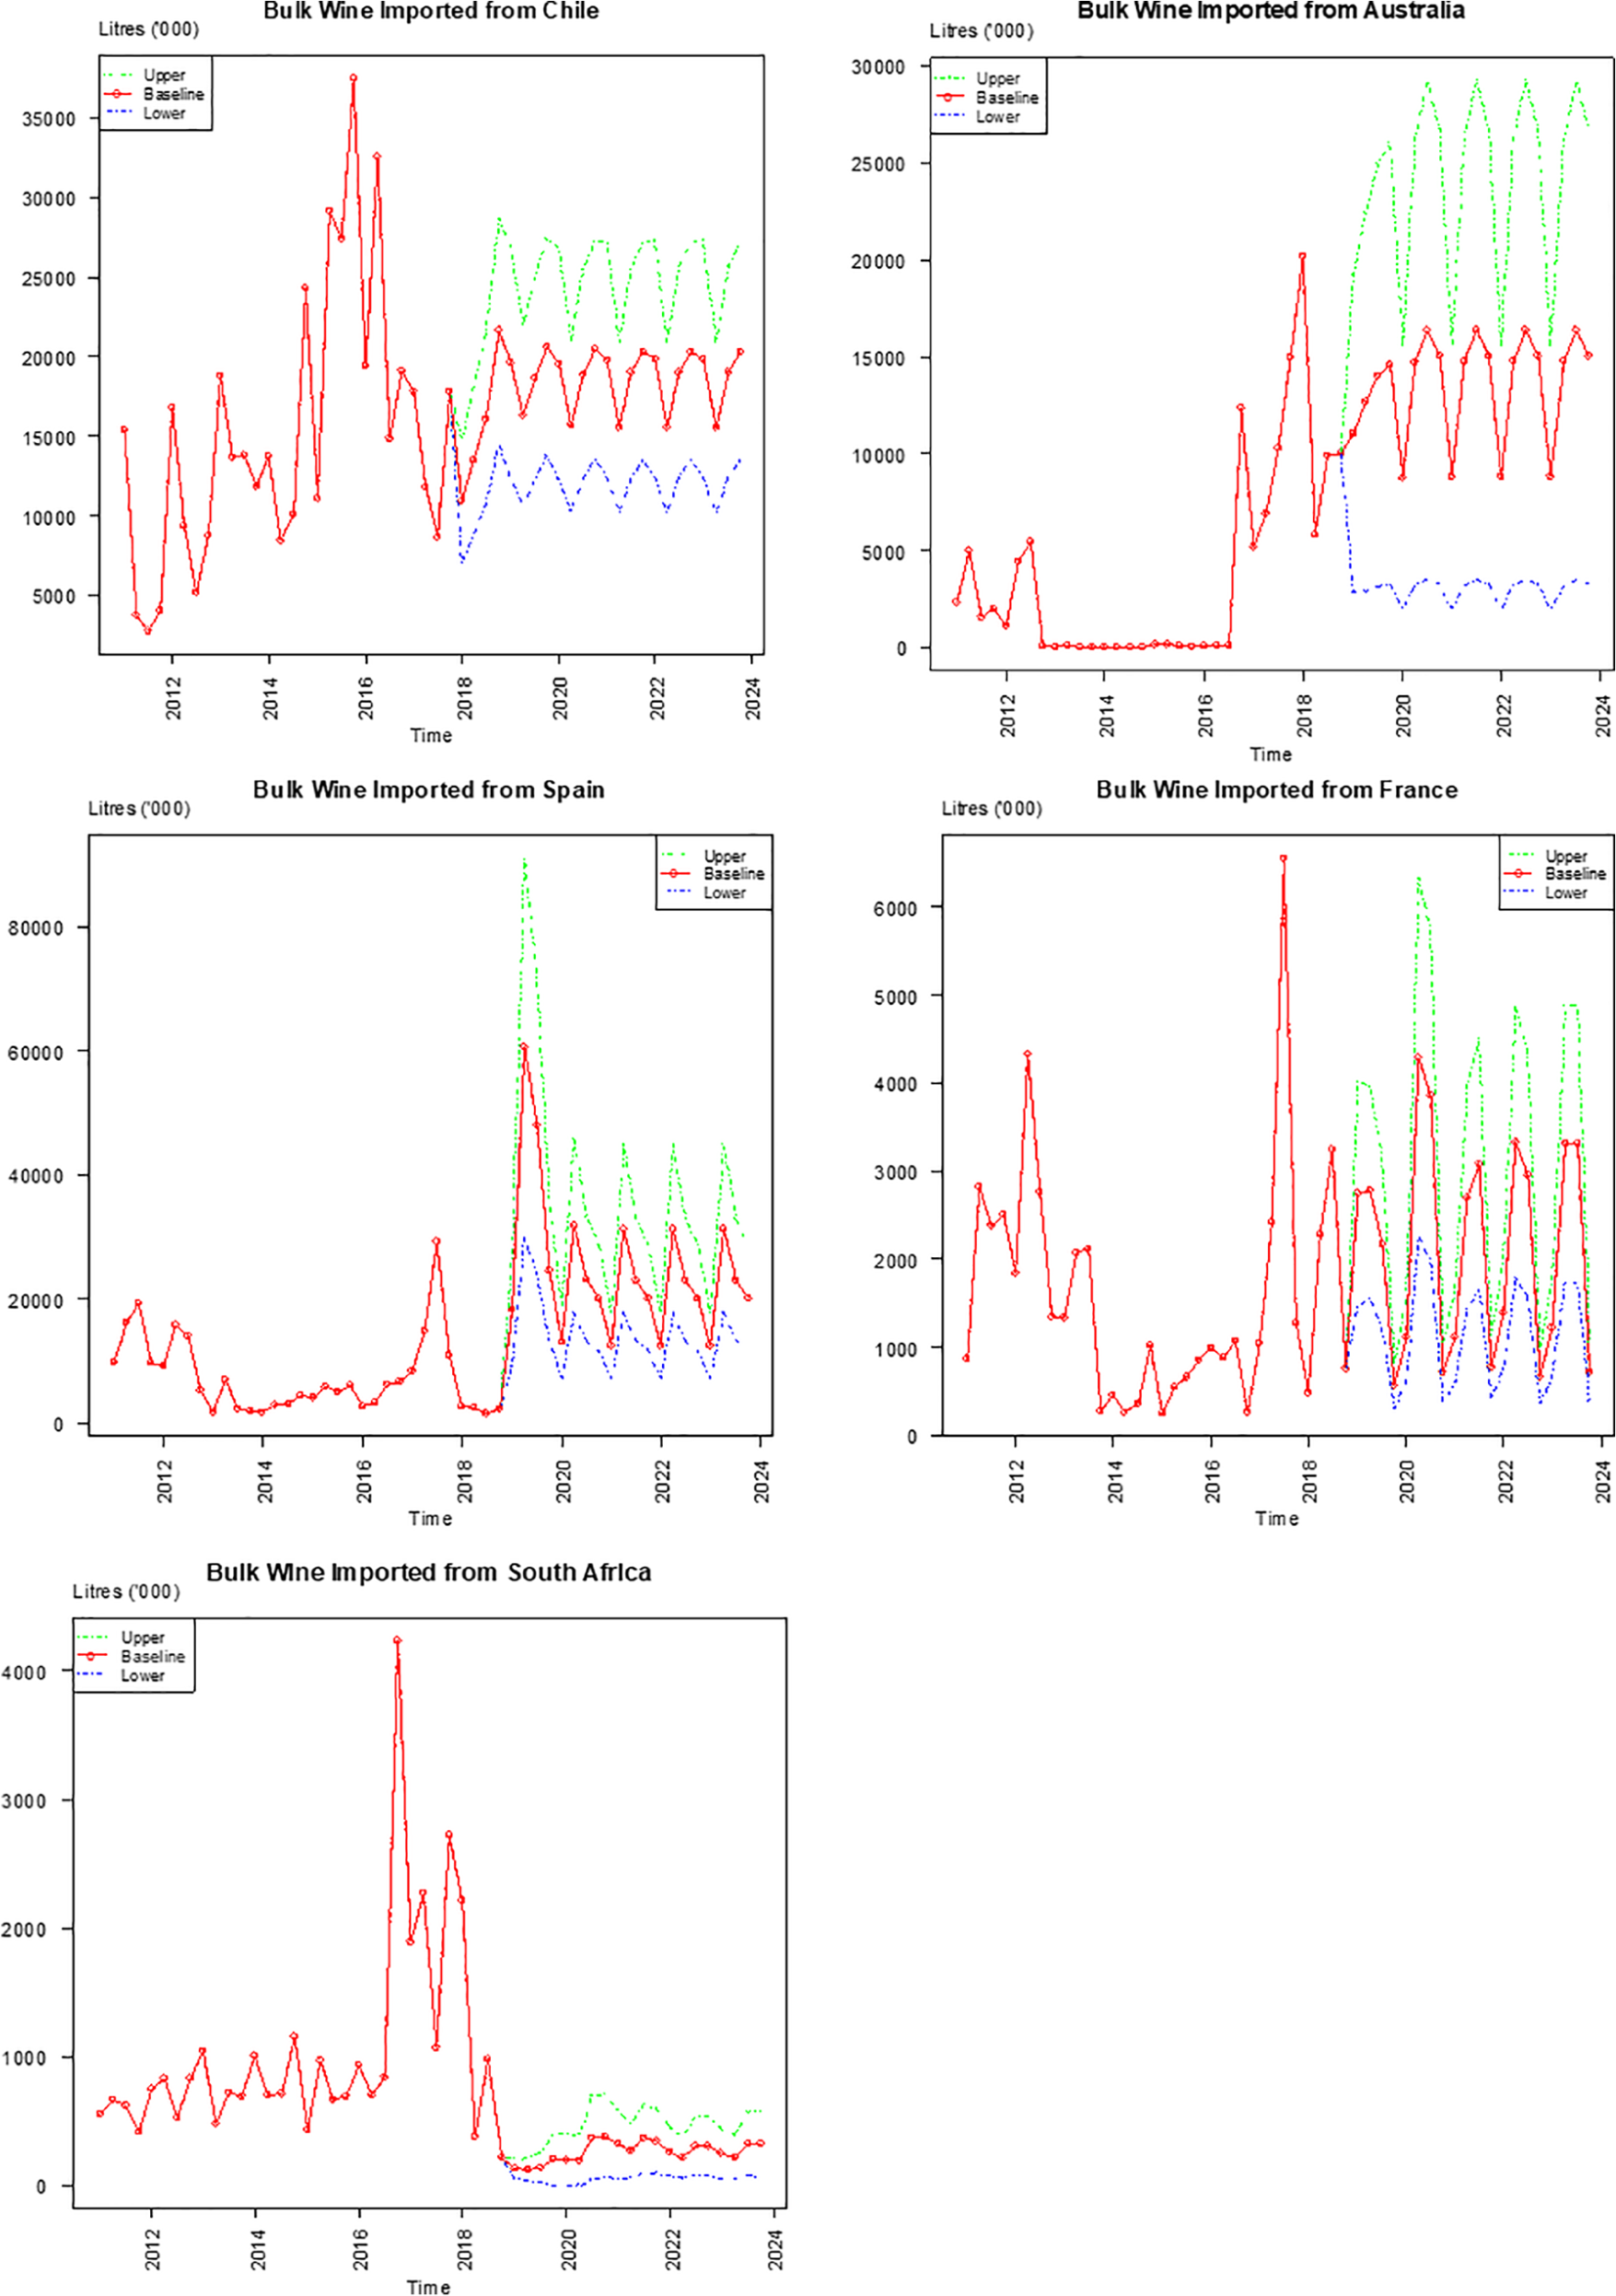
Forecasts of imported bulk wine to China (in thousands).
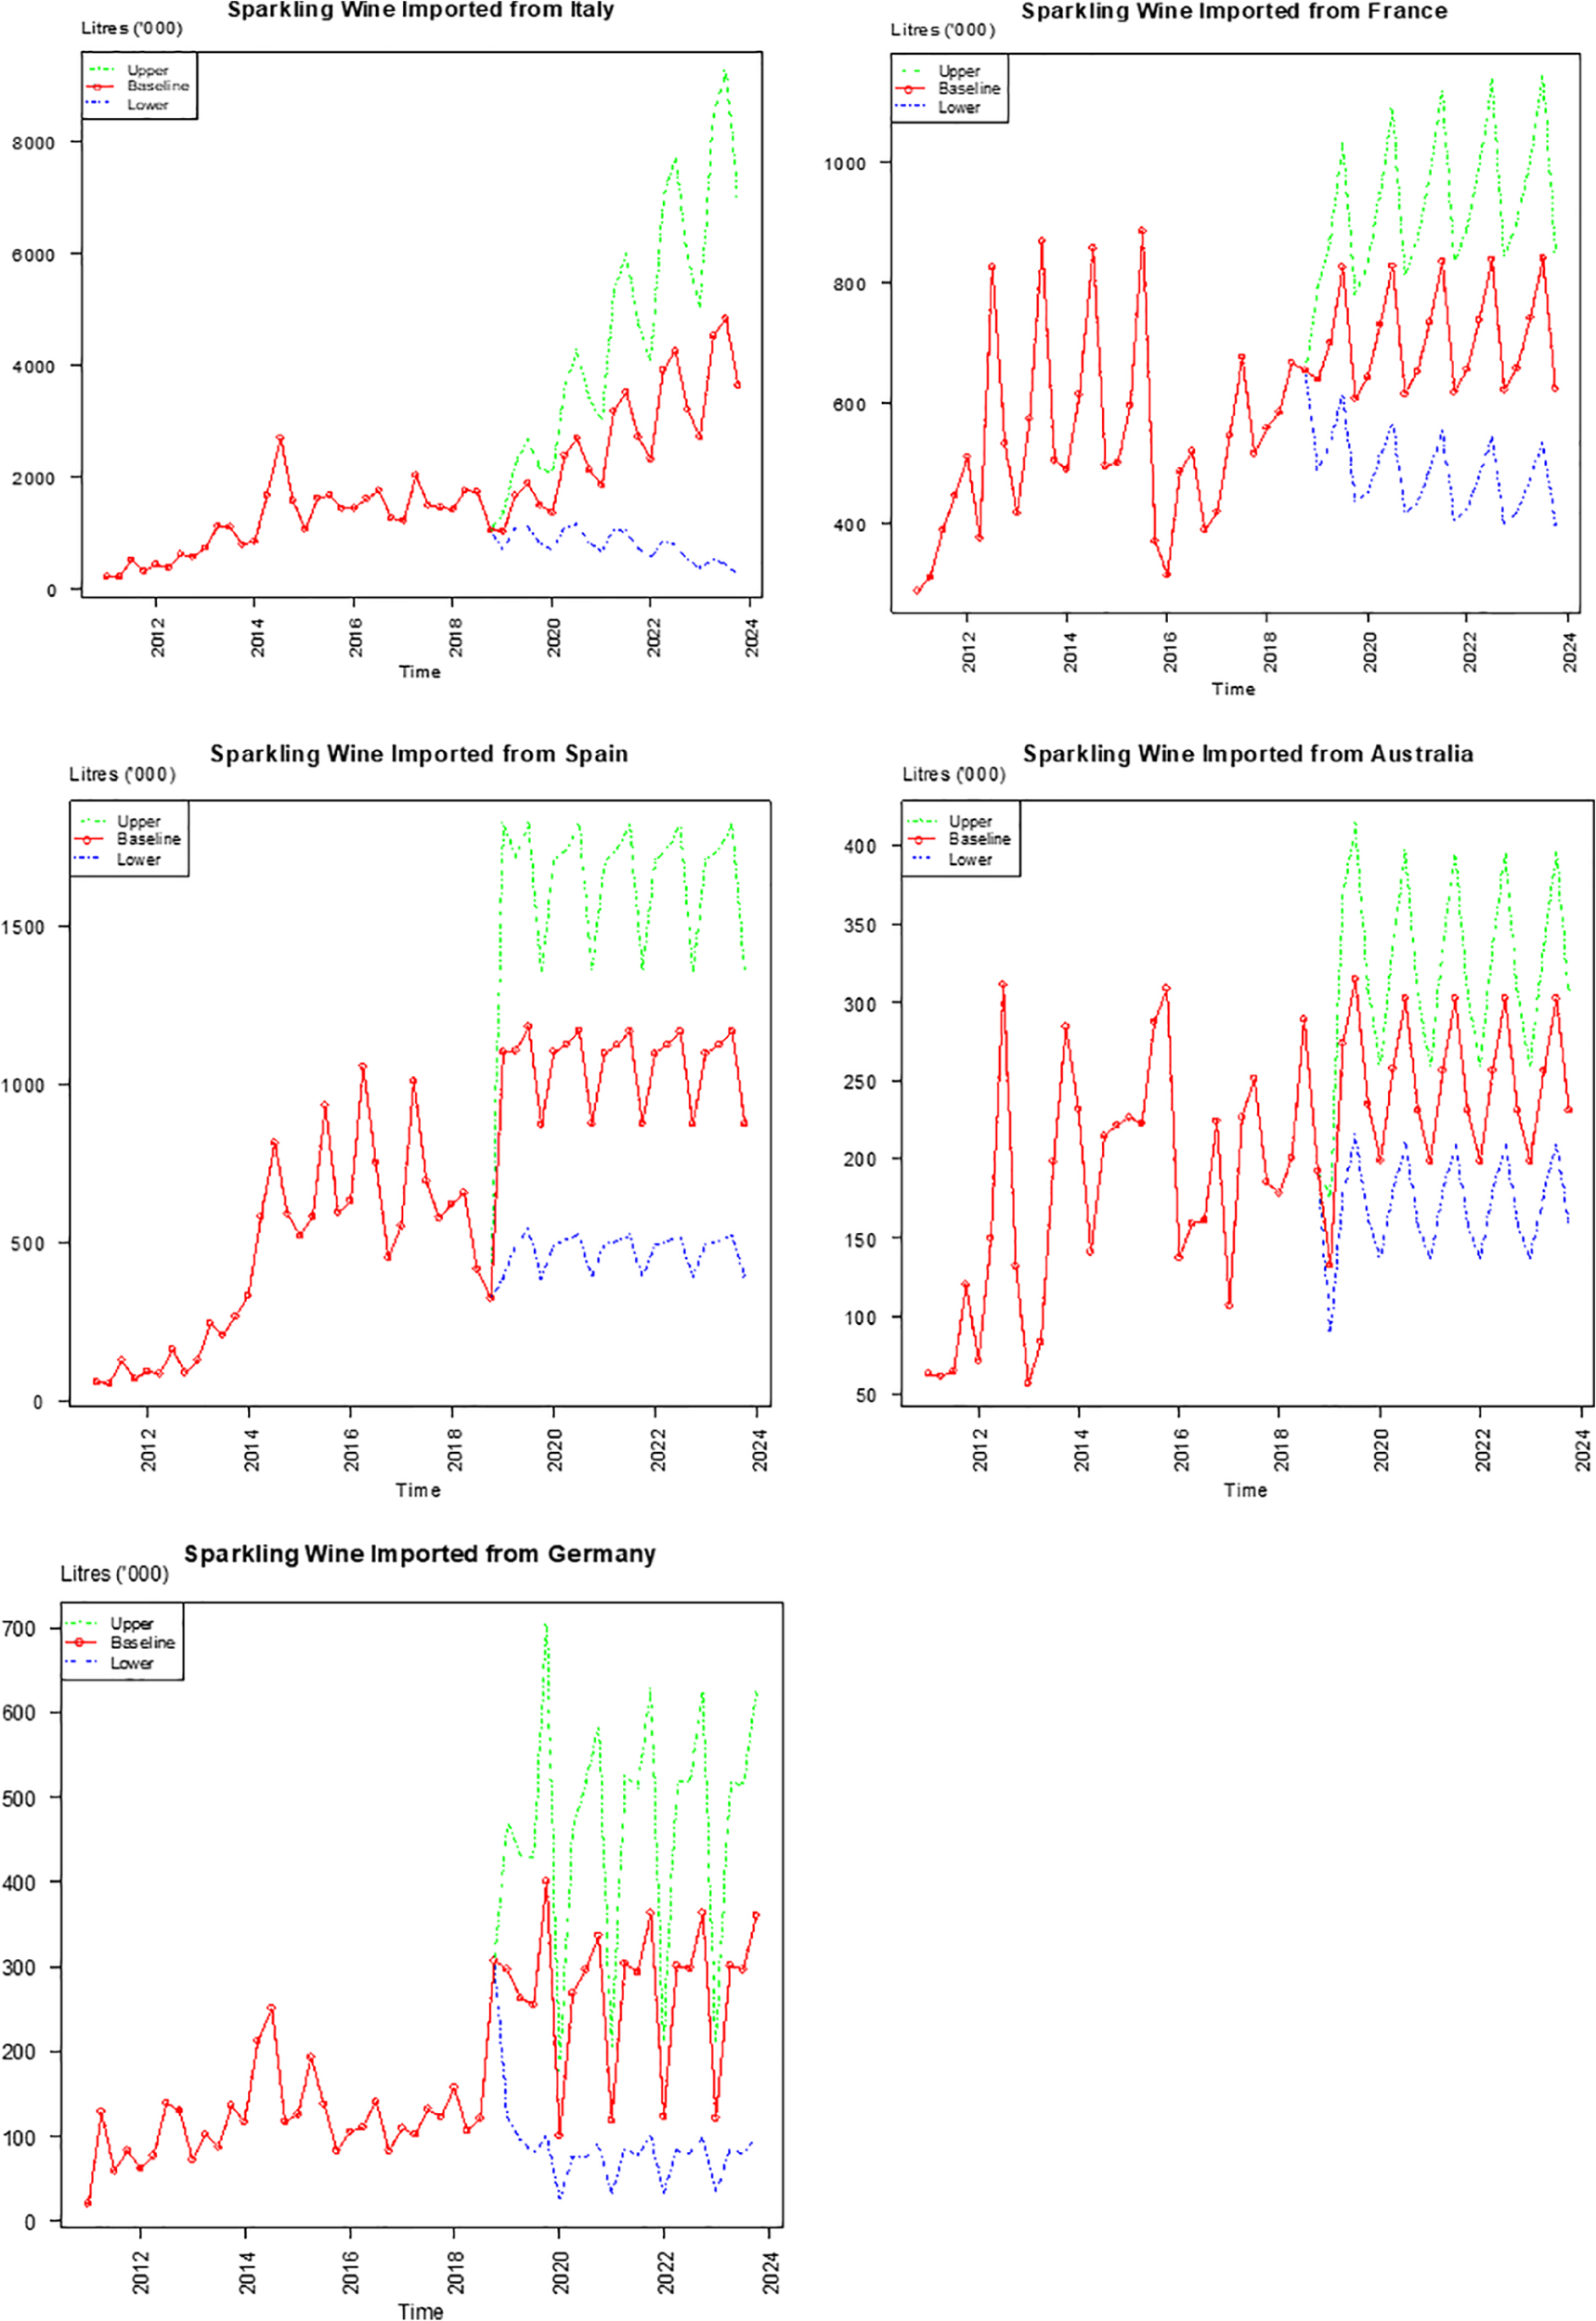
Forecasts of imported sparkling wine to China (in thousands).
Annual Forecasts of Imported Wine to China 2019–2023 (000’ liters).
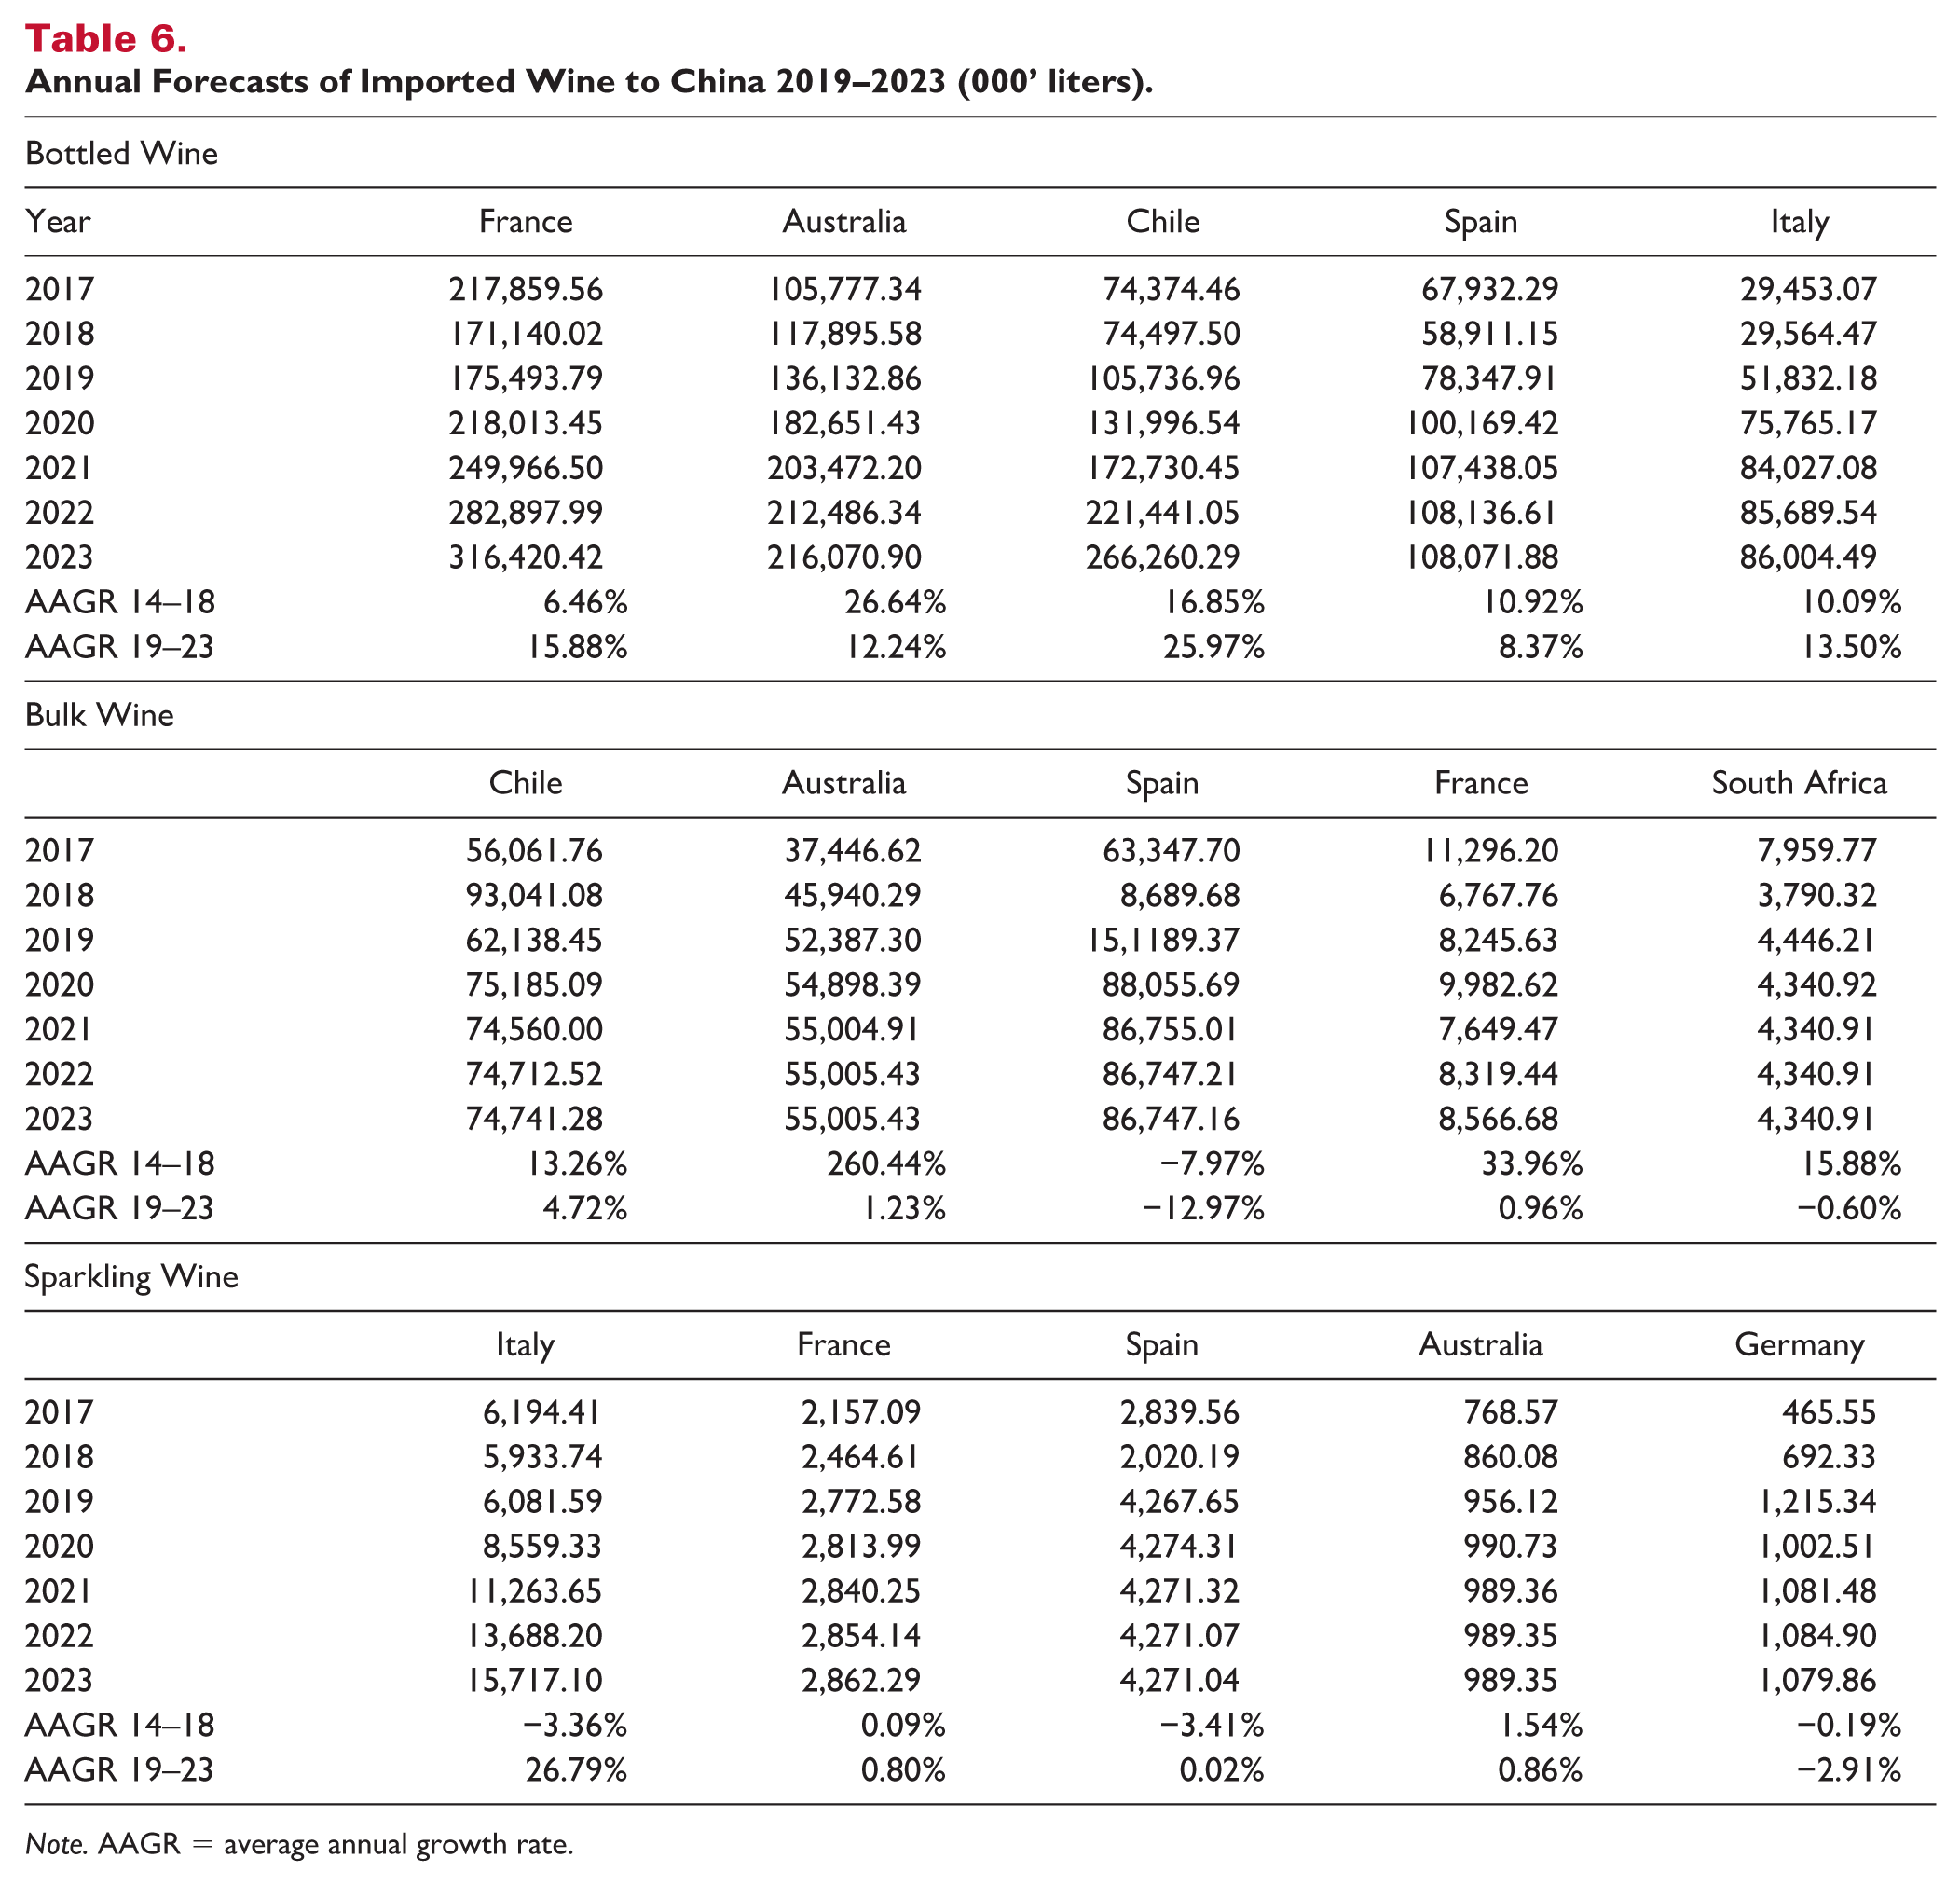
Note. AAGR = average annual growth rate.
In the bottled wine market, it is predicted that all five key source markets of China will enjoy remarkable growth over the forecasting period. Imported bottled wine from France will maintain its dominant market position, reaching 316.42 million liters by the end of 2023, with an average annual growth rate (AAGR) of 15.88%. Stimulated by the abolition of tariffs on bottled and bulk Chilean wine, imported bottled wine from Chile is predicted to enjoy a 25.97% AAGR over the next 5 years, peaking at 266.26 million liters in 2023, and Chile will becoming the second largest COO from 2022 onward. After benefiting from the tariff cancelation policy over the last 5 years, the growth rate of demand for Australian wine is expected to moderate, declining from 26.64% between 2014 and 2018 to 12.24% between 2019 and 2023, although the growth rate is still very impressive. The volume of imported Australian bottled wine will reach 216.07 million liters in 2023, with Australia ranked third of the five COOs. The growth of the demand for the other two Old World regions, Italy and Spain, is forecast to hold steady, with AAGRs of 8.37% and 13.50%, respectively, which means China will import 108.07 and 86.00 million liters of bottled wine from the two COOs, respectively, by 2023.
In the bulk wine market, Spain suffered a dramatic plunge between 2017 and 2018, dropping from 63.35 million liters in 2017 to 8.69 million liters in 2018. Spanish bulk wine imports are predicted to rebound to 151.19 million liters in 2019 but then decline to 86.75 million liters with an AAGR of −12.97%. Even so, Spain will recapture its role as the largest bulk wine COO over the forecast period. Due to substitution by Spanish bulk wine, China will only import 62.14 million liters in 2019 from Chile; this is a decrease of 33.22% compared with 2018. Over the next 5 years, Chilean wine is expected to experience moderate growth with an AAGR of 4.72%, and to maintain its position as the second largest COO, peaking at 74.74 million liters by 2023. Imports from the other three COOs are forecast to level off over the forecast period, with AAGRs of 1.23% for Australia, 0.96% for France, and −0.60% for South Africa. China will import 55.01, 8.57, and 4.34 million liters of bulk wine from these three COOs, respectively, by 2023. Distinct from the bottled wine market, the growth rate of the bulk wine market over the next 5 years will be more moderate. Even the cancelation of the tariffs on Australia and Chile bulk wines will not stimulate demand as much as it will in the bottled wine market. The gap in the growth rates between the bottled and bulk wine markets indicates that Chinese consumers will have stronger preference for wine quality over quantity when they drink. Wine producers should thus focus on improving wine quality if they want to target the Chinese market.
Compared with the bottled and bulk wine markets, demand for imported sparkling wine is limited. Imported sparkling wine only accounted for 1.85% of total Chinese wine imports in 2018 and most such wine came from European countries, including Italy, Spain, France, and Germany. The sparkling wine market is forecast to continue to be dominated by the Old World. Italy is predicted to maintain the largest market share in terms of volume over the forecast period, reaching 15.71 million liters and an AAGR of 26.79%. The increasing popularity of Italian sparkling wine indicates the preference of Chinese consumers for sparkling wines produced by the tank method, which is used to make Italian sparkling wines such as prosecco. Spain will maintain its role as the second largest sparkling wine exporter to China, peaking at 4.27 million liters by 2023. Although it is predicted that demand for French sparkling wine will only be 2.86 million liters by the end of 2023, the significance of the French market should not be overlooked due to the reputation of champagne. Of the top five source markets, German sparkling wine is forecast to suffer a moderate decline over the next five years, but Germany will maintain its role as the fourth largest sparkling exporter to China.
Conclusion and Limitations
The Chinese wine market is in its infancy as it benefits from sustained improvements in incomes and living standards in China. China is playing an increasingly important role in the global imported wine market. Given the impressive growth in China’s demand and its unpredictability, the wine-producing countries are trying their best to embrace the Chinese market. Forecasts of China’s imported wine demand will help the wine industry to plan future developments more efficiently. It is forecast that the top five COOs for bottled wine will enjoy impressive AAGRs over the forecast period, ranging from 8.37% (Spain) to Chile (25.97%). France will maintain the largest market share and is predicted to export 316.42 million liters of bottled wine to China by 2023. Chile is expected to become the second largest COO for Chinese bottled wine imports from 2022 onward, followed by Australia, Spain, and Italy. Spain will recapture its dominant position in the bulk wine market and is predicted to export 86.75 million liters of bulk wine to China by 2023. Chile will maintain its position as the second largest bulk wine COO over the forecasting period. Demand for Chilean bulk wine in China is predicted to increase to 74.74 million liters by 2023. Compared with the rapid growth of the bottled wine market, the growth of the imported bulk wine market is much slower, indicating that Chinese consumers prioritize quality over quantity when they drink. In the sparkling wine market, Italian sparkling wine is expected to enjoy a 26.79% AAGR, reaching 15.72 million liters by 2023 and allowing Italy to maintain its role as the largest exporting country in this market over the next 5 years, followed by Spain and France.
In summary, China’s imported wine demand is expected to grow rapidly over the forecast period. Although the Chinese market is young, the market structure will be stable over the next 5 years. Demand for bottled wine will continue to dominate China’s imported wine market, followed by demand for bulk and sparkling wines. The largest source markets for bottled, bulk, and sparkling of wines are predicted to continue to be France, Spain, and Italy.
The main limitation of this study is the availability of data. China’s domestic wine production has enjoyed impressive growth over the last decade and is now ranked 10th in the world in terms of volume (Karlsson, 2019). Chinese consumers select not only between Old World and New World wine but also consider domestically produced wine. It would be ideal to include domestic wine, beer, and Chinese Baijiu prices separately to estimate the corresponding cross-price elasticities and to compare them with those of imported wine. Unfortunately, China only publishes domestic alcoholic beverage production by volume rather than by value, so the prices of domestic wine, spirits, and beer cannot be calculated. In future studies, effort could be made to collect these data to estimate the models more accurately.
As the number of online retailers in China is forecast to increase significantly in the future, it should be possible to obtain more detailed data on the preferences of Chinese wine consumers. This would allow us to investigate the interactions of China and other COOs in wine imports and exports using a system of equations approach.
Footnotes
Declaration of Conflicting Interests
The author(s) declared no potential conflicts of interest with respect to the research, authorship, or publication of this article.
Funding
The author(s) received no financial support for the research, authorship, or publication of this article.