
Abstract
Policymakers increasingly develop initiatives to influence business and consumer behavior. Among the initiatives to increase the compliance of food establishments to hygiene standards is the public disclosure of hygiene inspection scores. In this study, we analyze the impact of the 2017 law change in King County (Washington state, USA) mandating the presentation of hygiene inspection scores at the front door using an emoji-based display with information about the food establishment’s relative performance to other food establishments in the zip code area. Based on information from 82,545 food inspections in 8,010 food establishments in the period August 2014 to May 2019, we find that the rolling implementation of these displays had a small but meaningful impact on food inspection scores and hygiene violations. As a result of the new display, hygiene scores improved and the odds of failing inspection declined.
Introduction
A recent study shows that the aggregate economic costs for all foodborne illnesses in the United States range between US$61 billion and US$90 billion per year (Scharff, 2018). For food establishments, the cost of a single foodborne illness can be substantial. Lost revenues may easily outpace the costs of prevention and control measures (Bartsch et al., 2018; Jin & Leslie, 2003). Although serving less hygienic food could financially harm the owners of food establishments, a variety of factors such as personnel characteristics (Mortlock et al., 2000) and the complex system of food preparation and delivery (Mossel et al., 1999) may make it challenging to maintain restaurant hygiene. Therefore, governments routinely inspect food establishments for compliance with hygiene standards.
The general public may access hygiene inspection reports through requests from municipal or state health departments, but beginning the late 1990s, major cities in developed countries have started to mandate the prominent display of hygiene inspection scores or grades at a food establishment’s front door to put pressure on food establishment owners to maintain hygiene standards. Such initiatives do not always result in lower hospitalization due to foodborne diseases (Ho et al., 2019), but for example, the food inspection and restaurant grading system devised for the 2014 FIFA World Cup in Brazil resulted in improvements in food safety (da Cunha et al., 2016). Disclosure modes include letter grades, numerical scores, color cards, and statement cards (Filion & Powell, 2009). However, to further improve the accessibility of restaurant inspection scores, some governments have started to further simplify the display of inspection scores using emojis.
An emoji is defined as “an iconic, visual representation of an idea, entity, feeling, status or event, that is used alongside or instead of words in digital messaging and social media,” (Evans, 2017, p. 1). Decreasing attention spans and lower preferences to process information are among the main reasons for simplifying the display of inspection scores using emojis. In Denmark, Kjeldgaard et al. (2010) found a mixed relationship between inspection scores and microbial presence in a setting where four different smileys symbolized the varying degrees of compliance. Although the microbial contents of cream cakes were closely related to the food inspectors’ ranking, the microbial contents of pasta salads frequently exceeded standards in outlets with highly satisfactory rankings. In Finland, a system including both numerical information and four smiley faces was found to affect the purchase intentions of restaurant customers (Gurney & Loewenstein, 2020). Beyond Denmark and Finland, there is limited evidence on whether emojis are a useful disclosure mode. The reason for the mixed findings so far may be that emoji-based displays are coarse-grained and subject to strong evaluation bias. A full inspection report covers multiple categories (e.g., Seattle’s inspection card has 50 items), 1 and aggregating the scores across categories (e.g., washing hands and proper labeling of food containers) into one emoji may lead to evaluation bias. Emojis could further complicate this challenge as an emoji could be processed idiosyncratically by a customer. Hence, coarser display schemes that are difficult to compare, and at times difficult to understand, may not yield the necessary pressure on food establishments to improve hygiene (Ho et al., 2019).
In this study, we investigate whether the new 2017 food establishment display using emojis in King County (Washington state) improved food establishment hygiene (as measured by inspection scores). The emoji-based displays were based on a public vote on among six alternate front door display designs. Given the socially consensual emoji preferences and materially informed inspection scores, these emoji-based displays are less subject to evaluation bias. Related to the aggregation bias across a variety of inspection categories, the new display provides information about the food establishment’s inspection score relative to other food establishments. These curved scores are based on the average of hygiene scores from the past four inspections in a zip code area (Kosack & Fung, 2014). Due to the strong agglomeration patterns within cities and the sustained socioeconomic differences across city areas, adjusting for scores based on nearby restaurants further lowers the aggregation bias.
The new grading system was rolled out gradually over 10 months in King County, with four implementation dates at about 3-month intervals. 2 Food establishment inspectors are trained using the same protocol, and the inspection schedule follows uniform protocols by the food establishment risk category. The rolling implementation creates a unique opportunity to assess whether more salient hygiene displays affect food establishment hygiene. Using a Regression Kink Design (RKD) covering 82,545 food inspections in 8,010 food establishments in the period August 2014 to May 2019, we do find a small but meaningful effect of the new display on hygiene inspection scores. Although the improvement in the total inspection scores is relatively modest, the odds of not failing inspection increase substantially.
Our study builds on and complements ongoing research on the impact of food inspections. Previous studies have focused on a variety of outcomes, including the microbial footprint on food surfaces, hospitalization due to foodborne diseases, and reputational concerns. Nevertheless, past studies on the effect of inspection score displays on hygiene in food establishments have found mixed effects (Ho et al., 2019; Yu & Costanigro, 2019). Historically, the arc of food inspection disclosure laws has moved from scores to grades to cards and more recently to emojis. Our findings indicate that the emoji-based display in King County does put the necessary pressure on food establishments to improve compliance to hygiene standards because of the improved communication of relevant information to customers through the new display (Fung et al., 2007; Mitchell, 2011).
Theoretical Background
The Disclosure of Hygiene Inspection Scores
Food adulteration has been a cause of concern since the early treatise on food contamination for economic reasons by Theophrastus (372–287 BCE; Fortin, 2016). Over the centuries, food control in developed countries has evolved somewhat uniformly with the first food protection law in the United States passing in 1883 to prevent the import of adulterated goods. Thereafter, a series of laws were implemented to improve food safety. Although restaurants have been subject to inspections, in December 1997, the Los Angeles County passed an ordinance requiring restaurants to publicly display grade cards from hygiene inspections (Jin & Leslie, 2003). Los Angeles was among the first cities to pass the restaurant-grade display law, and the early study by Jin and Leslie (2003) formed the basis for the passage of such laws in 30 jurisdictions across the world.
Disclosure of inspection scores is a tool used by public authorities to steer consumers in their restaurant choices. Public disclosure of restaurant inspection scores increases transparency, simplicity, and availability of food inspection results. Studies have shown that disclosures of inspection scores shift demand towards more hygienic food establishments (Choi et al., 2011; Henson et al., 2006; Knight et al., 2007). As a result, disclosures positively affect compliance with hygiene standards (Kaskela et al., 2019) and overall hygiene (Wong et al., 2015). However, customers vary in the degree by which they use the inspection scores in their decision-making process. For example, in Singapore, a majority of food establishment customers use the letter grade, while in the United Kingdom, a majority of respondents reported to not have used the scores in their purchase decisions (Food Standards Agency, 2017).
The “scores on doors” policy is a widely used initiative in many cities around the world, allowing consumers to make better informed decisions and to lower health hazards (Dundes & Rajapaksa, 2001). Inspection results are displayed in different formats across and within countries. Studies show that a verbal description of the score is particularly persuasive (Kim et al., 2017). However, letter grades or numeric scores are easier to process (Dundes & Rajapaksa, 2001). Numeric scores are used in the United Kingdom (Food Standards Agency, 2017) and Australia (Vainio et al., 2020). In the United States, there is no central authority on the mode of disclosure as the inspections are under the jurisdiction of local health departments. The modes comprise letter grades, scores, and, more recently, emojis. Fleetwood (2019) describes that some U.S. states require statewide disclosure (North Carolina), whereas others have a central office for food establishment inspectors (Florida). Display formats are also not standardized across cities. For example, food establishments in Los Angeles (California) and Louisville (Kentucky) are required to display a letter grade, while Sacramento County (California) uses traffic light coded displays. Relatedly, recently, the internet platform Yelp created a standard reporting format for food establishment inspections and several cities have adopted this reporting standard to improve the disclosure of inspection scores across cities. Emojis, the disclosure mode in King County that we analyze in the present study, are also used in Denmark, Finland, Norway, France, and China (Vainio et al., 2020). Despite the significant variation in practices of inspection and modes of disclosure, the intention of public health officials is rooted in the provision of accurate, timely, and accessible information to influence customer choice and decision-making and consequently the hygiene maintenance standards in food establishments.
Although there is no general agreement on a customer-friendly display design, the studies on the efficacy of these designs have focused on the posting of grades or scores. The effects of these displays on public health outcomes are assessed by analyzing inspection scores as well as public health indicators. Related to improvements in hygiene inspection scores, Fleetwood (2019) describes that the likelihood of receiving an “A” grade increased by 35% after New York City implemented the mandatory posting of food establishment grades. Over time, 93% of the food establishments received an “A” grade in New York City. The line of sight between hygiene scores and public hygiene outcomes is long, and therefore, providing causal evidence is difficult. Nevertheless, in Los Angeles, the mandatory posting starting in 1998 was followed by a 13% decrease in foodborne hospitalizations in the first year. However, Ho et al. (2019) recently challenged the causal nature of this finding. In New York City, Salmonella cases declined by 5.3% after the implementation of mandatory postings in 2010 (Firestone & Hedberg, 2018). Relatedly, researchers in the United Kingdom, by taking microbial samples in food establishments before and after the introduction of the mandatory posting requirement, found that greater compliance with food hygiene laws lowered foodborne illness (Fleetwood et al., 2019).
Still, Fleetwood (2019) recently indicated that the effect of hygiene displays remains mixed, at best. Moreover, several studies dispute the benefits of rating systems or advocate using resources allocated for food establishment inspections to be diverted toward other health initiatives (Ho, 2012). Some public health officials have also long harbored skepticism toward public disclosures because of the limited reliability of grading systems (Sevier & Hatfield, 2000) as well as significant resource outlays among budget-constrained cities. Therefore, it is important to study the impact of recent improvements in these presentations—such as emoji-based displays with locality-adjusted hygiene scores. In the Finnish context, Gurney and Loewenstein (2020) found that the use of emojis to rate food establishments does influence the behaviors of customers. Here, we look at the effect on hygiene compliance by a food establishment.
Using Emojis to Disclose Hygiene Inspection Scores
Hygiene scores may be important information for customers when choosing a food establishment. By requiring the prominent display of hygiene inspection scores, policymakers aim to foster the use of the hygiene inspection score as an issue-relevant cue. According to the elaboration likelihood model of persuasion, there are two mechanisms undergirding persuasion efforts—the central and the peripheral route (Petty & Cacioppo, 1986). Through the central route, the elaboration of a message may trigger critical thinking. As such, it requires significant cognitive effort to understand the message. Through the peripheral route, individuals react to positive or negative cues through lower cognitive effort. Perceptions, and at times, behaviors, driven by the central route are stable and last longer. Conversely, perceptions through the peripheral route are relatively less stable and less effective. To not overload the central route, the use of peripheral cues requiring relatively low cognitive effort is important in low-stakes situations such as food establishment purchases.
Based on the elaboration likelihood model, for customers, hygiene inspection scores may not serve as “as a simple acceptance or rejection cue, but may be considered along with all other available information in the subject’s attempt to evaluate the true merits of the arguments and position advocated” (Petty & Cacioppo, 1986, p. 671). In doing so, customers may take a central or peripheral route to process hygiene inspection scores along with additional pieces of information in making their purchase decision. Although the cognitive mechanism associated with emojis is less explored, the literature in advertising shows that emojis increase affect (Das et al., 2019). Hence, emojis may play a reinforcing (sad emoji) or mitigating (smiley face) role in psychologically and cognitively moving the perceptions to the extreme. That is, establishments with smiley emojis are more positively evaluated, over and beyond the display of actual inspection scores. Conversely, establishments with sad faces would be interpreted more negatively due to the elicitation of the negative affect.
In light of the elaboration likelihood model, there are four particular reasons why we expect to find an effect of the new display in King County on customer behavior, and on the maintenance of hygiene standards in food establishments as a consequence. First, King County published the full food establishment inspection results online since 2001. However, mandating the display of hygiene scores at the food establishment’s front door makes the information significantly more readily available to process for customers. Second, the new display tries to minimize the mismatch between customer perception and processing of information and the intention of the policymakers by adopting an emoji display that is chosen based on a public vote. Third, Kosack and Fung (2014) state that when the goal is to affect individual choices, an exemplary transparency intervention is the provision of performance rankings. In King County, these rankings (hygiene scores relative to the hygiene scores of food establishments nearby) are provided in the new display motivated by the logic that food establishment hygiene may be socially constructed based on local conditions and that the elasticity of patronage and hygiene scores may vary by neighborhood due to sorting between customers and food establishments. Fourth, the new display fits with the increasing diversity in the United States, decreasing attention span, and increasing reliance on emojis and nonlinguistic cues (Danesi, 2016). Having emojis as a mode for transmitting information makes the information from the display sheet readily interpretable for a broad range of customers.
Data and Sample
In 2001, King County was the first municipality in Washington state to post food establishment inspection scores online. In 2013, King county held meetings with experts and community members to further improve information dissemination of food establishment inspection scores. King County residents were asked to provide positive and negative feedback on how information on food establishment inspection scores should and should not be shared. Based on this feedback, a new rating system was developed in 2015, with additional community inputs sought on the design of window displays for the food establishment inspection score.
The food establishment score sheet is presented in Figure 1. After the implementation of the new display, each food establishment was required to display the sign with four emojis, ranging from “needs to improve” (a category not rated on a curve), followed by “okay,” “good,” and “excellent” (the latter three categories rated on a curve) based on the number of red violations. The new display was implemented in four phases (in January, April, July, and October of 2017) to assigned neighborhoods based on zip codes (see also Figure A2 in Appendix). The rating of a food establishment is based on the average number of red violations from the past four inspections and curved based on food establishments in a zip code or an area (Figure A3). Red violations relate to more severe violations in food-handling practices that most likely lead to foodborne illnesses. Additional details on the rating system are available on the website of King County’s Health Department. 3
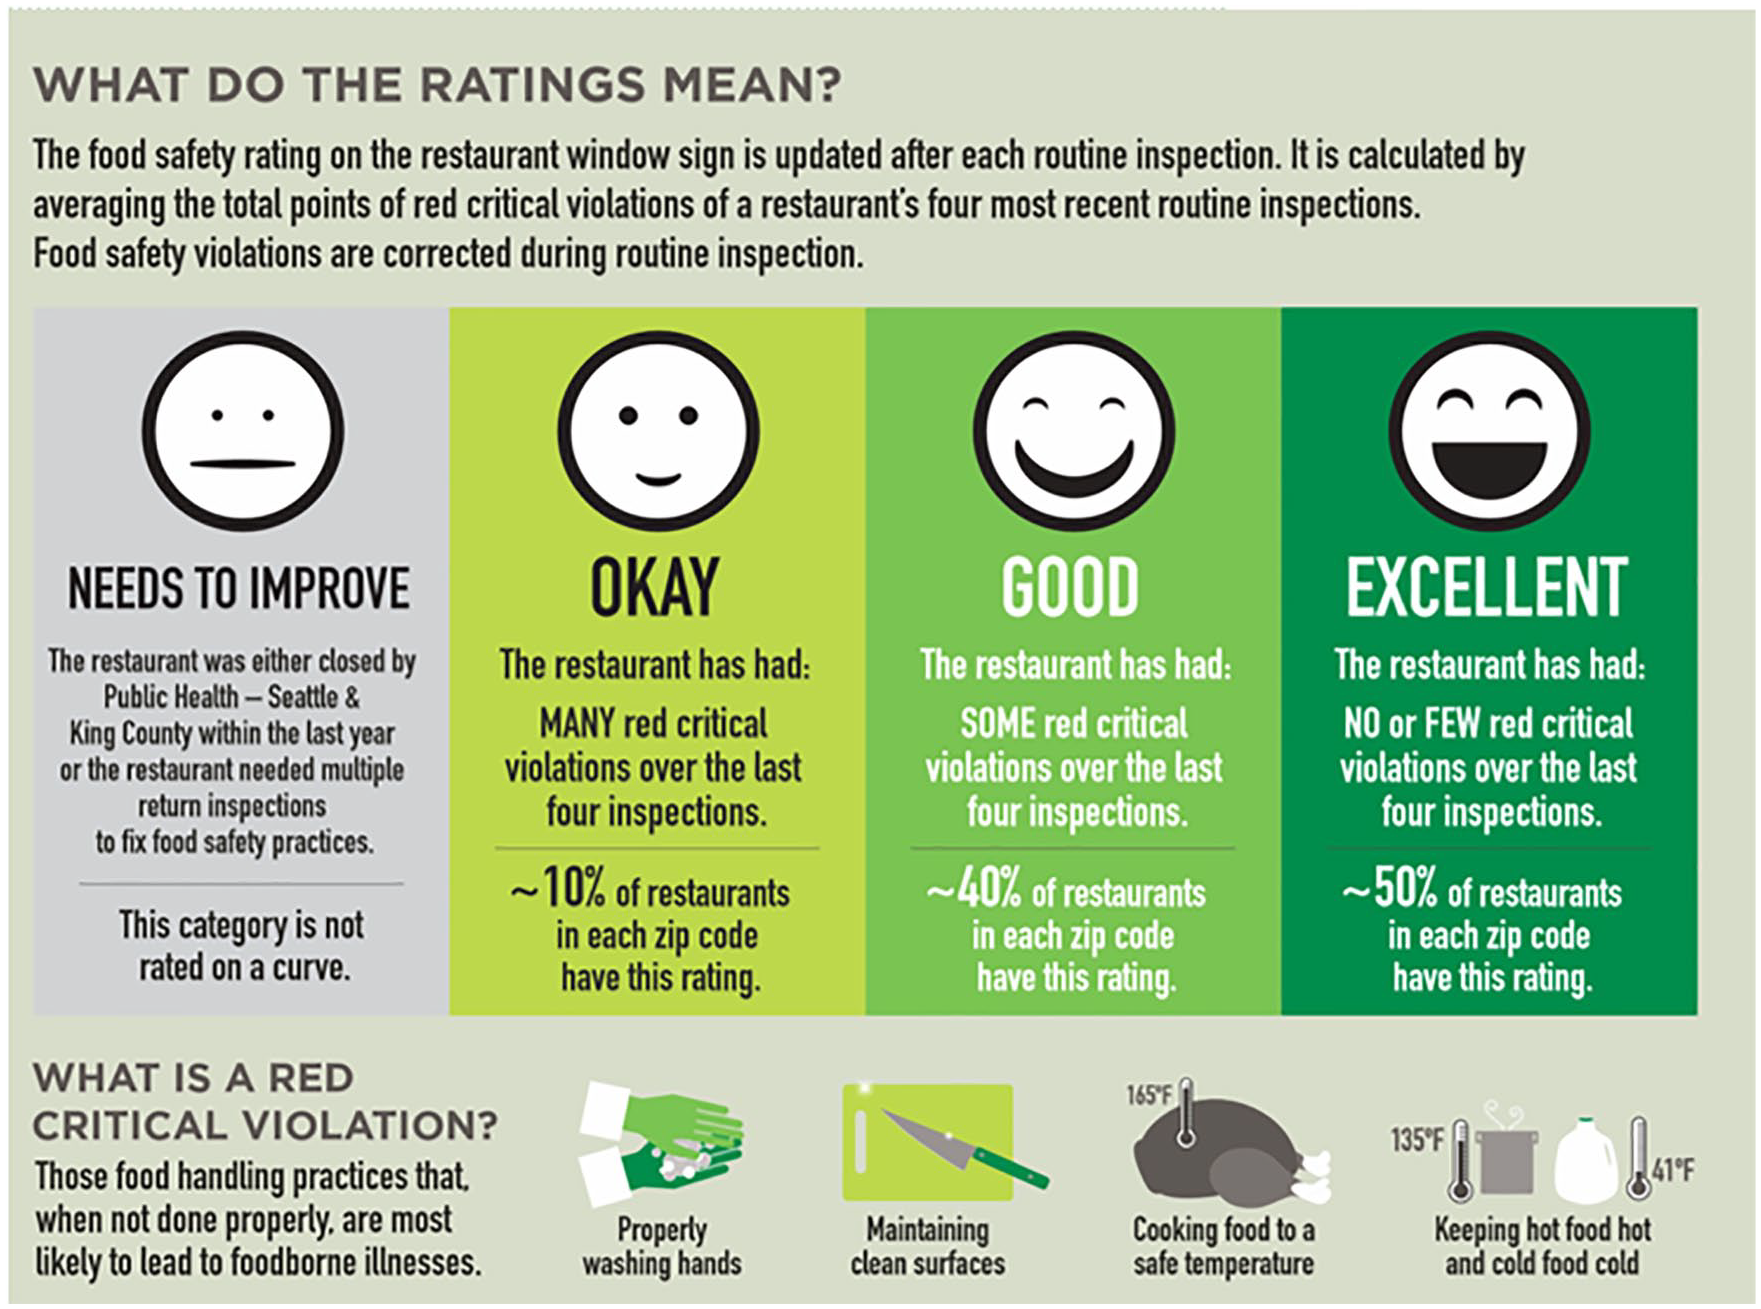
The Food Establishment Hygiene Display in King County.
All hygiene inspection scores for food establishments in King County are publicly available on the King County’s open data website. 4 The inspection scores are available for all food establishments from 2006 onwards and are updated periodically. The inspections are conducted by the Department of Public Health. Food establishments are classified by seating capacity (0–12, 13–50, 51–150, 151–250, and above 250 seats) and risk category (I, II, and III). Low-risk category (Risk Category I) food establishments serve prepackaged ready-to-eat foods and are inspected once a year. The moderate risk category (Risk Category II) food establishments, inspected twice a year, receive, store, prepare, cold handle, and serve perishable food. The highest risk category food establishments (Risk Category III) establishments use laborious food preparation methods including thaw, cut, cook, cold holding, reheat, and hot holding and serve food potentially requiring stringent temperature controls. Health violations are classified as blue (less severe) or red (more severe). Each violation has an associated score, and the inspection score represents the total score of red and blue violations. Red violations include expired certifications, contamination by hands, cross-contamination, improper cooking temperature, and improper hand washing, among others. Blue violations include improper use of utensils, poor maintenance of facilities, and not using labels and dates, among others. The maximum possible violation score is 370 and 88 for red and blue violations, respectively. 5 Therefore, the total inspection score ranges between 0 and 458.
The new display was implemented in 2017, and to improve the robustness of the analysis, only food establishments with more than one inspection before January 2017 and more than one inspection in or after January 2017 are included in the analysis. At the time of analysis, inspection results were available until May 2019. In the present study, we analyze data from the time window August 2014 to May 2019. This window was chosen using the bandwidth selection routine developed by Calonico et al. (2014a, 2014b). The bandwidth selection procedure is a data-driven procedure that allows and tests for different bandwidths (time windows) before and after specific cutoffs in the data using mean squared error optimal choices. For a more comprehensive discussion, we refer to the work of Cattaneo and Vazquez-Bare (2016). However, we note that using a longer window before 2014 did not result in a meaningful difference in estimates (results are available upon request from the authors).
Method
Our main dependent variable is the hygiene inspection score. To explain the dependent variable, we use an RKD framework. We test for each “kink” associated with one of the four implementation phases. Specifically, we use a linear specification for each of the implementation cutoffs. The implementation occurred at short intervals (3 months) in different areas, possibly resulting in anticipated delayed effects (e.g., food establishment owners may delay improvements until after the rollout is complete). Therefore, we analyze all four windows. In the regression, we control for a food establishment’s size, risk category, and geographical position (latitude, longitude, and their interaction). Moreover, we control for the time of the inspection using dummies for the quarter of the year, day of the month, and day of the week.
As an additional analysis, we use fixed-effects regression to explain the hygiene inspection scores. Fixed-effects regressions exploit variation over time within food establishments and come with the advantage that binary outcome variables can also be analyzed. Therefore, using fixed-effects regression, we also analyze a secondary dependent variable reflecting whether a food establishment failed the inspection (1 = unsatisfactory, 0 = satisfactory). A food establishment does not pass inspection if there is a red hygiene violation. In these fixed-effects regressions, we control for the time of the inspection using dummies for the quarter of the year, day of the month, and day of the week. All analyses were performed in the statistical software package Stata (version 16.1).
Results
Our analysis sample covers 82,454 food inspections from 8,011 distinct food establishments. Descriptive statistics are presented in Table 1. The descriptive statistics for the subsamples show that most inspections took place in food establishments in Risk Category III, and in food establishments with 13 to 150 seatings.
Descriptive Statistics Analysis Sample, Stratified by the Food Establishment’s Risk Category and Number of Seating.
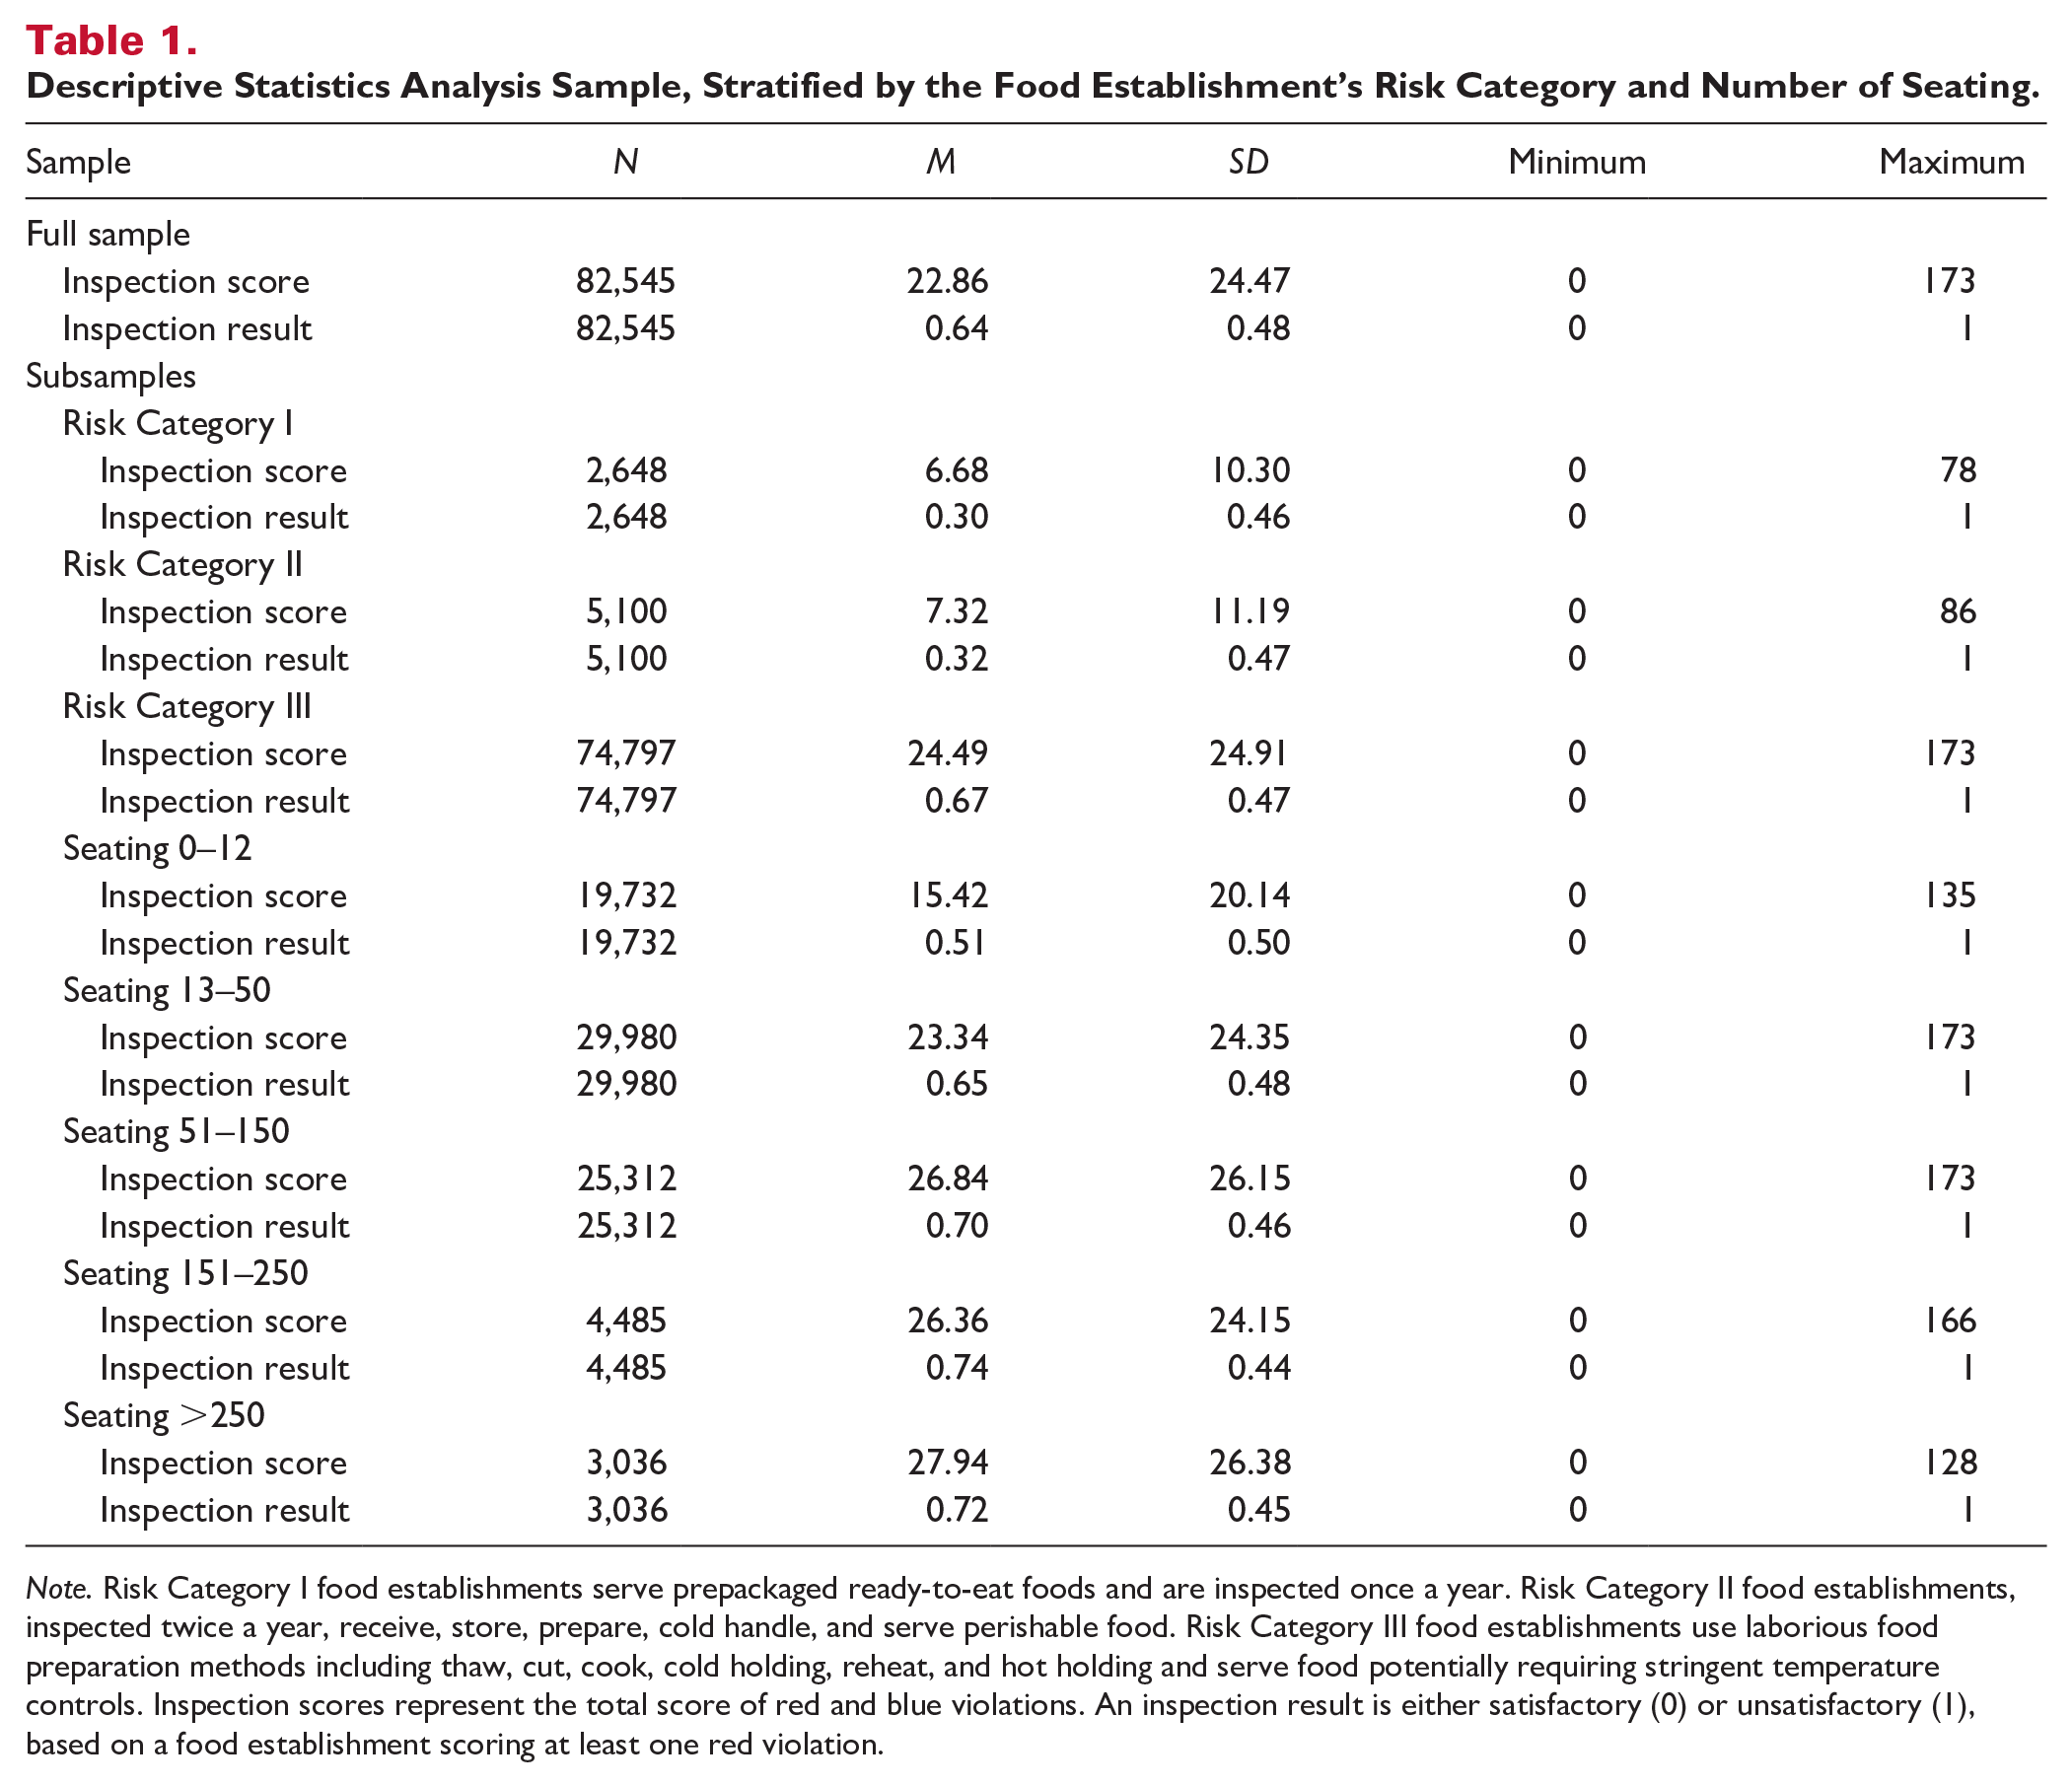
Note. Risk Category I food establishments serve prepackaged ready-to-eat foods and are inspected once a year. Risk Category II food establishments, inspected twice a year, receive, store, prepare, cold handle, and serve perishable food. Risk Category III food establishments use laborious food preparation methods including thaw, cut, cook, cold holding, reheat, and hot holding and serve food potentially requiring stringent temperature controls. Inspection scores represent the total score of red and blue violations. An inspection result is either satisfactory (0) or unsatisfactory (1), based on a food establishment scoring at least one red violation.
Table 2 shows that the hygiene inspection scores improve because of the implementation of the new display. In the full sample, all treatment effects are estimated to be negative (a lower hygiene score reflects fewer violations) and significant. The effect of the new display diminishes from 5.47 (January 2017) to 2.20 (October 2017) because the number of treated food establishment increases over the year. Subsample analyses presented in Table 2 show that these results reflect mostly the food establishments in Risk Category III and the food establishments with 13 to 150 seats. We note that most observations are in these categories in our sample.
Results of the Regression Kink Design (RKD) Analysis.
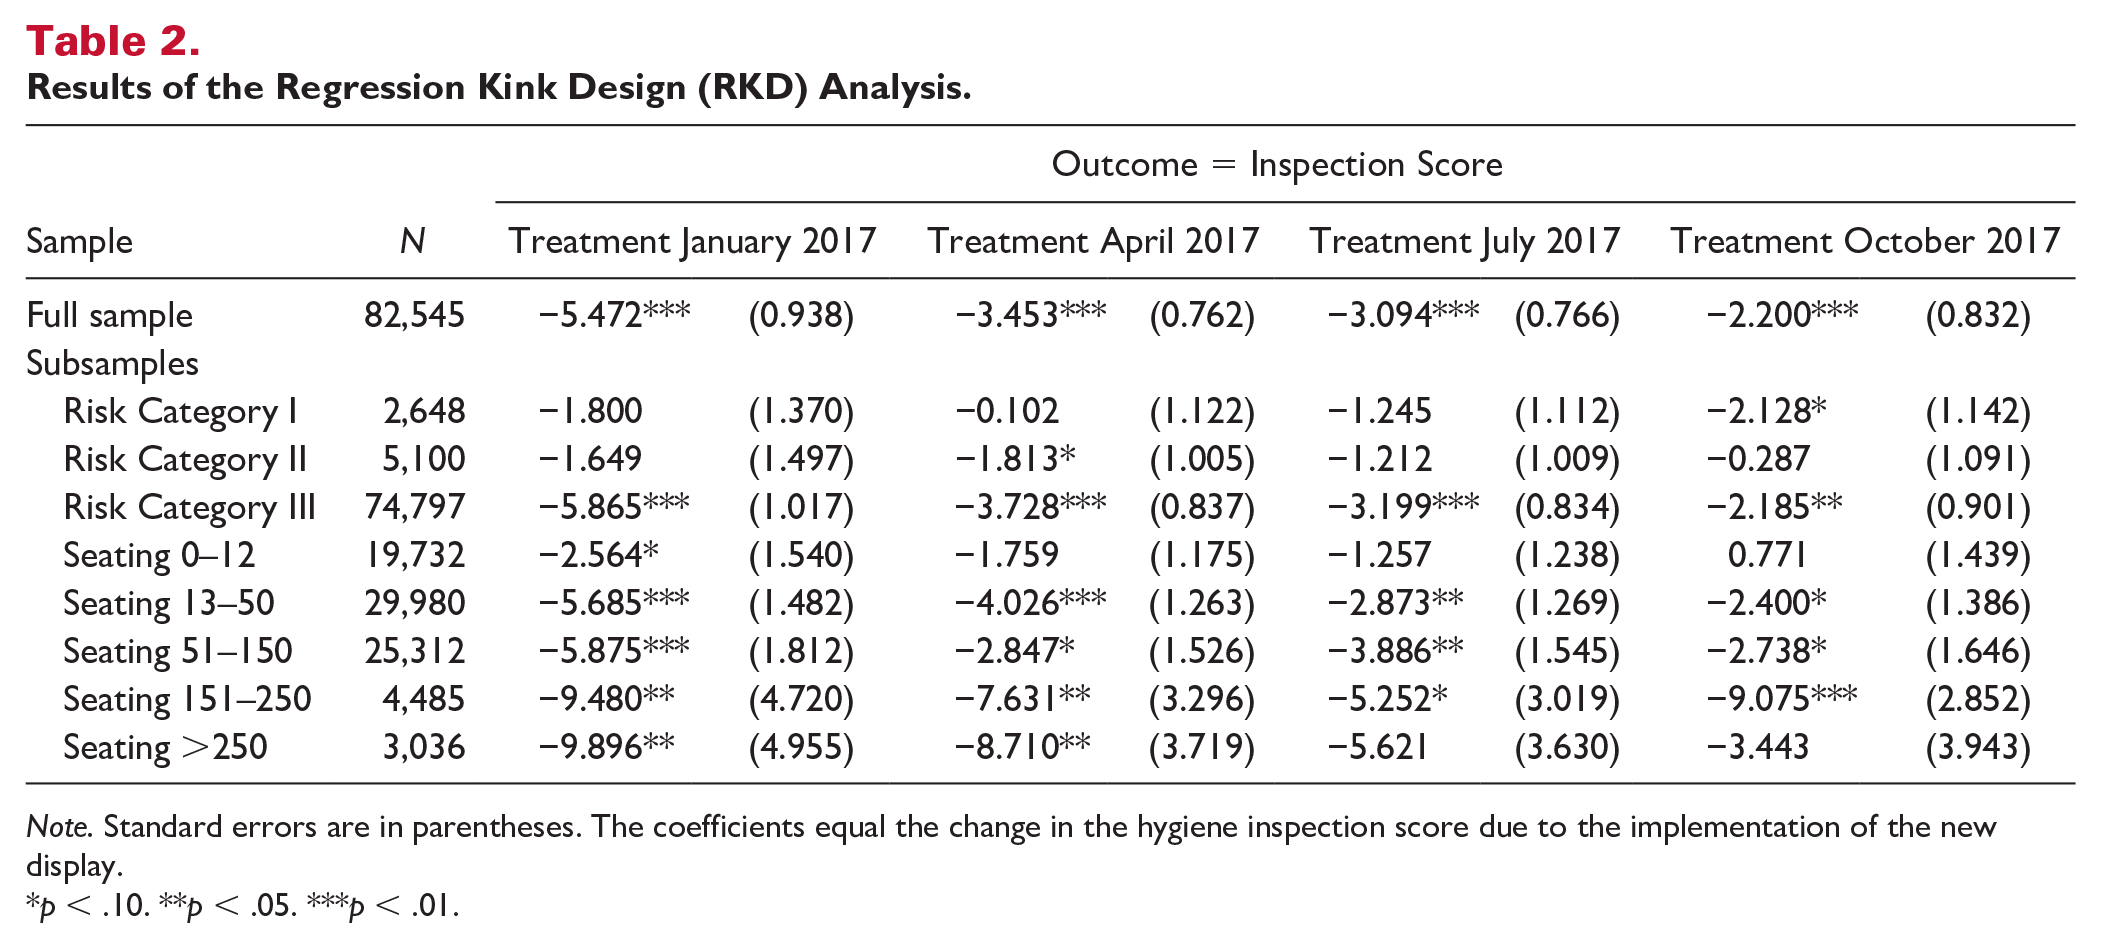
Note. Standard errors are in parentheses. The coefficients equal the change in the hygiene inspection score due to the implementation of the new display.
p < .10. **p < .05. ***p < .01.
In Table 3, we present the results of the fixed-effects regression. The effects sizes are in line with the results of the RKD analysis in Table 2. Across all the four rollout windows, the improvement in hygiene scores is estimated to be between 5.65 and 5.83 points (Models 3, 6, 9, and 12 including all control variables). When rerunning the full models with the logarithm of the inspection score as a dependent variable, we find that the absolute decrease equals a reduction of 23.59% to 23.97%. In Table 4, we use the same specification and test for a model explaining the binary outcome of failing the inspection. In the models including all control variables, the results show that the implementation led to 0.54 to 0.65 times lower odds for an unsatisfactory inspection outcome.
Fixed-Effects Regression Results of Models Explaining a Food Establishment’s Hygiene Inspection Score.
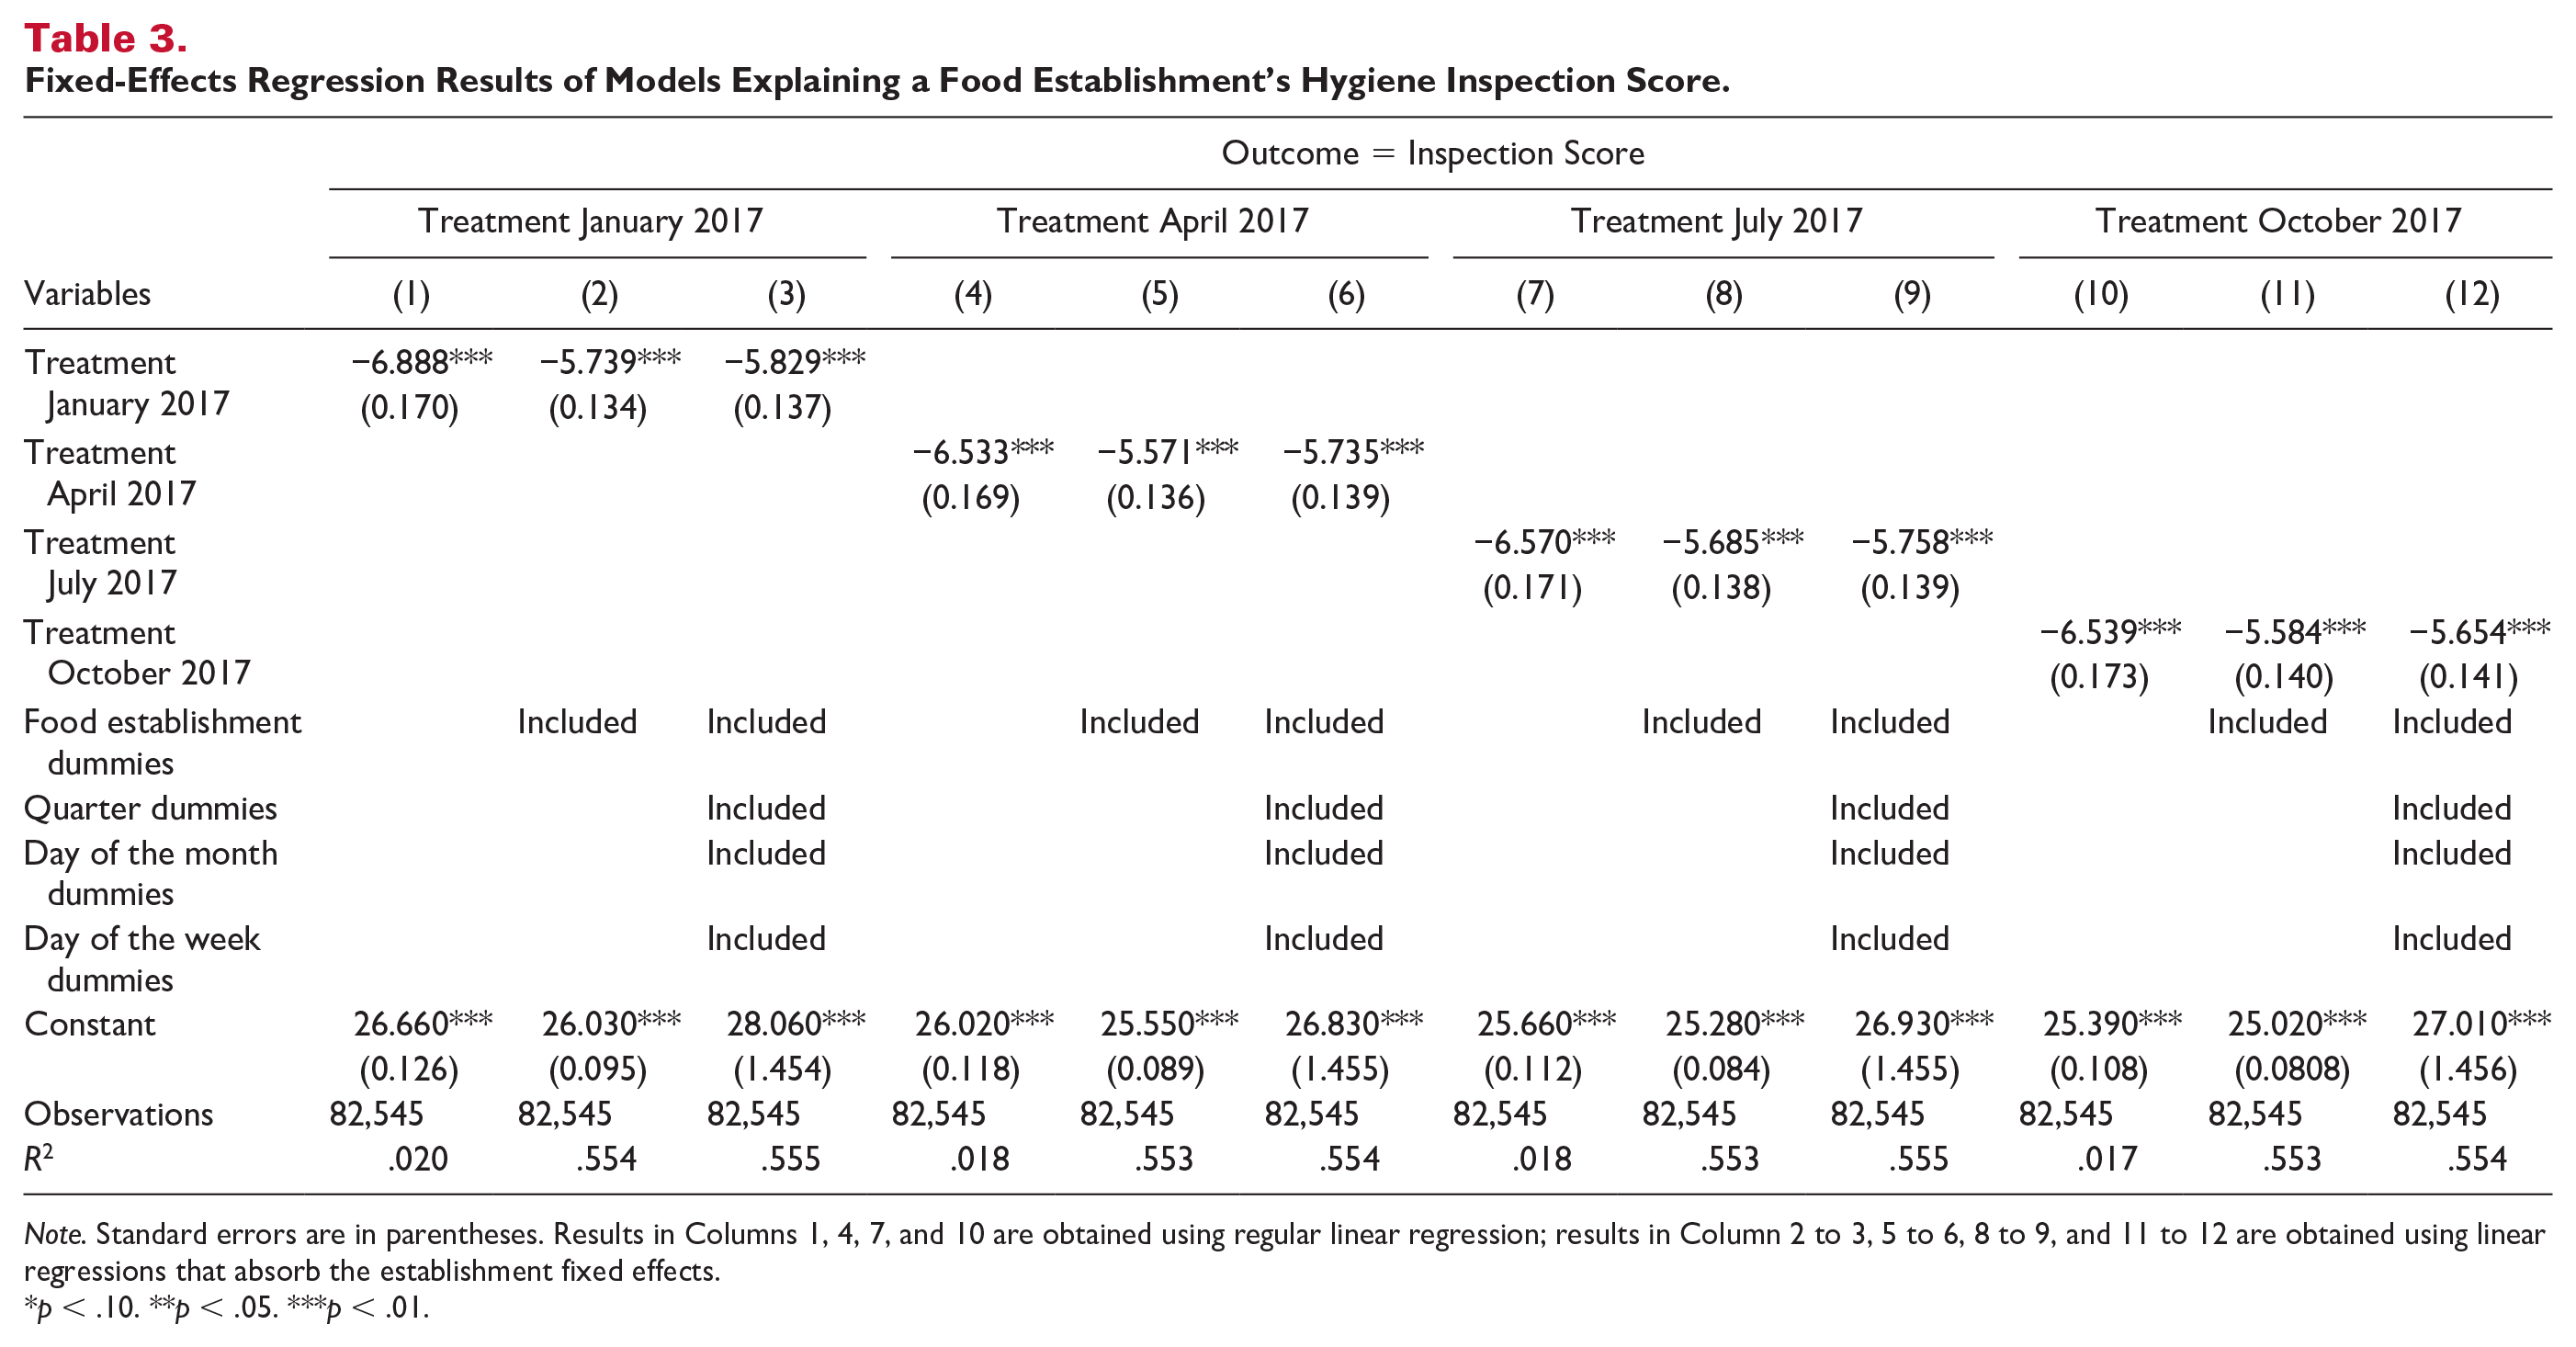
Note. Standard errors are in parentheses. Results in Columns 1, 4, 7, and 10 are obtained using regular linear regression; results in Column 2 to 3, 5 to 6, 8 to 9, and 11 to 12 are obtained using linear regressions that absorb the establishment fixed effects.
p < .10. **p < .05. ***p < .01.
Fixed-Effects Regression Results of Models Explaining a Food Establishment’s Inspection Result.
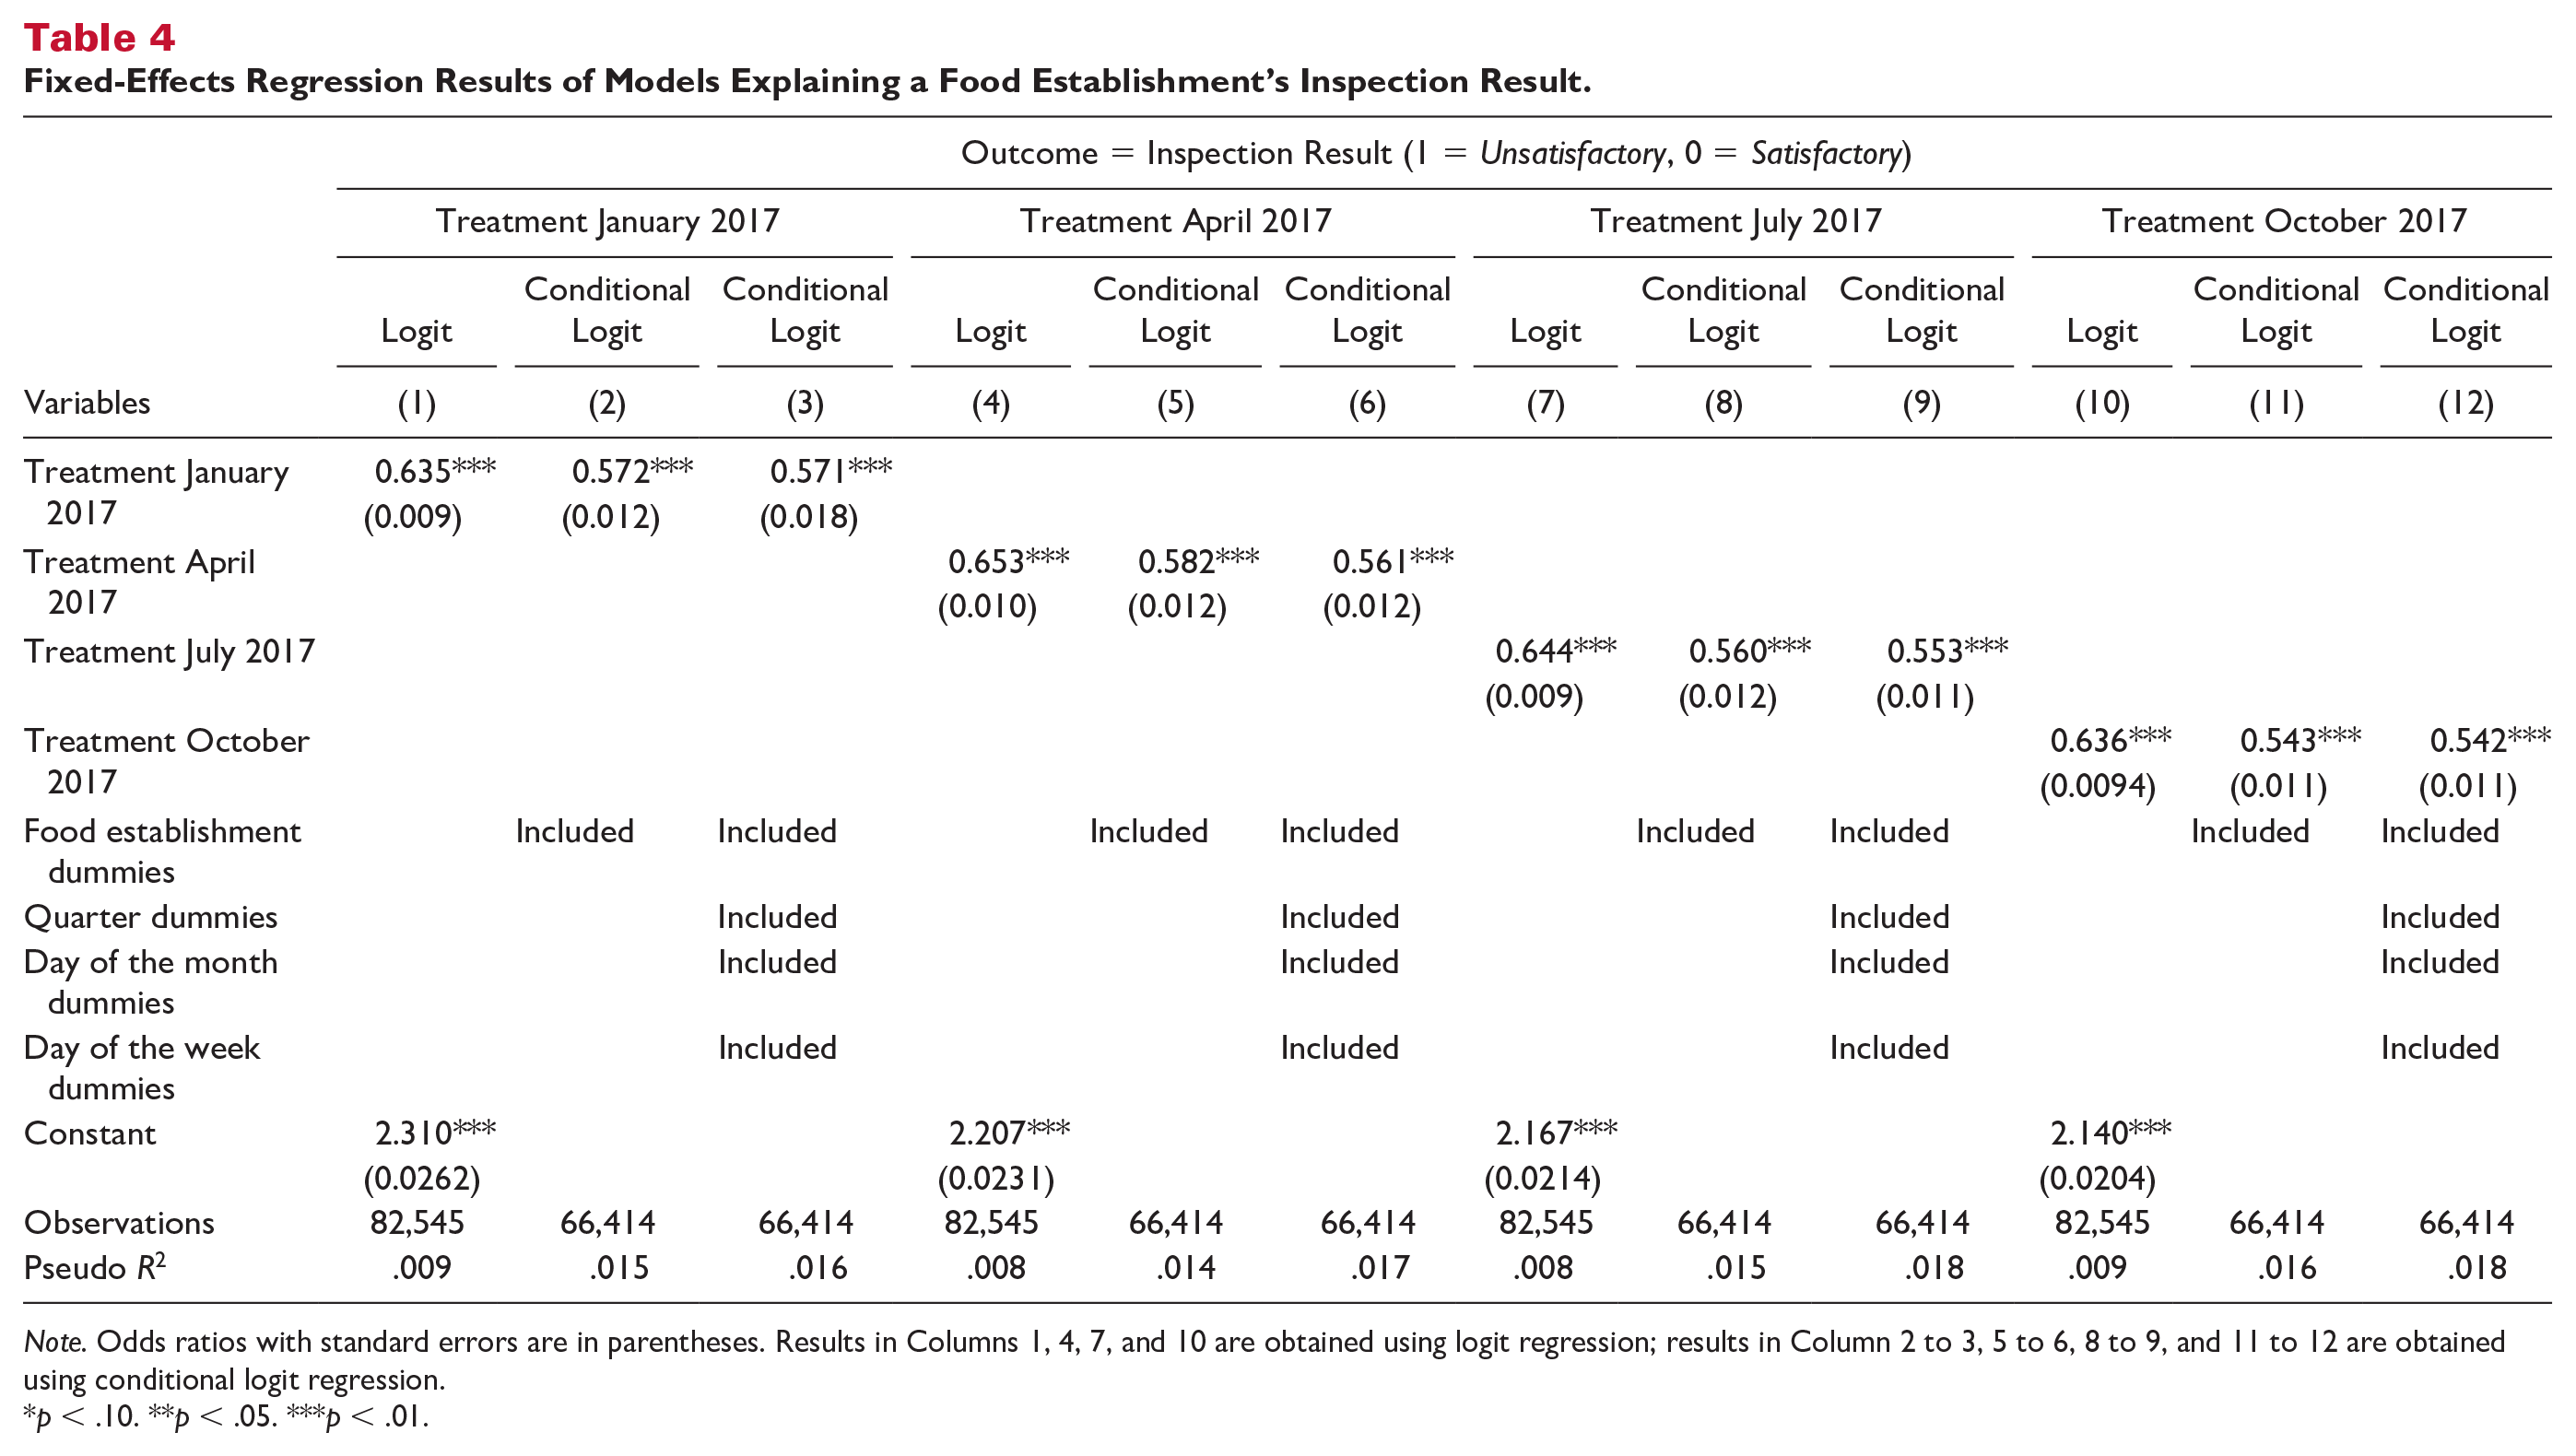
Note. Odds ratios with standard errors are in parentheses. Results in Columns 1, 4, 7, and 10 are obtained using logit regression; results in Column 2 to 3, 5 to 6, 8 to 9, and 11 to 12 are obtained using conditional logit regression.
p < .10. **p < .05. ***p < .01.
Discussion and Conclusion
The public disclosure and display of food establishment hygiene grades or scores is an increasingly institutionalized practice, yet its relevance has been questioned in recent years (Fleetwood, 2019; Ho et al., 2019; Jin & Leslie, 2009). This study aimed to assess whether emoji-based displays with zip code adjusted inspection scores at the food establishment’s front door may help to improve hygiene in food establishments. Our analysis of the implementation of the new hygiene display in King County reveals a small but meaningful decline in inspection scores and indicates that policymakers could consider the adoption of such a display or redesign of their current display sheet. Subsample analyses show that the estimated effects hold primarily for inspections in food establishments in Risk Category III and food establishments with 13 to 150 seats. Because of their prevalence, these food establishments may face the highest level of competition from nearby alternatives and may feel most pressured to have a positive emoji on their front door.
In light of the elaboration likelihood model, two aspects deserve specific discussion. First, the use of emojis seems particularly salient in drawing customer attention. With the increasing use of digital language and reliance on images instead of on numbers (Gobara et al., 2018) and the increasing lingual and cultural diversity in the United States, publicly sourced and locally adjusted hygiene scores seem to provide a meaningful cue for decision-making. The small but meaningful improvement in hygiene scores highlights the greater elaboration on the relationship between the emoji type and purchase decisions that could indirectly put pressure on the owners of food establishments to improve hygiene levels. Emojis are expected to trigger peripheral information processing that requires relatively low cognitive effort. Therefore, it may be desirable for policymakers to provide cues that trigger peripheral processing in initiatives aiming to influence customer and business behavior. Our study provides, based on the elaboration likelihood model, additional evidence for the value of such cues.
Second, our findings highlight the value of providing cues with information about relative performance. Food establishments generally compete with closely located competitors, and the adjustment of inspection scores by zip code may be an important consideration in other targeted transparency initiatives as it may set standards among competing businesses. In addition, large variations in the socioeconomic status of areas within a city also imply that customers may differentially leverage cues in central or peripheral thinking. For example, in richer neighborhoods, a good hygiene inspection score would be expected, and hence, a negative emoji may influence customer behavior significantly. Hence, the display of hygiene scores relative to the performance of local competitors allows a direct comparison to nearby competing alternatives and may, therefore, put additional pressure on food establishments to comply with hygiene standards.
Future studies may analyze possible heterogeneity in the effects across ownership type (e.g., chain vs. independent) or price level (e.g., quick service vs. fine dining), but may also focus on more downstream outcomes resulting from the new hygiene display. For example, earlier studies investigated whether such displays lowered the bacterial footprint at restaurants, lowered the incidence of foodborne illnesses, and improved the customer decision-making process. However, Ho et al. (2019) recently warned that the display of restaurant grades did not lower hospitalization from foodborne illnesses to the extent highlighted in earlier studies (Jin & Leslie, 2003, 2009). Handan-Nader et al. (2018) also did not find support for an association between the display of hygiene scores and a reduction in foodborne diseases. Therefore, to reconcile these findings with the results of the present study, it seems of particular importance to investigate the relationship between hygiene maintenance and the incidence of foodborne diseases at the food establishment level first.
Footnotes
Appendix
Author Contributions
Pankaj C. Patel and Cornelius A. Rietveld contributed equally.
Declaration of Conflicting Interests
The author(s) declared no potential conflicts of interest with respect to the research, authorship, or publication of this article.
Funding
The author(s) received no financial support for the research, authorship, or publication of this article.