
Abstract
Objectives. This study aims to determine recent lower extremity amputation (LEA) rates in individuals with and without diabetes mellitus (DM) in the Netherlands. Design. This is a retrospective, observational study of LEAs based on all-payer claims database (APCD) data from 2016 to 2021. Methods. This study analyzes LEAs using an APCD covering over 99% of the Dutch population. It assesses LEA rates in individuals with and without diabetes (types 1 and 2), focusing on 2016, when preventive diabetic foot care was fully implemented. All individuals aged ≥18 years detected with an LEA through reimbursement claims were included in the analysis. Results. The total number of individuals with reimbursed LEAs per year ranged from 5030 (35.7 per 100,000 individuals) to 5260 (38.1 per 100,000). In individuals with DM, this ranged from 2907 to 3081 (290.9 to 312.6 per 100,000). The highest LEA prevalence was found in individuals with type 1 DM (T1DM) (606.1-732.4 per 100,000). In individuals without DM, the yearly LEA rates ranged between 16.3 and 17.8 per 100,000. Approximately two thirds of all individuals with LEA were male (ratios 1.9-2.3). Conclusion. Compared to earlier Dutch studies, major LEA incidence appears to be slightly fluctuating over time, without an increase in minor amputations. This contrasts with other countries, where increased minor amputation rates are observed. These data provide valuable insights into LEA rates and emphasize that individuals most at risk are those with T1DM. More detailed studies, including longitudinal and clinical data, are needed to further specify groups and individuals at risk.
This study aims to determine recent lower extremity amputation (LEA) rates in individuals with and without diabetes mellitus (DM) in the Netherlands.”
Introduction
Many individuals with diabetes mellitus (DM) develop complications that seriously affect their quality of life and life expectancy. 1 Besides the well-known cardiovascular and renal complications of DM, diabetes-related foot disease (DRFD) is a major concern. The DRFD is defined as a disease of the foot of a person with current or previously diagnosed DM that includes one or more of the following: peripheral neuropathy, peripheral arterial disease (PAD), infection, ulcer(s), neuro-osteoarthropathy, gangrene, or amputation. 2
The DRFD often starts with a diabetic foot ulcer (DFU). The lifetime risk in persons with DM for DFU is significant; it varies between 19% and 34%. 3 Without timely diagnosis and treatment, DFU often will progress and—in particular in the presence of infections, PAD, and ulcers penetrating to bone and joints 4 —may lead to decline of functional status, increased risk of hospitalization, lower extremity amputation (LEA), and death. 5 In Europe, almost 20% of all persons with a DFU have to undergo at least a minor amputation. 6 Worldwide, 80% of the non-traumatic LEAs are due to DM, and 85% of these LEAs were preceded by a non-healing DFU. 4
In the Netherlands, quite some reports on LEA rates are available, but mainly on regional or local population levels, which impedes translating such data to sufficiently reliable country-wide estimates.
In the Netherlands, every amputation is performed in a hospital, and all the financial claims with regard to reimbursement of amputation procedures are known, both for persons with and without DM. These data are collected in 1 all-payer claims database (APCD), managed by Vektis Health Care Information Center. All Dutch health insurance companies share their data with Vektis. Therefore, Vektis can be considered an APCD. As every resident in the Netherlands is obliged by law to take out health insurance, this APCD covers virtually all citizens. Therefore, these data can provide detail on the frequency of LEAs among individuals with and without DM on a national level in the Netherlands. Using the Vektis data, this study aims to determine available recent LEA rates in individuals with and without DM in the Netherlands. These data can also provide insights into the major and minor LEA rates over the years in the Netherlands.
Methods
Design and Aim
The study presented in this article is part of a larger retrospective, observational analysis of LEAs in the Netherlands, using data from an APCD over the period 2013 to 2021. In 2006, Vektis 7 was established by Dutch health insurers to combine and interpret reimbursement data and enable the main players in the Dutch healthcare market to base decisions and policy on reliable, essential, and timely information. Vektis receives data from all Dutch health care insurers, covering health care claims for over 99% of the Dutch population.
The aim of this study is to assess reimbursed LEAs as an estimate of the LEA rates in adult individuals with and without DM during the years 2016–2021 in the Netherlands. The year 2016 was chosen because it marked the full implementation of the nationwide policy for preventive diabetic foot care in care pathways.
This study is one of the studies belonging to the DUtch Diabetes Estimates (DUDE) initiative, that derives clinically relevant data on health care and health care outcomes in the Netherlands using various data sources (for the design of this study and the specific study parameters, see DUDE-8 8 ).
Identification of the Study Population
All individuals aged ≥18 years, both with and without DM (type 1 and 2) who underwent an LEA at any level in the years 2016 to 2021, were included in the study. The study population was subdivided in 3 age categories: 18-40 years, 41-65 years, and >65 years. There were no exclusion criteria.
Identification individuals with diabetes mellitus
To identify persons treated for T2DM in primary care within the Vektis APCD, we used the identification algorithm developed by Geurten et al,9,10 which uses existing bundled payment claims codes in combination with medication claim codes to accurately identify persons with DM in the APCD. Similarly, for secondary care, we used relevant diagnosis-treatment combination (DTC) codes (comparable with the international known International Classification of Diseases [ICD]-10 codes) (ie, “221; diabetes without complications,” “222; diabetes with complications,” and “223; diabetes with chronic pump therapy” in persons ≥18 years of age) that identify people as being treated in secondary care for DM. To distinguish type 1 diabetes mellitus (T1DM) from type 2 diabetes mellitus (T2DM) in secondary care, we made the assumption that individuals with T1DM will use insulin only as glucose-lowering therapy (ATC A10A), whereas individuals with T2DM will use either diet only or diet combined with ATC A10B without or with insulin (ATC A10A) (for a more detailed description of the identification of persons with DM in the APCD, see also the design paper DUDE-8 8 ).
Identifying individuals with a lower extremity amputation
The definition of an LEA is a resection of a segment of a limb through the bone or through a joint. 2 The LEAs can be divided into minor and major amputations. Minor (extremity) amputations are defined as any resection through or beneath the ankle level, while major (extremity) amputations are defined as any resection proximal to the ankle level. 2 The described approach does not allow differentiation between non-traumatic and traumatic amputations, since this information is not part of the claims-code.
Identifying individuals with a lower extremity amputation vs total lower extremity amputation procedures within a specific year
Although this approach seems straightforward, it should be realized that within a specific year, a person can have more than 1 LEA. 11 Therefore, it is necessary to identify the amount of amputation codes as well as the number of individuals who underwent an LEA within that year. We therefore include a calculation of an individual person-oriented LEA rate. In cases where a person had multiple amputations within the same year, only the anatomically highest amputation was recorded.
Identifying the total Dutch population ≥18 years during the years 2016 to 2021
For the interpretation of the findings, the total Dutch population size was derived from publicly accessible data sets 12 describing population sizes on January 1 of each year examined.
Data on non-DM vs DM were acquired by subtracting the known size of the DM population from the total population calculated from Statline data 12 on January 1 of each year examined (categories: all ≥18 years, 18-40 years, 41-65 years, and >65 years).
Statistical Analyses
The aggregated data on LEA were analyzed descriptively. The continuous variables of age and mean expenditures per LEA category were presented as means and standard deviations (SDs). The categorical variables of sex, specialist care utilization, and medication utilization were reported as frequencies and valid percentages of the total LEA population, and further divided and reported in LEA populations without and with (T1 or T2) DM. The presented information concerns the total population with LEA in the Netherlands and has become available to the authors as aggregated data. Therefore, no attempts are made to study possible changes with a statistical test. Moreover, since the available data cover almost 100 % of the total known population, changes in frequency are as presented.
Results
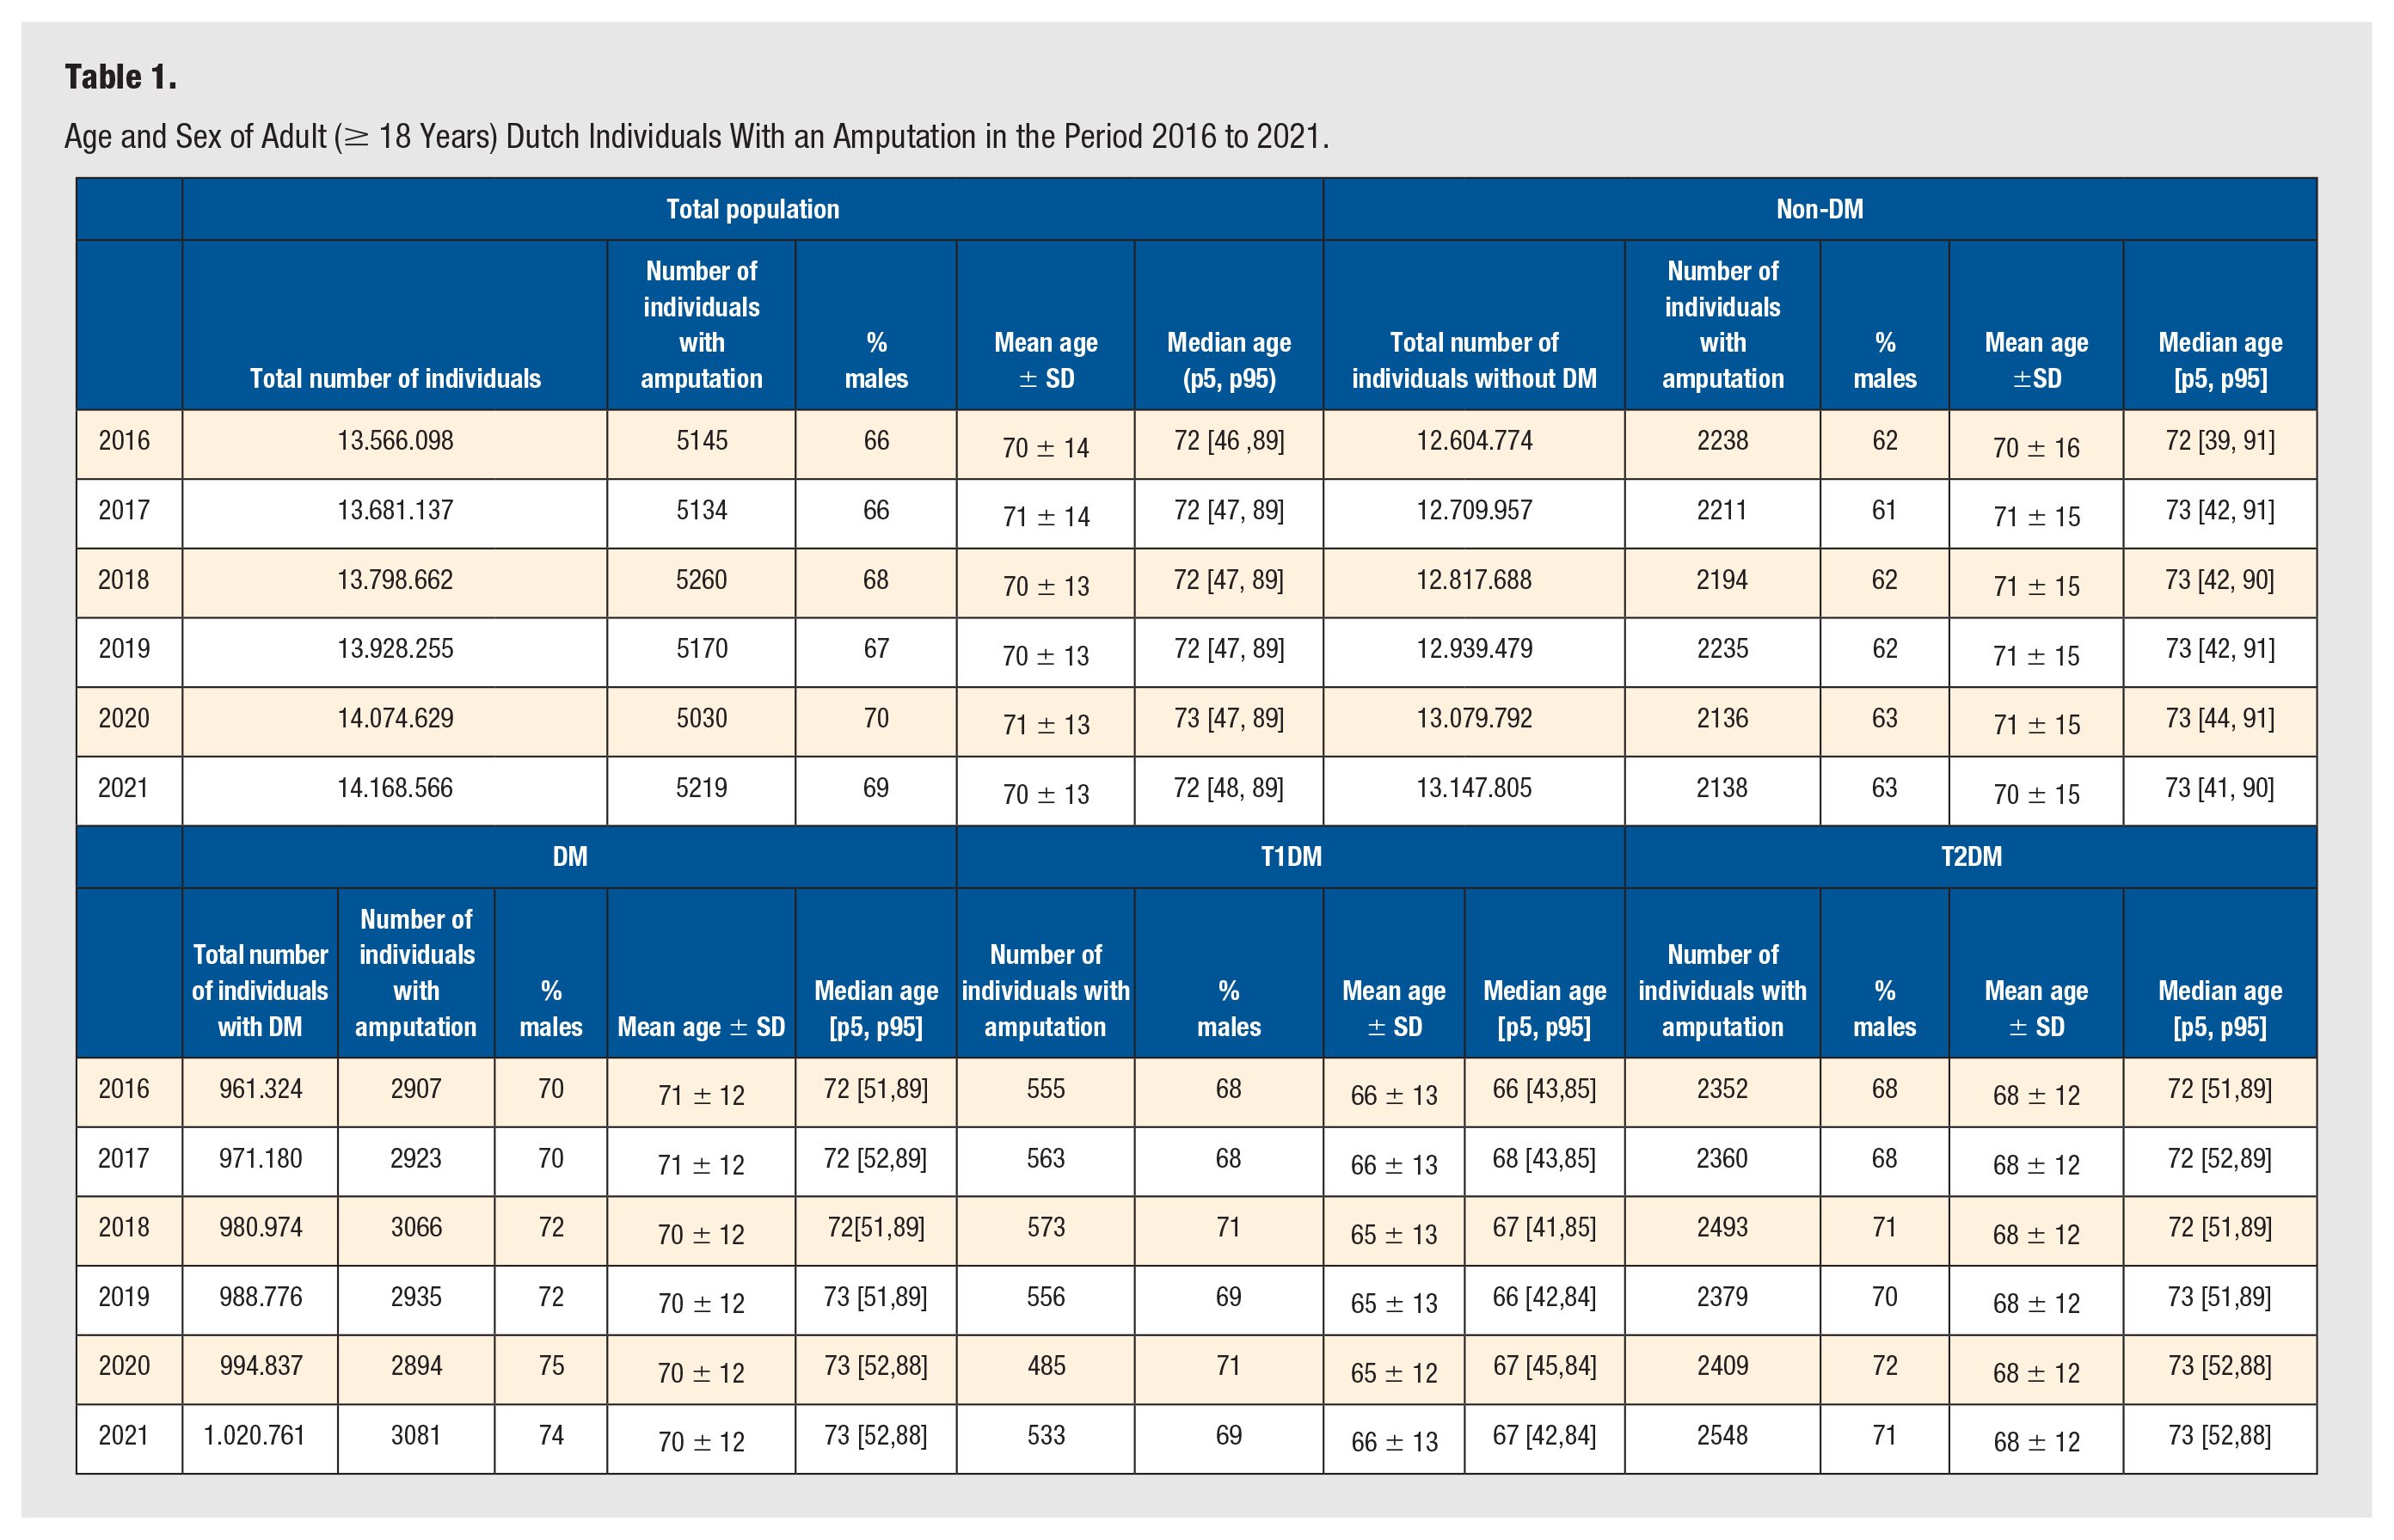
Table 1 shows the characteristics of individuals with an LEA over the period 2016 to 2021, for the total population, non-DM, and the DM population also subdivided with T1DM and T2DM. The absolute number of individuals with LEAs per year is more or less stable, with numbers of individuals with an LEA ranging from 5030 to 5260. The mean age of people who undergo an LEA is similar for individuals with and without DM. However, when comparing individuals with T1DM and T2DM, the mean age of individuals with T1DM was lower (65-66 years) when compared to individuals with T2DM (71-72 years). In addition, approximately two thirds of the individuals with an LEA are male (ratio ranging from 2.0 to 2.3 over the years), with a lower male/female (M/F) ratio in individuals without DM (1.6 to 1.7) compared to individuals with DM (DM total 2.3 to 3.0), and comparable ratios in T1DM (2.1 to 2.4) and T2DM (2.1 to 2.6). In the total population, the number of individuals >18 with an LEA per 100 000 per year was 36.8 to 38.1. In individuals without DM, the LEA rate ranged from 16.3 to 17.8 per 100 000 per year during the study period, compared to 290.9 to 312.6 per 100 000 per year in individuals with DM (for the difference between T1DM and T2DM, see Figure 1). Accordingly, the DM/non-DM ratio in the period 2016 to 2021 ranged between 17.0 and 18.5.
Age and Sex of Adult (≥ 18 Years) Dutch Individuals With an Amputation in the Period 2016 to 2021.
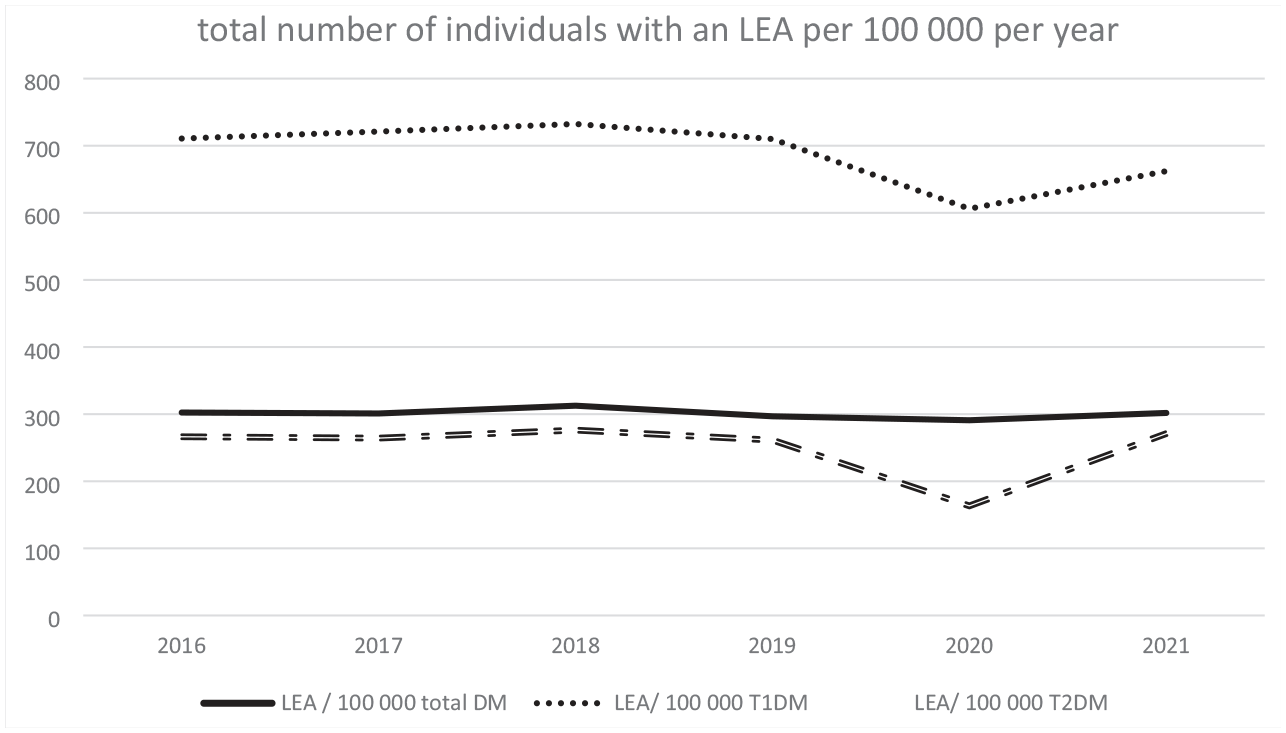
Total number of all individuals >18 with an LEA per 100 000 per year.
Differentiation into 3 age groups 18-40, 41-65, and ≥65 years shows that the LEA rate increases with age (Table 2). Moreover, the DM/non-DM LEA ratio is highest in the 18-40 years group (26.7-47.7), intermediate in the 41-65 years group (21.8-23.9), and lowest in the ≥65 years group (5.5-6.4).
Total Number of Individuals With an Amputation per 100 000 per Year Divided Into Age-Groups.
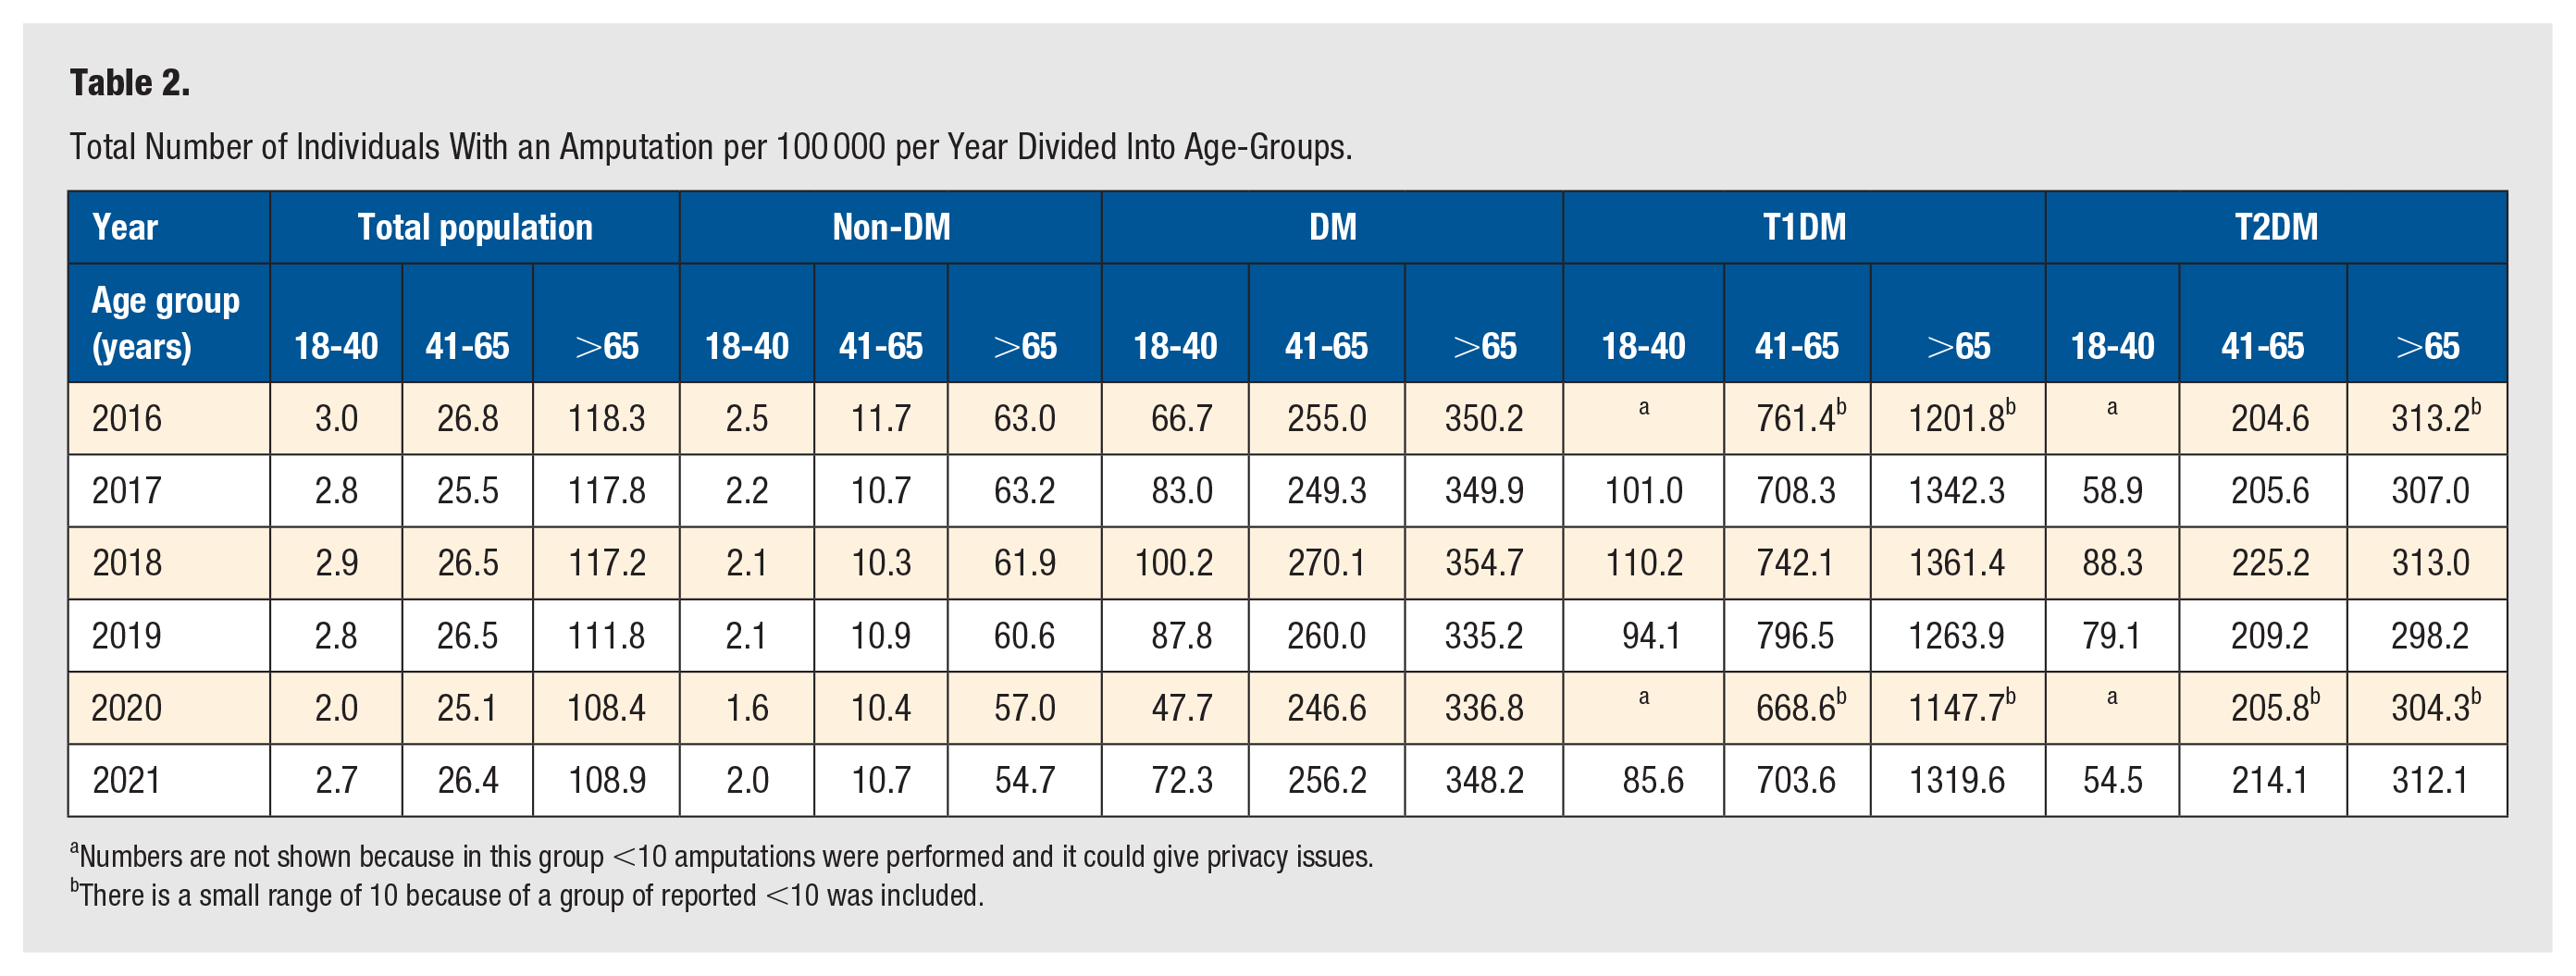
Numbers are not shown because in this group <10 amputations were performed and it could give privacy issues.
There is a small range of 10 because of a group of reported <10 was included.
When differentiating between T1DM and T2DM, the ratio T1DM/non-DM is the highest in the 41 to 65 group (64.3-73.1). In T2DM, the highest ratio T2DM/non-DM was in the same age group (17.5-21.9).
Tables 1 and 3 show the individuals who underwent an LEA and the number of performed LEAs, thus showing re-amputation rates within the same year. Individuals with DM have a higher average re-amputation rate within the same year: in DM (range between 1.44 and 1.56 over the years) compared to individuals without DM (1.21-1.39). Re-amputation rates in T1DM and T2DM are broadly comparable, albeit slightly more frequent in T1DM.
Total Number of Major and Minor Amputations 2016 to 2021.
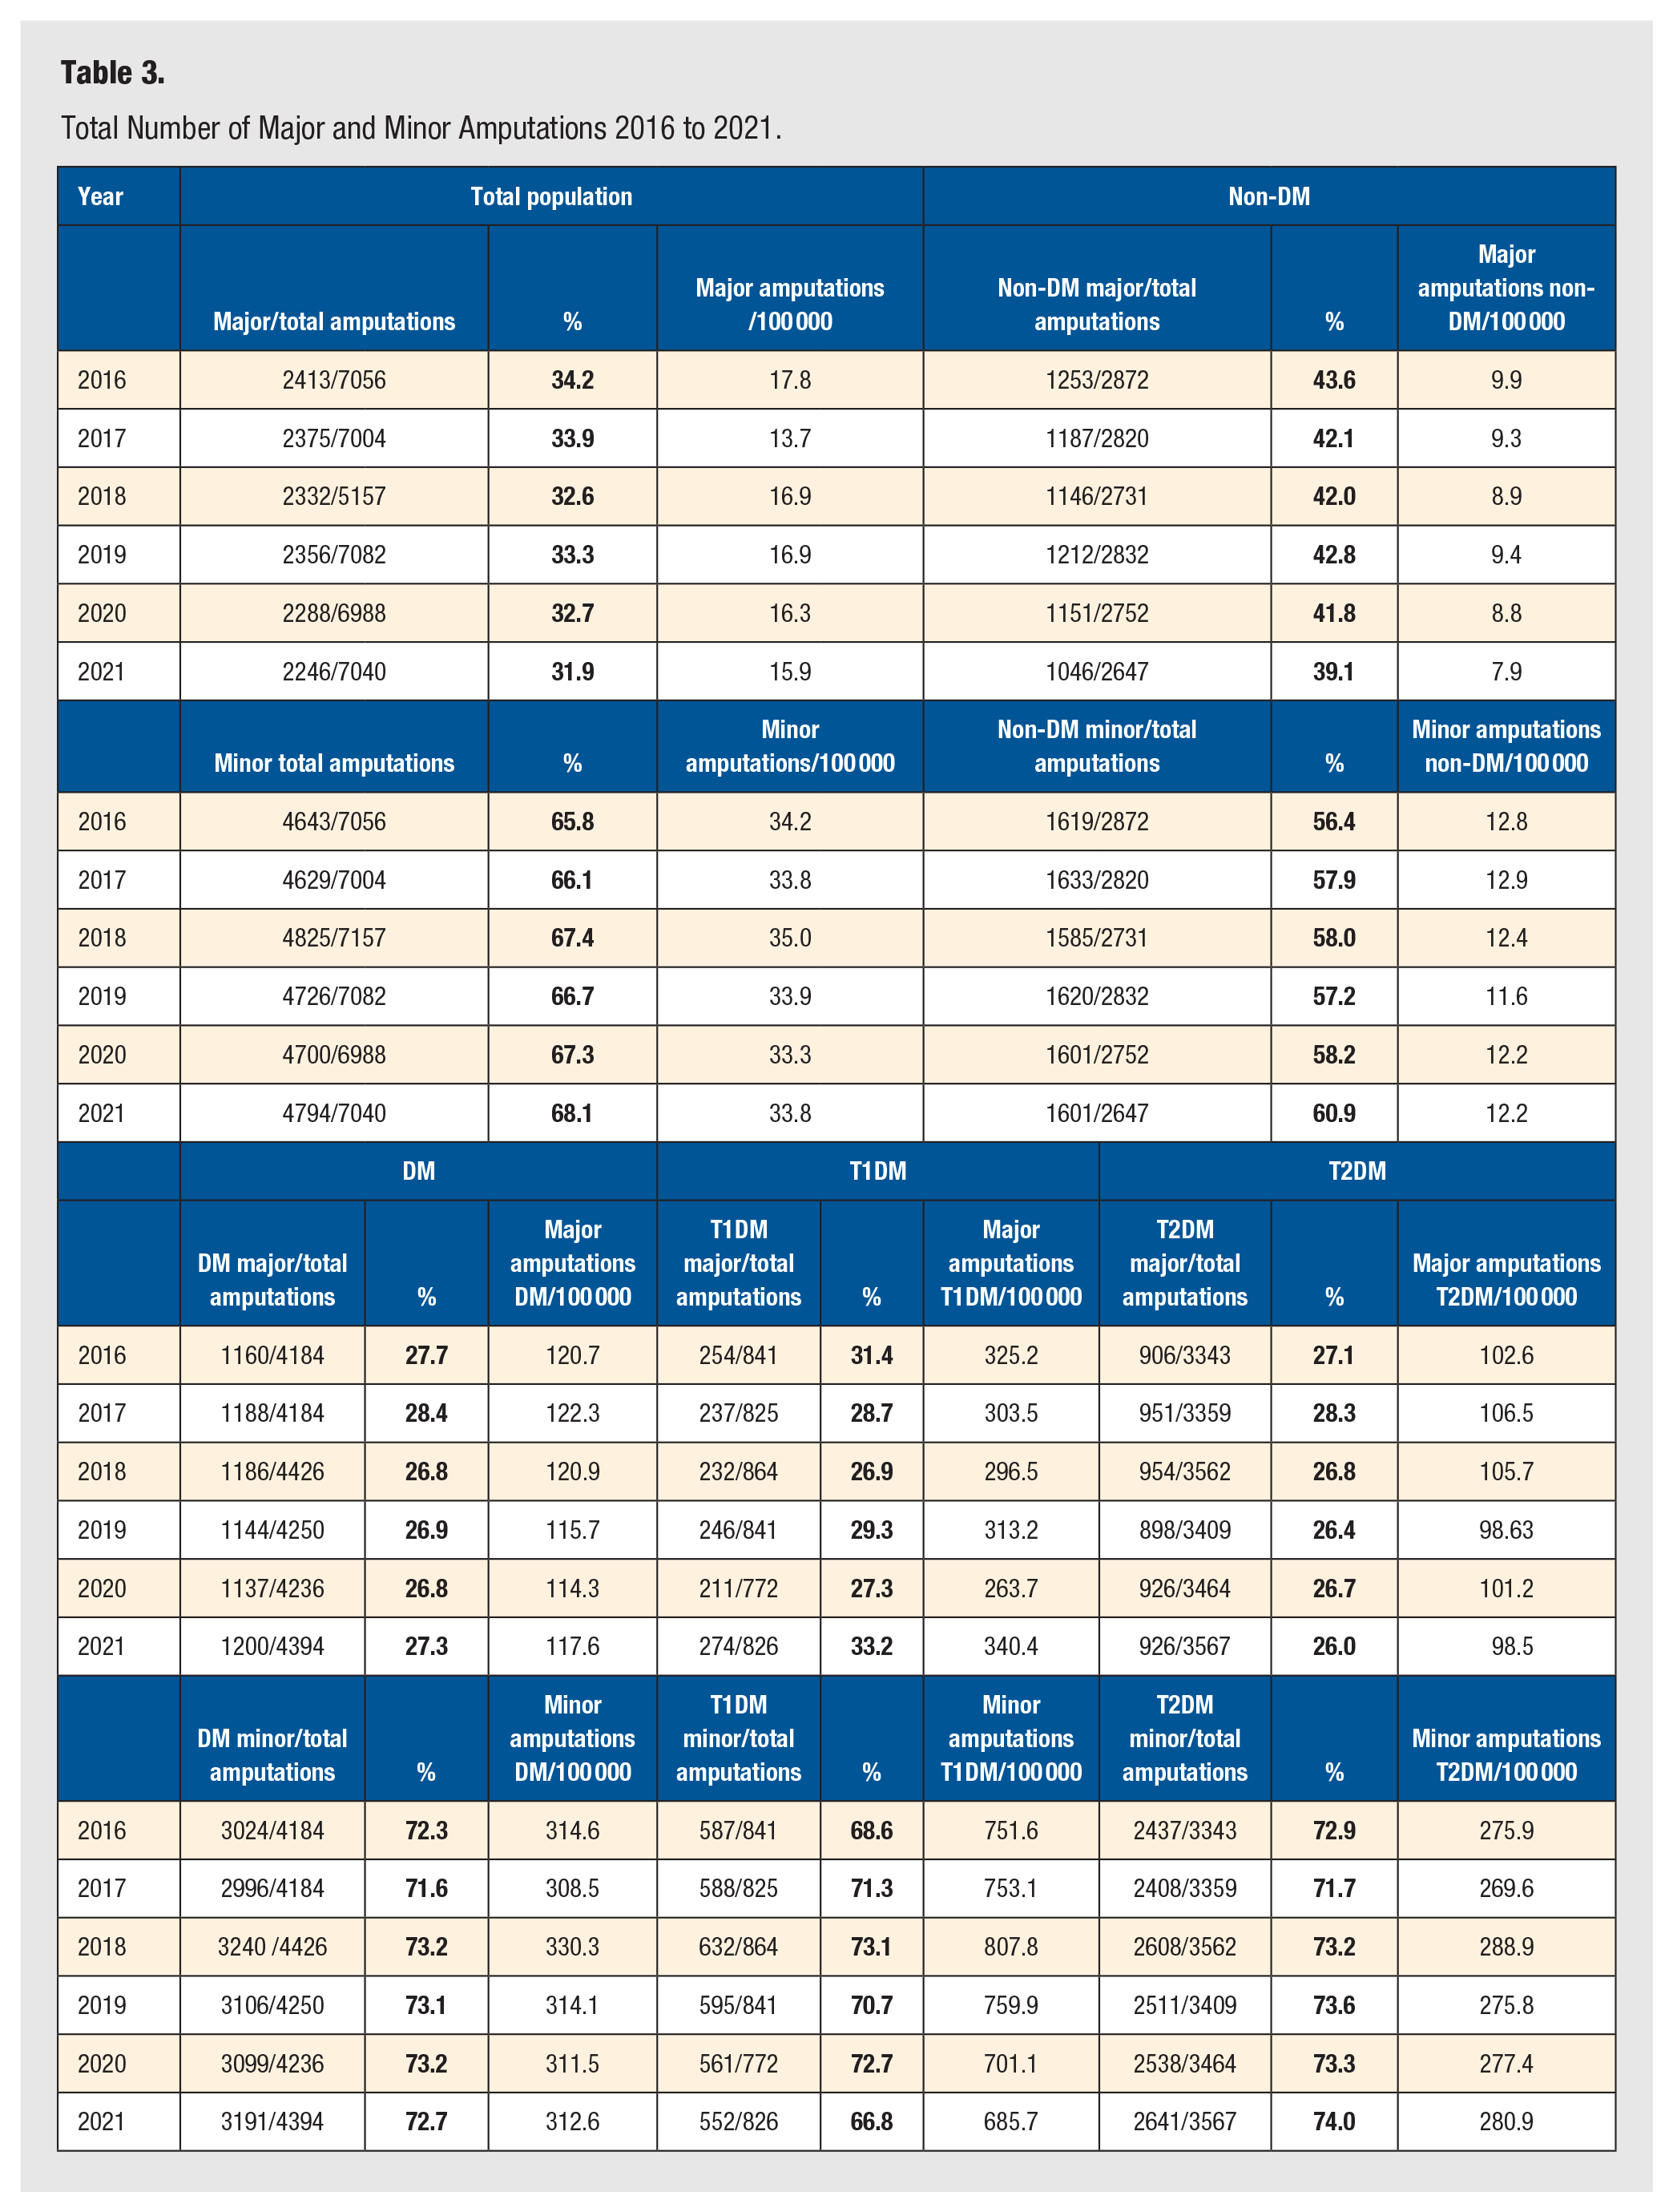
Individuals without DM who undergo an LEA more often have a major amputation (range between 39.1% and 43.6 %) compared to individuals with DM (26.8%-28.4%) (Table 3). Major amputation rates per 100 000 persons were 114.3 to 122.3 for individuals with DM vs 8.8 to 9.9 for individuals without DM. For T1DM, the major amputation rates ranged between 263.7 and 340.4 per 100 000 persons and 98.5 to 106.5 for T2DM. For minor amputations, the ranges were 33.3 to 35.0 (total group), 11.6 to 12.9 (non-DM), 308.5 to 330.3 (DM), 685.7 to 807.8 (T1DM), and 269.6 to 288.9 (T2DM) per 100 000, respectively. In Supplement 1, more detailed data are shown, also on different amputation levels. Data on the separate amputation types are shown in Supplement Table S2a–1j.
Discussion
To our knowledge, this is the first nationwide study of longitudinal LEA rates in the Netherlands using reimbursement data from an APCD. The coding used in the APCD also allowed to define amputation levels and re-amputation rates with the same reimbursement year in the period from 2016 to 2021. The use of available reimbursement data also allowed further differentiation between subjects without and with DM. This approach allows for reporting nationwide data and comparison with data from earlier studies. However, reliably reporting on comparisons with earlier studies remains challenging, since most earlier studies in the Netherlands were performed either in subpopulations or in a database in which subdivision in subjects with and without DM was not possible.
In 2017, a systematic review reported that the incidence of LEA in persons with DM ranged from 78 to 704 per 100 000 person-years and the relative risks of individuals with DM varied between 7.4 and 41.3 compared to individuals without DM. 13
Moreover, LEAs disproportionately affect men and individuals with T1DM. 14 Previous Dutch studies showed annual overall LEA rates in persons with DM of 550 per 100 000 persons in 1991, 251.7 per 100 000 in 1991 to 1992, and 363 per 100 000 in 2000.11,15 In the Northern part of the Netherlands, a reduction of first-ever major amputations in persons with DM was reported from 142.6 major amputations per 100 000 person years in the period 1991 to 1992 to 89.2 per 100 000 person years in 2012 to 2013. 16 A recently published report on nationwide data over the period 2012 to 2021 using open-source data and showed a cumulative incidence of major amputations of 13 per 100 000 persons in the total Dutch population, with 85% due to diabetes and vascular disease. 17 However, these were overall data, and no distinction could be made between individuals with and without DM; also, more detailed information on the population was scarcely available.
The LEA rates reported in our study are dramatically higher in individuals with DM compared to individuals without DM. Being of male sex and of higher age confers a higher risk on LEA in all groups (with and without DM). Re-amputation risk within the same year is higher in individuals with DM compared to individuals without DM. This risk is slightly higher again in T1DM compared to T2DM. These findings are comparable with a Nationwide Swedish study on persons with T1DM, compared to the general population. 18
When comparing our data with earlier Dutch studies, our findings suggest a decline in the LEA rate in the Netherlands. Annual overall LEA rates in the Netherlands in individuals with DM were reported as 550 per 100 000 in 1991, and 363 per 100 000 in 2000. 11 The current study reported ranges between 290.9 and 302.4 individuals with an LEA per 100 000 per year in the period 2016 to 2021. As mentioned, differences in study design and included study population limit firm conclusions.
When looking at the different types of LEAs a distinction is made between major and minor amputations. In our study, we found a slight decline in major amputations per 100 000 individuals in all groups of persons and a stable minor amputation rate during the studied years. These findings are comparable with the findings of a nationwide study performed in Belgium that showed a decline of the major amputations without an incline of the minor amputations in a comparable timeframe (2009-2018). 19 A study in Norway similarly observed a decline in major amputation rate, although this coincided with an increase in minor amputation rate. 20 This is in contrast with data from the United States, where there was an increase in LEA rates since 2009, although a majority of studies describe in particular an increase in toe- and foot amputations and different classifications of amputations were used.5,21,22
In our opinion, national data on LEAs such as those presented in this paper are relevant for international comparisons, but also within the Netherlands to allow comparison for regional benchmarking to evaluate the quality of regional care. A regional Dutch study on the LEAs in persons with DM in the region of Zwolle showed a major amputation rate in the year 2019 of 84.5 per 100 000 people with DM. 23 When comparing these outcomes with the data as presented in this article (national data) with ranges from 114.3 to122.3 major amputations per 100 000 persons per year, there is a marked difference. We hypothesize that proper organization of both preventive and curative care will contribute to better outcomes. Still, this hypothesis is in need of confirmation or rejection in further studies.
The main strength of this study is that the available information is derived from a database containing the reimbursement information of over 99% of the Dutch population. Because of the economic purpose served by the APCD, the data undergo detailed quality control before being formally entered in the Vektis database. Due to the previously developed method regarding the identification of individuals with the diagnosis DM9,10 with the availability of specific codes in the Diagnose Behandelcombinatie (DBC) claims-system allows us to include all reimbursed LEAs in the analysis. The possibility to identify specific individuals in the Vektis database also allows us to identify both the individuals and the number of LEAs within the same year, thus getting an impression on re-amputation rates.
There are also limitations to this study. While APCD data can differentiate between individuals with and without DM reasonably well, it is less reliable in distinguishing between those with T1DM and type 2 DM (T2DM). This uncertainty should be considered when interpreting the results. The APCD lacks clinical data, which means it does not account for risk factors such as the presence of foot ulcers, previous amputations, signs of obstructive atherosclerosis, smoking, hypertension, lifestyle factors, metabolic control, and other chronic diseases. It was not possible to distinguish between traumatic and non-traumatic LEAs in the APCD.
In addition, the data cannot indicate whether subjects reported as having an amputation in 2016 experienced re-amputations in the years 2017 to 2021. Differentiating between first-time amputations and subsequent re-amputations will only be possible with a new database specifically designed for this purpose.
Another limitation is that Vektis reports aggregated data to the research group as “<10” when fewer than 10 individuals are involved, which can cause slight underreporting in some calculations. However, we expect this to have minimal impact on the overall reported outcomes.
Conclusions
This study indicates that LEAs in individuals with DM in the Netherlands show slightly fluctuating rates during recent decades. Relatively, the number of amputations in individuals with DM vastly outnumbers those in individuals without DM. Higher age, male gender, and DM (especially T1DM) are associated with the highest risk of LEA.
Supplemental Material
sj-docx-1-fas-10.1177_19386400251333047 – Supplemental material for Lower Extremity Amputation Rates From 2016 to 2021 in People With and Without Diabetes Mellitus in the Netherlands: DUDE-9, a Retrospective, Observational Study
Supplemental material, sj-docx-1-fas-10.1177_19386400251333047 for Lower Extremity Amputation Rates From 2016 to 2021 in People With and Without Diabetes Mellitus in the Netherlands: DUDE-9, a Retrospective, Observational Study by Leonie Rosien, Rose Geurten, Henk Bilo, Dirk Ruwaard, Rijk Gans, Jacques Oskam, Chantal Tilburg, Arianne Elissen and Peter van Dijk in Foot & Ankle Specialist
Footnotes
Data Availability Statement
Formal consent from the Dutch health insurance companies was needed for this study. The consent of the Dutch health insurers was registered in mandates with numbers 6-449 UM-RIVM-UMCG—“Vervolgonderzoek diabetes” and 6-449-2. The research group did not receive individual claims data, but aggregated data in answer to written analysis request for each question. The use of these data by other interested parties will again need formal consent of the Dutch health insurance companies.
Declaration of Conflicting Interests
The author(s) declared no potential conflicts of interest with respect to the research, authorship, and/or publication of this article.
Funding
The author(s) disclosed receipt of the following financial support for the research, authorship, and/or publication of this article: This work was supported by the Dutch Association of Podiatrists (NVvP) WI/KA/GC4550, The ISALA W&I foundation, The Diabetes Research Foundation, and Zwolle and Innofeet podiatry, Zwolle. All mentioned sponsors had no involvement in the study.
Ethical Approval
This study has been approved by the Medical Ethical Committee of Isala Zwolle (METC230603).
Informed Consent
All the received data were fully anonymous.
Trial Registration
Supplemental Material
Supplemental material for this article is available online.
References
Supplementary Material
Please find the following supplemental material available below.
For Open Access articles published under a Creative Commons License, all supplemental material carries the same license as the article it is associated with.
For non-Open Access articles published, all supplemental material carries a non-exclusive license, and permission requests for re-use of supplemental material or any part of supplemental material shall be sent directly to the copyright owner as specified in the copyright notice associated with the article.