
Abstract
According to the theory of liking, data quality might be improved in face-to-face survey settings when there is a high degree of similarity between respondents and interviewers, for example, with regard to gender or age. Using two rounds of European Social Survey data from 25 countries including more than 70,000 respondents, this concept is tested for the dependent variables amount of item nonresponse, reluctance to answer, and the probability that a third adult person is interfering with the interview. The match between respondents and interviewers is operationalized using the variables age and gender and their statistical interactions to analyze how this relates to the outcomes. While previous studies can be corroborated, overall effect sizes are small. In general, item nonresponse is lower when a male interviewer is conducting the interview. For reluctance, there are no matching effects at all. Regarding the presence of other adults, only female respondents profit from a gender match, while age is without any effect. The results indicate that future surveys should weigh the costs and benefits of sociodemographic matching as advantages are probably small.
Introduction
It is well accepted that survey quality and nonresponse are affected by certain characteristics of the interviewer, like gender, age, or other sociodemographic aspects in face-to-face interviews (Durrant et al. 2010). Beyond that, there is a growing body of evidence showing how respondent-interviewer matching with respect to some key variables can improve data quality (Vercruyssen, Wuyts, and Loosveldt 2017). Especially given the well-researched theory of liking, which predicts similarity of respondents and interviewers regarding some obvious features in face-to-face interview situations like gender, age, education level, style of clothing, or general habitus, these findings are not surprising (Groves, Cialdini, and Couper 1991). The underlying idea is that people like and prefer other people that are similar to themselves. This effect, which probably operates subconsciously, might benefit survey settings as respondents are more open and might answer questions more freely and less reserved (McPherson, Smith-Lovin, and Cook 2001). The expectation is that this benefits survey quality since it is easier to retrieve true and unfiltered opinions of the respondent and less probing is necessary. The current study follows up these results and examines in depth how matching can contribute to improve data quality and reduce missing data problems in survey situations using European Social Survey (ESS) data from 25 countries. Three main outcomes will be used to assess data quality: the amount of item nonresponse in an interview, the probability that a respondent is reluctant to answer questions, and the probability that a third adult person is interfering with the interview. Summarized: How does sociodemographic matching with respect to gender, age, and their statistical interactions influence data quality in face-to-face interview situations?
The present study attempts to close some research gaps, which concern the influence of gender matching on item nonresponse and item nonresponse bias (West and Blom 2017) and especially the external validity of matching with respect to a large number of countries and cultural settings. First, given the high-quality data available which include more than 70,000 respondents, it should be possible to estimate precise effects and decrease the amount of uncertainty. Second, since multinational data are available from 25 European countries, the findings should have a high external validity and generalize to a wide range of different social and cultural settings. Third, the used multilevel design with three random intercepts (respondents nested within interviewers nested within countries), it is also possible to disentangle interviewer effects from respondent effects. Clearly, interviewers differ with respect to their overall experience and talent, which can influence results and should be investigated with care. In accordance with similar studies (Vercruyssen et al. 2017), matching between respondents and interviewers is operationalized using the variables age and gender and tested through statistical interactions in a series of nested models to generate a high level of insight and also account for the influence of control variables.
These research tasks seem highly relevant as matching, if positive effects could be demonstrated, would be a relatively easy to implement way of improving data quality and decreasing the amount of item nonresponse. Finally, it should be admitted that the focus on item nonresponse in comparison to unit nonresponse seems arbitrary, which is true to a certain extent. However, as there are given word limits, it seemed best to focus on item nonresponse as the ESS provides richer data to explore this context. Subsequent studies will also take the unit nonresponse into account.
Review of the Literature
It is generally accepted that not only the characteristics of the respondent such as age or level of education affect aspects of data quality like item nonresponse (Groves 2009; Tourangeau, Rips, and Rasinski 2000) but also the characteristics of the interviewer have an important influence (Brunton-Smith, Sturgis, and Leckie 2017; Davis et al. 2010). The current research deals with the statistical interaction of these two aspects, that is, how the (dis)similarity between respondents and interviewers, also called sociodemographic match, affects data quality. In this context, data quality is given when responses are “true,” unbiased, and complete.
Theory of Liking
The main theoretical framework that explains why sociodemographic matching affects data quality is the theory of liking (Groves et al. 1991; Groves, Cialdini, and Couper 1992), which suggests that a person prefers to interact with others that he or she likes. Important factors that determine whether one likes another person seem to be, among others, similarity of attitude (Byrne et al. 1971), background (Stotland and Patchen 1961), and dress style (Suedfeld, Bochner, and Matas 1971). This is also known as homophily, which states that we like people that are similar to ourselves. To demonstrate why this is relevant for the research questions, two things have to be shown: first, that gender and age refer to the aspects mentioned and second, that liking actually increases data quality. To start with age and gender, it seems logical that these two factors influence certain aspects, for example, attitudes (McPherson et al. 2001). People with approximately the same age share birth cohorts, which means they also experienced certain events and periods together, for example, historic events but also the same trends, fashions, slang, and more. Therefore, when the age difference between respondent and interviewer is small, chances are higher that they share certain social aspects that make them more similar on average, compared to when age difference is large. One study shows that 38 percent of all friends are within two years of age difference (Fischer 1977). The argumentation for gender match is analogous, although interests are here more important than time. Research confirms what is well known: Men and women differ in the topics they show interest in, for example, considering vocational choices or leisure activities (Su, Rounds, and Armstrong 2009). Therefore, it can be assumed that gender matching should, on average, increase the similarity between respondent and interviewer, which should in turn increase liking. In other words, on average, men are more similar to men than to women and vice versa. Summarized, it can be assumed that the factors mentioned above like personal preferences, background, and dressing style are more similar when age and gender are similar. Clearly, this does not mean that a perfect sociodemographic match will always result in a high degree of liking, as even within birth cohorts and genders, a multitude of interests and attitudes exists, but, on average, the probability of liking is predicted to be higher.
Item nonresponse or not answering questions at all is of central interest in understanding how liking and data quality are related. Nonresponse might occur more often when a respondent does not trust the interviewer or the question is so sensitive that the information will not be shared, especially when guilt or shame is high and the respondent does not expect understanding or even fears moral judgment. A large degree of similarity between respondent and interviewer could improve these aspects as similar people might share similar interests and moral attitudes (McPherson et al. 2001:429). Therefore, when similarity with the interviewer is higher, the fear of moral judgment or lack of understanding might be lower, which increases the probability that the respondent will answer. Based on this, we can expect that the larger the degree of similarity between respondent and interviewer, the lower the amount of item nonresponse in a face-to-face interview (Hypothesis 1). The second outcome of interest is about how smoothly respondents interact with the interviewer or whether they are reluctant to answer a question. Following the logic of the theory described above, one would conclude that respondents are more open and more willing to answer a question truthfully when they trust the interviewer and find him or her sympathetic. When respondents trust the interviewer and interact more naturally, it can be expected that less probing is necessary and the question-answer flow should be more continuous. As this relates to the degree of similarity with respect to gender and age, the second hypothesis is that the larger the degree of similarity between respondent and interviewer, the lower the probability that a respondent is reluctant to answer a question in a face-to-face interview (Hypothesis 2). The last scenario is slightly different from the first two and does not put the respondent in the focus but rather the situation of the interview itself. It is well known that respondents might be self-conscious when a third person is present (Reuband 1992) and accordingly interview situations are preferred when the respondent is alone with the interviewer. Here the question arises whether the degree of similarity between respondent and interviewer affects the probability that any other person is present. Of course, there are situations when having a third person at the interview cannot be avoided, for example, when small children are present and the parent is the only person at home. In other cases, it might be different, for example, when the respondent can choose whether to be alone and the interviewer is perceived as a stranger or even a threat. When this is the case, it seems plausible that a respondent opts for not facing the interviewer alone, but having another person participate, for example, the spouse or a roommate. As was shown above, the more the similarity between respondent and interviewer, the larger the probability for liking the interviewer. Therefore, one would expect that there is no need to call a third person to the interview as a companion as long as the respondent likes the interviewer and perceives him or her as sympathetic. Furthermore, even if a third person is present, it can be argued that the chance that this person actively interferes is smaller when the interview is proceeding smoothly. For example, a third person might agree to attend the interview in silence, but interferes only when the interviewer is probing the respondent repeatedly. As this might be more likely when the similarity between interviewer and respondent is small, this would explain how similarity and third person interference is related. Based on this reasoning, it is expected that the larger the degree of similarity between respondent and interviewer, the lower the probability that a third person is present and interfering with the interviewing process (Hypothesis 3).
Interviewer Effects
There exists a large body of literature about the effects of respondent-interviewer matching, dating back at least to the 1920s (Rice 1929). Matching on ethnic characteristics or, especially in the U.S. context, origin, was one of the first aspects to be explored (Williams 1964). While some of these studies did not find any positive effect of origin/ethnic matching (Axinn 1989; Dotinga et al. 2005), others reported positive results (Johnson et al. 2000; Oyinlade and Losen 2014; Webster 1996). A second major component is matching with regard to educational levels. One could assume that it should improve interviewing results when respondent and interviewer have approximately the same level of education, as this might make communication easier and enable a more emphatic interview experience. Yet the results are again mixed. While Durrant et al. (2010) report that matching on the gender and educational level increases cooperation rates, others find null or negative effects (Riphahn and Serfling 2005; Vercruyssen et al. 2017; Weiss 1968).
Gender and Sensitive Items
In the current context, matching on gender and age seems most important. Apparently, women are more open to female interviewers (Fletcher and Spencer 1984) and both men and women are more responsive for sensitive psychological items when the interviewer is female (Chun et al. 2011). Yet, this effect is questionable when the items are about sexual behavior or substance abuse (Catania et al. 1996; Johnson and Parsons 1994). Therefore, it is not possible to conclude that women are the better interviewers when sensitive items are concerned, as the specific type of item appears to be relevant. When age is considered, former results are again divided. While some studies report that age matching seems beneficial for older respondents (Herzog and Rodgers 1992), there is no stable effect for sensitive items (Wilson et al. 2002). An ambitious research synthesis, including hundreds of studies, comes to the conclusion that sociodemographic matching seems useful as 4 of the 10 studies considered reporting positive findings (West and Blom 2017). This notion is partially supported by Vercruyssen et al. (2017) who report that gender matching for men shows positive effects on item nonresponse (higher item response rates), but not for women. They also come to the conclusion that age matching reduces item nonresponse, which cannot be attributed to age effects alone, as they control for the age of the respondents. Finally, regarding the effect of sociodemographic matching on the probability that third persons are present, two studies report that females interviewed by a man are more often accompanied by a male in comparison with a female interviewer (Hartmann 1994; Preetz 2017), which is interpreted as a form of social control. As discussed above, this interpretation is not guaranteed to hold as women may choose freely to have someone with them when they do not trust the interviewer.
A review of the literature reveals a heterogeneous picture; for every relevant aspect, there are positive and negative (or null) findings and no distinct conclusion is possible. A more detailed inspection reveals that these findings are highly complex as sometimes minor details, for example, the topic of a sensitive item, are also relevant and influence the result. Possibly, a quite complex theoretical framework would be necessary to account for every detail and furthermore all interactions between the relevant aspects, like gender, age, or education. Although the approach of this study will be based on the relatively simple theory of liking as justified above, we hope that including some interactions between age and gender can reveal new insights that might be beneficial for the general development of survey research. Finally, it should be admitted that some of the studies cited are quite dated but are still the best indicators available. New studies would be desirable to check whether the findings still hold nowadays.
Methods
Data
To test the effects of respondent-interviewer matching, data from ESS rounds 8 and 9 will be used. The ESS is a biannual European survey that includes a multitude of questions about all aspects of life with a focus on social aspects and politics, which are highly standardized between countries, and only some questions differ, for example, regarding educational degrees. The topics of the surveys focus on education, income, employment, general standard of living, and political views. Since there are almost no items that are specifically gender related, this might influence the results, which is further addressed in the discussion of the results. There are in total 25 countries included in both rounds of the survey. The ESS releases information about the main questionnaire as well as additional data, which contain information about the interviewers (age and gender), how reluctant respondents were to answer questions, and whether any third persons were present and interfering with the interview. Information about the educational level of the interviewer is not available and therefore cannot be used for matching; however, as presented above, educational matching does not seem to have much influence on outcomes in the majority of studies. All interviews were conducted using computer-assisted personal interview (CAPI) except for the following countries which used paper and pencil interview (PAPI): Spain, Russia, Poland, Lithuania, and Israel (“ESS9 Documentation Report 2018” 2018). One challenge of the analysis is that the design is not interpenetrated; therefore, interviewers are not guaranteed to be assigned randomly to sample units but rather based on geographic and temporal demand and interviewer availability. As sociodemographic characteristics of interviewers and sample units are not considered for the assignment of sample units to interviewers, there is clearly an element of randomness in the process, although it is known that nonresponse bias can still affect the results (West and Blom 2017:177–82). As only item nonresponse (and not unit nonresponse) is regarded in this analysis, we therefore decide to control for a set of variables, which is described below. Yet as the main variables of interest, gender and age, are still highly variable even within a region or neighborhood, the bias might be rather small. Finally, the multilevel approach, which includes random intercepts for interviewers, takes into account that respondents nested within interviewers might be more similar to each other than in a complete random design, which is described using the intraclass correlation.
Respondents who were younger than 18 years old at the time of the survey were excluded from the analysis. The ESS pays great attention to maximizing response rates. The average response rate is between 30.6 (Germany) and 74.4 (Israel) percent in Round 8 (Stoop et al. 2016).
Variables
Degree of sociodemographic match
There are two central constructs of interest: gender and age match between respondent and interviewer. To operationalize this, three variables will be used: the gender of the respondent (Female), indicating whether a respondent is female (1) or male (0). When the gender of respondent and interviewer is identical, the variable GenderMatch takes the value 1, 0 otherwise. Finally, the age difference between respondent and interviewer is recoded into a new variable (AgeMatch) with three categories: interviewer younger than respondent (0), age difference within five years (1), and interviewer older than respondent (2). Clearly, the cutoff point of five years for a “match” is arbitrary. This form of operationalization is adopted as it is already applied in another similar study (Vercruyssen et al. 2017:4), which maximizes comparability. Also, a continuous variable would be harder to interpret with less concrete statements about their effects. 1 By further including all relevant interactions between these three variables, it is possible to model a quite complex degree of matching. Table 1 (page 6) shows descriptive statistics for the overall match between respondents and interviewers by gender of respondent.
Descriptive Matching Statistics by Gender of Respondent.
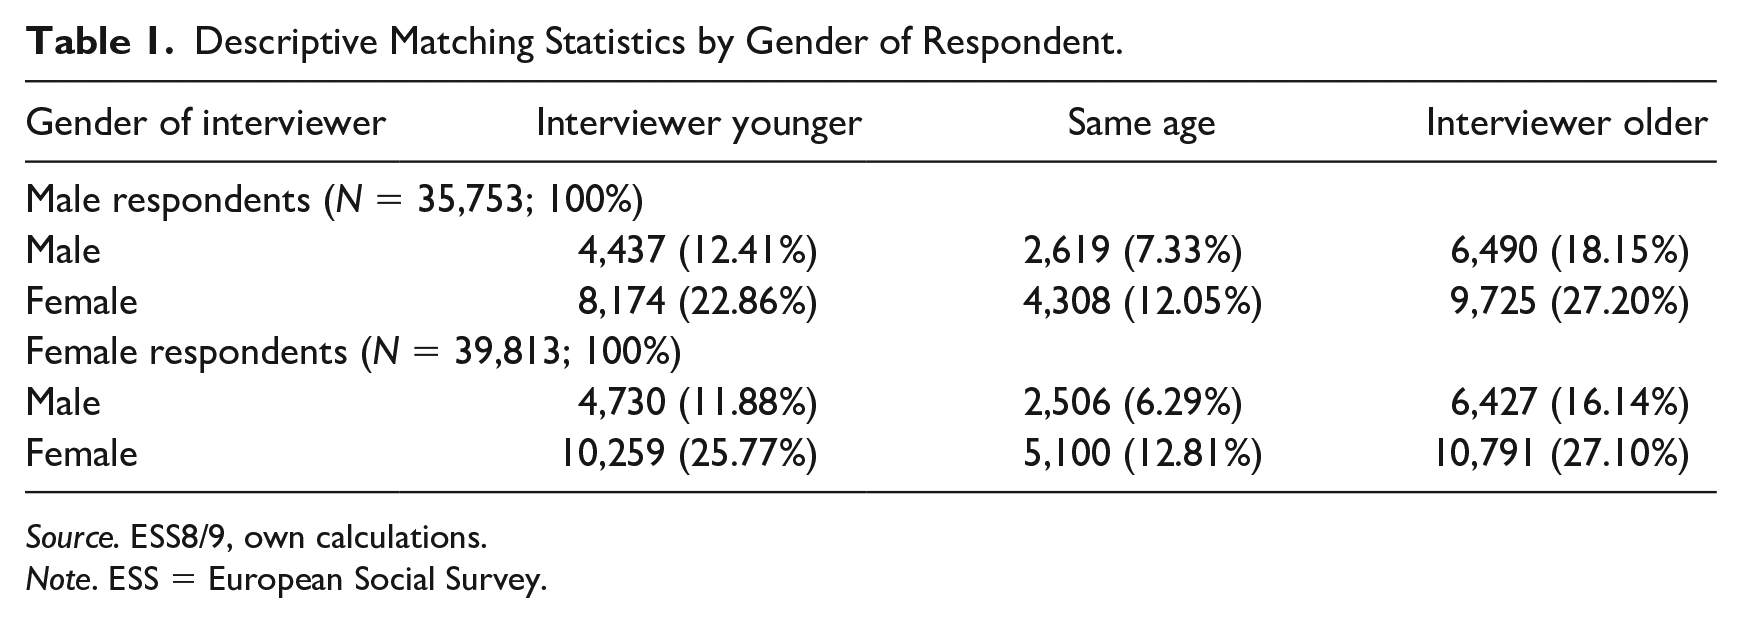
Source. ESS8/9, own calculations.
Note. ESS = European Social Survey.
Amount of item nonresponse
To count the number of items refused by the respondent, all items with the following codings were selected: “refusal,” “don’t know,” and “no answer.” To count the exposure, all items were selected that had either one of these missing codes or a valid response. Doing so allows discounting all questions that were filtered out and are thus not eligible for calculating this measurement. In the following models, the exposure is included in the models to allow a correct estimation of effects. Furthermore, all items that were answered by the interviewers were removed since these cannot give information about the response rate of the respondent. Respondents with more than 50 missing or refused items (which correspondents to the 99th percentile) are excluded from these models since no regular survey situation can be assumed.
Reluctance to answer
To measure whether respondents had problems answering questions or were unwilling and reluctant to answer, an item from the interviewer questionnaire can be used. Interviewers had to rate on a five-point scale the degree of reluctance a respondent displayed during the interview, measuring how often respondents were reluctant to answer. The variable is scaled as following: “very often” (5), “often (4), “now and then” (3), “almost never” (2), and “never” (1). It should be admitted that this variable has some amount of inherent measurement error, which is quite unavoidable in the social sciences, but the multilevel design described below should be able to account for some amount of the variation caused by the inherent (psychological) differences between interviewers.
Third adult person present and interfering with the interview
Interviewers indicated in the interviewer questionnaire whether any third adult persons were interfering with the interview, for example, spouses, siblings, in-laws, or other people. As the ESS does not give a clear definition of interference, the colloquial meaning is assumed (“to interpose in a way that hinders or impedes; come into collision or be in opposition”; “Definition of Interfere” 2018). The variable is therefore binary, indicating whether this occurred or not.
Three different outcomes will be used. The first, amount of item nonresponse, is objective, while the other two are more subjective and rely on the assessment of the interviewer. By utilizing all three variables, we attempt to achieve a more complete picture with regard to the interviewing situation and data quality. Table 2 (p. 8) lists descriptive statistics for all outcomes by countries. Table 3 lists all pairwise correlations for the dependent variables. The results underline that there is correlation present, which indicates that all three variables can be regarded as appropriate measurements to assess the construct data quality.
Descriptive Statistics by Country.
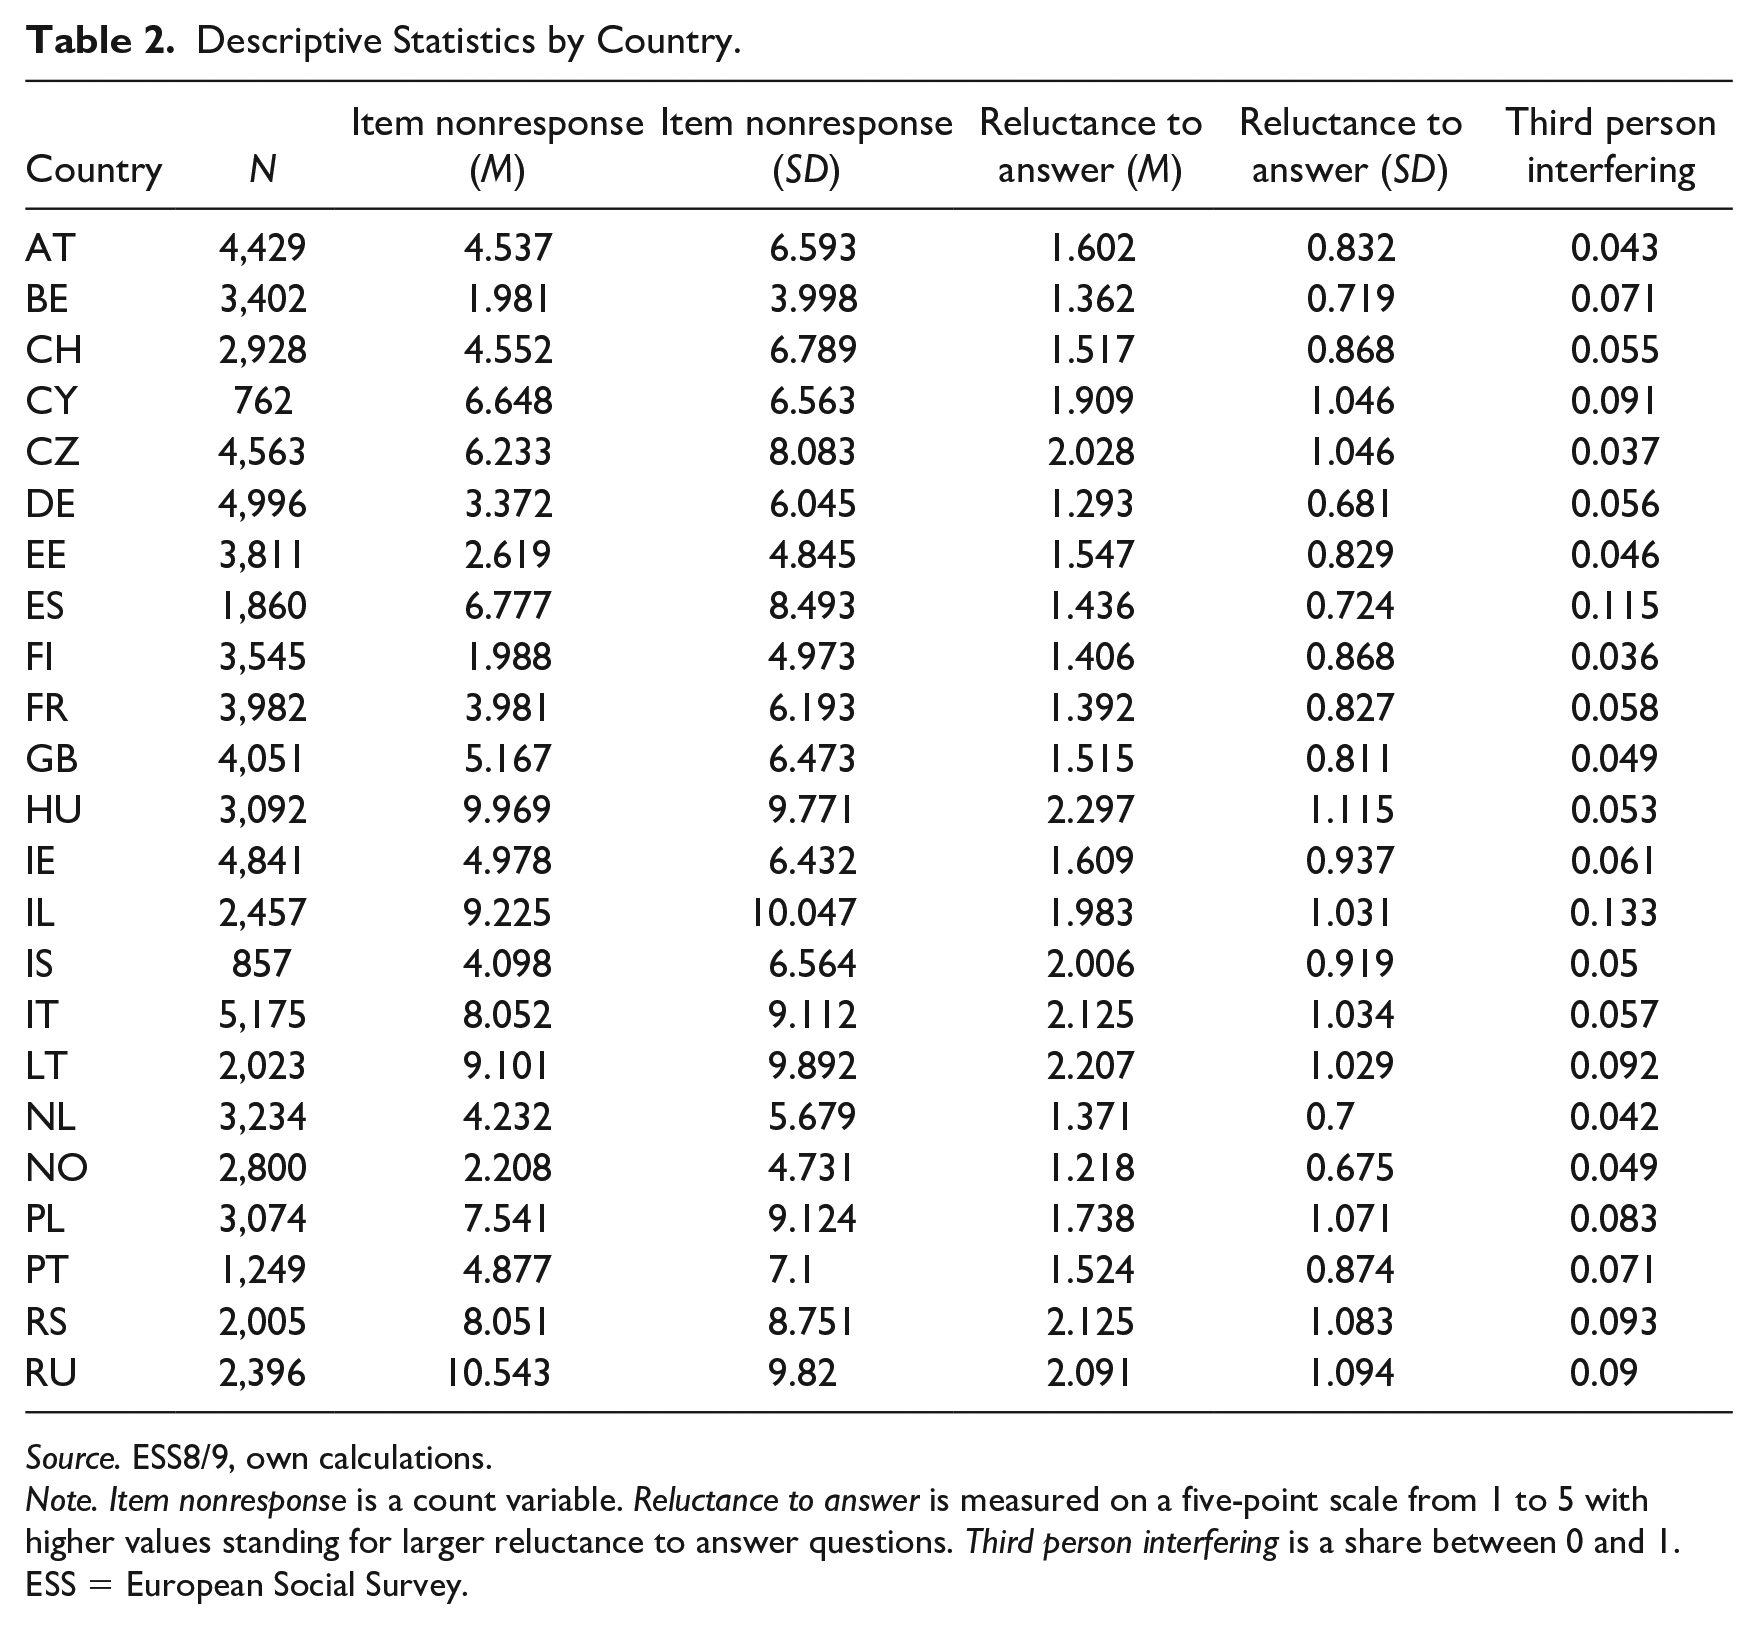
Source. ESS8/9, own calculations.
Note. Item nonresponse is a count variable. Reluctance to answer is measured on a five-point scale from 1 to 5 with higher values standing for larger reluctance to answer questions. Third person interfering is a share between 0 and 1. ESS = European Social Survey.
Correlation Matrix for All Three Dependent Variables.
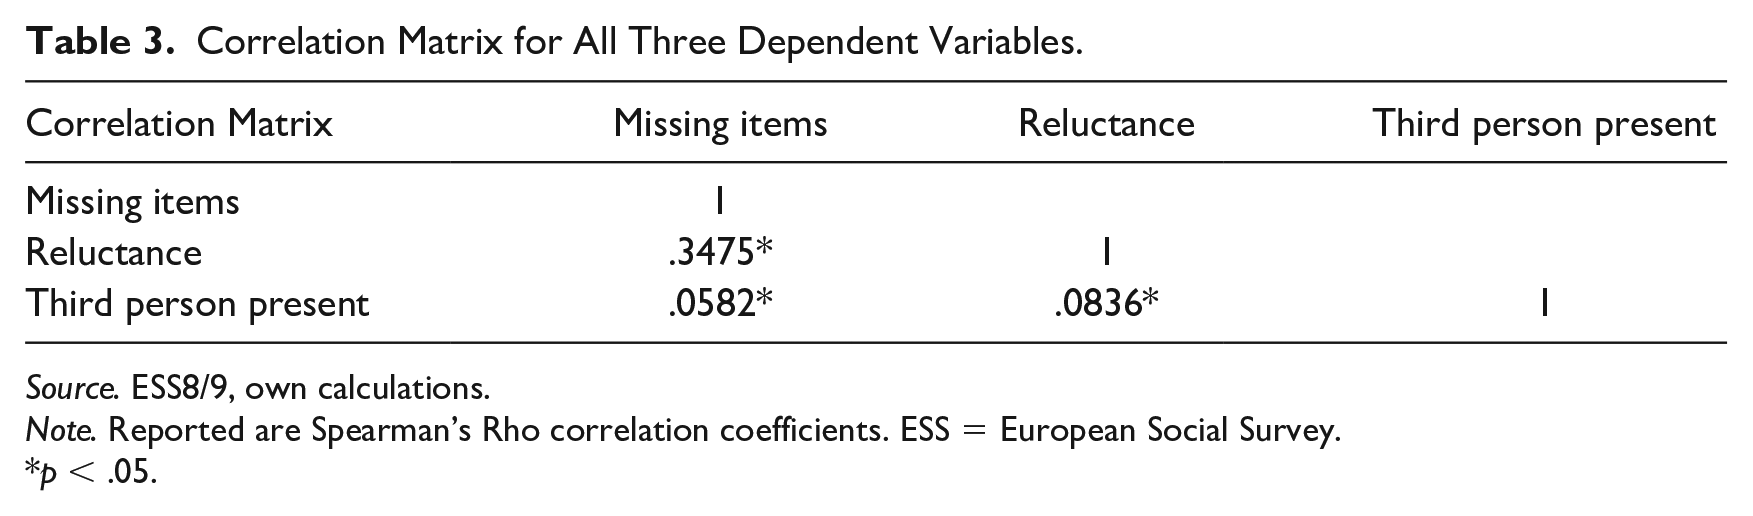
Source. ESS8/9, own calculations.
Note. Reported are Spearman’s Rho correlation coefficients. ESS = European Social Survey.
p < .05.
To investigate which items are the most sensitive and have the highest amount of invalid responses (counting “Refusal,” “Don’t know,” and “No answer” as item nonresponse), the percentage of missing values is computed. The top three in the ESS are “Total household net income” with 18-percent missing values, “Placement on left right scale” with 12-percent missing values, and “Father: highest level of education” with 9-percent missing values.” This demonstrates that in the ESS, some question about finances, political orientation, or social background can be regarded as especially sensitive.
In summary, listed outcomes are chosen because they might be the best indicators in the data to measure survey quality. The number of missing items corresponds to survey quality as missing items lower the power of any analysis. Reluctance seems appropriate to measure the atmosphere of the interview situation, which might not only affect interview quality but also the propensity to participate in follow-up studies. Including a variable that measures inference by third adults seems relevant, given the fact that presence of third persons can influence data quality negatively (Mneimneh et al. 2015).
Modeling Approach
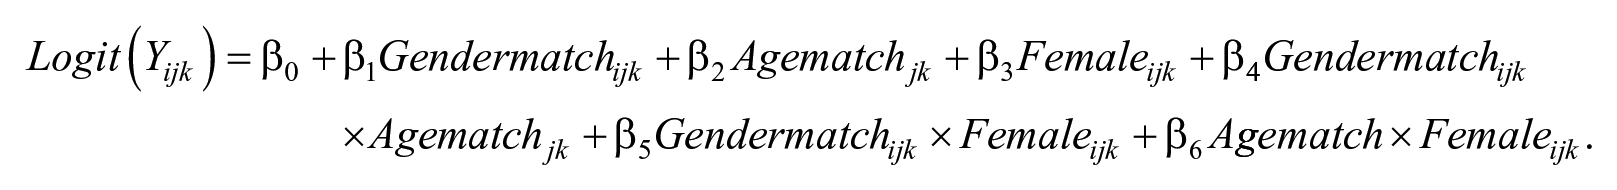
As multilevel data are available, three-level random intercept models will be used. Respondents (Level 1) are nested within interviewers (Level 2), which are nested within countries (Level 3). This approach using random intercepts for interviewers and countries allows accounting for idiosyncratic differences between Level 2 and 3 variables. 2 As the propensity to answer a question may be culturally determined, country differences are taken into account by this design. Furthermore, one would expect differences between interviewers, for example, with respect to work experience, charisma, or openness (West and Blom 2017). By allowing the intercepts to vary, standard errors of variables of interest are estimated correctly. Determined by the scaling of the dependent variables, three different models will be estimated. The first dependent variable, amount of missing items (item nonresponse), is a count variable; therefore, a nonlinear model will be used. As the descriptive statistics suggested conditional overdispersion, we decided to use a multilevel negative binomial regression instead of a multilevel Poisson regression. The statistics shown below underline that this is actually the case and a negative binomial model should be preferred. For the second dependent variable, reluctance to answer questions, a multilevel linear model is estimated. Albeit this variable is being ordinally scaled, this leaves many obstacles for estimation and especially interpretation. Consequently, we decided to use the simpler linear models and compute robustness checks using the ordinal model. However, the differences are minor and the linear model gives good approximation of results. Finally, as the last dependent variable, the probability that a third person is interfering with the interview, is binary, a multilevel logistic regression will be estimated.
The models are built as following: The baseline model (“Empty”) does not include any explanatory variables, only the dependent variable and the multilevel structure. The second model (“Main”) includes gender of respondent, the age match variable, the gender match variable, and all pairwise interactions. The final model (“Full”) adds all control variables. Based on theoretical considerations, we decided to add the following controls to account for the fact that respondent-interviewer matching might not be absolutely at random: the educational level of the respondent (International Standard Classification of Education [ISCED]), average regional household income, age of respondent, age squared, number of household members, whether any children live in the household, the marital status of the respondent, and a fixed-effect for the survey round (ESS 8 or 9). Another advantage of adding these variables is that predicted outcomes are more realistic and also account for country differences with respect to age structure or average educational attainment (Colsher and Wallace 1989; De Leeuw, Hox, and Huisman 2003). All calculations are done in Stata 16.1 (commands menbreg, mixed, and melogit) using 10 integration points. 3 The covariance structure for all three models is set to “unstructured,” meaning that all variances and covariances for all levels will be estimated distinctly, which seems most appropriate for the data available as no artificial constraints are introduced. Intraclass correlation coefficients (ICC) were computed for all models where this is possible after the estimation to explain the partition of variance. The regression equation for the second model (“Main”) for the binary logistic model is as follows:
Results
Item Nonresponse
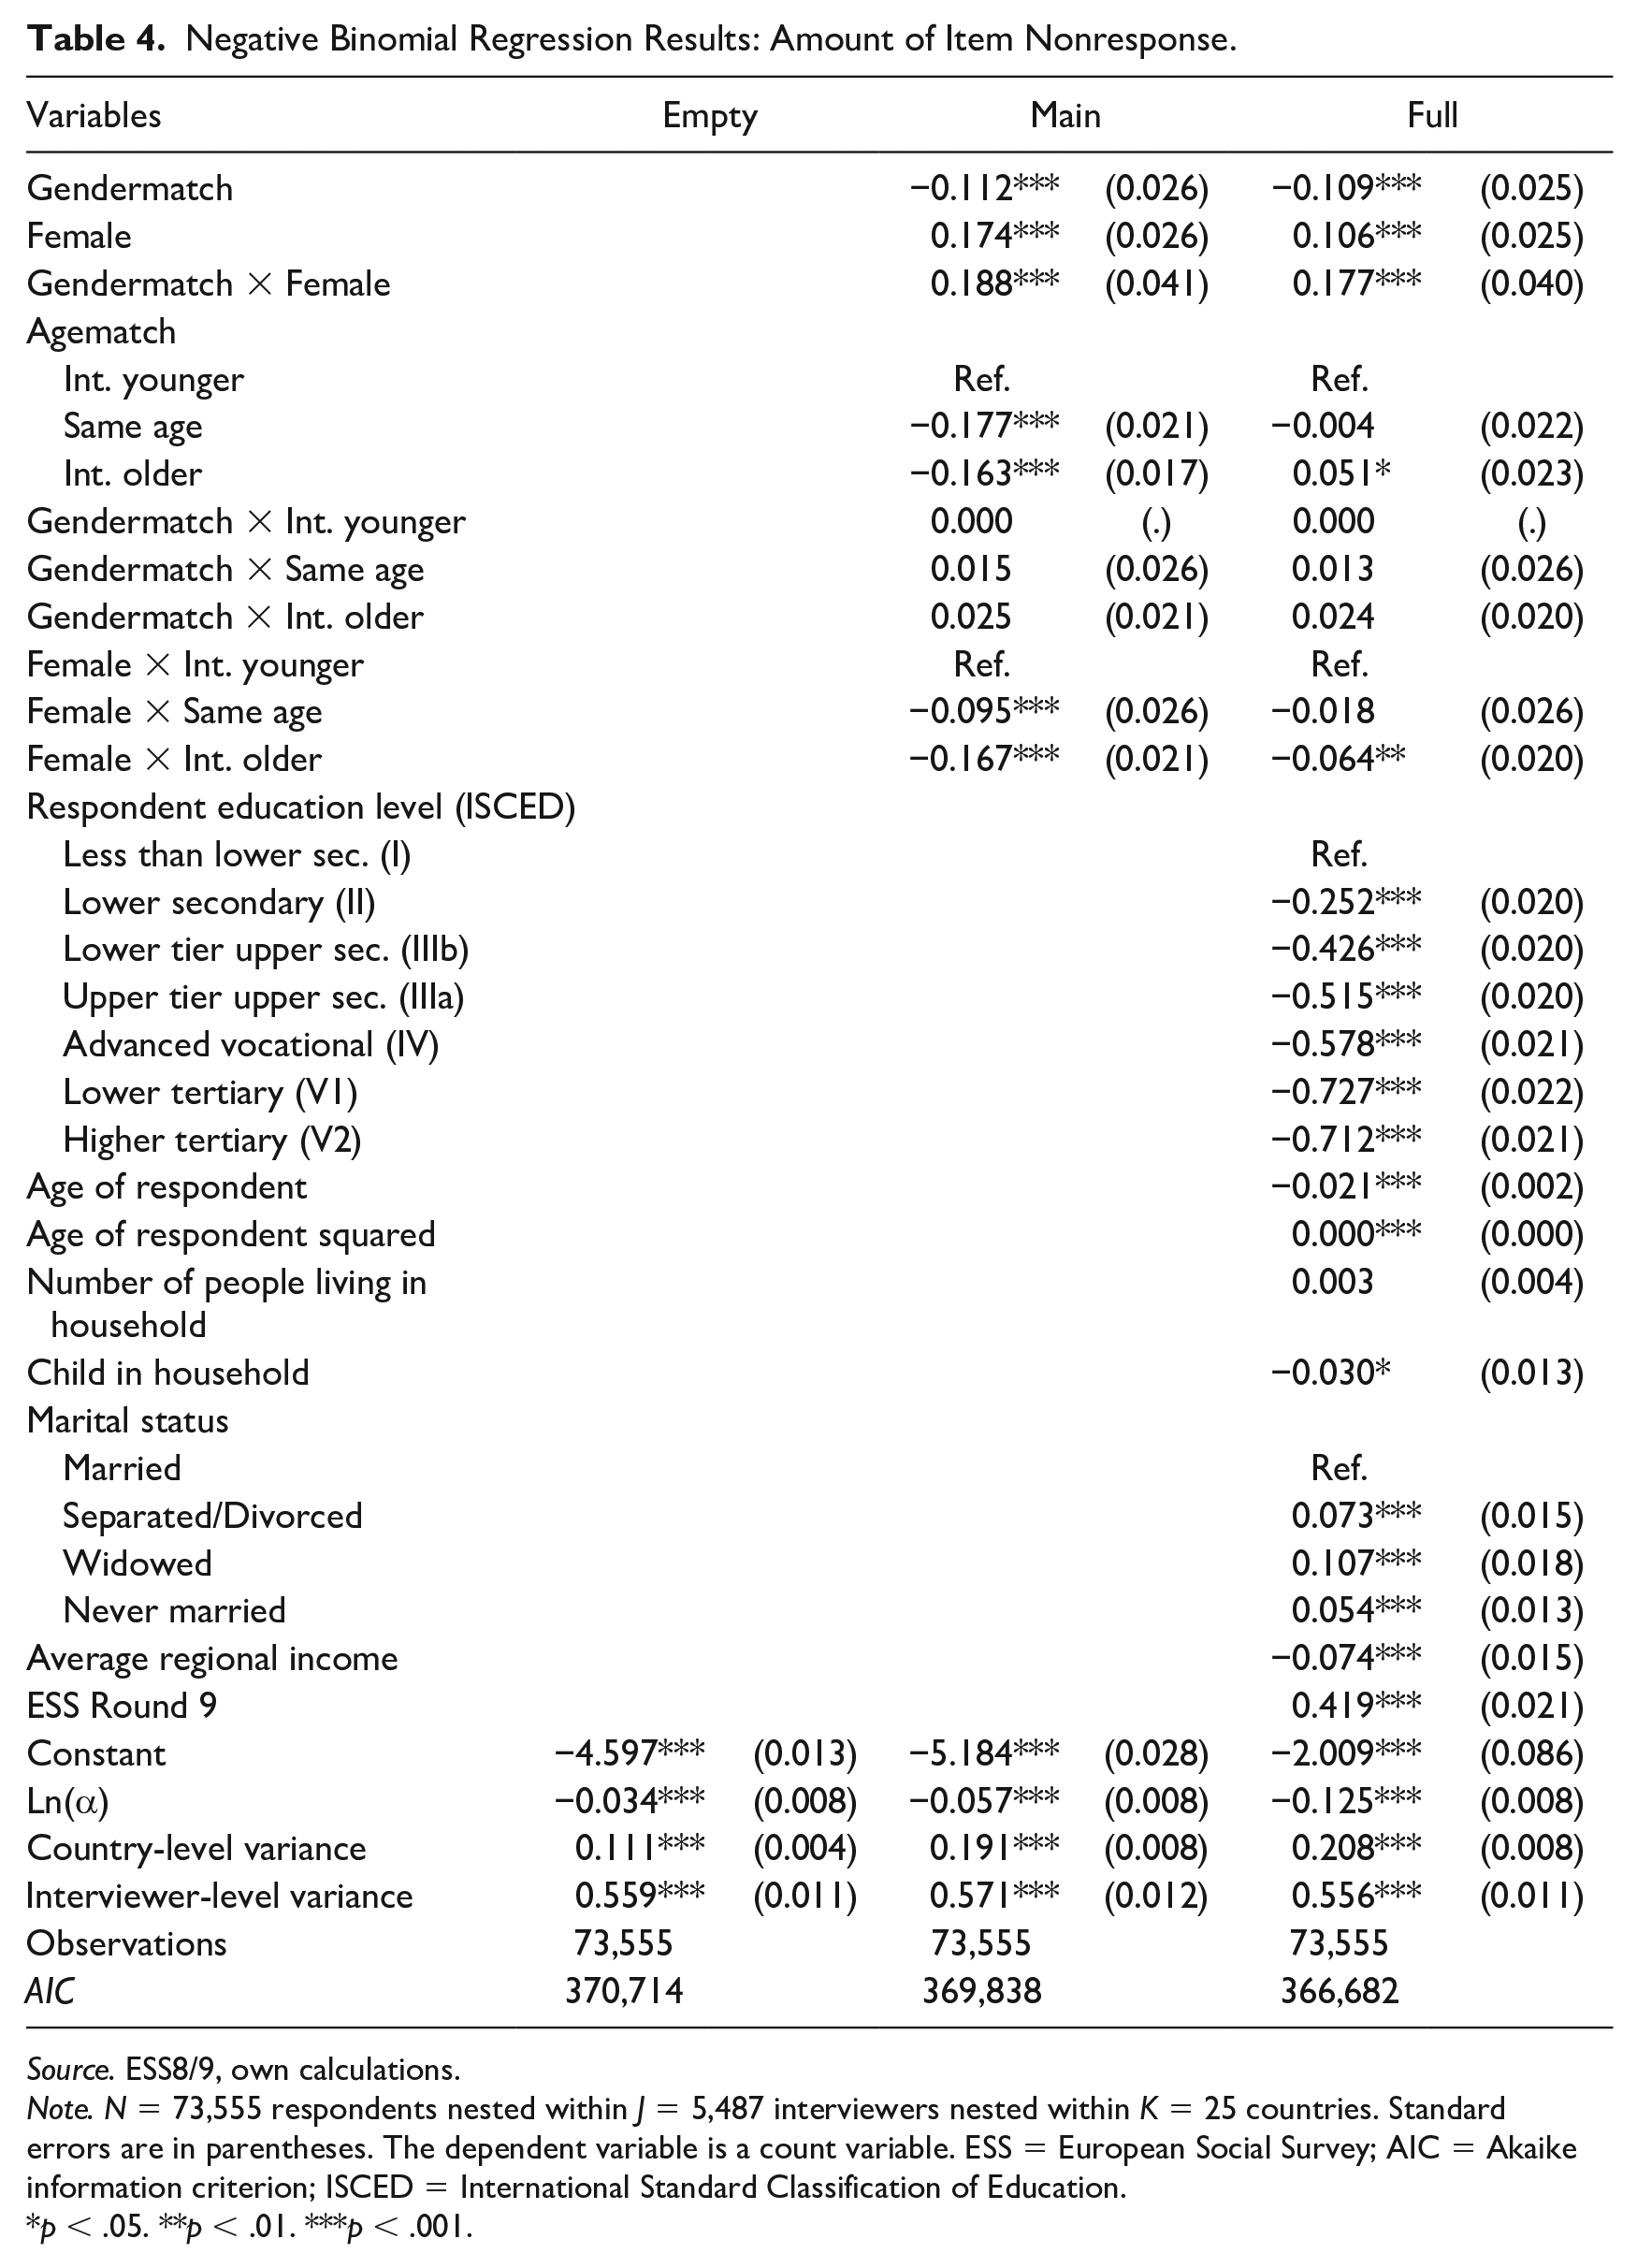
The first analyses consider item nonresponse. The stepwise model building clearly shows that adding the main variables of interest, which are the matching variables and the interactions, significantly improves the model. After adding the controls, it is evident that not only do these additional variables have a large explanatory power but also the effects of the main variables become slightly smaller, yet stay significant in most cases. This underlines that the matching between interviewers and respondent might not be perfectly random, yet the remaining explanatory power is still significant. Additionally, it should be noted that every single model presented has a better statistical fit than the corresponding model without multilevel factors, which was to be expected, given the design of the survey. To ease interpretation in the presence of many interactions, average marginal effects are calculated for the full model, which has the highest predictive power with respect to the Akaike information criterion (AIC), which is lowest. Regression results are displayed in Table 4, average marginal effects of gender and age matching, based on the full model including all control variables, in Figure 1. As an example of how to interpret these figures, let us consider the left panel first which presents the findings for all male respondents. The effect is close to −2 in situations when the interviewer is younger than the respondent. Since the value is negative, we learn that male respondents who were interviewed by a male interviewer have on average two fewer item nonresponse (that means, they answer two items more) than male respondents interviewed by female interviewers. Based on this prediction, we can conclude that gender matching is beneficial for male respondents, regardless of the age matching. However, for female respondents, exactly the opposite is true. For them, gender matching does increase the amount of item nonresponse significantly, independent of age matching.
Negative Binomial Regression Results: Amount of Item Nonresponse.
Source. ESS8/9, own calculations.
Note. N = 73,555 respondents nested within J = 5,487 interviewers nested within K = 25 countries. Standard errors are in parentheses. The dependent variable is a count variable. ESS = European Social Survey; AIC = Akaike information criterion; ISCED = International Standard Classification of Education.
p < .05. **p < .01. ***p < .001.
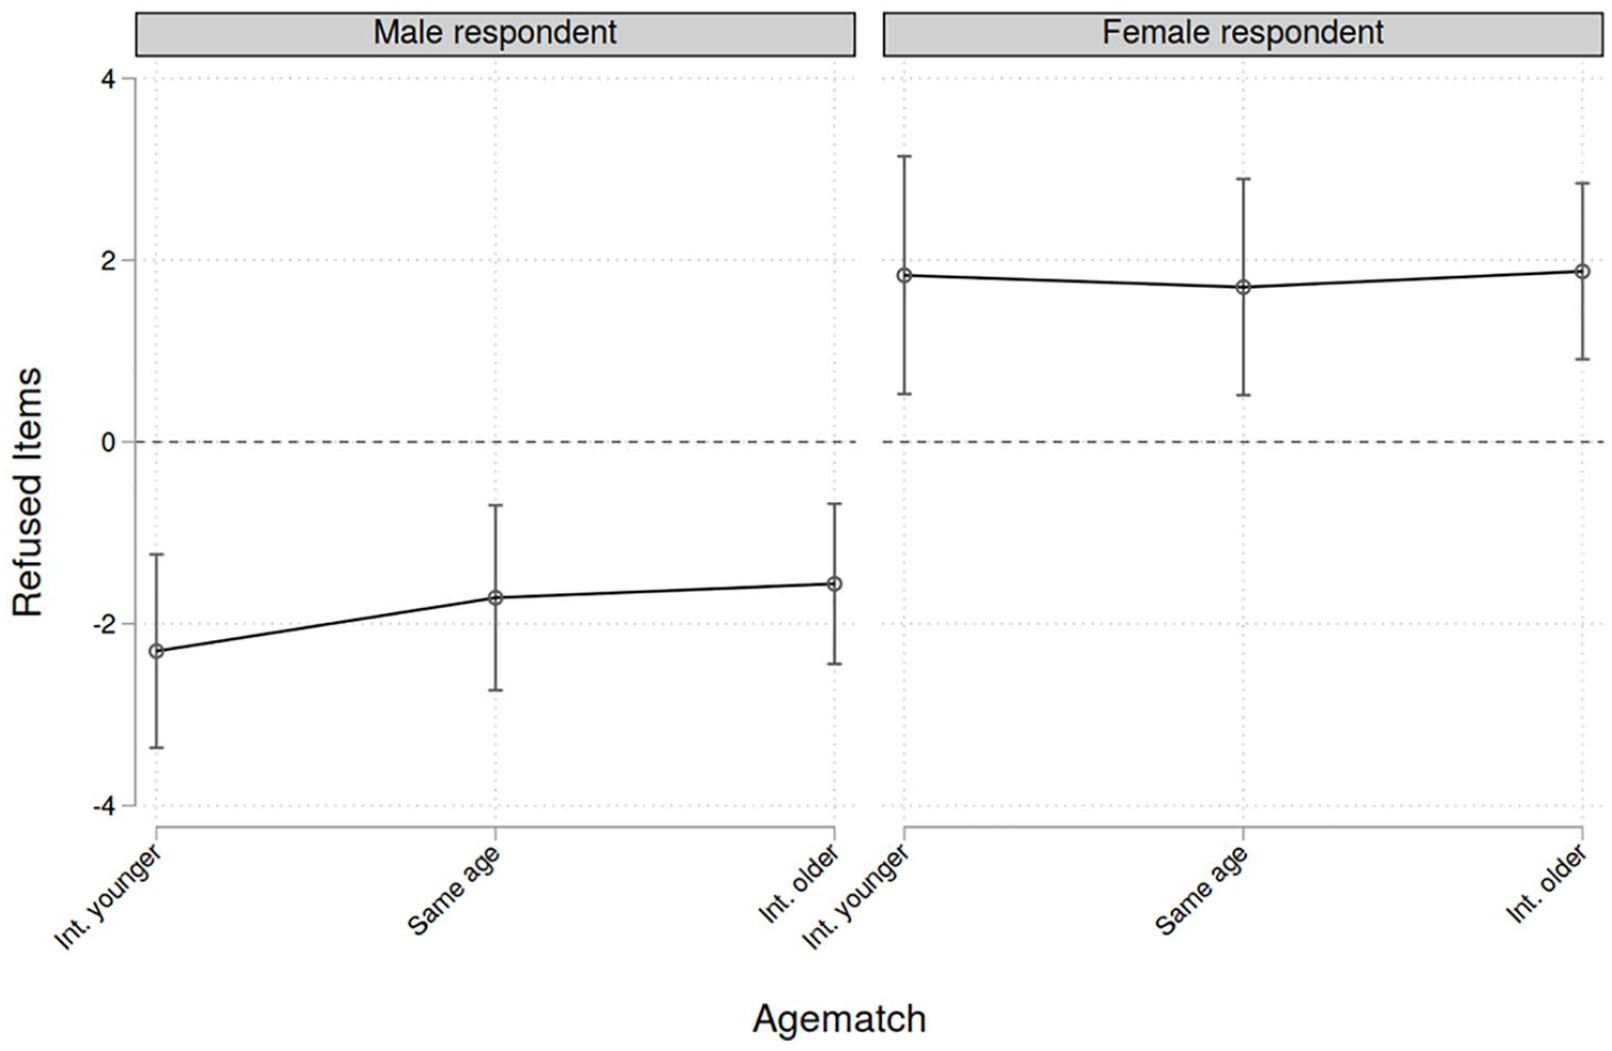
Average marginal effects of gender and age matching regarding amount of item nonresponse.
Reluctance to Answer
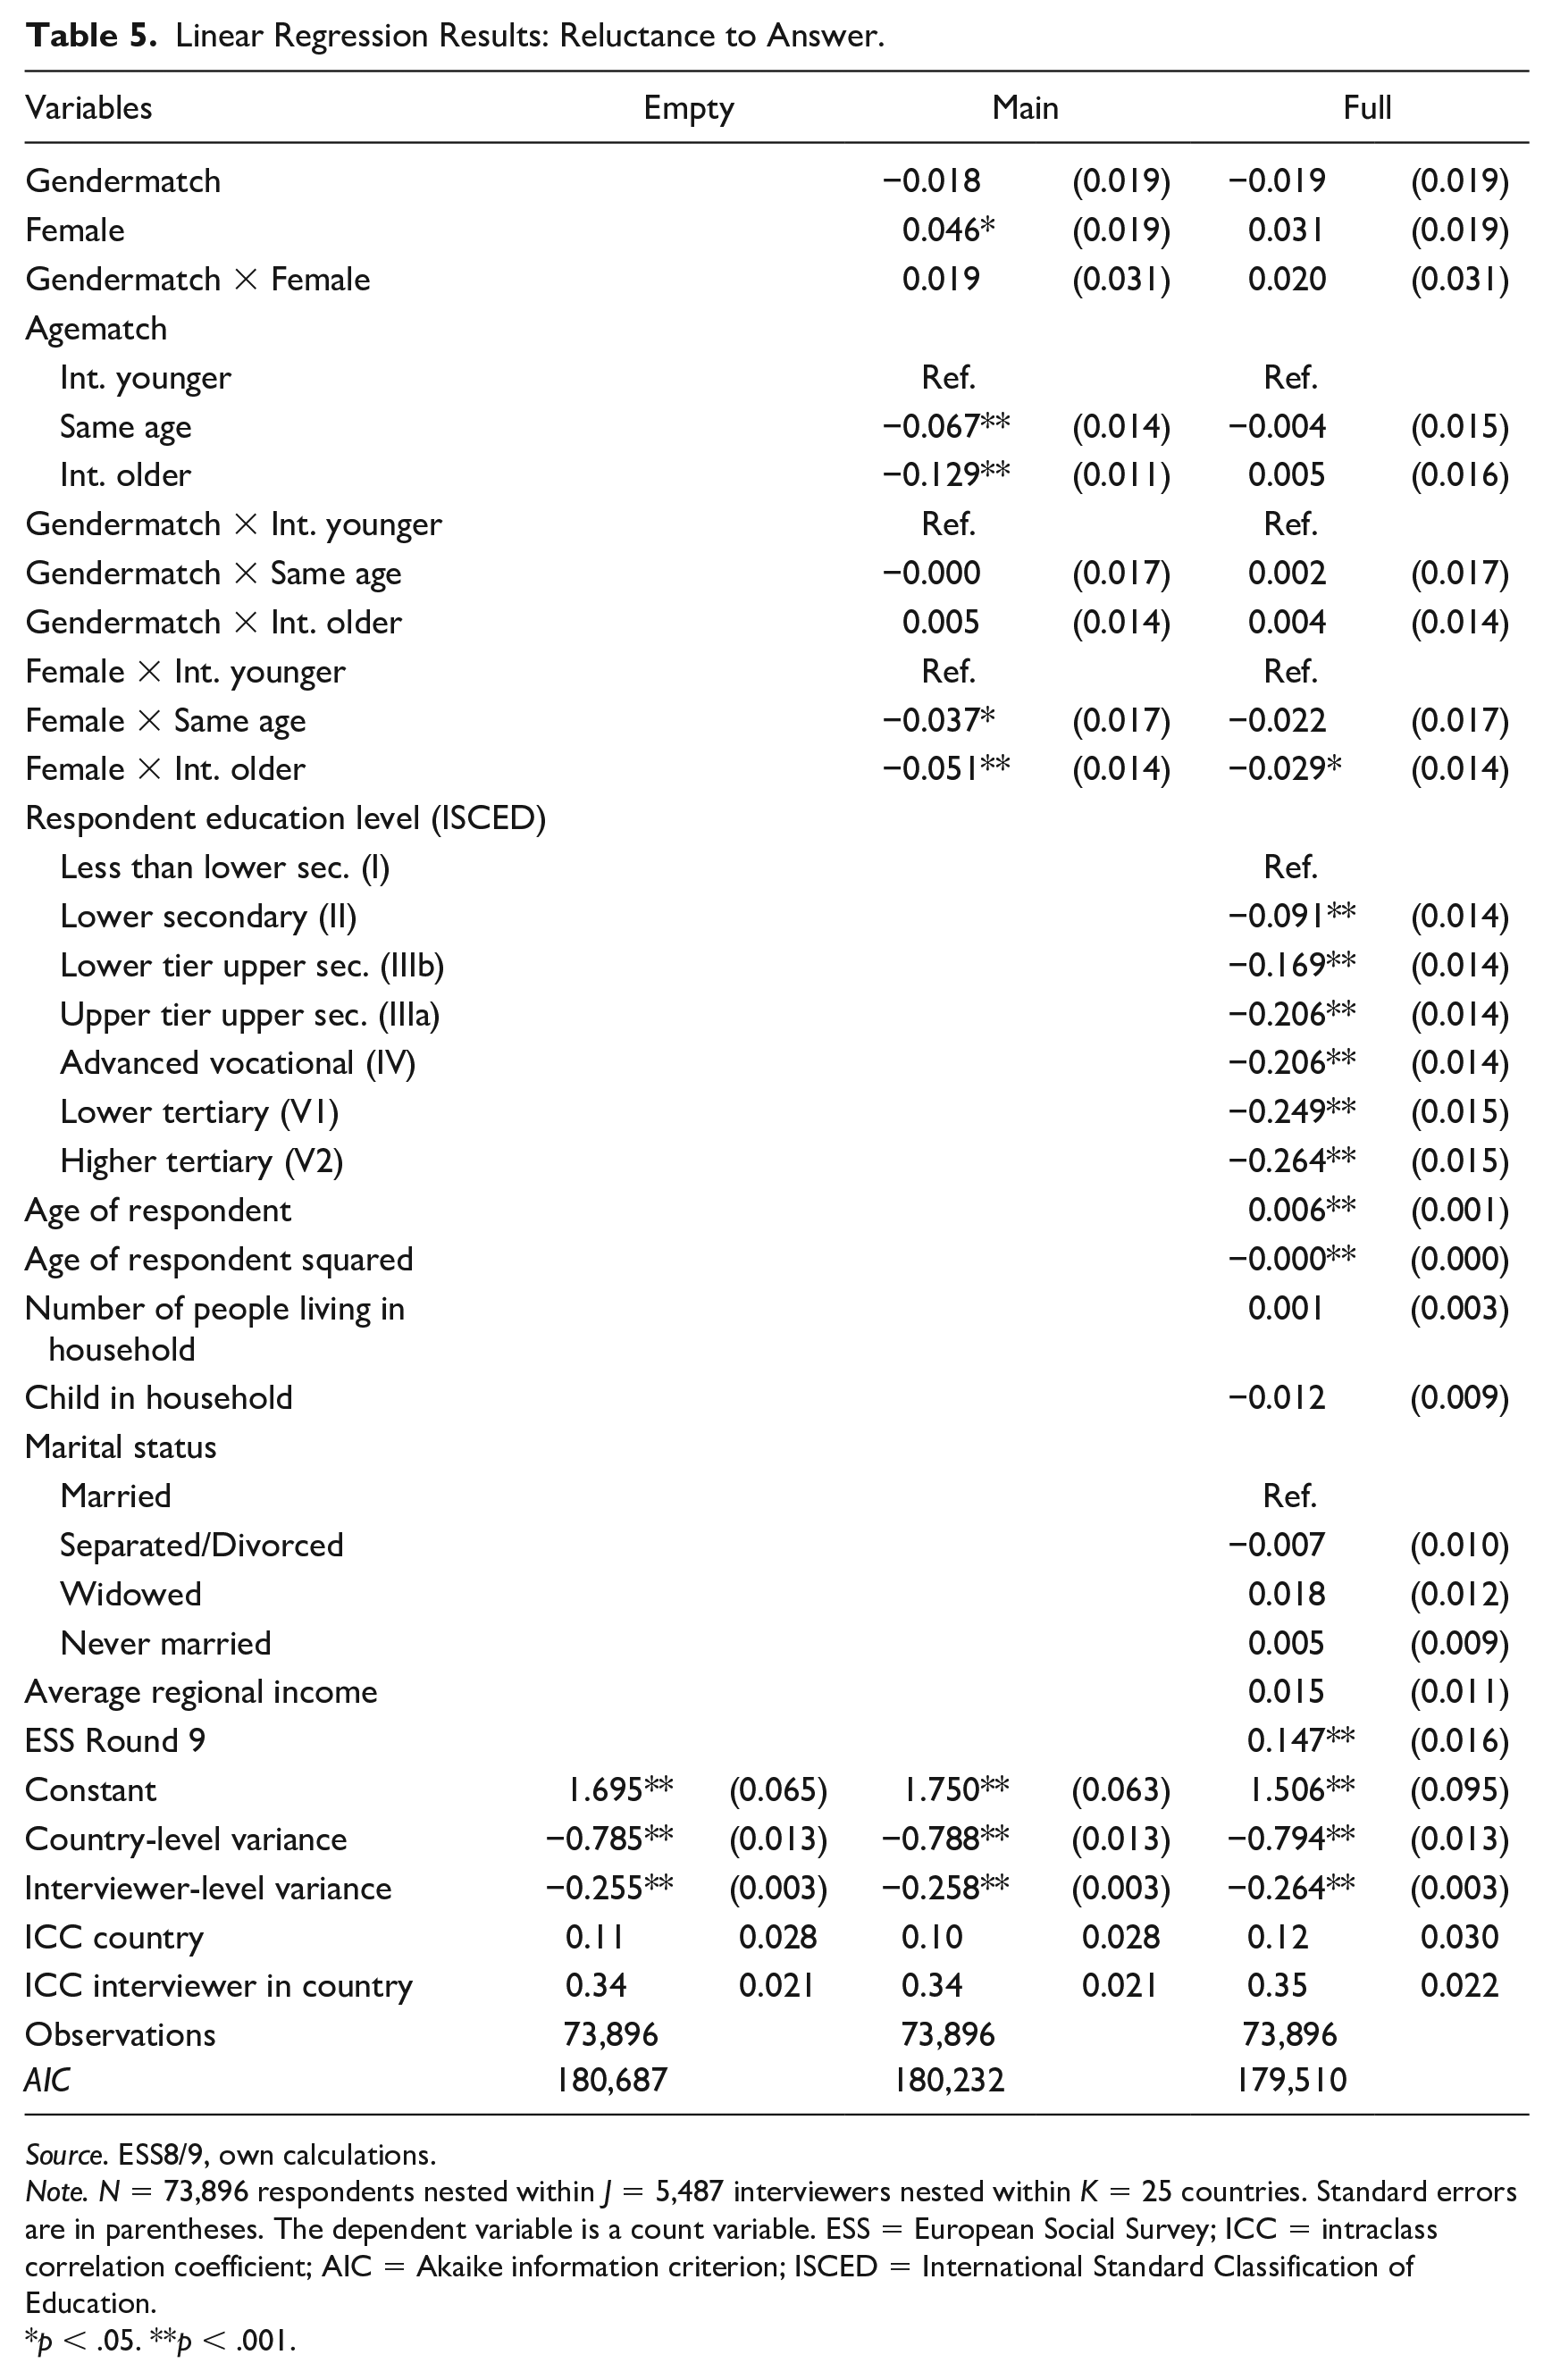
For the second outcome of interest, the reluctance to answer a question, linear multilevel models are specified. The models are built exactly as for the first outcome. The results are depicted in Table 5 and Figure 2. Clearly, neither for women nor for men is there any statistically significant effect. While some coefficients are statistically significant in the main model, these effects disappear after control variables are introduced. Consequently, we conclude that there is no effect of matching on the reluctance to answer questions as perceived by the interviewers. Regarding the partition of variance, it becomes clear that indeed a larger correlation is present at the interviewer level (.35). This is due to mostly two factors: First, interviewers differ in their abilities and experience, so some interviewers might be more talented to acquire responses, which causes this correlation. The second aspect is that interviewers are often assigned due to their geographical availability and the households they visit are often similar to each other on average. This can also explain the correlation since similar households might behave similarly. The ICC regarding the countries is smaller (.12); here, we would expect differences due to cultural and economic differences between countries.
Linear Regression Results: Reluctance to Answer.
Source. ESS8/9, own calculations.
Note. N = 73,896 respondents nested within J = 5,487 interviewers nested within K = 25 countries. Standard errors are in parentheses. The dependent variable is a count variable. ESS = European Social Survey; ICC = intraclass correlation coefficient; AIC = Akaike information criterion; ISCED = International Standard Classification of Education.
p < .05. **p < .001.
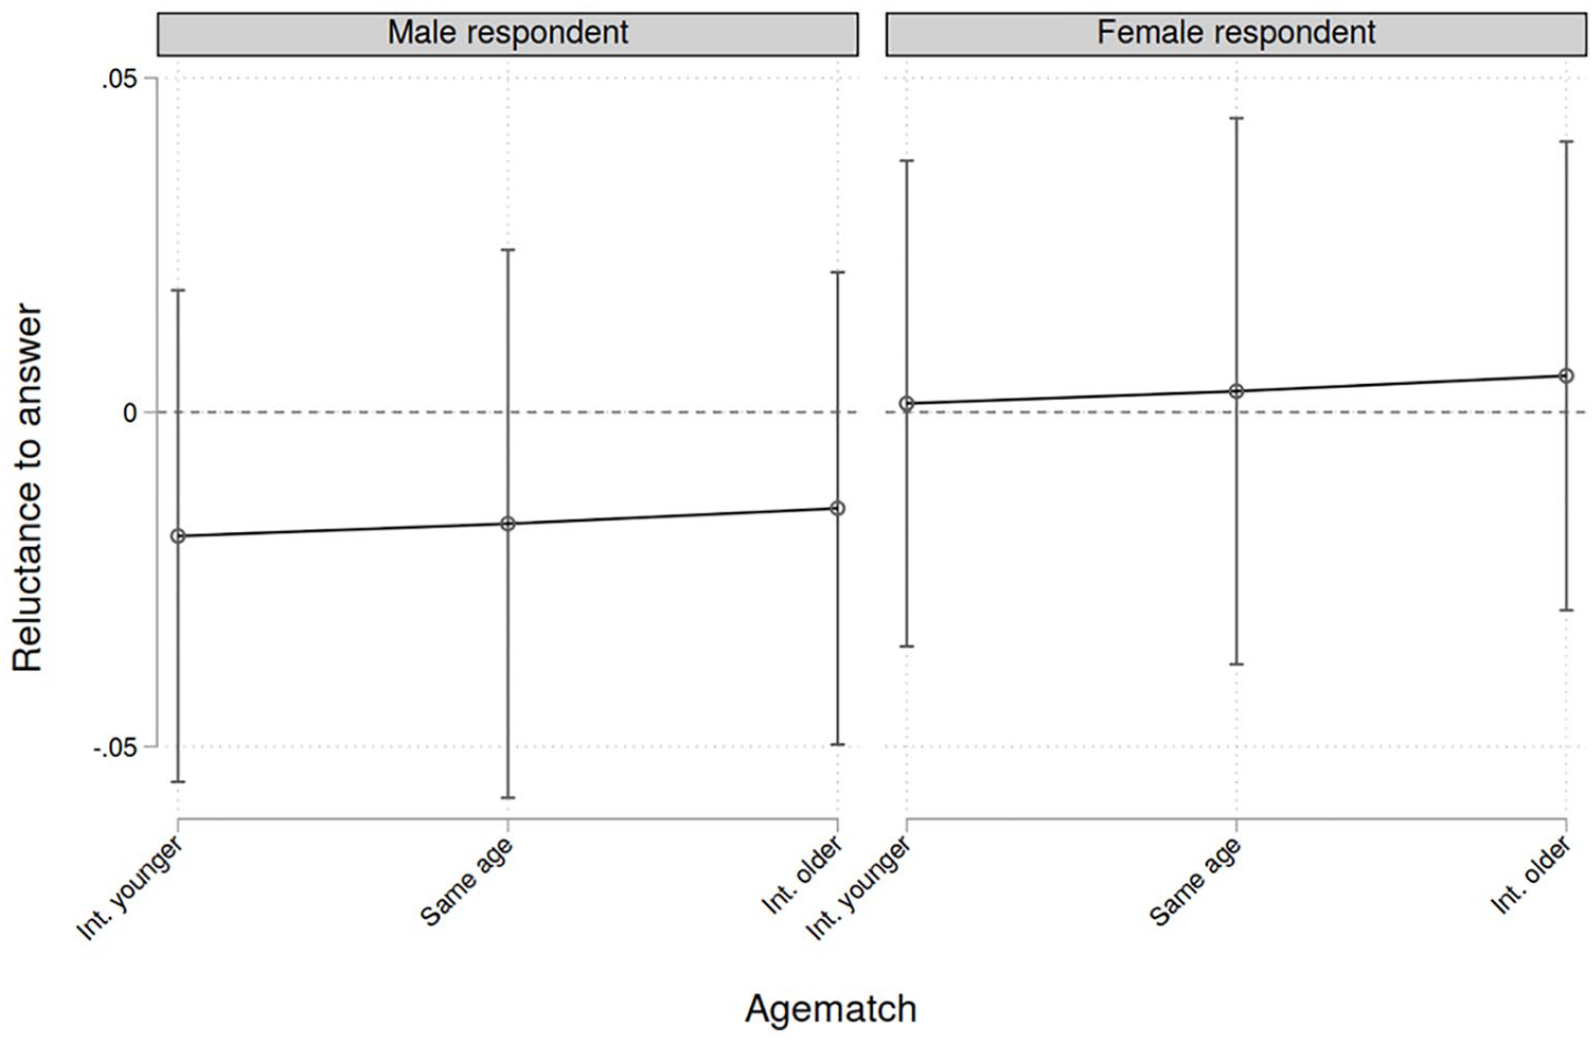
Average marginal effects of gender and age matching regarding the reluctance to answer.
Probability of a Third Person Interfering
The last outcome refers to the research question of whether a sociodemographic matching between respondents and interviewers influences the probability that a third person is interfering with the interview, which could affect the answers given by the respondent. A multilevel logistic regression is estimated. Results can be found in Table 6 (p. 15) and Figure 3. The predictions reveal that gender matching is beneficial for both men and women but only women have statistically significant effects. If they are matched with a female interviewer, the probability that another adult is being present at the interview reduces by about one percentage point. The effects are slightly weaker when the interviewer is younger than the respondent. Summarized, gender matching is beneficial for this aspect of the survey setting. Regarding the ICC, the outcomes are similar to the reluctance models. The only major difference is that the correlation is much lower at the country level, indicating that there are smaller differences between countries when it comes to the interference of a third person at the interview.
Logistic Regression Results: Adult Third Persons Interfering.
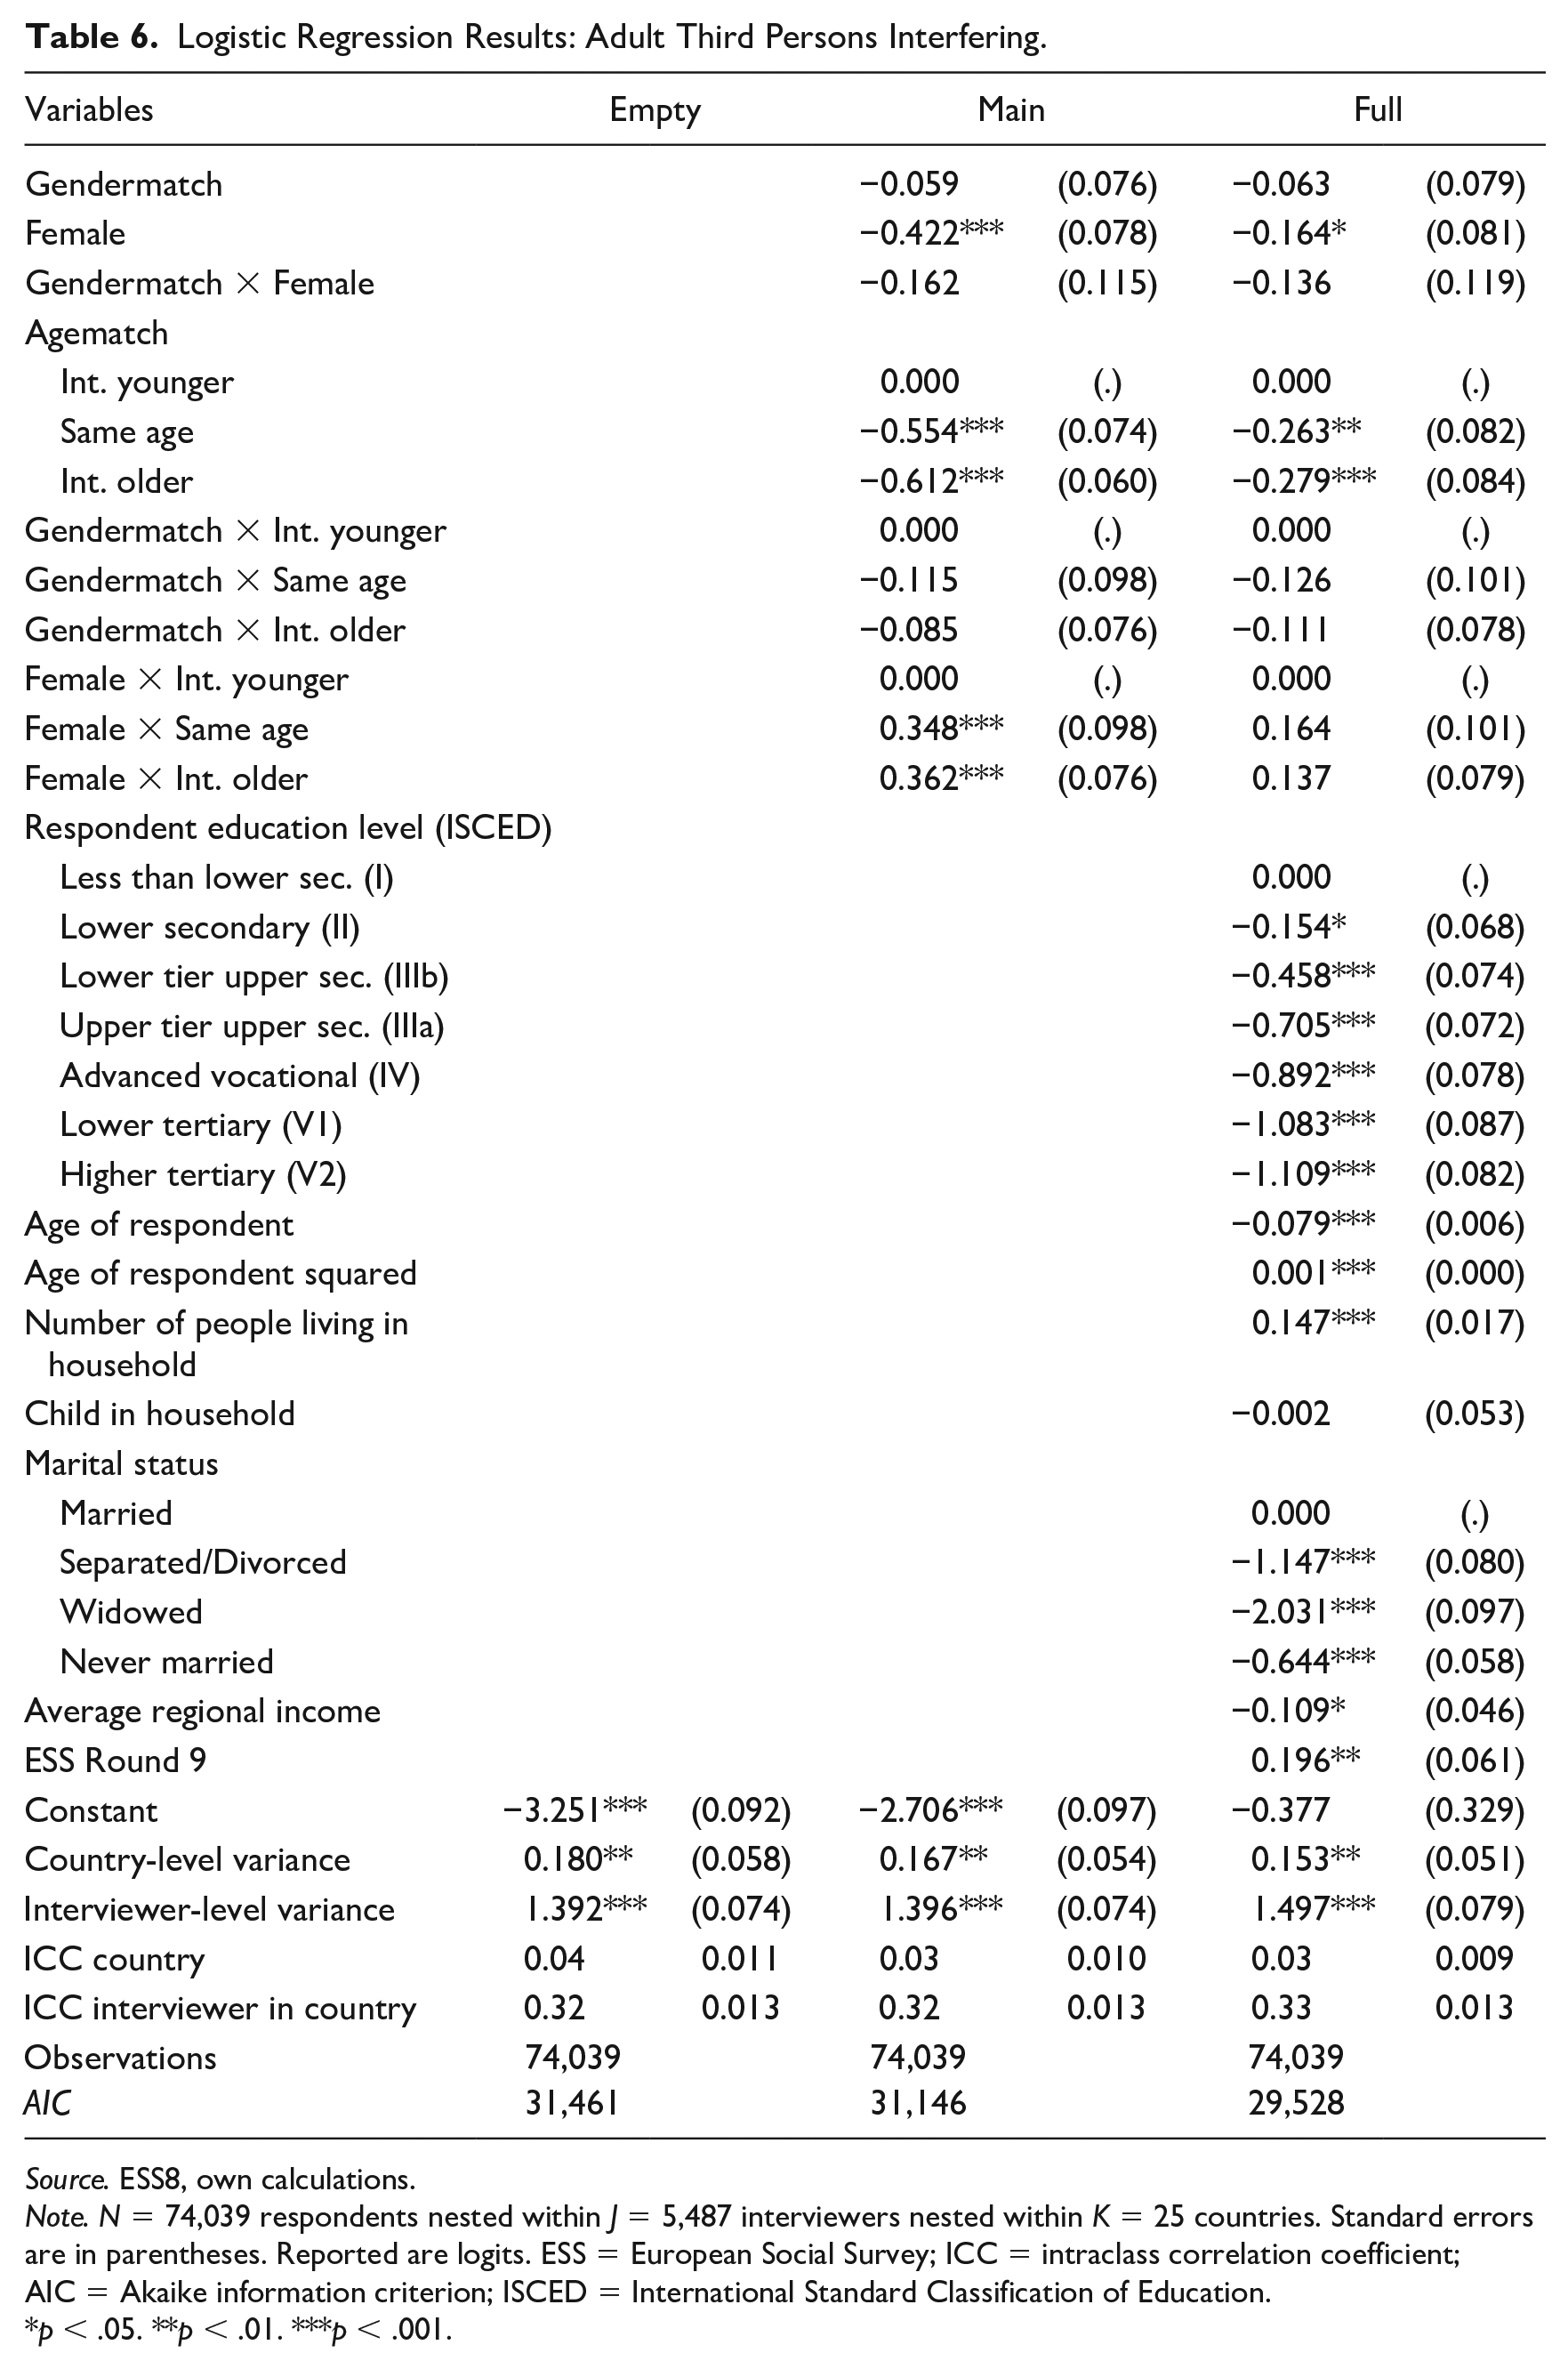
Source. ESS8, own calculations.
Note. N = 74,039 respondents nested within J = 5,487 interviewers nested within K = 25 countries. Standard errors are in parentheses. Reported are logits. ESS = European Social Survey; ICC = intraclass correlation coefficient; AIC = Akaike information criterion; ISCED = International Standard Classification of Education.
p < .05. **p < .01. ***p < .001.
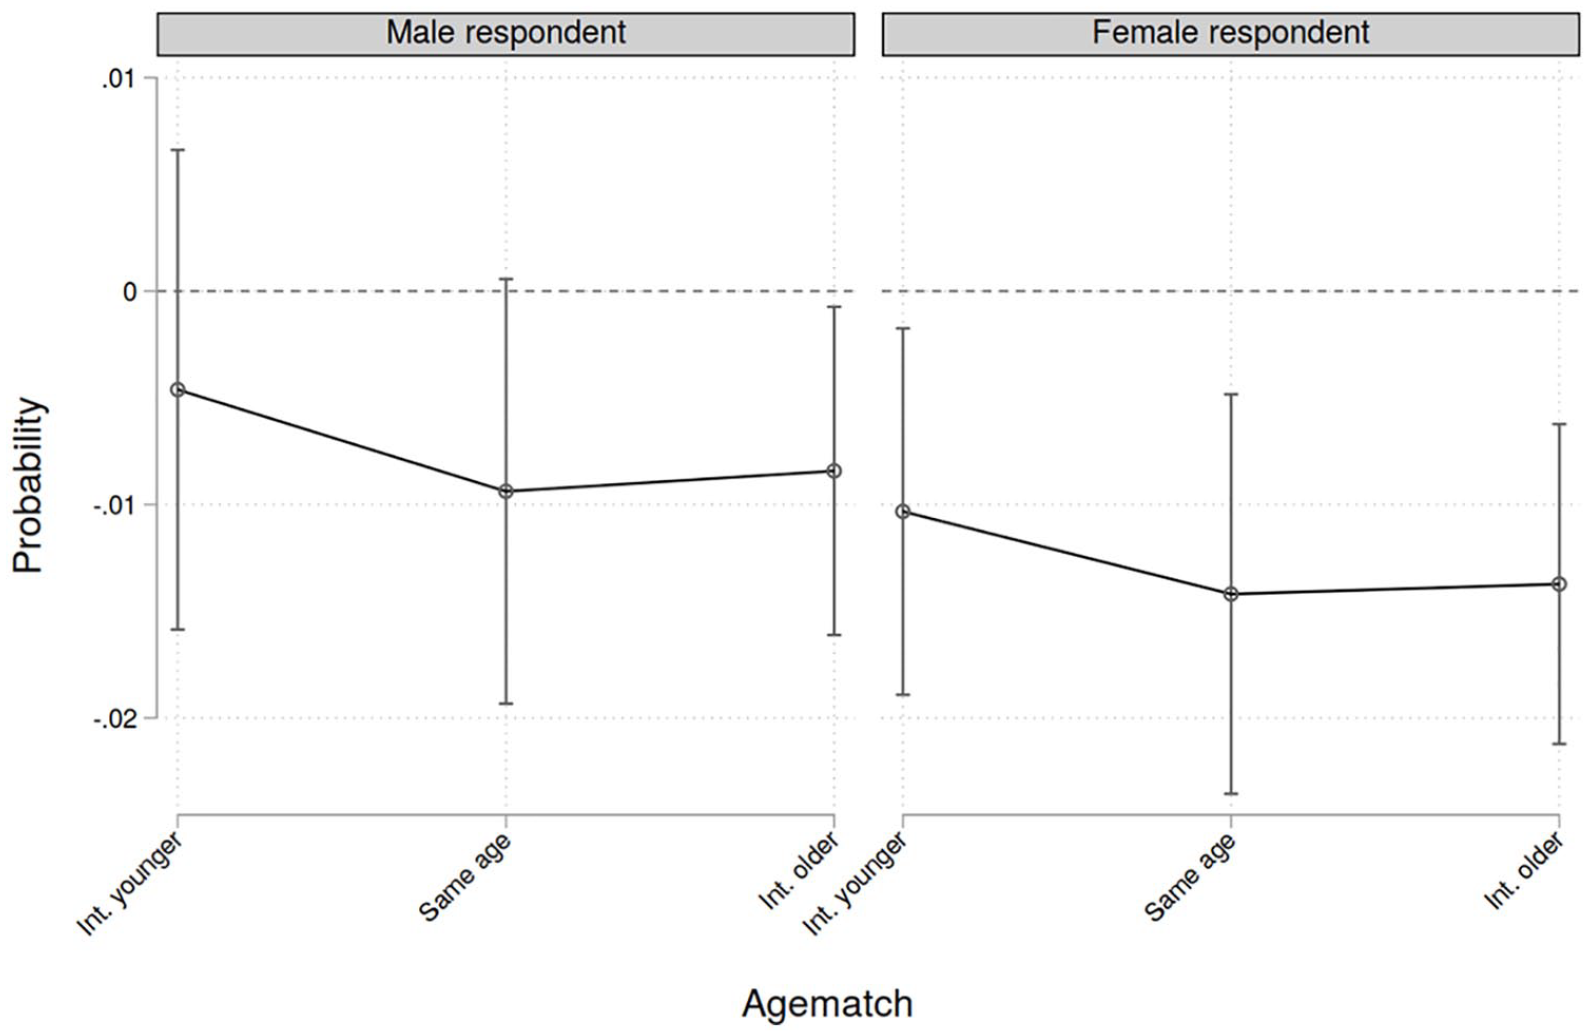
Average marginal effects of gender and age matching regarding the probability that another adult is present.
Discussion
The present study adds to the literature on the effects of sociodemographic matching between survey respondents and interviewers. The first outcome to be considered is the amount of item nonresponse in a face-to-face interview. Multilevel negative binomial regressions demonstrate that some pairings actually increase the amount of missing items and females have, on average, more missing items than men. This indicates that women in general tend to refuse more questions than men, independently of the characteristics of the interviewer. Second, a gender match increases the number of refused items for women, while the opposite is the case for men. This corroborates the findings of Vercruyssen et al. (2017:9), who use the same data set but restrict it to the Belgian subsample. By using information about all countries, it can be demonstrated that the effect is stable and generalizable to a much wider population. The empirical results do not support the theory of liking, as a gender match does not always improve results. Considering age matching, effects are very small. To sum up, Hypothesis 1 is rejected for female respondents, while it seems correct for male respondents.
The second dependent variable of interest is the reluctance to answer questions in an interview. The results indicate that there is no effect at all regarding age or gender matching. Consequently, Hypothesis 2 is rejected as there is no empirical support. The stability of the results is tested using an ordinal logistic regression instead of a linear one, which does not change the findings. The results seem to be rather stable.
The last outcome variable is the probability that a third person is interfering with the interview. As especially women have significantly higher probabilities when gender is mismatched, this would support the theory of liking. For men, there are only small effects. These results are approximately in line with the theory of liking that predicts more similar interviewers produce better results and less interference. Hypothesis 3 is therefore accepted. However, this only refers to matching gender since there are only very little effects for matching age groups.
Ultimately, the question arises why the theory of liking mostly fails in the current analyses. Since the sample size is very large, many different social and cultural settings are included, and relevant control variables are available, the data quality is probably not the source of the null findings (however, some caveats are discussed further below). Possibly, the definition of “match” is too crude in the given operationalization. While gender is surely an important aspect of similarity, gender alone will only capture a tiny effect of the overall sociodemographic similarity. Including age in this definition will surely increase precision and allows a better matching but is still probably not very precise as other main factors like educational level, intelligence, migration status, race, political views, health status, or marriage are disregarded, to name only a few. To test this in more detail, studies must be conducted that provide more details about the interviewers since these usually do not answer detail questionnaires. However, the practical implications of this finding must also be regarded since it is probably not practical to match respondents and interviewers perfectly with respect to a large number of dimensions. A second major aspect to consider is the content of the items. As the literature review reveals, matching effects are especially large when gender-related topics are included, for example, items about the societal roles of males and females or views on gender egalitarianism. As the ESS 8 and 9 include almost no such items, this might affect the outcomes and underestimate the influence of gender matching. It is conceivable that results might be much more pronounced when sensitive items about gender-related topics itself are asked. Further studies should attempt to look more into this issue.
Limitations
The main shortcoming of the design is that it cannot be guaranteed that respondents and interviewers are originally matched at random. This is because the design is not interpenetrated and, additionally, there might be selective refusal rates based on the originally assigned interviewer. This issue implies that potential interviews with the most extreme outcomes (i.e., largest amount of item nonresponse and most reluctance to answer) were never conducted since the respondents refused any questioning altogether. If we assume that this decision to participate is based on some characteristics of matching, this means that the effects reported in this study are conservative since these extreme outcomes were never realized. Unfortunately, there is no simple solution for this problem; it is clearly not possible to enforce participation, yet by applying multilevel models and controlling for certain respondent characteristics, these obstacles should be attenuated. One should also consider that the ESS, despite these challenges, does provide excellent data for a large number of respondents with a large set of additional datasets, which makes this analysis possible in the first place. Previous research papers have successfully demonstrated that the ESS is suitable for posed research questions. A second limitation is the operationalization of age match as already discussed above. The cutoff point of five years is arbitrary and different values could be considered. It is unclear within which range respondents perceive an interviewer as their own age, which is further complicated by the fact that only factual age is considered in the study but not how old someone appears to be. Future studies might compare different ways of operationalization to test whether effects are stable. Finally, the question arises how these findings can be used to improve the survey process in future studies. Apparently, both men and women have lower item nonresponse when interviewed by men, which seems highly relevant for the data quality, as missing items are always a severe problem. However, stating that more male interviewers should be employed as to increase the number of retrieved items might be highly controversial at this point and would require more detailed investigations that are, optimally, based on experimental designs. Furthermore, there is contrary evidence from past research where respondents were more likely to answer sensitive questions by female interviewers (Heer and Passel 1987). The conclusion is that gender effects of interviewers are either quite volatile or depend on the type of questions asked. Since the number of sensitive questions is rather small in the ESS, the findings are probably not generalizable to other surveys with different topics of interest.
Conclusion and Practical Advice
The aim of the research was to investigate how sociodemographic matching between respondents and interviewers in face-to-face interviews affects data quality of the responses given. The analysis, which is based on multilevel data from 25 European countries, leads to the conclusion that some matches actually can improve data quality significantly (at least statistically). Gender matching does decrease the number of item nonresponse only for male respondents and even has a negative effect for female respondents. While there is no effect at all for the reluctance to answer questions, the effects regarding the presence of another adult are clear and highlight that gender matching does have small effects and benefits the survey settings since being alone with the respondent should be beneficial. Based on these findings, which stem from a very large and multinational European sample, giving practical advice is not straightforward. The first finding is that male interviewers seem to reduce the amount of item nonresponse for both male and female respondents, as men might probe more and longer if necessary when no clear answer is given. However, regarding the presence of other adults, a gender match is actually beneficial for the setting. Insofar, it appears that the practical advice should be not to overestimate the effects of gender matching. Effects are small and putting much effort into the matching does probably not yield large benefits. Especially regarding age match, which would be even more difficult to implement, there are basically no effects and any efforts might be wasted. However, it might be beneficial to implement a gender matching when the questionnaire contains many sensitive items and the presence of third persons should be minimized.
Future studies should build on these results and attempt to investigate causal mechanisms. Testing why the theory of liking fails in this context seems like a highly relevant starting point. Given that previous findings were also rather mixed, it might be beneficial to modify or even abandon this theory, at least for practical advice since only little positive findings are available. Second, modeling the process of self-selection into treatment, based on interviewer characteristics, would be another highly desirable area of research to understand whether interviewer characteristics influence the chance for unit nonresponse. Another outcome to consider are patterns of missing data in future research to better understand which questions are considered especially sensitive and how this relates to matching. As shown in the limitations, current evidence is mixed and no clear answers are possible at the moment. Furthermore, it could be interesting to put a focus on country differences and analyze whether the patterns found are the same in all European countries or whether there are significant differences. It might be that macroinfluences, like economic prosperity, type of social welfare systems, degree of multiculturalism, or other psychosocial factors, impact how respondents and interviewers interact. These aspects seem central as matching between respondents and interviewers could be a relatively simple yet promising technique to improve data quality, which should be essential for any survey research.
Footnotes
Acknowledgements
The author would like to thank Mark Trappmann, Viktoria Sophie Zorn, and the two anonymous reviewers for their helpful comments.
Declaration of Conflicting Interests
The author(s) declared no potential conflicts of interest with respect to the research, authorship, and/or publication of this article.
Funding
The author(s) received no financial support for the research, authorship, and/or publication of this article.