
Abstract
Objective
This study aimed to enhance the safety profile of Andrographolide Sulfonate Injection (ASI) by characterizing these impurities and supporting the refinement of quality control standards for andrographolide sulfonate (AS).
Methods
We employed a combination of UHPLC-QE-Orbitrap-MS for the tentative identification of related compounds and a proteomic approach for residual protein analysis. The protein analysis workflow involved extraction, quantification, tryptic digestion, desalting, and nanoLC-MS/MS analysis. The resulting MS data were searched against an Andrographis paniculata protein database using Peaks Studio software.
Results
Our analyses led to the putative identification of 27 related compounds. Furthermore, 12 residual proteins were newly identified, among which the protein A0A4Y5UXR9_ANDPA was found to be present at a significantly higher level than the others.
Conclusions
The findings provide critical data on the composition of AS, which is essential for advancing the quality control and ensuring the clinical safety of ASI. This study also offers a scientific basis for evaluating the necessity of ultrafiltration in its manufacturing process.
Introduction
Andrographis paniculata is a medicinal herb widely utilized in traditional Asian medical systems. Its active ingredient, andrographolide, exhibits significant anti-inflammatory,1,2 antibacterial, 3 and antipyretic properties. It has demonstrated therapeutic potential in the treatment of viral infections such as severe influenza 4 and dengue fever. 5 However, its extremely low water solubility (<0.01 mg/mL) results in limited systemic bio-availability, which significantly hinders its parenteral application. 6 To overcome this technological hurdle, researchers have successfully synthesized at least four highly water-soluble derivatives through derivatization of the compound using sulfuric acid, succinic acid, or sulfite. The corresponding injectable formulations have been approved for clinical use since 2002,7,8 such as andrographolide sulfonate (AS). 9 The solubility of this substance has been improved by more than 5000-fold,10,11 and it has been developed into andrographolide sulfonate injection (ASI), which meets the clinical requirements for emergency treatment of acute infections.12-14
Although ASI has clinical application value, its frequent hypersensitivity reactions, anaphylactic shock, and other adverse effects after administration have raised safety concerns.9,15 The sensitization mechanism of ASI involves multiple factors. First, AS is not a single compound but a heterogeneous mixture resulting from the non-selective electrophilic sulfonation of the conjugated diene and/or hydroxyl groups in the andrographolide molecule. The mixture is dominated by monosulfonated andrographolide and its positional isomers, together with residual unsulfonated variants. Trace amounts of hypersulfonated adducts and degradation products may also be present, depending on process and storage conditions. In this study, we focused on characterizing the major monosulfonates and their isomers—the primary active constituents—as well as the unsulfonated components, which may influence the stability and safety of the drug product. In the content determination of Supplemental Material S2, due to the limited availability of standards, the maximum content detected by mass spectrometry was andrographolide and its isomers. However, the publicly disclosed patent application documents indicate that the sulfonated component with the highest content is 17-hydro-9-dehydroandrographolide-19-yl sulfate, 16 which also exhibits the highest content when formulated into injections. Second, during the preparation of andrographolide through crude extraction-recrystallization processes, extracted plant macromolecules may persist in the active pharmaceutical ingredient (API) and its derivatized products, constituting potential immunogens.17,18 It has been confirmed that ppm level trace protein in drugs can cause immunoglobulin E (IgE) mediated hypersensitivity reactions, 19 but this risk remains unassessed in plant-derived small-molecule injections.
Current quality control methods for AS mainly rely on High Performance Liquid Chromatography-Ultraviolet Detection (HPLC-UV) to evaluate the purity. However, this method lacks sensitivity and specificity in analyzing the spectrum of complex organic impurities and detecting trace protein residues. In this study, a two-dimension integrated analysis technique was constructed to compensate for the defects: (1) Liquid phase tandem mass spectrometry (LC-MS/MS) was used to resolve complex organic impurities (such as sulfonated isomers) at high resolution. (2) The detection of plant-derived residual protein was based on proteomics. This platform can not only systematically clarify the potential risk factors of adverse reactions of ASI, but also establish a scientific framework for the ultrafiltration process and quality system of plant-derived injections under the Quality by Design (QbD) approach.
A two-module integrated technology system was used to characterize the composition of AS. The organic impurity identification module separated the sample into eight continuous flow fractions by preparation-stage liquid chromatography, followed by high-resolution LC-MS/MS independently scanning each fraction, and deduced the structure based on accurate molecular weight (mass error ≤5 ppm) and secondary characteristic fragment ions. The residual protein screening module was used to enrich macromolecules by 10 kDa membrane ultrafiltration, and followed by tryptic digestion and solid-phase extraction desalting for sample preparation. The peptide data were collected by nano LC-MS/MS. Finally, PEAKS Studio 8.5 was used to complete peptide assembly and match with UniProt Viridiplantae database, and the false positive rate (FDR <1%) was strictly controlled to ensure the reliability of protein identification.
Materials and Methods
Chemicals, Reagents and Materials
Three batches of AS (Batch No.: 191109, 200205, 210108) were synthesized in-house. Bovine serum albumin (BSA) was acquired from Beijing Solaibao Technology Co., Ltd. Protein assay dye concentrate reagents were obtained from Bio-Rad Laboratories. Sequencing-grade modified trypsin was procured from Thermo Fisher Scientific (USA). Ammonium bicarbonate (analytical grade) was supplied by Xilong Chemical Co., Ltd. (Shantou, China). Dithiothreitol (DTT), iodoacetamide (IAA), and urea were sourced from Sigma (USA). Sodium chloride (analytical grade) was purchased from Sinopharm Chemical Reagent Co., Ltd. Trichloroacetic acid (TCA) and acetone (analytical grade) were obtained from Shanghai Lingfeng Chemical Reagent Co., Ltd. Methanol (analytical grade) was provided by Guangdong Guanghua Sci-Tech Co., Ltd. Formic acid (FA) (LC-MS grade) was acquired from Fisher Chemical. Methanol and acetonitrile (HPLC grade) were procured from Tedia Company. MS-grade methanol and acetonitrile were purchased from Merck KGaA (Germany). Deionized water was obtained from Watsons Group.
Sample Preparation for Related Compounds
The preparative liquid chromatography (NU3000, Hanbang Technology, Hangzhou, China) was performed using a YMC-Pack ODS-A column (250 × 10 mm, 10 µm) with a mobile phase consisting of methanol (A) and water (B). The gradient elution program was set as follows: 0–60 min, 30%–95% A; 60–65 min, 95%–5% A; 65–70 min, 5%–5% A. The injection volume of AS solution (2 mg/ml) was 300 µL, the flow rate was 3.0 mL/min, and the detection wavelength was set at 225 nm. According to Figure 1, fractions 1 to 8 were collected sequentially based on their retention times. Each fraction was concentrated to dryness under reduced pressure and then reconstituted in 1 mL of distilled water. AS mainly contains multiple compounds with the characteristic five-membered ring of andrographolide, exhibiting significant absorption at around 225nm.
20
Since the fraction 9 has almost no chromatographic peaks, it was not collected. Preparation of liquid chromatography diagram
Sample Preparation for Residual Proteins
The test solution for the residual protein of AS was prepared using the method described in reference.17,21 Protein extraction was conducted as follows: approximately 0.7 g of each sample was homogenized in 1 mL of ice-cold distilled water. The homogenate was then precipitated with 5% (v/v) TCA overnight at 4 °C. After centrifugation at 12,000 × g for 15 min, the supernatant was discarded, and the pellet was washed twice with 300 µL of pre-chilled acetone (≥99.9%). The washed precipitate was dried under a fume hood using a stream of nitrogen and stored at −80 °C until further use.
Protein quantification was performed using the Bradford assay, with BSA as the standard. A series of BSA standard solutions (0.1, 0.2, 0.4, 0.5, and 0.8 mg/mL) were prepared. A working solution was prepared by combining 1 mL of dye stock solution with 4 mL of ultrapure water. Then, 200 µL of the working solution was mixed with 10 µL of either the BSA standard or sample by vortexing, followed by incubation at room temperature for 5 min. Subsequently, 200 µL of each mixture was transferred to a 96-well plate, and the absorbance was measured at 595 nm using a microplate reader. A standard curve was constructed by plotting protein concentration against absorbance, followed by linear regression analysis. The standard curve demonstrated a good linear relationship within the measured range (correlation coefficient r > 0.99). Protein concentrations of the samples were calculated based on the regression equation. All data are expressed as the mean of three independent experiments (RSD ≤ 1.0%).
For protein digestion, an aliquot containing 80 μL of each sample was mixed with 20 μL of buffer. 0.1 M DTT was added, and the mixture was incubated at 37 °C for 30 min. This was followed by the addition of 0.5 M IAA and incubation for 45 min at 37 °C in the dark. Then, 50 mM NH4HCO3 containing 1 mM CaCl2 was added. Trypsin was added at an enzyme-to-protein ratio of 1:50 (w/w) for overnight digestion at 37 °C. The digestion was stopped by adding FA to achieve a final concentration of 1%. The digest was subjected to ultrafiltration, and the filtrate was collected.
Desalination Process

UHPLC-QE-Orbitrap-MS Conditions for Determination of Related Compounds
Chromatographic separation was performed on ultrahigh-performance liquid chromatography (UHPLC, Thermo Fisher Unimate-3000) with a YMC-Pack ODS-A column (250 mm × 4.6 mm, 5 μm) maintained at 30 °C. The mobile phase comprised 0.1% FA in water (A) and acetonitrile (B), using the gradient program as followed: 70%–5% A at 0–30 min, 5% A at 30–35 min, 5%–70% A at 35–40 min, 70% A at 40–50 min. A constant flow rate of 1.0 mL/min was applied, and the injection volume was 5 μL. Detection was carried out using a diode-array detector (DAD) scanning wavelengths from 190 to 400 nm.
Mass spectrometric (Thermo Fisher Q Exactive Focus) analysis was conducted with a heated electrospray ionization (HESI) source operating in both positive and negative polarity switching mode. The spray voltages were set to 3.5 kV for positive mode and –3.2 kV for negative mode. Sheath gas and auxiliary gas flows were maintained at 45 and 10 arb. (L/min), respectively, while the ion transfer tube and auxiliary gas heater temperatures were held at 350 °C and 320 °C. Full-scan MS data were acquired over a mass range of m/z 100–1500 at a resolution of 70,000, with an automatic gain control (AGC) target of 1×10⁶ and a maximum injection time of 100 ms. Data-dependent MS2 (dd-MS2) scans were performed at a resolution of 17,500, using a normalized collision energy (NCE) stepped from 15 to 35%, an AGC target of 1×10⁵, and a maximum injection time of 50 ms.
NanoLC-MS/MS Conditions for the Determination of Residual Proteins
Liquid chromatography-mass spectrometry analysis was conducted using a nanoflow UHPLC system (EASY-nLC II, Thermo Fisher Scientific, USA) coupled online to a Q Exactive Plus hybrid quadrupole-Orbitrap mass spectrometer (Thermo Fisher Scientific, USA). Chromatographic separation was achieved using a self-packed capillary column (75 μm × 150 mm; 3 μm particle size, 120 Å pore size) with a linear gradient elution over 120 min. The mobile phases consisted of 0.1% (v/v) FA (A) in water and 0.1% (v/v) FA in acetonitrile (B). The flow rate was maintained at 300 nL/min with an injection volume of 2 μL. The gradient program was set as follows: 5% B (0–2 min), 5–32% B (2–108 min), 32–45% B (108–113 min), 45–100% B (113–115 min), and held at 100% B (115–120 min).
Mass spectrometric detection was operated in positive ion mode. Full-scan MS spectra (m/z 300–1700) were acquired at a resolution of 70,000, with an AGC target of 3×e6 and a maximum injection time of 50 ms. Data-dependent MS/MS scans were performed at a resolution of 17,500, using an AGC target of 1×e5, a maximum injection time of 100 ms, and an isolation window of 2 m/z. Higher-energy collisional dissociation (HCD) was used for fragmentation. Dynamic exclusion was set to 30 s to prevent repeated sequencing of abundant ions.
Identification Procedures of Related Compounds
According to the above UHPLC-MS analytical method, the AS solution and fraction solution were analyzed. The base peak pattern of the compound identified by mass spectrometry is shown in Figure 2. Thermo Fisher Scientific’s MassFrontier 7.0 application software was employed to identify precursor ions of diagnostic ions in the AS total ion chromatogram via fragment ion retrieval, thereby filtering and generating a localization map of characteristic ions of andrographolide compounds in positive ion mode. This enabled the filtration of diagnostic ions in the mass spectrum. The specific procedure was as follows: The raw data in .raw format was opened using Chromatogram Processor. Chromatographic peak detection was performed using the JCD function under Components Detection & Spectra Deconvolution within a retention time range of 0–50 min and an m/z range of 100–1,500 (other parameters set as default). After detection, the FISh function was activated, and the structural information of andrographolide diagnostic ions was imported into the Fragments section of the FISh Filter. The sensitivity was adjusted to 90 for filtration. When compounds containing diagnostic ions were detected, a blue triangle symbol (each symbol representing one compound) was displayed above the mass spectrum. The base peak pattern of the compound identified by mass spectrometry
Data Analysis for Residual Proteins
The raw mass spectrometry data of residual proteins was imported into PEAKS Studio 8.5 (Bioinformatics Solution Inc., Waterloo, Canada) for analysis. Database search parameters were set with precursor and fragment mass error tolerances of 20 ppm and 0.2 Da, respectively, using Carbamideomethylation as a fixed modification. For de novo analysis, peptides with an average local confidence (ALC) score of ≥70% were selected. The resulting peptide data were exported as *.csv files and processed in Excel (Microsoft, Redmond, WA, USA).
Results
Identification of Related Compounds
Identification Compound Information of 27 Related Compounds

The analysis revealed that the AS products primarily contained andrographolide and its isomers, along with deoxy-anhydroandrographolide, dehydroandrographolide, 14-deoxy-11,12-didehydroandrographolide, bisandrographolide A/B/C, sodium andrographolide, sodium hydroxyandrographolide, and so on. Most of these compounds exist in AS predominantly in isomeric forms. Proposed structures of the major compounds are illustrated in Figure 3, and detailed information is summarized in Table 2. Structures of the major compounds identified in AS
The representative fragmentation pathway of the above compounds are illustrated using sodium andrographolide sulfonate as an example (Figure 4A). Its molecular formula is C20H29O8SNa. Although the molecule contains a sodium ion, during ionization, it tends to lose Na+ and incorporate one water molecule to form a more stable uncharged species [M-Na+H+H2O]. This intermediate subsequently loses a molecule of SO3 to yield a characteristic structure of fragment [M-Na+H+H2O-SO3]. For instance, the compound with the molecular formula C20H29O8SNa (peak number 22) forms a precursor ion at m/z 448.2005 [M-Na+H+H2O]. During fragmentation, it undergoes neutral loss of SO3, generating an intense fragment ion at m/z 368.2422. Then, the fragment ion with m/z 315.1962 is generated after adding H and losing 3H2O. (A): Fragmentation pathway of sodium andrographolide sulfate. (B): Fragmentation pathway of sodium andrographolide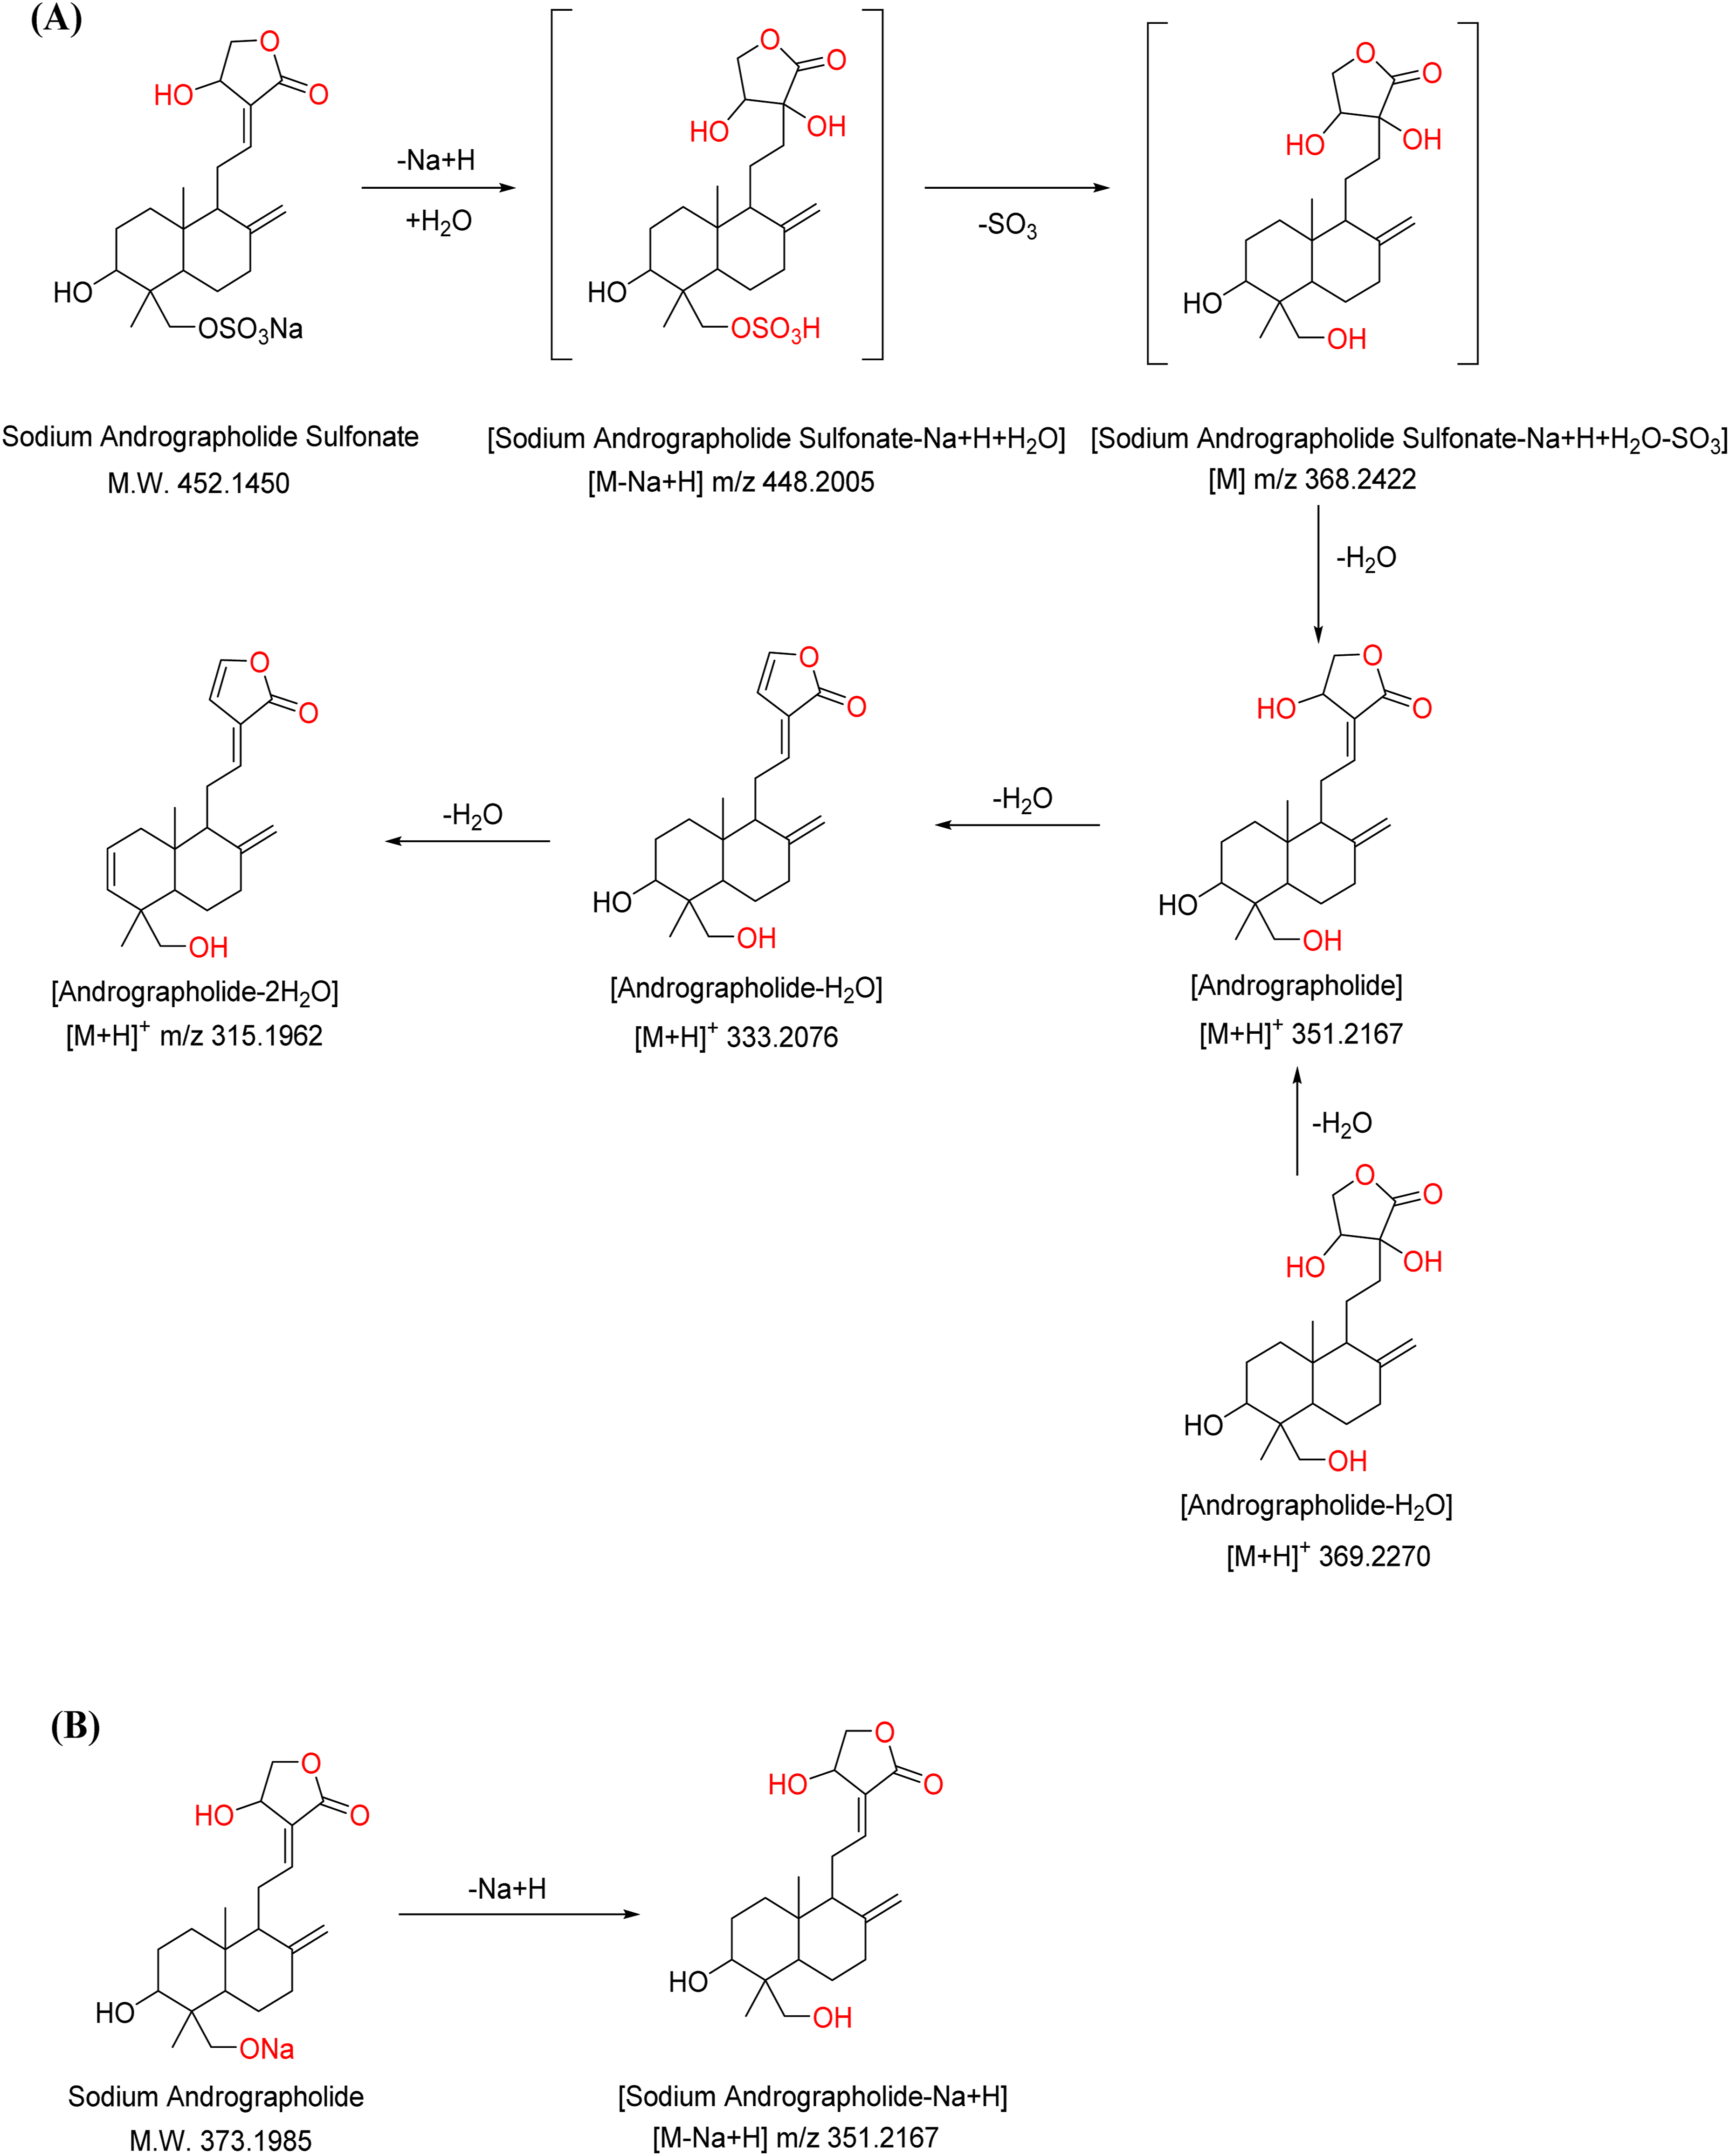
Subsequent fragmentation steps follow the general patterns observed for andrographolide-type compounds, supporting the identification of this compound and its analogs as sulfonated sodium andrographolide derivatives. Andrographolide compounds typically contain multiple hydroxyl groups, leading to frequent neutral loss of n molecules of H2O during mass spectrometric fragmentation. Characteristic fragment ions include m/z 333.2076 [M-Na-SO3+H+H-H2O]+, m/z 315.1962 [M-Na-SO3+H+H-2H2O]+, m/z 297.1836 [M-Na-SO3+H+H-3H2O]+, and m/z 285.1850 [M-Na-SO3+H+H-2H2O-CH2OH]+. Additionally, the fragment at m/z 297.1836 [M-Na-SO3+H+H-3H2O]+ further dissociates to yield a characteristic ion  at m/z 187.1479.22,23 This fragmentation pattern serves as a diagnosis tool for identifying andrographolide-related structures, as demonstrated in compounds 3, 4, 5, 10, 11, 14, 15, 16, 17, 18, 19, 20, 22, 23, and 24.
Meanwhile, during the identification of the andrographolide-related compounds, several were observed to occur in the form of sodium andrographolide salts (Figure 4B). The molecular ion form of such compounds corresponds to the neutral species generated by the loss of the Na+ ion and gain of a proton (H+), as exemplified by the compound 18. Additionally, several dimeric forms of andrographolide were identified. These compounds typically undergo fragmentation into two andrographolide structural units, whose subsequent fragmentation patterns align with those of monomeric andrographolide derivatives. For example, the bis andrographolide compound (peak number 24) fragments to yield two identical fragment ions at m/z 333.2075, each of which further dissociates following the general fragmentation behavior characteristic of andrographolide-type compounds.
Determination of Residual Proteins
Following protein extraction treatment, three batches of AS were analyzed for residual protein content using the Bradford assay. The results showed that the concentrations of the protein extracts were 5.3, 1.2, and 17.1 μg/mL, respectively, which correspond to mass contents of 1.6, 0.4, and 5.1 ppm. Compared with previously reported data for non-sulfonated andrographolide, 17 these results indicate that the sulfonation process reduces the residual protein content in the resulting AS products, though trace amounts remain detectable.
Identification of Residual Proteins
One aliquot of the protein residue test sample solution prepared from each of the three batches of AS was independently analysed twice using a nano LC-MS/MS system. The resulting sets of MS/MS spectral datasets were searched and analyzed against an A. paniculata protein database downloaded from UniProtKB using PEAKS Studio software. Following comparison and identification against the database of over 200 A. paniculata proteins, the Venn diagram (Figure 5) revealed that a total of 114 proteins were co-identified in the sulfonated product and the raw herb material. Among these, 12 proteins showed fold-changes and were detected in at least one batch of samples (Table 3). The complete list of relevant proteins, along with tables displaying their fold-changes and p-values, are provided in Supplemental Tables S1–S4. Among these, 6 proteins were detectable in both the starting material (andrographolide) and its sulfonated product (AS). Notably, a protein designated as A0A4Y5UXR9_ANDPA was consistently detected in all three sulfonated batches, and its signal intensity was significantly higher than that of other residual proteins (Figure 6). These results not only confirm the presence of trace amounts of plant-derived residual proteins in the sulfonated andrographolide products, but also successfully identify the major protein components among them. Venn diagram of proteins between A. paniculata (AP) and AS Intensity Comparison of Identified Proteins in AS Peptide spectrum matches indicated by blue lines below A0A4Y5UXR9_ANDPA protein


Conclusions
This study employed high-resolution mass spectrometry to qualitatively identify organic impurities in AS, providing a systematic analysis of their impurity profile. Based on accurate molecular weights, MS1 and MS2 spectral data, 27 organic compounds were putatively identified, with representative components covering a content range of 0.02% to 1.2%. The detailed analytical methodology and the quantitative results are provided in the Supplemental Material S2.
Using a proteomic strategy, 12 residual proteins derived from A. paniculata were detected in at least one batch of samples, among which six proteins were found in both the raw material (andrographolide) and its sulfonated products (AS). Notably, the protein designated A0A4Y5UXR9_ANDPA was consistently detected across all three batches with high signal intensity, indicating it is a major residual protein component. Although the total residual protein content is trace, it may pose potential risks such as allergic reactions in related injectable formulations. This study systematically elucidated the main chemical components (organic impurities) and characteristics of residual proteins in AS, providing a substantial material basis for their quality control and safety assessment. The findings offer critical data support the scientific selection of ultrafiltration membrane pore size and molecular weight cut-off during the production of ASI.
Discussion
Through the identification of AS, we obtained relevant information about sulfonated and unsulfonated compounds. Due to the limited availability of reference standards and mass spectrometry data, we can only determine the planar structures of most compounds, but not their stereochemical configurations, which is a limitation of mass spectrometry-based identification.
The content data, together with information from a disclosed patent application, 16 indicate that the sulfonated andrographolide mixture contains other representative components at concentrations up to approximately 6.0%. For quality control and process optimization, the level of unsulfonated compounds requires strict monitoring due to their poor aqueous solubility, which can compromise drug stability and safety. A suitable control limit—for instance, the 0.15% threshold referenced in the ICH (the International Council for Harmonisation of Technical Requirements for Pharmaceuticals for Human Use) Q3B guideline—may be applied. Higher limits would require supporting stability, safety, and efficacy data for the injectable product. These considerations provide a rationale for optimizing the sulfonation process to improve conversion efficiency and establish science-based quality standards.
The protein content of A. paniculata (batch number 20201105) was 1.77 mg/mL (equivalent to 425 ppm), while the protein content of andrographolide (batch numbers 20190702 and 20200301) was 8.64 and 48.9 µg/mL, respectively (equivalent to 1.7 ppm and 9.8 ppm). 17 The results show that the protein content of A. paniculata gradually decreases from the raw material to the intermediate of andrographolide and then to the sulfonate, which is consistent with the phenomenon of the Reduning injection. 21 Notable variability in protein content was observed across the three batches of AS. This variation is primarily attributed to differences in protein content within the native A. paniculata herb, as well as variations in residual proteins during the extraction and purification of andrographine. However, as the corresponding batches of the raw herb material were not tracked in this study, it represents an inherent limitation in this work.
No reports have been found regarding hypersensitivity reactions induced by A. paniculata proteins, which constitutes the primary research focus for our future investigations. The addition of strong acids during sulfonation may lead to protein degradation into peptides, so the residual content in andrographolide sulfonate may not be entirely protein. Through AllergenOnline, individual peptide fragments with high similarity to known allergenic peptides were predicted, such as VRIHLYPQLKVCG and EEREPTSQGDLESILPEQKDIE in T1UNN5_ANDPA, and FEKTKERIAT in A0A2R4LWC7_ANDPA.
Focused on characterizing the chemical and proteinaceous composition of AS, this work represents a partial application of proteomics. Nonetheless, the findings lay a foundation for identifying allergenic proteins derived from A. paniculata and for advancing the development of diagnostics and therapeutics targeting related allergies.24,25
Supplemental Material
Supplemental Material - Integrated LC-MS/MS and Proteomics Analysis Reveals the Chemical and Proteinaceous Composition of Andrographolide Sulfonate
Supplemental Material for Integrated LC-MS/MS and Proteomics Analysis Reveals the Chemical and Proteinaceous Composition of Andrographolide Sulfonate by Shuangbing Deng, Xinyi Tang, Wenxiu He, Yuanyuan Xie, Yawen Zhang, Difa Liu, Yuyu Zhu, Jing Zhou, Huiyong Li, Hongyue Ma in Natural Product Communications.
Footnotes
Acknowledgements
We sincerely thank the editor and anonymous reviewers for their invaluable comments and diligent efforts, which have significantly improved our manuscript. We are also profoundly grateful to Prof. Hailong Zhang for his meticulous assistance in polishing the English of this article.
Ethical Considerations
This study did not involve human participants or animal subjects. Therefore, ethical approval was not required.
Author Contributions
Shuangbing Deng and Wenxiu He were responsible for drafting the manuscript and preparing the tables, while Xinyi Tang assisted in extensive revision of the review comments. Yawen Zhang and Yuyu Zhu exported the figures. Jing Zhou and Huiyong Li revised the draft. Yuanyuan Xie, Difa Liu, and Hongyue Ma provided guidance and proofreading for the manuscript.
Funding
The authors disclosed receipt of the following financial support for the research, authorship, and/or publication of this article: This work was financially supported by National Natural Science Foundation of China (Grant No. 82574558).
Declaration of Conflicting Interests
The authors declared no potential conflicts of interest with respect to the research, authorship, and/or publication of this article.
Supplemental Material
Supplemental material for this article is available online.
References
Supplementary Material
Please find the following supplemental material available below.
For Open Access articles published under a Creative Commons License, all supplemental material carries the same license as the article it is associated with.
For non-Open Access articles published, all supplemental material carries a non-exclusive license, and permission requests for re-use of supplemental material or any part of supplemental material shall be sent directly to the copyright owner as specified in the copyright notice associated with the article.