
Abstract
Objectives
The objective of this study was to examine the chemical composition and antibacterial and antioxidant properties of essential oil (EOs) and solvent extracts from the leaves of Solanecio gigas, a medicinal plant that has long been used in Ethiopian traditional medicine but has received little scientific attention.
Methods
Gas chromatography–mass spectrometry (GC–MS) was used to analyse the EOs obtained by hydrodistillation. Soxhlet extraction was used to create solvent extracts using methanol, ethyl acetate, and chloroform. To find the main classes of compounds, phytochemical screening was done. Utilizing the 22-diphenyl-1-picrylhydrazyl (DPPH) radical scavenging assay, antioxidant activity was assessed. The agar diffusion method was used to test the antibacterial activity against Staphylococcus aureus, Streptococcus pyogenes, Escherichia coli, and Klebsiella pneumoniae. The microdilution assay was used to determine the minimum inhibitory concentrations (MICs). Colourimetric techniques were used to quantify the total phenolic and flavonoid contents.
Results
The essential oil contained 15 compounds, as determined by GC-MS analysis, with the main constituents being, Sabinene (38.909%), and α-Pinene (18.20%). The highest levels of flavonoids (130.10 ± 0.08 μg CE/mg) and phenolics (110.2 ± 0.03 μg GAE/mg) were found in the methanolic extract. Compared with the essential oil (IC₅₀ = 10.2 ± 0.22 μg/mL), the methanolic extract showed superior antioxidant activity (IC₅₀ = 2.1 ± 0.11 μg/mL). At concentrations of 25–200 mg/mL, the EOs demonstrated strong antibacterial activity with inhibition zones ranging from 7.1 ± 0.15 mm to 24.1 ± 0.40 mm, especially against K. pneumoniae and E. coli. The MIC range was 80.25 to 250.3 μg/mL.
Conclusion
The antibacterial and antioxidant qualities of S. gigas essential oil and extracts offer scientific support for the plant's traditional medicinal uses. The EOs demonstrated strong antibacterial activity against both Gram-positive and Gram-negative bacteria, while the methanolic extract, rich in phenolic and flavonoid compounds, showed the strongest antioxidant activity.
This is a visual representation of the abstract.
Introduction
Increasing concerns over economic losses from food spoilage and the health risks posed by foodborne pathogens have reignited interest in biopreservation strategies to maintain food quality and safety. Foodborne diseases pose a significant threat to public health.1–3 The increasing number of outbreaks has raised awareness about the presence of harmful and spoilage-causing bacteria in food products. In response, there is growing interest in using natural antibacterial agents, such as herb and spice extracts, for food preservation. Plant-based essential oils and extracts from various species have long been applied as natural preservatives in the food and beverage industry due to their antimicrobial properties.4,5
Incidents of foodborne disease are rising rapidly in the United States and other developed nations. The Gram-positive bacterium S. aureus is a major pathogen responsible for numerous severe health issues, such as food poisoning, endocarditis, osteomyelitis, toxic shock syndrome, and post-surgical infections. 6 E. coli is a Gram-negative bacterium that inhabits the human intestinal tract and is capable of causing diseases like septicemia, cholecystitis, and urinary tract infections. 7 The rise of antibiotic-resistant bacteria has prompted greater scientific interest in the antimicrobial properties of essential oils and plant extracts. 8
Researchers are investigating these natural compounds to create safe and effective antimicrobial agents that can help combat infections and enhance food preservation.6,9 A variety of synthetic antimicrobial agents have been applied to prevent the growth of food spoilage microorganisms and foodborne pathogens in different food products. Nevertheless, growing concerns about the safety of these synthetic chemicals have led consumers to prefer naturally processed foods. As a result, identifying and assessing natural alternatives to control these harmful microbes has emerged as a significant global challenge to maintain a safe, nutritious, and health-enhancing food supply. 10
Furthermore, substantial evidence indicates that the human body generates reactive oxygen and nitrogen species, which can cause oxidative damage associated with various degenerative conditions such as cancer, atherosclerosis, coronary heart disease, and the ageing process. 6 Research indicates that consuming certain fruits and vegetables is linked to lower rates of degenerative diseases and related deaths. This benefit may partly be due to their high antioxidant levels. 11
Plant-derived antioxidants are thought to promote health by neutralising reactive oxygen and nitrogen species. In addition, the food industry widely utilises antioxidants to prolong product shelf life. However, there is broad agreement that certain synthetic antioxidants, such as butylated hydroxyanisole (BHA) and butylated hydroxytoluene (BHT), may pose toxicity and health risks, making it preferable to replace them with natural alternatives. 12 Hence, discovering new, safe, and cost-effective natural sources of antioxidants is essential. 13
S. gigas, a species from the Asteraceae family, is among the most commonly utilized medicinal plants in Ethiopia. Various parts of the country host species of the genus Solanecio. However, no published research has specifically investigated the antibacterial and antioxidant activities of the leaf essential oil and extracts of S. gigas. Therefore, this study aims to explore the potential of S. gigas leaf essential oil and its extracts as natural antioxidants and antibacterial agents. 14
Previous investigations have detailed the chemical composition and the antibacterial and antioxidant activities of the essential oil and various organic extracts obtained from the stem bark of S. gigas. 4 Furthermore, earlier research has also explored the chemical profile and antibacterial potential of the flower essential oil of S. gigas. 14 Based on our review of the available literature, no prior studies appear to have reported the biological properties of the plant species from S. gigas leaf examined in this work. Therefore, this is the first study to comprehensively investigate the EOs composition, antibacterial activity, and antioxidant potential of S. gigas leaves.
This study analyzed the chemical composition of the essential oil extracted from S. gigas leaves, along with leaf extracts obtained using methanol, ethyl acetate, and chloroform. In addition, the research aimed to assess and compare their antioxidant and antimicrobial activities. The findings are intended to highlight the potential of these natural substances as alternative sources for microbial inhibition and antioxidant applications.
Materials and Procedures
Study Design, Duration, and Location
This experimental study was conducted at the Department of Chemistry, College of Natural and Computational Science, Debre Tabor University, Debre Tabor, Ethiopia. The study commenced in January 2025 and was completed in June 2025, spanning a total duration of six months. All laboratory analyses, including plant extraction, phytochemical screening, essential oil isolation, GC-MS analysis, antioxidant assays, and antibacterial testing, were performed in the chemistry laboratories of Debre Tabor University. Bacterial strains used for antimicrobial testing were obtained from Bahir Dar University, Ethiopia, and characterized based on morphological and biochemical properties prior to use in the bioassays.
Plant Material Collection and Authentication
In January 2025, while S. gigas was at the height of its flowering season, fresh leaves were harvested from Mekane Eyesus (approximately 11.633°N and 38.067°E latitude and longitude), South Gondar, Ethiopia. The plant material was identified and verified by Dr Endale Adamu of the Department of Plant Biology at Debre Tabor University. Voucher specimens were deposited in the university herbarium under the accession number BM001. After collection, the leaves were washed with distilled water to remove dust and surface contaminants, then air-dried in the shade at room temperature for 2 weeks. The dried leaves were milled into a fine powder using a mechanical grinder, passed through a 40-mesh sieve, and stored in airtight containers at 4 °C until further analysis. The powdered material was weighed and used for subsequent extraction procedures.
Plant Extraction and Fractionation
Soxhlet Extraction
To prepare crude extracts from powdered S. gigas leaves, Soxhlet extraction was used. This approach was chosen because it works especially well when impurities are less soluble in the extraction solvent and target compounds have limited solubility in that solvent. A porous thimble made of cellulose filter paper was filled with 100 g of finely ground leaf powder for each extraction. After that, the thimble was put into a Soxhlet apparatus and extracted one after the other using three increasingly polar solvents: methanol, ethyl acetate, and chloroform at a solvent-to-sample ratio of 1:10 (w/v). At the solvents boiling point each extraction was carried out for six hours. A heating mantle was used to warm the solvent-filled round-bottom flask in order to enable continuous extraction. Following each extraction cycle, the extracts were passed through a Whatman No. filter. To remove particulate matter, use one filter paper. The filtrates were then concentrated to produce solid or semi-solid residues using a rotary evaporator (R-210, Buchi, Switzerland) at 40 °C under reduced pressure. To ensure complete removal of any remaining solvent, the concentrated extracts were transferred to amber-coloured glass vials that had been weighed, dried under a gentle stream of nitrogen, and stored at 4 °C until needed again. Based on the dry weight of the initial material, the %age yield of each extract was computed. 15
Phytochemical Screening
Qualitative phytochemical screening was conducted on the methanolic extract of S. gigas leaves to identify the major classes of bioactive compounds present in the plant material. The screening was performed using standard qualitative methods with slight modifications, based on the formation of colored complexes or precipitates upon reaction with specific reagents. All tests were conducted in triplicate to ensure the reliability of the results.
Test for Phenolic Compounds
Approximately 1 mL of the methanolic extract was mixed with 2 mL of 2% ferric chloride (FeCl₃) solution. The development of a greenish-black colour indicated the presence of phenolic compounds. 16
Test for Tannins
A 50 mg portion of the crude extract was dissolved in 5 mL of distilled water, and a few drops of 5% ferric chloride solution were added. The appearance of a black or blue-green colour confirmed the presence of tannins. 16
Test for Glycosides
Two milliliters of the organic extract was dissolved in 2 mL of chloroform, and 2 mL of concentrated sulfuric acid was carefully added along the walls of the test tube. The formation of a reddish-brown colour at the interface indicated the presence of a steroid ring or an aglycon moiety in the glycosides. 17
Test for Flavonoids
Three drops of 1% ammonia (NH₃) solution were added to a test tube containing the plant leaf extract. The appearance of a yellow colour, which intensified upon standing, confirmed the presence of flavonoid compounds. 16
Test for Saponins
A small amount of the extract was shaken vigorously with 5 mL of distilled water in a test tube. The formation of persistent foam that persisted for several minutes indicated the presence of saponins. 18
Test for Steroids
Two milliliters of the crude extract was mixed with 2 mL of chloroform and 2 mL of concentrated sulfuric acid. The development of a reddish colour or greenish colouration at the interface indicated the presence of steroids. 19
Test for Terpenoids
Two milliliters of the organic extract was dissolved in 2 mL of chloroform. The solution was dried on a hot plate, and 2 mL of concentrated sulfuric acid was added. The mixture was heated for 2 min. A greyish or reddish-brown colour indicated the presence of terpenoids. 17
Test for Anthraquinones
Two milliliters of methanol, 2 mL of benzene, and 3 mL of 1% ammonia solution were combined with the plant extract sample. The appearance of a violet or pink colour in the aqueous layer indicated the presence of anthraquinones. 20
Test for Alkaloids
Mayer's test was performed by adding a few drops of Mayer's reagent (potassium mercuric iodide solution) to 1 mL of the sample. The formation of a pale-yellow or cream-colored precipitate indicated the presence of alkaloids. 21
Test for Reducing Sugars
Fehling's test was conducted by mixing 1 mL of Fehling's solution A and 1 mL of Fehling's solution B with 2 mL of the plant methanolic extract. The mixture was boiled for 5 min. The formation of a brick-red or crimson precipitate indicated the presence of reducing sugars. 22
Isolation of Essential oil
A Clevenger-type apparatus was used to hydrodistill 400 g of fresh S. gigas leaves for three hours in accordance with the European Pharmacopoeia method. A 2000mL round-bottom flask coupled to a condenser and a graduated collection tube made up the apparatus. After adding 1000 milliliters of distilled water to the flask, the fresh leaves were brought to a boil. Through the condenser, the essential oil-containing vapour was condensed, and the distillate was gathered in the graduated tube. Following distillation, two phases were observed: an organic, less-dense phase (essential oil) and an aqueous phase (aromatic water). After carefully separating the essential oil with a micropipette, any remaining moisture was removed by drying it over anhydrous sodium sulfate (Na₂SO₄) and filtering it. Before analysis, the refined essential oil was stored at 4 °C in sealed amber-coloured vials shielded from light.
23
Using the formula, the essential oil (Figure 1) extracted yield percentage was determined based on the fresh weight of the plant material:


Extraction of Essential oil from the fresh leaves of S. gigas through hydrodistiliation.
GC-MS Analysis of Essential Oil
GC-MS Operating Conditions
The Central Laboratory of Addis Ababa University Natural Science collage used Gas Chromatography-Mass Spectrometry (GC-MS) to analyse the chemical composition of the essential oils. A Trace 1300 Gas Chromatograph and an ISQ LT Single Quadrupole Mass Spectrometer (Thermo Fisher Scientific Inc.) were used for the analysis. Waltham, Massachusetts, USA). Thermo Fisher Scientific's DB-5 MS capillary column (30 m × 0.25 mm inner diameter, 0.25 μm film thickness) was used to accomplish separation. Before injection, the essential oil samples were diluted 1:10 (v/v) with high-purity n-hexane (HPLC grade ≥99.9%). The oven's initial temperature was maintained at 60 °C for 2 min, then raised to 180 °C at 3 °C per minute, held for 2 min, and then raised to 250 °C at 5 °C per minute, held for 5 min. The transfer line temperature was maintained at 280 °C, while the injector was set to 250 °C. A steady flow rate of 1–0 mL/min of high-purity helium (99.999%) was employed as the carrier gas. With a split ratio of 1:20, the injection volume was 1 μL. Over the 40–450 m/z range, mass spectra were obtained at 70 eV in electron impact (EI) mode. 150 °C was the quadrupole temperature, and 230 °C was the ion source temperature. To prevent solvent peak detection, the solvent delay was set to 3 min.
Retention Index Calculation
To provide additional confirmation of compound identification, retention indices (RI) were calculated using the Kovats method.
24
A mixture of n-alkanes (C7–C30) was analyzed under identical GC-MS conditions. The retention index for each compound was calculated using the equation 1.

Where:
n = number of carbon atoms in the smaller alkane
N = number of carbon atoms in the larger alkane
tR(sample) = retention time of the compound
tR(n) = retention time of the smaller alkane
tR(N) = retention time of the larger alkane
The calculated retention indices were compared with literature values reported for the DB-5 column. Compounds with calculated RI values within ±20 units of reported values were considered tentatively identified.
Compound Identification Criteria
To obtain the initial identification, the mass spectra were compared against those in the Wiley 275 Mass Spectral Library and the NIST 11 Mass Spectral Library. 25 Compounds with similarity indices of at least 90% were considered for further assessment. Subsequently, computed retention indices were compared with published values from the NIST Chemistry WebBook and the peer-reviewed literature. Compounds that had RI matches within ±20 units were the only ones kept.
Contamination Prevention and Quality Control Measures
To ensure the accuracy of GC-MS results and eliminate the possibility of contamination, subsequent quality control procedures were implemented. The study was conducted using high-purity solvents (HPLC-grade methanol and n-hexane). Before and after sample runs, solvent blanks were examined to look for background contamination. At the relevant retention times, no notable peaks were seen in the solvent blanks. Before use, all glassware used for handling EOs was thoroughly cleaned, rinsed with acetone, and dried in a drying oven. To prevent oxidation and contamination, the EOs was stored in sealed amber glass vials at 4 °C. Only compounds with a value less than 10% for peak area were reported. However, values less than 10% also recorded in Table 2, for information.
Determination of Total Phenolic Content
With minor modifications, Singleton and Rossi's Folin-Ciocalteu colourimetric method was used to determine the extracts’ total phenolic content. 26 The procedure involved mixing 0.5 mL of each extract (1 mg/mL in methanol) with 2.5 mL of 10% Folin-Ciocalteu reagent (v/v). Two milliliters of a 7.5% sodium carbonate (Na₂CO₃) solution were added to the mixture after it had stood for five minutes at room temperature. The mixture was allowed to sit at room temperature in the dark for 2 h. Using a UV-Vis spectrophotometer (UV-1800, Shimadzu, Japan), absorbance was measured at 765 nm. To create a calibration curve, gallic acid was utilized as the standard (0-100 μg/mL). Gallic acid equivalents per milligram of dry extract (μg GAE/mg) were used to express the total phenolic content. Three duplicates of each measurement were made, and the mean ± standard deviation was used to present the findings.
Determination of Total Flavonoid Content
Aluminium chloride colourimetric method was used to calculate the total flavonoid content. with a few adjustments used by Albert et al (2022). 27 The following ingredients were combined in an aliquot: 1.5 mL of each extract (1 mg/mL in methanol), 1.5 mL of methanol, 0.1 mL of a solution of 10% aluminum chloride (AlCl₃), 0.1 mL of 1 M potassium acetate (CH₃COOK), and 2.8 mL of distilled water. The mixture was allowed to sit at room temperature for 30 min. The absorbance was measured at 415 nm using a UV-Vis spectrophotometer. A calibration curve (0-100 μg/mL) was created using catechin as the standard. The total amount of flavonoids was measured in micrograms of catechin equivalents (μg CE/mg) per milligram of dry extract. Three duplicate measurements were made, and the mean ± standard deviation was used to present the findings.
Antibacterial Activity Assay
Test Microorganisms
Two Gram-positive bacteria (Staphylococcus aureus ATCC 25723 and Streptococcus pyogenes ATCC 25765) and two Gram-negative bacteria (Escherichia coli ATCC 24821 and Klebsiella pneumoniae ATCC 24193) were used to test the antibacterial activity of the essential oil and extracts. 28 The bacterial strains were acquired from Bahir Dar University's biology department in Ethiopia. The strains were subcultured once a month and kept at 4 °C on nutrient agar slants. The bacterial strains were activated before testing by adding a loopful of culture to Mueller-Hinton broth (MHB) and incubating at 37 °C for 1 day. A sterile saline solution was used to bring the bacterial suspensions up to the 0.5 McFarland standard, or roughly 1–2 × 10⁸ CFU/mL.
Disc Diffusion Method
The agar disc diffusion method, modified for natural products, was initially used to screen for antibacterial activity in accordance with the Clinical and Laboratory Standards Institute (CLSI) guidelines. 29 Mueller-Hinton agar (MHA) plates, 90 mm in diameter, were sterilised and allowed to solidify. Sterile cotton swabs were used to evenly swab the bacterial suspensions (0.5 McFarland standard) on the agar plate surface. Whatman No. 4 filter paper discs. 16 mm diameter) were made and autoclaved for sterilization. Stock solutions were made by dissolving the essential oil and extracts in 10% dimethyl sulfoxide (DMSO). The discs were left to dry in a sterile environment after being impregnated with 20 μL of each sample at varying concentrations (200, 100, 50, 25, and 12.5 mg/mL). Subsequently, the discs were positioned on the infected agar plates. The positive control was 10 μg/disc of gentamicin, and the negative control was 10% DMSO. For a full day, the plates were incubated at 37 °C. A calibrated ruler was used to measure the diameter of the zone of inhibition, including the disc diameter, in millimeter, following incubation. Every test was run in triplicate, and the mean ± standard deviation was used to represent the results.
Determination of Minimum Inhibitory Concentration (MIC)
Using the broth microdilution method in 96-well microplates, the minimum inhibitory concentration (MIC) of the essential oil and extracts against the test bacteria was determined using a modified version of the Benabderrahmane and Benali method. 30 Because the essential oil and some extracts are hydrophobic, they were first dissolved in 10% DMSO to create a stock solution. In Mueller-Hinton broth, two-fold serial dilutions were prepared to achieve concentrations ranging from 80.25 to 250.3 μg/mL. Each dilution was added to the microplate wells in 100 μL aliquots. After that, each well received 100 μL of bacterial suspension (0.5 McFarland standard, roughly 5 × 101 CFU/mL), bringing the final volume to 200 μL per well. In the end, the tested concentrations ranged from 40.125 to 125.15 μg/mL. As growth controls, wells containing broth, DMSO, and bacterial suspension were used, while wells containing only broth and 10% DMSO served as sterility controls. The microplates were incubated at 37 °C for a full day after being sealed with sterile covers. Each well was filled with 20 μL of a 0%–5% triphenyltetrazolium chloride (TTC) solution, and the wells were incubated for a further half hour. The lowest concentration of the sample that completely inhibited bacterial growth, as shown by the absence of colour change (no TTC reduction), was known as the minimum inhibitory concentration (MIC). Every test was run in triplicate, and mean values were used to express the findings.
Antioxidant Activity Assay
DPPH Radical Scavenging Assay
Using the 2,2-diphenyl-1-picrylhydrazyl (DPPH) radical scavenging assay, the antioxidant activity of the essential oil and methanolic extract was assessed using the modified Brand-Williams method.
31
To make a 0.6 mM solution, 0.024 g of DPPH was dissolved in 100 mL of methanol. Until it was needed, the solution was kept at 4 °C in the dark. For the assay, 3 mL of DPPH solution was combined with 0–1 mL of different sample concentrations (prepared by serial dilution of the samples in methanol to 10, 50, 100, 200, and 1000 μg/mL). After thoroughly vortexing the mixture, it was allowed to sit at room temperature for 30 min in the dark. After incubation, absorbance was measured at 517 nm using a UV-Vis spectrophotometer. In order to create a control, 0–1 mL of methanol was combined with 3 mL of DPPH solution. Methanol served as the blank. As a positive standard, ascorbic acid was employed. The formula below was used to determine the percentage of inhibition of DPPH radical scavenging activity:
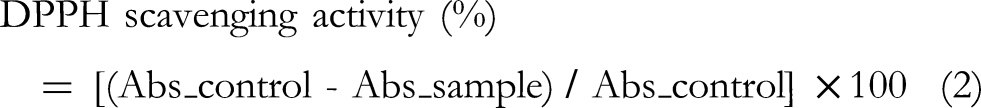
Where Abs_control is the absorbance of the control (DPPH solution + methanol), and Abs_sample is the absorbance of the sample (DPPH solution + extract/essential oil). The IC₅₀ value, defined as the concentration of sample required to scavenge 50% of the DPPH radicals, was determined from the dose-response curve by linear regression analysis. All assays were performed in triplicate, and the results were expressed as mean ± standard deviation.
Statistical Analysis
All experiments were conducted in triplicate, and the data were expressed as mean ± standard deviation (SD). Statistical analysis was performed using Microsoft Excel 2019 and SPSS version 25.0 software (IBM Corporation, Armonk, NY, USA). The results were analyzed using one-way analysis of variance (ANOVA) followed by Tukey's post-hoc test for multiple comparisons. A p-value of less than 0.05 (p < 0.05) was considered statistically significant.
Result
Quantification of Extracts
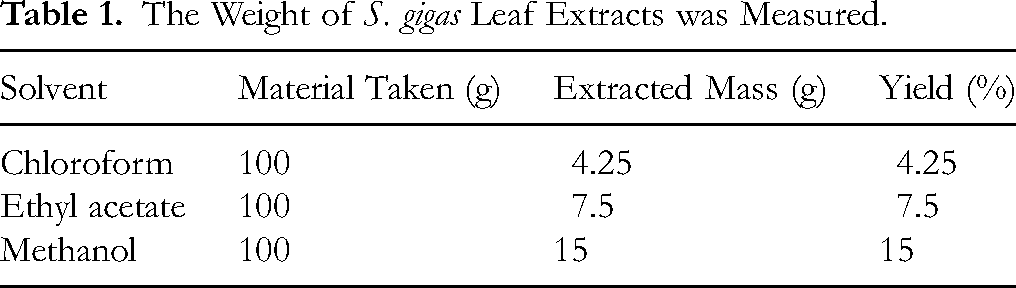
Leaf material (100 g, dry weight) was extracted with three solvents of increasing polarity at room temperature. The masses of the resulting extracts are presented in Table 1. Methanol gave the highest yield (15 g, 15 % w/w), followed by ethyl acetate (7.5 g, 7.5 % w/w) and chloroform (4.25 g, 4.25 % w/w) (Table 1).
The Weight of S. gigas Leaf Extracts was Measured.
Qualitative Phytochemical Screening
A preliminary phytochemical analysis of the leaf extracts revealed the presence of alkaloids, flavonoids, steroids, tannins, anthraquinones, terpenes, glycosides, and phenolic compounds. Saponins were also detected in the methanol and ethyl acetate extracts.
Essential-oil Composition
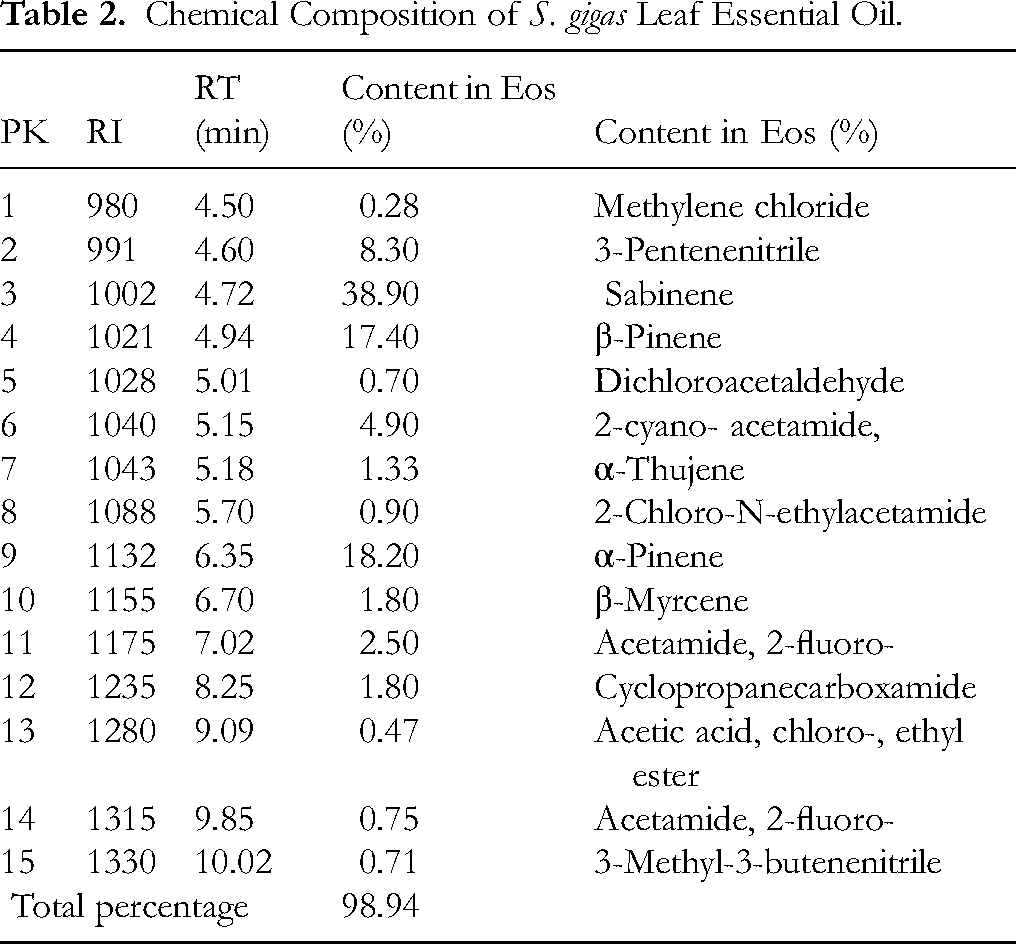
Hydrodistillation of fresh leaves (100 g) yielded 1.5% (v/w) essential oil (EOs). The extracted EOs was a pale-yellow colour as indicated in Figure 2 and showed the following properties, it remained liquid at −20 °C and was soluble in methanol, dichloromethane, and DMSO but not in water. GC-MS analysis identified 15 constituents accounting for 98.94% of the EOs (Table 2). The major components were sabinene (38.90%), α-pinene (18.20%), and β-pinene (17.40%), followed by 2-cyano- acetamide (4.90%), 2-chloro-N-ethylacetamide (3.90%), 3-pentenenitrile (3.30%), acetamide, 2-fluoro- (2.50%), and cyclopropanecarboxamide (1.80%). The remaining constituents were present in trace amounts (<1%)).

The Inhibition Zone (mm) of EOs, MeOH, CHMB, and EACL for Staphylococcus aureus, Streptococcus pyogenes, Escherichia coli and Klebsiella pneumoniae.
Chemical Composition of S. gigas Leaf Essential Oil.
Total Phenolic and Flavonoid Contents
The total phenolic content (TPC), expressed as µg gallic acid equivalents (GAE) per mg extract, and the total flavonoid content (TFC), expressed as µg catechin equivalents (CE) per mg extract, are shown in Table 3. Methanol extract exhibited the highest TPC (110.2 ± 0.03 µg GAE mg⁻1) and TFC (130.10 ± 0.08 µg CE mg⁻1). Ethyl acetate gave intermediate values (TPC = 72 ± 0.22 µg GAE mg⁻1; TFC = 91.2 ± 0.14 µg CE mg⁻1), while chloroform extract showed the lowest (TPC = 28.4 ± 0.13 µg GAE mg⁻1; TFC = 45.3 ± 0.03 µg CE mg⁻1).
The Phenol and Flavonoid Amounts of the Plant Sample are Shown.

The mean ± SD of three triple trials is used to represent the data.
Antibacterial Activity (Disk-Diffusion Assay)
The antibacterial efficacy of the EOs, methanol (MeOH), chloroform (CHM), and ethyl acetate (EAC) extracts was evaluated at four concentrations (25-200 mg ml⁻1) against four pathogenic bacteria such as Escherichia coli, Klebsiella pneumoniae, Staphylococcus aureus, and Streptococcus pyogenes. Inhibition-zone diameters are summarized in Table 4 (200 mg ml⁻1 data are shown in Figure 2). At the highest test concentration, the EO produced the largest zones of inhibition compared to MeOH, CHM, and EAC extract with value of 24.1 ± 0.40 mm for K. pneumoniae, 23.4 ± 0.53 mm for E. coli, 19.6 ± 0.51 mm for S. pyogenes, and 16.5 ± 0.50 mm for S. aureus. The methanol and ethyl acetate extracts also inhibited all test organisms (zones of inhibition 17.3-23.4 mm and 18.5-23.4 mm, respectively), whereas the chloroform extract exhibited weaker activity (14.4-17.2 mm). The positive control (gentamicin, 10 mg/disk) gave zones of inhibition 24.2–25.7 mm.
Plants’ Antibacterial Activity Inhibition Zone (mm).

Minimum Inhibitory Concentrations (MIC)
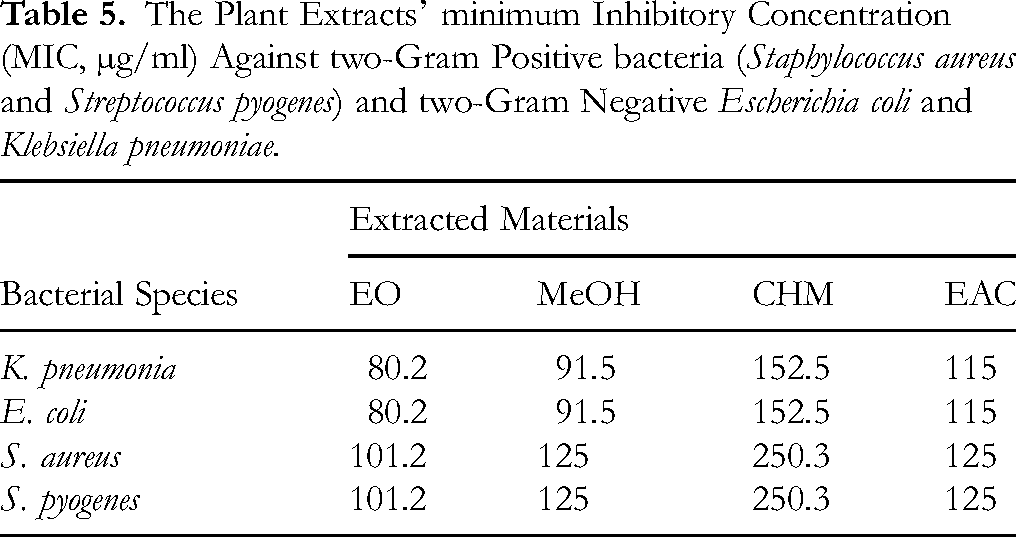
MIC values are presented in Table 5. The EOs exhibited the lowest MICs against the Gram-negative strains (80.25 µg ml⁻1 for both E. coli and K. pneumoniae) and slightly higher MICs against the Gram-positive strains (101.25 µg ml⁻1 for S. aureus and S. pyogenes). Methanol extract MICs were 91.5 µg ml⁻1 for the Gram-negative bacteria and 125 µg ml⁻1 for the Gram-positive bacteria. Ethyl acetate extracts gave MICs of 115 µg ml⁻1 (Gram-negative) and 125–152.5 µg ml⁻1 (Gram-positive). Chloroform extract showed the highest MICs (152.5-250.3 µg ml⁻1).
The Plant Extracts’ minimum Inhibitory Concentration (MIC, µg/ml) Against two-Gram Positive bacteria (Staphylococcus aureus and Streptococcus pyogenes) and two-Gram Negative Escherichia coli and Klebsiella pneumoniae.
Antioxidant Activity (DPPH Radical-Scavenging Assay)
The DPPH fee radical scavenging of the methanol extract, EOs and the standard antioxidant (AA) at five concentrations (10, 50, 100, 500 and 1000 µg ml⁻1) are listed in Table 6. The methanol extract exhibited the highest radical-scavenging activity, reaching 92.1 ± 0.40 % at 1000 µg ml⁻1, followed by the EOs (99.5 ± 0.31 % at 1000 µg ml⁻1) and ascorbic acid (89.8 ± 0.20 % at 1000 µg ml⁻1). The IC₅₀ values were 2.1 ± 0.11 µg ml⁻1 for the methanol extract, 10.2 ± 0.22 µg ml⁻1 for the EOs and 4.7 ± 0.02 µg ml⁻1 for ascorbic acid (AA) (Table 6).
DPPH Radical Scavenging Activities and IC50 Values (µg/ml) for EOs and Methanol Extracts of S. gigas.

Discussion
Extraction Yield and Solvent Polarity
The ability of highly polar methanol to solubilize polar constituents like sugars, amino acids, phenolic compounds, and flavonoids was demonstrated by the extraction yields, which followed the expected trend with solvent polarity: methanol (15 g, 15% w/w), ethyl acetate (7.5 g, 7.5% w/w), and chloroform (4.25 g, 4.25% w/w). 32 Given the high phenolic and flavonoid contents in S. gigas leaves the notable 15% methanol yield indicates a profusion of polar phytochemicals. Due to their capacity to dissolve polar metabolites and break hydrogen bonds polar solvents like methanol consistently produce higher extraction efficiencies for phenolic and flavonoid compounds which is consistent with earlier research on other medicinal plants. 33 For example our results are consistent with a study on Moringa oleifera leaves that reported methanol extraction yields of 12–18% w/w which were higher than those of ethyl acetate and chloroform. 34
Phytochemical Profile
S. gigas has a wide range of secondary metabolites as evidenced by the identification of alkaloids flavonoids steroids tannins anthraquinones terpenes glycosides and phenolics. 35 The plants traditional medicinal use is justified by the biological activities of many of these compound classes which include analgesic anti-inflammatory antimicrobial and antioxidant effects. The Asteraceae family is known for having a diverse phytochemical profile. For instance it has been reported that Calendula officinalis and Artemisia annua have similar compound classes that are linked to their pharmacological characteristics. 36
Essential-Oil Composition
S. gigas leaves yield 1% to 5% (v/w) of essential oil, which is similar to other Asteraceae family members and suggests a moderate to good oil content. 37 Typical monoterpene-rich essential oils are pale yellow and have a watery viscosity. According to GC-MS analysis, approximately 87% of the composition of S. gigas leaf EOs consists of monoterpene hydrocarbons. 38 Many EOs extracted from plants in the Asteraceae family have a high monoterpene content, which greatly enhances their biological activity. 39 α-pinene (18.20%) and β-pinene (17.40%) were the next most prevalent constituents after sabinene (38.90%). Given that sabinene is a monoterpene with a variety of pharmacological properties, including anti-inflammatory, antimicrobial, and antioxidant activities, its high content is significant. 40 Many aromatic and medicinal plants, such as Juniperus communis, Piper nigrum, and some Asteraceae species, are common sources of sabinene. 41 With its well-established anti-inflammatory, antimicrobial, and neuroprotective qualities, the second major component, α-pinene (18. 20%), is also noteworthy. 42 Another pinene family member that adds to the essential oils’ overall biological activity is β-pinene (17.40%). 43 The essential oil of S. gigas leaves has a different chemical profile than the flower essential oil of the same species, which was found to contain terpinen-4-ol and other oxygenated monoterpenes as major constituents 44 This variation could be explained by variations in plant parts (leaves vs flowers), location, time of harvest, and meteorological factors. Even though they are uncommon, the traces to moderate levels of some nitrogen-containing compounds (3-pentenenitrile acetamide derivatives) and halogenated compounds (2-chloro-N-ethylacetamide dichloroacetaldehyde) may be related to particular biosynthetic pathways or environmental factors. 45 In contrast to the main monoterpene constituents, these compounds were found in comparatively low concentrations. Given the well-established antimicrobial, anti-inflammatory, and antioxidant properties of these compounds, the monoterpene-rich composition of S. gigas leaf essential oil suggests possible uses in pharmaceuticals, cosmetics, and food preservation. 46 This essential oil is a good candidate for further research into its biological activities due to its high concentrations of sabinene, α-pinene, and β-pinene. 43
Phenolic and Flavonoid Content
The highest concentrations of flavonoids (130.1 µg CE mg⁻1) and phenolics (110.2 µg GAE mg⁻1) were found in the methanol extract. 47 Phenolic yield and solvent polarity are closely related; polar solvents like methanol effectively dissolve hydrogen-bonding phenolic compounds and break cell-wall matrices. 48
The extracts’ total phenolic and flavonoid contents consistently followed the polarity of the solvent; the methanol extract had the highest values, followed by the ethyl acetate and chloroform extracts. 49 Given its higher extraction yield (15% w/w) as previously noted, the methanol extract exhibited the highest TPC (110.2 ± 0.03 µg GAE/mg) and TFC (130.10 ± 0.08 µg CE/mg). 50 The relationship between phenolic/flavonoid content and extraction yield suggests that polar solvents especially methanol are better at removing these bioactive substances from the leaves of S. gigas. 51 Studies on Tinospora cordifolia and Azadirachta indica where methanol also produced higher phenolic and flavonoid contents compared to other solvents support this conclusion. 52
Because they contain glycosidic bonds and hydroxyl groups, phenolic compounds and flavonoids are naturally polar molecules that dissolve more easily in polar solvents. 53 Methanol efficiently removes these substances from the plant matrix thanks to its high dielectric constant and ability to form hydrogen bonds. 54 In accordance with the extraction yield data and the chemical makeup of phenolic and flavonoid compounds, the chloroform extracts much lower TPC and TFC (28.4 ± 0.13 µg GAE/mg and 45.3 ± 0.03 µg CE/mg, respectively), suggesting that non-polar solvents are less efficient at extracting these polar phytochemicals. 55 This is consistent with reports on Ocimum basilicum and Rosmarinus officinalis, where chloroform extracts showed significantly lower phenolic content than methanol extracts. 56
S. gigas leaves appear to be especially abundant in these bioactive substances, as evidenced by the significantly higher phenolic and flavonoid contents in the methanol extract when compared to other solvents. 57 Because they can donate hydrogen atoms or electrons to neutralize free radicals, phenolic compounds are well known for their antioxidant qualities. 58 Meanwhile, flavonoids play a major role in a variety of pharmacological activities, such as anti-inflammatory, antimicrobial, and anticancer effects. 59 Methanol extracts with high TPC and TFC values suggest that this fraction has significant potential for use in therapeutic settings. 60 Comparative research on Mentha piperita and Salvia officinalis also highlights methanol as an efficient solvent for extracting high levels of phenolics and flavonoids. 61
The solvent polarity gradient is reflected in the hierarchical order of TPC and TFC (methanol, ethyl acetate, and chloroform), indicating that the extraction of these phytochemicals is polarity-dependent. 62 This result is in line with many reports in the literature that show polar organic solvents are better at removing phenolic and flavonoid compounds from plant materials. 63 The moderate polarity of ethyl acetate extract, which permits the extraction of some aglycones and moderately polar flavonoids, is reflected in the intermediate values found for this extract. 64 Similar trends were observed in studies on Citrus limon and Punica granatum peels. 65
The high levels of flavonoids and phenols in S. gigas leaf extracts, especially the methanol extract, make this plant a good choice for additional pharmacological research. 66 These bioactive substances have a wide range of health advantages and can be used as natural antioxidants in food preservation, pharmaceutical, and nutraceutical applications. 67 A scientific foundation for choosing methanol as the best solvent for the thorough extraction of these important phytochemicals from S. gigas leaves is provided by the association between extraction yields and phenolic/flavonoid contents. 68
Antibacterial Activity
The current investigation assessed the plants’ essential oil (EO), methanol (MeOH), chloroform (CHM), and ethyl acetate (EAC) extracts’ antibacterial efficacy against four harmful bacteria (E. coli disk-diffusion assay) for S. pneumoniae, S. aureus, and S. pyogenes. 69 The findings show that each extract had a different level of antibacterial activity, with effectiveness typically rising with concentration. 70
The broadest and most powerful activity was shown by the EOs, especially at the highest concentration (200 mg/mL). It generated the biggest zones of inhibition against K. pneumoniae (24.1 ± 0.40 mm). S. aureus (16.5 ± 0.50 mm), S. pyogenes (19.6 ± 0.51 mm), and E. coli (23.4 ± 0.53 mm) were next in line. The zone of inhibition against K. pneumoniae is particularly noteworthy. pneumoniae was comparable to the gentamicin-positive control (24.1 mm vs 25.0 mm), suggesting high potency. Inhibition zones decreased proportionately with decreasing concentrations (from 200 to 25 mg/mL), indicating a concentration-dependent effect that is consistent with the usual dose-response relationship for bioactive compounds.
Additionally, the ethyl acetate extract (EAC) showed significant activity, almost matching that of EO at 200 mg/mL, and was particularly effective against S. pyogenes (21.1 ± 0.46 mm) and E. coli (23.4 ± 0.45 mm). 71 The inhibition zone against K. Particularly notable was pneumoniae. It was similar to the gentamicin-positive control (24. 1 mm vs 25. 0 mm) indicating high potency. 72 As concentrations dropped from 200 to 25 mg mL⁻1 inhibition zones decreased proportionately suggesting a concentration-dependent effect that is in line with the typical dose-response relationship for bioactive compounds. 73 This concentration-dependent activity is in line with earlier research on essential oils from Origanum vulgare and Thymus vulgaris which likewise demonstrated greater antibacterial activity at higher concentrations. 74
Furthermore, the ethyl acetate extract (EAC) demonstrated notable activity nearly matching that of EO at 200 mg mL⁻1. It was especially effective against S. pyogenes (21.1 ± 0. 46 mm) and E. coli (23.4 ± 0. 45 mm). 75 When it came to S. aureus and S. pyogenes in particular it did slightly better than the methanol extract (MeOH). 76 The MeOH extract exhibited moderate activity with inhibition zones for K. pneumoniae ranging from 17 to 20.2 mm) at 200 mg mL⁻1. Both EAC and MeOH inhibited all test organisms demonstrating the broad-spectrum antibacterial components of the extracts. 77 Other studies have reported similar broad-spectrum activity for extracts from Eucalyptus globulus and Cannabis sativa. 78
However, inhibition zones that range from 14. 4 ± 0. 17 mm for S. aureus to 17.2 ± 0. 15 mm for E. coli at 200 mg mL⁻1 exhibited the least activity. 79 It still demonstrated bacteriostatic effects against all strains of bacteria albeit to a lesser degree. This suggests that the bioactive compounds that dissolve in chloroform are either less common or less effective than those that dissolve in other solvents. 80 This is in line with research on Nigella sativa and Aloe vera where polar extracts exhibited stronger antibacterial activity than chloroform extracts. 81
However, in line with their established intrinsic tolerance to particular antimicrobial agents S. aureus and K. pneumoniae seemed to be the most resistant organisms among all extracts. EOs and EAC generally had a greater effect on E. coli. 82 Studies on Staphylococcus species and Pseudomonas aeruginosa are consistent with this pattern. where the outer membrane of Gram-negative bacteria frequently exhibits greater resistance. 83
The positive control gentamicin (10 mg/disk) produced zones of 24.2–25.7 mm while the EOs and EAC at 200 mg mL⁻1 showed similar activity with zones that were only slightly smaller. 84 This is noteworthy because even at much higher concentrations (200 mg mL⁻1) the extracts demonstrated efficacy equivalent to that of the common antibiotic. 85 Studies comparing the EOs of Lavandula angustifolia and Melaleuca alternifolia also revealed zones of inhibition that were similar to those of conventional antibiotics at higher concentrations. 86
Antioxidant Activity
The DPPH radical-scavenging assay was used to assess the antioxidant activity of the EOs and methanol (MeOH) extracts, with AA as the standard antioxidant reference. 87 An established technique for evaluating a plant extract's capacity to scavenge free radicals is the DPPH assay. It is based on the antioxidants’ capacity to donate hydrogen atoms or electrons to neutralise the stable DPPH radical, which causes a color shift detectable by spectrophotometry. 88
The concentration-dependent scavenging percentages of the EOs and MeOH extract increased steadily from 10 to 1000 µg/mL, indicating strong antioxidant activity. The EOs demonstrated the maximum scavenging activity (99.5 ± 0.31%) at the highest tested concentration (1000 µg/mL), almost completely neutralizing the DPPH radical, however, MeOH extract (92.1 ± 0.40%) and AA (89.8 ± 0.20%) neutralize DPPH less than that of EOs. The presence of strong antioxidant compounds, probably terpenoids, phenolic compounds, and other volatile constituents with free radical-neutralising qualities, is indicated by the EOs’ capacity to scavenge almost 100% of DPPH radicals at high concentrations. However, the IC₅₀ value offers a more accurate assessment of antioxidant potency. Ascorbic acid (4.7 ± 0.02 µg/mL) and EOs (10.2 ± 0.22 µg/mL) were not as effective at scavenging radicals as methanol extract, which had the lowest IC50 value (2.1 ± 0.11 µg/mL). This finding suggests that the methanol extract is more efficient per unit and uses significantly less material to reach half-maximal activity, but the EOs achieve higher maximum scavenging at higher concentrations.
The fact that the methanol extract has a higher IC50 value than AA is especially significant because AA is a well-known synthetic antioxidant that is used as a reference in these investigations. Compounds extracted with methanol exhibit remarkable radical-scavenging effectiveness, as seen by their IC50 of 2.1 µg/mL, which is around 2.2 times lower than that of AA (4.7 µg/mL). This aligns with the well-established solvent characteristics of methanol, which efficiently extracts flavonoids, tannins, polar phenolic compounds, and other secondary metabolites with potent antioxidant properties. 89
Despite their reduced efficiency (higher IC50), the EOs demonstrated a remarkable maximum scavenging capability that approached full neutralization of DPPH radicals at 1000 µg/mL. This demonstrates that, despite being less effective per unit concentration, the antioxidants in the EOs can operate in a variety of ways or, at high enough concentrations, accomplish near-total radical scavenging.. 90 The monoterpenes, sesquiterpenes, and phenylpropanoids found in essential oils often exhibit antioxidant activity through electron-transfer or hydrogen-donation mechanisms. 91
The concentration-dependent increase in scavenging activity seen for both extracts (EOs and MeOH extract) is consistent with the dose-response relationship expected by higher concentrations, which provide more antioxidant molecules to interact with and neutralize free radicals. Additionally, at lower concentrations (10-100 µg/mL), the EOs showed higher scavenging percentages than the MeOH extract; at higher concentrations (500-1000 µg/mL), the trend reversed. Both extracts showed competitive or better activity than the common antioxidant ascorbic acid (AA). In terms of maximum scavenging, the methanol extract performed better than AA (92.1% vs 89%) as well as the IC50 value (2.1 vs 4.7 µg/mL), suggesting that it could be a useful natural substitute for artificial antioxidants. Despite having a higher IC₅₀ than AA, the EOs reached a higher maximum scavenging percentage, indicating possible uses where a high level of antioxidant capacity is needed.
Correlation Between Phytochemistry and Bioactivities
Relationship Between Phenolic and Flavonoid Content and Antioxidant Activity
The methanol extract has a significantly higher phenolic and flavonoid content, which is directly related to its exceptional antioxidant activity. In comparison to ethyl acetate (TPC: 72 ± 0.22 μg GAE/mg; TFC: 91.2 ± 0.14 μg CE/mg) and chloroform extracts (TPC: 28.4 ± 0.13 μg GAE/mg; TFC: 45.3 ± 0.03 μg CE/mg), the MeOH extracts’ total phenolic content of 110.2 ± 0.03 μg GAE/mg and total flavonoid content of 130.10 ± 0.08 μg CE/mg are noticeably higher. This gradient in phytochemical content corresponds exactly to the gradient in antioxidant potency seen in the DPPH assay, where the methanol extract showed the lowest IC50 value (2.1 ± 0.11 μg/mL), significantly better than the standard antioxidant AA (IC5₀ = 4.7 ± 0.02 μg/mL) and the EOs (IC5₀ = 10.2 ± 0.22 μg/mL).
Flavonoids and other phenolic compounds have structural properties that allow them to function as efficient scavengers of free radicals. These compounds, with hydroxyl groups (-OH) linked to aromatic rings, can donate electrons or hydrogen atoms to neutralise reactive oxygen species (ROS), such as DPPH radicals. 92 Through resonance stabilisation of the phenoxy radicals generated during the antioxidant reaction, the presence of multiple hydroxyl groups, especially in flavonoid molecules, enhances this radical-scavenging ability. 93 Additionally, many flavonoids have a catechol B-ring structure that promotes electron delocalisation, thereby increasing the stability of the intermediate radical species and extending their antioxidant action. 94
The MeOH extract provides a concentrated source of these bioactive molecules due to its superior extraction efficiency for polar compounds. For this reason, its IC₅₀ value is about 4 9 times lower than that of the EOs and about 2.2 times lower than that of AA. In line with the established literature, which shows that plants high in phenolic/flavonoid content have strong free radical-scavenging properties, there is a correlation between these compounds’ content and antioxidant activity. Because MeOH is polar, it can effectively extract hydrogen-bonding phenolic compounds and flavonoids by dissolving these polar metabolites and breaking down the matrix of plant cell walls.
Interestingly, the MeOH extract showed superior efficiency at lower concentrations as indicated by its lower IC₅₀ value, even though the essential oil had a higher maximum scavenging percentage (99.5 ± 0.31% at 1000 μg/mL) than the MeOH extract (92.1 ± 0.40% at 1000 μg/mL). This phenomenon can be explained by the MeOH extracts’ highly potent phenolic antioxidants, which function effectively even at low concentrations. In contrast, the EOs requires higher concentrations to achieve comparable radical neutralisation. This could be because the EOs contains less effective antioxidant constituents or because matrix effects affect the bioavailability of active compounds in the DPPH assay system.
Relationship Between Essential Oil Composition and Antibacterial Activity
The antibacterial activity of S. gigas leaf EOs is closely correlated with its chemical composition. The GC-MS analysis revealed that the EOs is predominantly composed of monoterpene hydrocarbons, with sabinene (49.90%), α-pinene (24.20%), and β-pinene (11.40%) being the major constituents, collectively accounting for approximately 85.5% of the total oil composition. These monoterpenes are well documented for their potent antimicrobial properties and are known to disrupt bacterial cell membranes through various mechanisms.
Limitation of the Study
Although this study provides thorough information on the chemical composition and antimicrobial and antioxidant properties of solvent extracts and EOs from S. gigas leaves, it should be noted that several limitations exist. First off, although the DPPH assay is frequently used for initial antioxidant screening. Antioxidant capacity could be also assessed more comprehensively using additional complementary tests such as oxygen radical absorbance capacity (ORAC), ferric reducing antioxidant power (FRAP), and ABTS radical scavenging. Only four bacterial strains were tested for antimicrobial activity; a more thorough evaluation of the antimicrobial spectrum would be obtained by expanding the panel to include additional Gram-positive and Gram-negative pathogens, as well as fungal pathogens. The study failed to examine the cytotoxicity of the EOs and its extracts, which is crucial for assessing their safety profile for medicinal use. The retention indices and GC-MS library matches were the primary methods used to identify compounds; confirmation by comparison with authentic standards would strengthen identification of specific constituents. In EOs identification trace number of chlorinated compounds are detected. This is due to contamination of solvent In vivo biological activities, which are required to determine the safety and effectiveness of these natural products in entire organisms, were not assessed in this study. To fully utilize S. gigas's therapeutic potential, future studies should address these limitations.
Conclusion
In conclusion, the study provides an initial, thorough Evaluation of the phytochemical profile, antibacterial, antioxidant, and total phenolic and flavonoid contents of S. gigas leaves. The methanolic extract exhibited the highest levels of phenolics and flavonoids and demonstrated strong antioxidant potential, while the essential oil (EOs) showed notable antibacterial activity. GC–MS analysis of the EO revealed 15 compounds, with major constituents contributing significantly to the observed biological activities. The effectiveness of methanol in extracting polar phenolic and flavonoid compounds highlights the influence of solvent polarity on bioactivity. For future research, emphasis should be placed on bioassay-guided fractionation, safety profiling, pharmacological assessment, and clinical validation of the bioactive compounds from S. gigas. Such studies would provide a stronger scientific foundation for its traditional medicinal uses and support the development of potential therapeutic agents derived from this valuable plant species.
Footnotes
Acknowledgements
Debre Tabor University provided financial assistance for this investigation. The writers are grateful to Debre Tabor University for supporting the GC-MS investigation and to Bahir Dar University for supporting the UV-Vis study and the investigation of antibacterial activity.
Ethical Approval
Ethical Approval is not applicable to this article.
Statement of Human and Animal Rights
This article does not contain any studies with human or animal subjects.
Statement of Informed Consent
There are no human subjects in this article, and informed consent is not applicable.
Authors’ Contributions
Mequanint Molla Yitayeh performed writing- Original draft preparation, Data curation. Rakesh Kumar Bachheti and Archana Bachhet made draft preparation and Data curation; Limenew Abate Worku performed investigation, Investigation, formal analysis, and Supervision. All authors reviewed the manuscript.
Funding
The authors received no financial support for the research, authorship, and/or publication of this article.
Declaration of Conflicting Interests
The authors declared no potential conflicts of interest with respect to the research, authorship, and/or publication of this article.
Data Availability
The datasets generated and/or analysed during the current study are available within the manuscript.