
Abstract
Background
Colorectal cancer (CRC) is a leading cause of cancer-related mortality worldwide. Statins, widely prescribed lipid-lowering agents, have been suggested to possess anticancer activity; however, their precise mechanisms in CRC remain poorly defined.
Methods
This study employed an integrated in silico–in vitro approach to investigate the therapeutic potential of Simvastatin and Lovastatin in CRC. Network pharmacology analysis identified hub genes linking the mevalonate pathway, lipid biosynthesis, and apoptosis regulation. Molecular docking was performed to assess binding affinities, followed by molecular dynamics (MD) simulations and MM-PBSA free energy calculations for stability and binding strength evaluation. In vitro cytotoxicity was validated using HCT116 and HT-29 colorectal cancer cell lines.
Results
Five hub genes (HMGCR, CYP51A1, FDFT1, SCD, and LCK) were identified as key targets. Docking studies revealed strong binding affinities, with scores of −8.4 kcal·mol−1 for Simvastatin–3LCK, −9.5 kcal·mol−1 for Lovastatin–3WEG, and −9.4 kcal·mol−1 for Lovastatin–8SBI complexes. MD simulations indicated stable binding of Simvastatin with 3LCK, characterized by minimal RMSD and SASA fluctuations, whereas Lovastatin displayed higher flexibility. MM-PBSA analysis demonstrated robust binding free energies for Lovastatin–3WEG (–64.73 kcal·mol−1) and Simvastatin–3LCK (–56.47 kcal·mol−1). In vitro assays confirmed a dose-dependent reduction in cell viability, with IC50 values of 8.9 ± 0.17 μM (Simvastatin) and 12.6 ± 0.32 μM (Lovastatin) in HCT116, compared with 14.4 ± 0.15 μM and 18.7 ± 0.53 μM in HT-29 cells, respectively.
Conclusion
This integrated study demonstrates that Simvastatin and Lovastatin exert cytotoxic effects in CRC cells by targeting metabolic and apoptotic pathways. Simvastatin showed superior activity compared with Lovastatin.
Introduction
Cancer is a predominant contributor to global morbidity and mortality, arising from the dysregulation of crucial signalling pathways. Colorectal cancer (CRC), which originates in the mucosal epithelium of the colon, constitutes a prevalent malignant tumor within the gastrointestinal tract and ranks as the third leading cause of cancer-related death. 1 CRC accounts for about 10% of all cancer cases. 2 “The American Cancer Society estimates that around 154,270 new cases of colorectal cancer will be diagnosed in the US in 2025, with 52,900 deaths resulting from the disease”. The existing treatment modalities—namely chemotherapy, radiation therapy, and surgical intervention—underscore the critical need for innovative therapeutic approaches. 3 Recent trends are green nanoparticle synthesis for the treatment of cancer. 4 There is an imperative for the development of safer and more effective treatment strategies that mitigate adverse side effects while complementing existing therapeutic frameworks. There are many potential therapeutic agents, who exhibit diverse effects on the signalling pathways of cancer cells. 5
Research has demonstrated that Simvastatin induces pyroptosis, a form of programmed cell death, in colon cancer cells through the activation of the reactive oxygen species (ROS)/caspase-1/GSDMD signalling pathway, thereby contributing to its anticancer properties. Treatment with Simvastatin has been shown to reduce CRC cell viability and enhance sensitivity to radiation in vitro. These effects are linked to the depletion of GGPP and a decrease in the phosphorylation of ERK1/2, indicating a significant interplay with the EGFR-RAS-ERK1/2 pathway. Additionally, Simvastatin may help overcome cetuximab resistance in colon cancer cells harbouring KRAS mutations by modulating BRAF activity and promoting apoptosis. 6
Lovastatin, in a complementary manner, has been observed to disrupt mitochondrial function, resulting in the depolarization of the mitochondrial membrane potential, a reduction in oxygen consumption, and compromised integrity of mitochondrial DNA (mtDNA) in human colorectal cancer cells. This mitochondrial dysfunction significantly elevates the production of ROS. 7 Numerous in vitro studies support the assertion that Lovastatin possesses a substantial inhibitory effect on the viability of cancer cells across various neoplastic conditions, including colorectal cancer. 8 Moreover, the use of autophagy inhibitors has been found to enhance the susceptibility of KRAS-mutant human colorectal cancer cells to a combination treatment involving 2-deoxy-D-glucose and Lovastatin, thus suggesting a potential strategy for combination therapies.9,10
Drug repurposing has emerged as a pivotal strategy in cancer research, offering a rapid and cost-effective alternative to de novo drug discovery. 11 By redirecting clinically approved drugs with established pharmacological and safety profiles, repurposing minimizes the financial burden, reduces the risk of unexpected toxicity, and accelerates translation into clinical practice. This approach is particularly valuable in CRC, where therapeutic resistance and adverse effects limit the success of conventional chemotherapeutics. Statins, widely prescribed as cholesterol-lowering agents, have shown anticancer activity in various cancers, including CRC. However, most existing studies are limited to experimental findings, and the comprehensive mechanisms connecting statin targets, apoptotic signalling pathways, and tumor-specific gene regulation remain underexplored. This study hypothesizes that Simvastatin and Lovastatin exert anticancer effects in CRC by modulating apoptosis-associated hub proteins identified through an integrated network pharmacology approach, followed by validation of binding and dynamic stability through molecular docking, molecular dynamics (MD) simulations, and Molecular Mechanics/Poisson–Boltzmann Surface Area (MM-PBSA) analysis. Furthermore, the in-silico results are validated through an in-vitro cell line study. By bridging gene-level dysregulation with protein-ligand dynamics, our work provides new insights into how these statins differentially engage apoptotic targets, offering a mechanistic framework for their repurposing in CRC therapy.
Materials and Methods
Screening for Molecular Properties, Bioactivity, and Toxicity Profiling of Simvastatin and Lovastatin
The 3D structures of Simvastatin and Lovastatin were obtained from the PubChem database (http://pubchem.ncbi.nlm.nih.gov/) through a comprehensive search for information regarding these pharmaceuticals and their cancer-related characteristics. The MoleSoft L.L.C. platform (http://molsoft.com/) enables users to utilize a SMILES query to ascertain the molecular characteristics and drug similarity scores associated with each compound. Furthermore, pkCSM employs computer models based on data from both in vitro and in vivo studies to predict the toxicity and metabolic stability of the compounds. 12 The PerMM server was utilized to forecast cell membrane permeability. 13
Colorectal Cancer Genes and Target
The GeneCards database (https://www.genecards.org/) provided the target genes associated with colorectal cancer. Only Homo sapiens target genes were included, and duplicate entries were removed to ensure precision. The selection criteria for cancer-related genes from the GeneCards database focused on genes with established roles in colorectal cancer pathogenesis and progression. Specifically, we prioritized genes that were reported as mutated, differentially expressed, or functionally implicated in various types of colorectal cancer. To ensure the biological relevance and integrity of the network, pseudogenes and uncategorized genes identified within the GeneCards search results were explicitly removed. This rigorous filtering process ensured that the generated gene-disease network was relevant and enriched with key genes in colorectal cancer development. Additionally, the relevant score was set > 30 to include the maximum number of closely related genes. The search term was “Colorectal cancer”. Subsequently, the Venny 2.1 web tool (https://bioinfogp.cnb.csic.es/tools/venny/) was employed to identify the intersection between the target genes predicted by the SwissTargetPrediction server (http://www.swisstargetprediction.ch/) for Simvastatin and Lovastatin those associated with colorectal cancer (Supplementary file, Figure S1). The intersecting targets were further evaluated to identify potential therapeutic targets for colorectal cancer.
Drug-Protein Network Construction and Analysis
STRING (https://string-db.org/) is an online biological database that predicts protein-protein interactions (PPIs) pertinent to colorectal cancer. This resource utilizes active drugs and their respective targets concerning Simvastatin and Lovastatin to construct a network of drug-target genes, thereby elucidating the mechanisms by which terfenadine and domperidone act against CRC. The fundamental properties of the network are assessed using the network analyzer function, and the network undergoes filtering according to the degree of connected nodes for enhanced analysis. Targets relevant to Homo sapiens are identified based on a network confidence value of 0.7.
PPI Network Construction
The construction of the protein-protein interaction (PPI) network for colorectal cancer genes employs the STRING database, which also analyzes the functional relationships among proteins. Core targets for colorectal cancer are determined using the CytoHubba plug-in to develop a regulatory network, wherein the prominence of the highest degree targets highlights strong correlations among the targeted genes. 14
Gene Ontology (GO) and KEGG Pathway Enrichment Analysis
GO analysis represents a vital approach for the examination of genomic data, especially concerning large-scale transcriptome data. This analysis investigates potential targets within three categories: Biological Process (BP), Cellular Component (CC), and Molecular Function (MF). The ShineyGo 0.82 (https://bioinformatics.sdstate.edu/go/) was utilized for KEGG and GO enrichment analysis to enhance the understanding of the roles played by common targets associated with Simvastatin and Lovastatin and colorectal cancer. The GO and KEGG enrichment studies yielded significant findings regarding GO terms and KEGG pathways. The interpretations of the pathway enrichment analysis results were conducted using a bioinformatics web platform. All the plots and analytical results were obtained applying the default parameter of ShineyGo 0.82 server (FRD cut off = 0.05, pathway to show = 20, pathway size minimum = 2, and maximum = 5000).
Network of Target Compounds and Pathways
Data for the KEGG pathway analysis of the top hub genes was extracted from the ShineyGo 0.82, and a network was constructed to explore the mechanisms of these drugs within the relevant pathways.
Immunohistochemistry Selected Genes
The immunohistochemical staining results of hub genes in colorectal cancer tissues were obtained utilizing data from the Human Protein Atlas (HPA) database (https://www.proteinatlas.org/). 15
DNA Methylation and Gene Expression Analysis of Selected Hub Genes
The DNA methylation levels of hub gene targets were analyzed using the UALCAN database (https://ualcan.path.uab.edu/), while the correlation of gene mRNA expression was explored through the Gene Set Cancer Analysis (GSCA) database, thereby further substantiating the reliability of the identified hub genes.16,17
Molecular Docking
Protein Selection and Preparation
The protein selection was carried out using network pharmacology, where potential receptor proteins interacting with Simvastatin and Lovastatin were identified. After identifying the target proteins, the structures of five receptors—3LCK, 18 1DQ8, 19 3WEG, 20 8SBI, 21 and 4ZYO 22 —were obtained from the Protein Data Bank (PDB). The selected proteins (3LCK, 3WEG, 8SBI, 1DQ8, and 4ZYO) were prioritized based on their identification as hub genes in the PPI network (LCK, HMGCR, CYP51A1, FDFT1, and SCD) and their high-resolution structural availability in the PDB. Furthermore, above 90% amino acids in all the selected proteins were in the allowed region in the Ramachandran plot. These proteins play central roles in apoptosis and lipid metabolism, making them highly relevant for statin-based modulation in CRC. These proteins were then pre-processed by removing water molecules, bound ligands, and other heteroatoms that were not relevant for docking. This preprocessing step was performed using Discovery Studio Visualizer 2021 to clean and prepare the proteins for docking simulations. 23
Ligand Preparation
The ligands, Simvastatin and Lovastatin, were prepared for docking by acquiring their 3D structures in SDF format. The ligands were then optimized for docking by ensuring they are in the correct protonation state and appropriate 3D geometries. MMFF96 force field was used to minimize the energy of ligands. In PyRx v0.8, the ligands were converted into a format suitable for docking (PDBQT), ensuring that all necessary parameters were included (Figure 1). 24
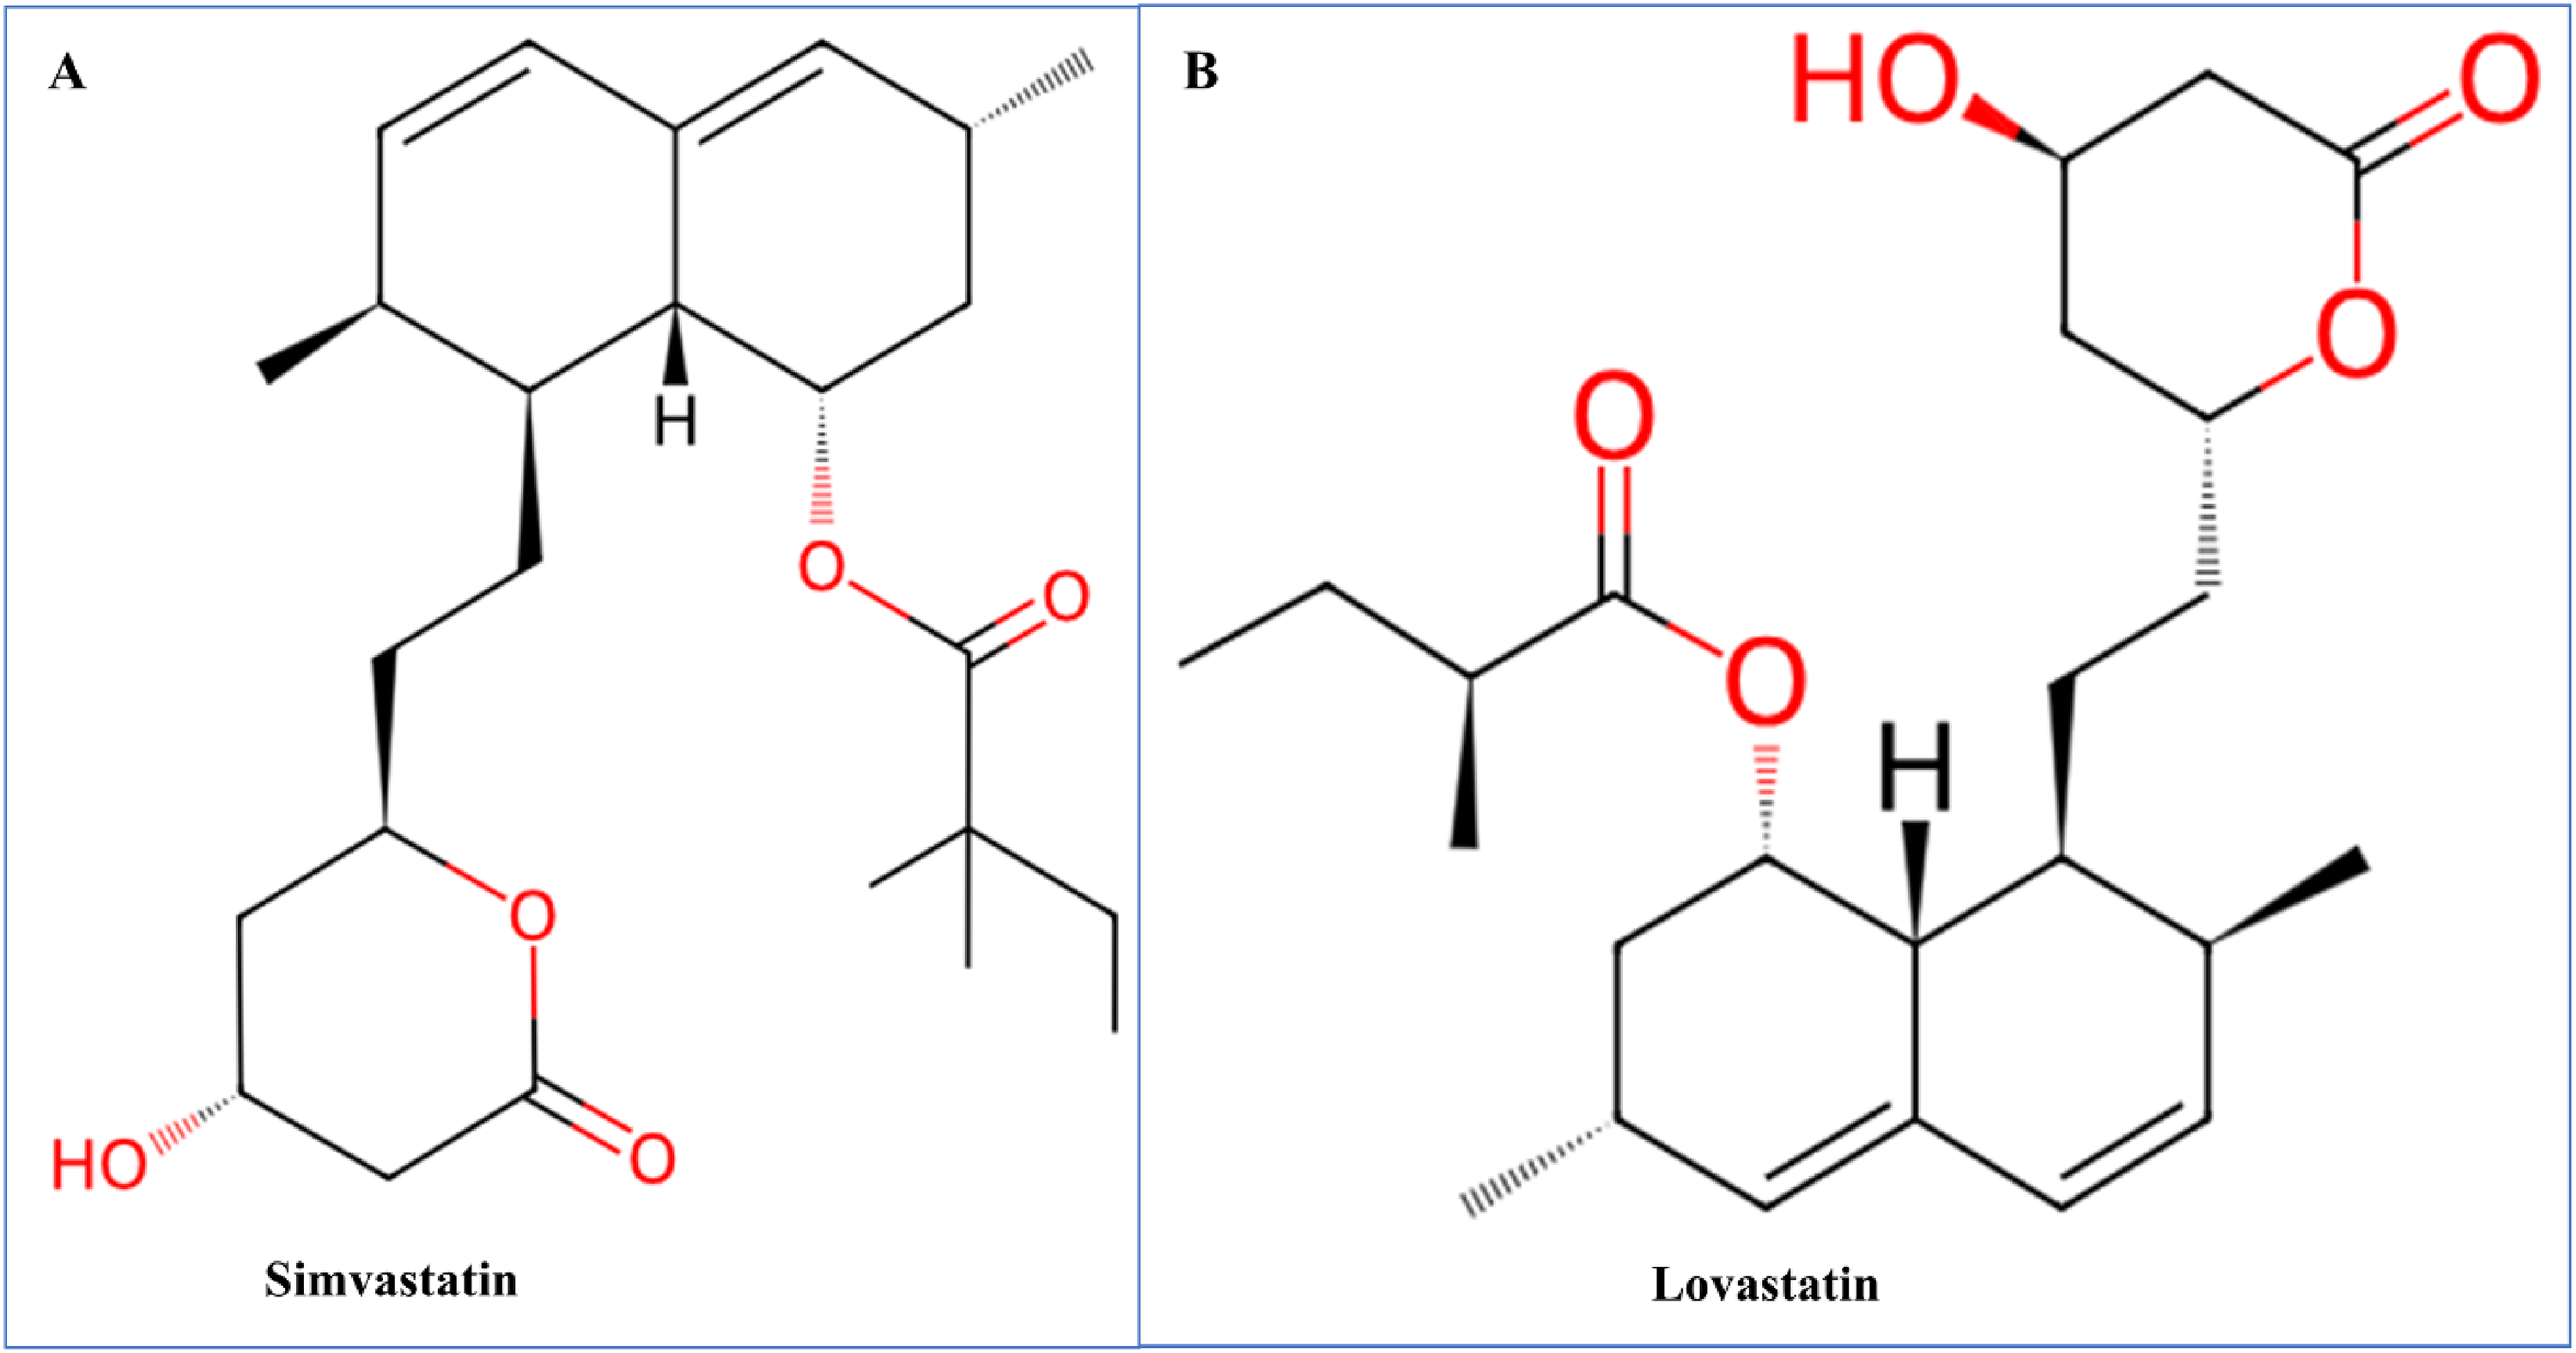
2D structure of Simvastatin (A) and Lovastatin (B). Red color represents the oxygen atom.
Setting Up the Docking Grid
For each receptor, a docking grid was defined to specify the region where the ligands would interact with the protein. This step involved setting the grid box's center and size based on the provided coordinates and dimensions. The grid parameters were given in Table 1. The grid box parameters were input into PyRx v0.8 to define the regions of interest for docking. The grid ensured that the ligands would interact with the relevant parts of the receptor proteins. 25
Grid Coordinates Used in Docking.

Docking Setup
Once the receptor proteins and ligands were prepared, the docking setup was initiated in PyRx v0.8. The exhaustiveness parameter was set to 8 to ensure a thorough docking search, improving the precision of the results. This exhaustiveness setting dictated the number of times the docking search was repeated, balancing accuracy and computational time.
Running the Docking Simulation
The docking simulations were run in PyRx v0.8, which integrated AutoDock Vina for the docking process. For each receptor-ligand pair, PyRx v0.8 generated a set of docking poses and calculated the binding energies. These docking poses were stored as output files, which could then be analyzed to assess the binding efficiency and interaction strength between the ligands (Simvastatin and Lovastatin) and the receptor proteins. 26
Analysis of Results
After the docking simulations were completed, the results were analyzed by examining the binding poses and binding energies of the ligands in the receptor binding sites (Discovery Studio Visualizer 2021). The output files contained the docking scores and detailed interaction information, which were used to determine the most stable ligand-receptor binding conformations. This allowed for the comparison of how well Simvastatin and Lovastatin bound to each receptor. 27
MD Simulation
MD simulations provide valuable insights into ligand behavior by analysing various statistical properties to assess its stability within the protein binding site. The optimal docked pose of the compound was selected as the starting point for a 100 ns MD simulation, using the GROMACS-2023 software with the CHARMM36 force field. The complex was solvated in a cubic box (100 × 100 × 100 Å) with a 10 Å buffer between the protein and box walls, using the TIP3P water model. Ionization and neutralization were carried out at pH 7.0 by adding Na + and Cl− ions via the Monte-Carlo ion placement method. 28 The MD simulation was conducted in three stages: minimization, equilibration, and production. During minimization and equilibration, a 1000 kJ/mol·nm² force constant was applied to constrain heavy atoms and preserve the protein's original folding. The minimization step used the steepest descent algorithm for 5 ps to optimize the system's structure. Equilibration involved 125 ps under the NVT ensemble, followed by 125 ps under the NPT ensemble. The Parrinello-Rahman barostat and Berendsen temperature coupling method-controlled pressure and temperature, respectively. Finally, the production phase ran for 100 ns under the NPT ensemble, maintaining isothermal and isobaric conditions at 300 K and 1 atm pressure. The time step for the simulation was set to 2.0 fs.29,30 “The trajectories generated from the simulation were stored every 100 ps. These trajectories were used to compute RMSD, root mean square fluctuation (RMSF), solvent accessible surface area (SASA), radius of gyration, and number of hydrogen bonds”. 31 Plots and visual inspection of the trajectories were done using XMgrace and VMD, respectively.
Principal Component Analysis (PCA)
The PCA was performed to explore the dominant collective motions of the protein–ligand complex during the MD simulation. The analysis was carried out on the covariance matrix constructed from the mass-weighted Cartesian atomic coordinates of Cα atoms, after removing global translational and rotational motions using GROMACS software. The covariance matrix was diagonalized to obtain eigenvalues and eigenvectors, with the first few eigenvectors (principal components) representing the directions of largest atomic fluctuations. The MD trajectory was then projected onto the first two principal components (PC1 and PC2), which capture the most significant modes of motion. These projections were used for both visual and quantitative assessments of conformational variability and structural stability over time. 32
Probability Density Function (PDF) Analysis
To investigate the frequency and distribution of conformational states sampled during the MD simulation, a 2D probability density map was generated based on the projections of the trajectory along PC1 and PC2. A kernel density estimation (KDE) was applied to the PCA-projected data to construct a smoothed probability distribution. The resulting map highlights regions of high and low conformational occupancy, where higher-density areas indicate frequently sampled, stable states, and lower-density regions correspond to less populated or transient conformations. This analysis enables a clear visualization of the system's conformational landscape and helps identify the dominant structural ensembles. A viridis color map was used, in which dark purple indicates low-probability regions (less visited conformations) and yellow indicates high-probability regions (dominant conformations). 33
Free Energy Landscape (FEL) Analysis
The FEL of the system was constructed based on the PCA projections using the Boltzmann inversion of the probability distribution. The free energy at each point in the PC1–PC2 space was calculated using equation 1.
Where P(x,y) is the probability of the system adopting a conformation at position (PC1 = x, PC2 = y), R is the universal gas constant (8.314 J·mol−1·K−1), and T is the temperature. The resulting landscape reveals the energy basins and barriers between different conformational states, with deeper basins indicating more thermodynamically stable conformations. The FEL was visualized as a contour map to facilitate identification of global and local minima, reflecting the system's structural preferences and stability throughout the simulation. Viridis gradient color code was used for visual clarity, where: dark purple regions represent low free energy (stable conformations) and bright yellow/green regions represent high free energy. 34
MM-PBSA Calculations
The MM-PBSA calculations were carried out using the gmx_MMPBSA tool integrated with the GROMACS 2023 package to estimate the binding free energy of the protein–ligand complexes. The analysis was performed on the last 50 ns of the equilibrated MD trajectories; sampling frames every 100 ps. The calculations employed a solute dielectric constant (ε_in) of 2 and a solvent dielectric constant (ε_out) of 80, representing a physiological aqueous environment. The ionic strength was set to 0.15 M NaCl, mimicking physiological saline conditions. The total binding free energy (ΔG_binding) was computed as the sum of the van der Waals, electrostatic, polar solvation, and nonpolar solvation energy components according to the standard MM-PBSA scheme. The entropic contribution (TΔS) was not included, consistent with the single-trajectory approximation commonly adopted in such analyses, since it primarily affects absolute rather than relative binding energy trends. This approach provides reliable comparative insights into the stability and binding strength of the investigated complexes under uniform simulation conditions. The following formulas are used to compute the binding free energy (ΔGbinding) in MM-PBSA between a ligand and a receptor to form a complex (equations 2 to 5).


“Where the system's binding free energy is represented by ΔGbinding, the overall energy of the protein-ligand complex is indicated by the Gcomplex, and the free energies of the protein and ligand in solvents are indicated by the receptor and ligand, respectively. Van der Waals (ΔEVDW) and electrostatic (ΔEELE) energies are also included in the representation of the gas phase interaction energy, which is denoted by ΔEMM. The polar and nonpolar desolvation energy contributions were ascertained using SASA and PB, respectively. The polar and nonpolar components of the desolvation free energy are represented by ΔGsolvation. TΔS represents the change in conformational entropy during ligand binding, where T is the absolute temperature and ΔS is the entropy change. However, in a real application, it is more common to simply mimic the complex state that leads to the cancellation of ΔEINT. As a result, the binding free energy calculation equation is changed to equation 6”.
35
The last 50 ns frames were used for MM-PBSA analysis.
MTT Cell-Viability Assay
HCT116 and HT-29 cells were maintained in DMEM with 10% FBS and 1% penicillin/streptomycin at 37 °C, 5% CO2. Cells were seeded in 96-well plates (5-8 × 10³ cells/well, 24 h adherence). Simvastatin and Lovastatin were prepared as 10 mM DMSO stocks and diluted in complete medium to final concentrations of 0.1, 0.3, 1, 3, 10, 30, 40 μM; vehicle was 0.1% DMSO. After 48 h of treatment, 10 μL of MTT (5 mg/mL) was added (0.5 mg/mL) and incubated for 3 h. Medium was removed and formazan was solubilized in 100 μL DMSO with gentle shaking (10-15 min). Absorbance was read at 570 nm. Each condition was assayed in triplicate wells and repeated in ≥3 independent experiment. Percent viability was normalized to vehicle controls. Cell viability (%) was calculated relative to untreated controls, and results were expressed as mean ± SD of at least three independent experiments. The IC50 values were determined by nonlinear regression analysis using Microsoft Excel 2019, and results were presented as mean ± SD from at least three independent experiments performed in triplicate. 3
Statistical Analysis
All the statistical analyses were conducted through the default system of the respective docking and MD simulation software.
Results
Molecular Properties and Pharmacokinetic Properties of Simvastatin and Lovastatin
The table provides an analysis of key physicochemical parameters that influence the membrane permeability of two statin drugs, Simvastatin and Lovastatin, using various model systems and computational approaches. The free energy of binding to a DOPC membrane reveals that Simvastatin has a stronger affinity with a ΔG of −6.85 kcal·mol−1 compared to Lovastatin's −6.15 kcal·mol−1, indicating better potential for membrane partitioning. Moreover, the log permeability coefficient in a black lipid membrane model shows Simvastatin (2.08) outperforms Lovastatin (1.17), suggesting more efficient transmembrane diffusion. While both drugs exhibit negative logPo values for blood-brain barrier penetration—Simvastatin at −2.16 and Lovastatin at −2.48—Simvastatin shows slightly higher permeability, hinting at better central nervous system exposure. In the Caco-2 cell model, Simvastatin further demonstrates superior permeability (−2.95) compared to Lovastatin (−3.18), indicating enhanced intestinal absorption. In the PAMPA-DS assay, Simvastatin achieves a positive permeability value (0.69), while Lovastatin presents a negative value (−0.15), underscoring Simvastatin's favourable passive diffusion under physiological conditions (Table 2 and Figure 2A & B). The supplementary file provides the details of pharmacokinetic and toxicity data (Tables 1S to 4S).

Translocation pathway of Simvastatin (A) and Lovastatin (B). The plots of differentially expressed genes (C) and volcano plots of upregulated and downregulated genes by the SR plot server (D).
Cell Permeability Through Transmembrane Reports.
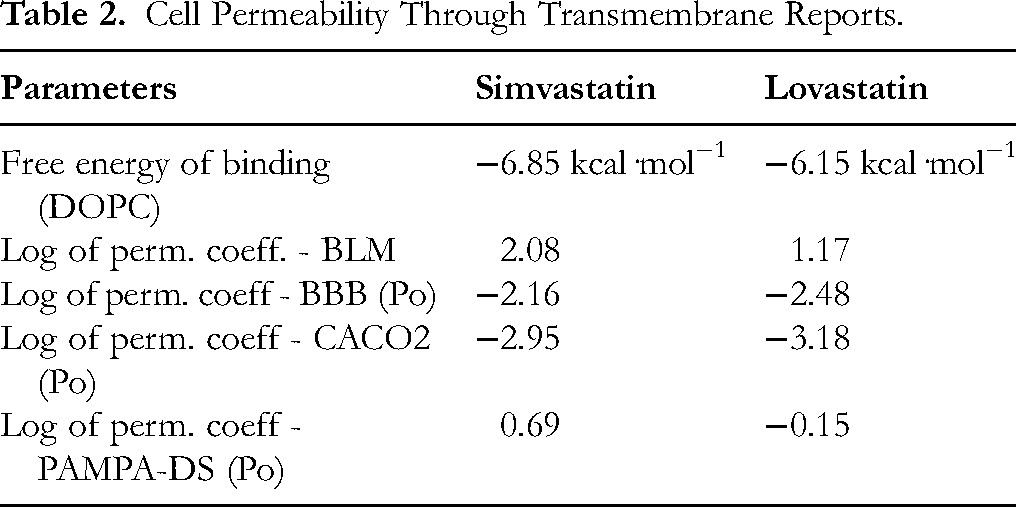
Figure 2C illustrates the chromosomal distribution of genes, emphasizing over-expressed genes in red and under-expressed genes in green across all human chromosomes, as based on the GRCh38.p2 genome assembly. This delineates genome-wide transcriptional alterations and identifies chromosomal regions that warrant further investigation. Similarly, Figure 2D presents a volcano plot that contrasts the significance (−log10 p-value) with expression change (log2 fold change) for each gene. This analysis identified 2679 significantly downregulated genes (depicted in blue) and 2658 significantly upregulated genes (depicted in red), while a subset of genes remains non-significant (represented in gray). Noteworthy genes exhibiting substantial fold changes and statistical significance were annotated for their potential biological relevance. These visualizations serve to identify candidate genes for subsequent functional pathway analysis.
Targeted Common Genes
Figure 3A shows a Venn diagram illustrating the overlap between the genes targeted by Simvastatin, Lovastatin, and those found in GeneCard, along with the differentially expressed genes (DEGs). It highlights the small number of genes common to both Simvastatin and Lovastatin (14 genes), suggesting a modest overlap in their effects. The majority of the genes in the dataset are found in GeneCard, with a significant number of DEGs (4232 genes, 8.3%) and a smaller portion of 1054 genes (2.1%) specific to Lovastatin. This illustrates that while there is some overlap, both statins likely act on distinct sets of genes, which might suggest different molecular pathways involved. PPI network for the identified genes indicates how genes are interrelated in cellular processes. The PPI network shows interactions between key proteins, including LCK, HMGR, CYP51A1, FDFT1, and SCD (Figure 3B). These interactions may represent critical pathways influenced by both statins, pointing to potential targets for therapeutic intervention. The strength of the interactions is visually encoded with different node colors and edges, highlighting the complex relationships between proteins. Figure 3C further refines this by focusing on the key hub genes identified using the degree method. These genes are central to the PPI network and include HMGR, LCK, CYP51A1, FDFT1, and SCD, each playing pivotal roles in lipid metabolism, cell signalling, and other essential cellular processes. The identification of these hub genes provides a more focused list of targets that could be of therapeutic significance for diseases like colorectal cancer.

Identification of common targets and hub genes associated with Simvastatin and Lovastatin in colorectal cancer. Venn diagram showing the overlap of target genes among Simvastatin, Lovastatin, and GeneCards database, highlighting 49 common targets (A). PPI network constructed from the common targets, illustrating the interconnectivity and functional associations among key proteins (B). Hub genes (CYP51A1, HMGCR, FDFT1, SCD, and LCK) were identified using the degree centrality method, representing the most significant nodes within the PPI network (C).
Protein-Protein Interaction Analysis
The protein interaction network comprises 24 proteins (nodes) and 8 interactions (edges), yielding an average node degree of 0.667, which indicates that, on average, each protein interacts with fewer than one other protein. Among the proteins, FDFT1 and CYP51A1 each have two connections, while SCD has one, and LCK and HMGCR exhibit three connections, positioning them as the most significant proteins based on their degree of connection. The proteins display a modest tendency to form closely related clusters, as evidenced by an average local clustering coefficient of 0.347. The network possesses a PPI enrichment p-value of 0.003, which suggests a substantially greater number of interactions than would be expected in a random network of equivalent size, which would typically exhibit approximately two edges. The low p-value indicates a physiologically relevant network with potentially significant functional connections among these proteins, suggesting that the observed interactions are unlikely to have occurred by chance.
Raw Genes Used for Fold Enrichment Analysis
The list of 24 genes—HMGCR, TACR2, HDAC6, KCNK3, PDE2A, MERTK, S1PR3, SCD, FDFT1, CYP51A1, SMYD2, AXL, GSK3B, S1PR1, KIF11, PDE4D, HSD17B3, ACKR3, LCK, ABL1, KIT, IDH1, SYK, and MST1R—represents the intersection of drug targets (from our selected statins) and genes implicated in colorectal cancer. These genes were identified through our network pharmacology approach as being critically involved in both the mechanism of action of the drugs and the pathogenesis of colorectal cancer. The subsequent enrichment analysis was performed using this specific set of common drug-cancer genes to identify significantly overrepresented biological pathways and functions relevant to this intersection, thereby guiding our investigation into the potential repurposing of these drugs for colorectal cancer treatment.
KEGG Pathways for Disease Mechanism Analysis
The analysis based on KEGG pathways revealed that the identified target genes play a significant role in critical metabolic processes associated with the survival and proliferation of cancer cells (Table 3). The pathways exhibiting the highest enrichment include steroid biosynthesis (Fold enrichment: 228.8), terpenoid backbone biosynthesis (Fold enrichment: 199), and unsaturated fatty acid biosynthesis (Fold enrichment: 169.5), with an enrichment false discovery rate (FDR) of 2.2E-02.
KEGG Pathway for Colorectal Cancer of Selected hub Genes.

Gene Ontology Pathways for Disease Mechanism Analysis
From the perspective of biological processes, GO identified several key pathways associated with metabolic regulation and disease mechanisms (Figure 4A and B). A significant enrichment of genes involved in the negative regulation of amyloid-beta clearance is apparent (Fold enrichment: 610.2; FDR: 1.5E-04), indicating an intriguing link between the identified genes and neurodegenerative processes. Given the overlap in signalling pathways, this relationship may also be relevant in the context of cancer biology. The processes of secondary alcohol biosynthesis and cholesterol biosynthesis exhibited a fold shift of 254.2 and a notably significant FDR of 2.0E-05 (Supplementary file, Table S5). These findings support a therapeutic rationale to target these metabolic pathways in colorectal cancer, highlighting the critical role of lipid metabolism in promoting membrane production and signalling in proliferating tumor cells.

GO enrichment analysis of colorectal cancer-related genes. Enriched biological processes include amyloid-beta clearance, cholesterol/sterol biosynthesis, alcohol metabolism, and small molecule biosynthesis (A). Enriched cellular components are mainly associated with the pericentriolar material, endoplasmic reticulum (ER) membrane and subcompartments, and organelle membranes (B). Dot size represents the number of genes, while color intensity indicates statistical significance (−log10[FDR]).
The cellular component enrichment analysis indicated that the target proteins are predominantly localized within vital intracellular structures. With a fold enrichment of 208 and an FDR of 2.6E-02, the pericentriolar material may play a role in cell cycle progression and microtubule organization, both of which are frequently dysregulated in cancer (Supplementary file, Table S6). Additionally, the endoplasmic reticulum (ER) membrane and its subcompartments displayed significant enrichment, with four genes associated with each, yielding a fold enrichment of 13.5 (FDR: 7.8E-04). These results suggest that lipid production, protein processing, and signalling associated with the ER may be mediated by the identified targets, processes that are essential for cancer cell homeostasis and the stress response.
Furthermore, molecular function enrichment analysis demonstrated that enzymatic activities related to lipid metabolism are considerably prominent. Notably, stearoyl-CoA 9-desaturase activity showed the highest fold enrichment (1525.4) with a fold enrichment of 1144 and an FDR of 1.1E-02. This was followed by farnesyltransferase activity and acyl-CoA desaturase activity (Supplementary file, Table S7). These enzymes are essential for the desaturation and prenylation of lipids, which are critical for cancer cell signalling, protein localization, and membrane fluidity. The prevalence of these molecular processes underscores the potential of targeting lipid metabolic enzymes as a promising therapeutic strategy for COAD.
Immunohistochemistry of LCK, HMGCR, FDPS, and CYP51A1 Genes
The data illustrate varying expression intensities of these proteins across distinct patient samples, indicating a heterogeneous localization and abundance of these proteins within tumor tissues. This analysis underscores the differential expression patterns that may signify the functional significance of these genes in the pathophysiology of colorectal cancer (Figure 5A to D).

Immunohistochemistry of A (LCK, HPA003494 Female, age 84, Colon (T-67000) Adenocarcinoma, NOS (M-81403)), B (HMGCR, HPA008338 Female, age 84, Colon (T-67000) Adenocarcinoma, NOS (M-81403)), C (FDPS HPA008874 Male, age 45, Colon (T-67000) Adenocarcinoma, NOS (M-81403)), and D (CYP51A1, HPA043508 Male, age 71, Colon (T-67000) Adenocarcinoma, NOS (M-81403)) genes.
Methylation and Its Correlation with Gene Expression
The mRNA expression levels of four genes—LCK, HMGCR, FDFT1, and CYP51A1—comparing normal tissues with primary tumor samples are presented in Figure 6A to D. The boxplots indicate a significant upregulation of these genes in tumor tissues (depicted in red) compared to normal tissues (depicted in blue). Notably, FDFT1 and SCD exhibit significantly higher expression levels in tumor samples, suggesting their possible roles in the tumorigenesis or progression of CRC. While LCK and HMGCR also show increased expression, the differences are less pronounced, and CYP51A1 displays moderate elevation. Figure 7 examines promoter methylation levels of the same set of genes in CRC. The boxplots illustrate a consistent pattern of hypomethylation in tumor samples relative to normal tissues, particularly for LCK, HMGCR, and FDFT1. This reduction in methylation likely contributes to the heightened gene expression observed in Figure 6, as hypomethylation of promoter regions typically leads to transcriptional activation. Furthermore, the correlation plot in Figure 7 illustrates the relationship between promoter methylation and mRNA expression for the selected genes. The size and color of the dots reflect the strength and direction of the correlation. Genes such as FDFT1, HMGCR, and SCD show a strong negative correlation, suggesting that reduced methylation is associated with increased expression. This finding lends support to the hypothesis of epigenetic regulation in CRC. These results indicate that the hypomethylation-driven overexpression of these genes may play a vital role in the pathology of CRC, positioning them as potential biomarkers or therapeutic targets for future interventions.
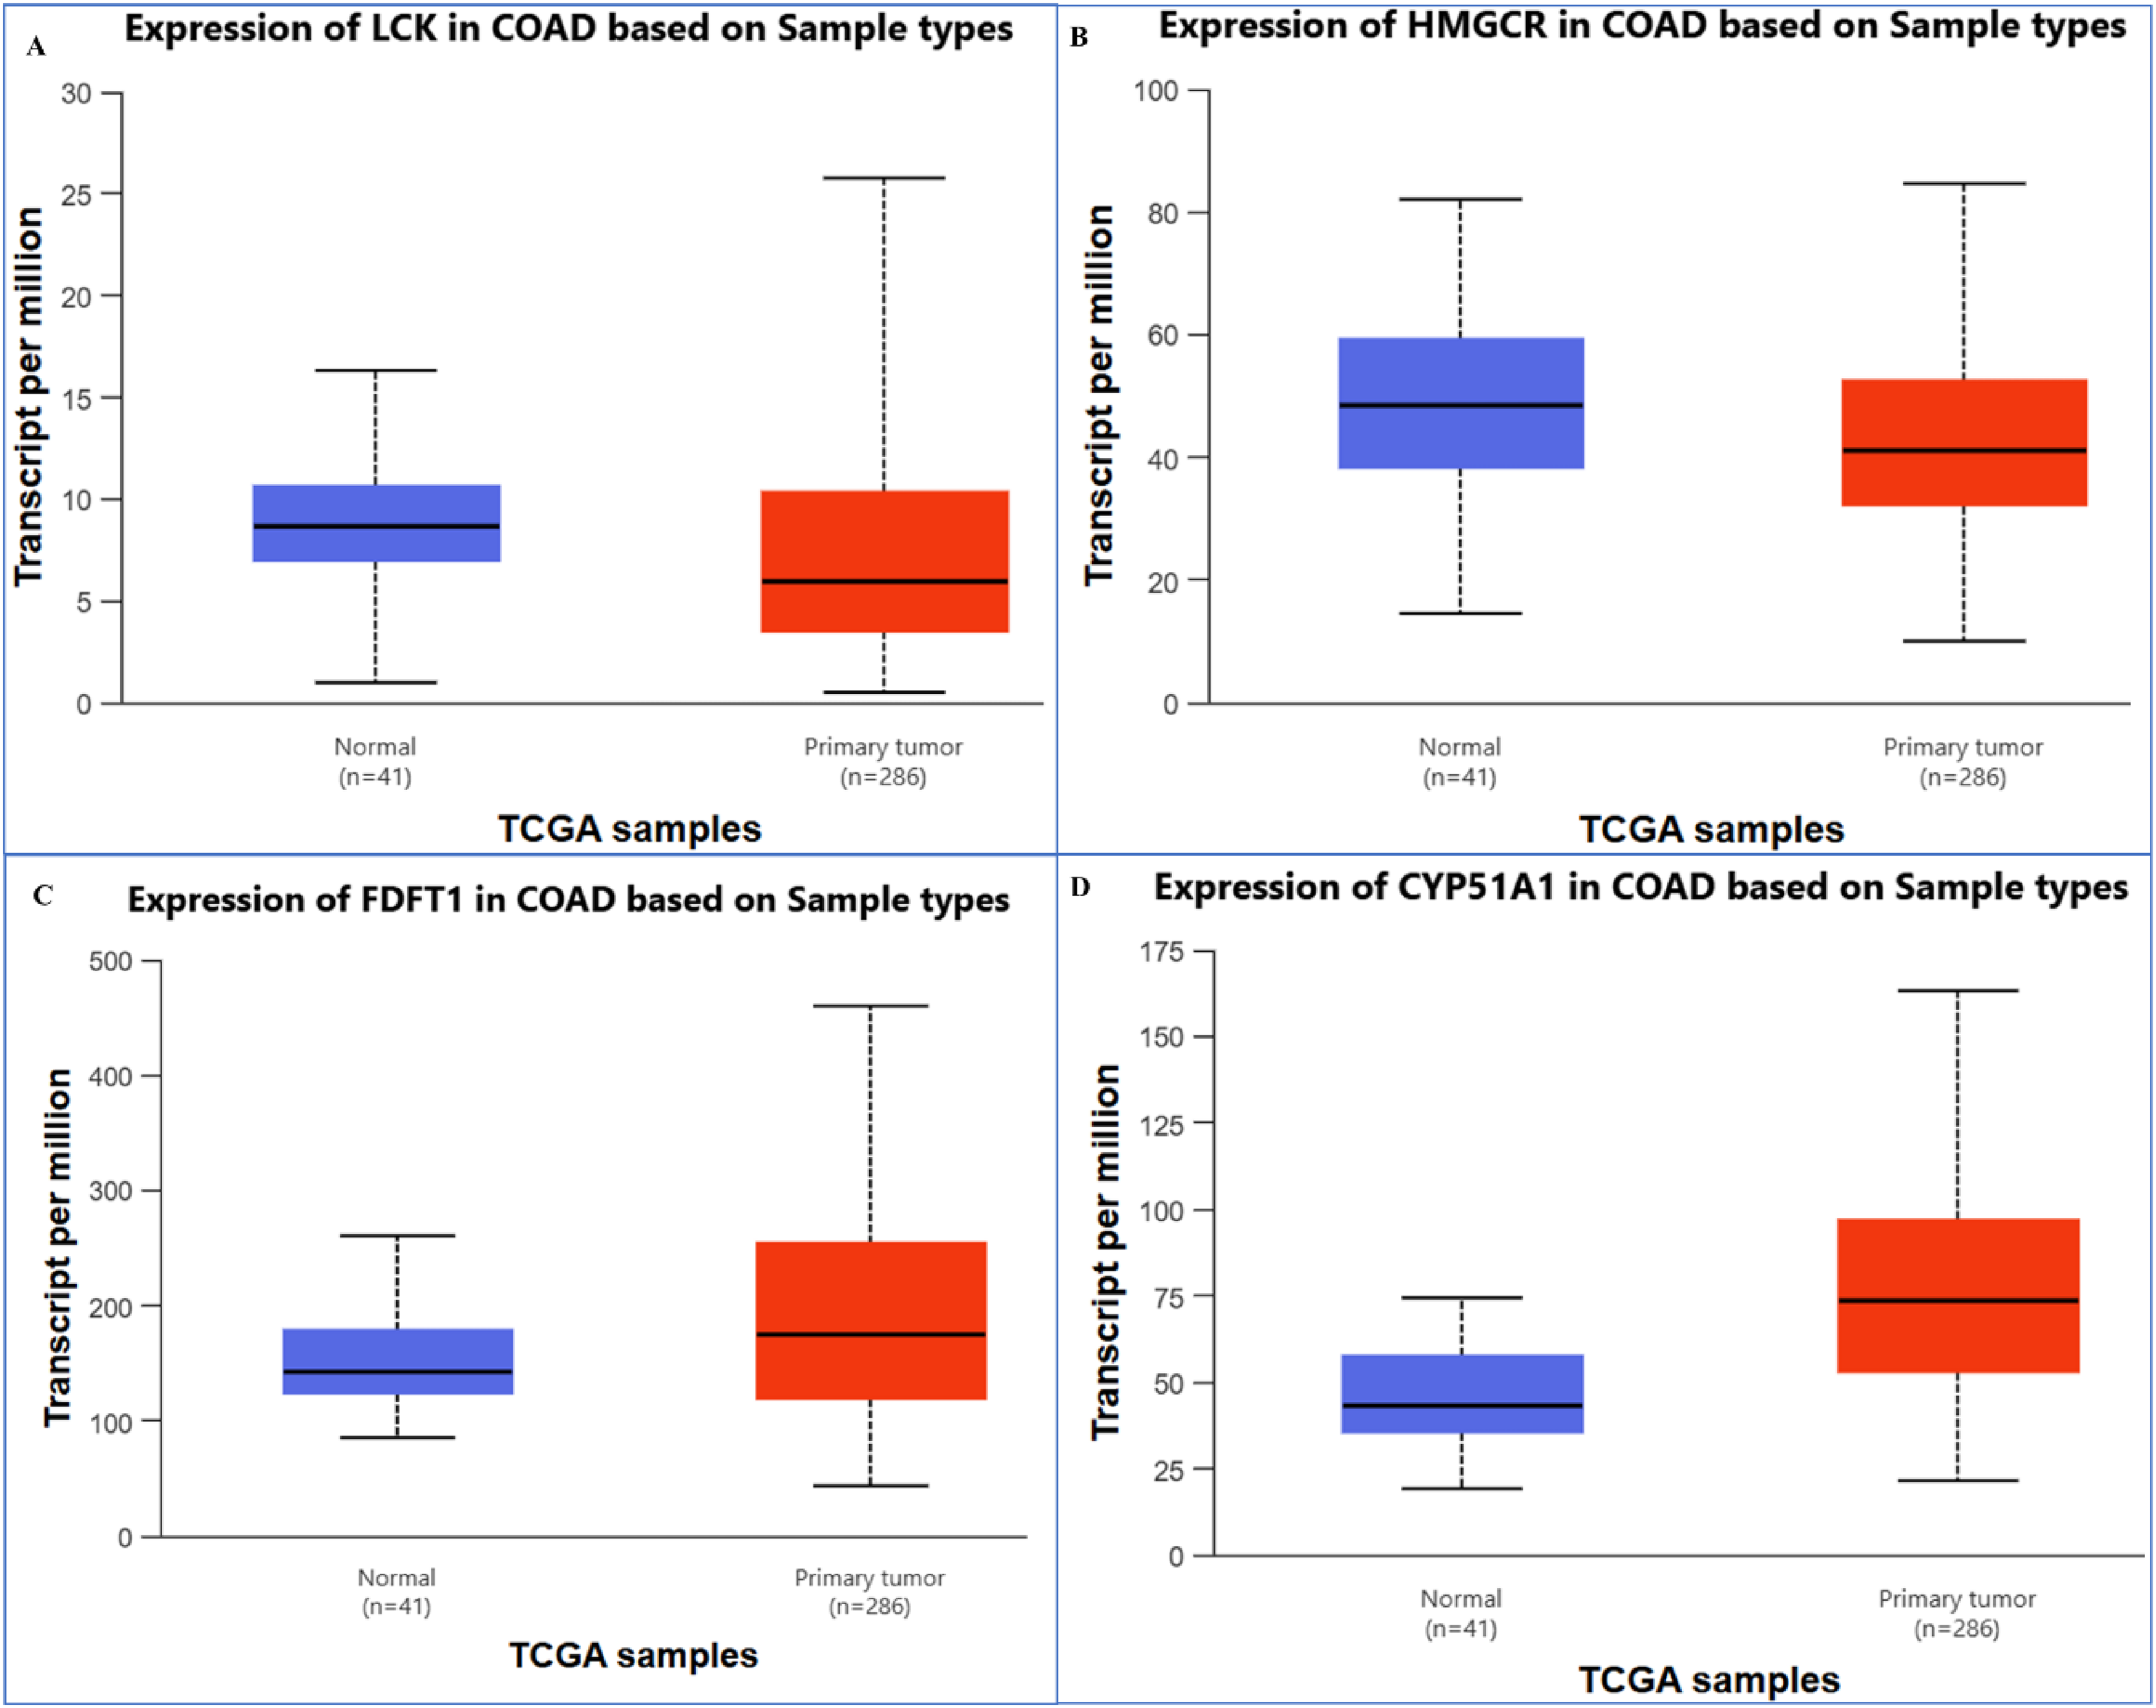
Gene expression between TCGA samples of selected genes. Differential expression of hub genes in colorectal adenocarcinoma (COAD) based on TCGA samples. Box plots showing transcript levels (per million) in normal tissues (n = 41) compared with primary tumor tissues (n = 286) for (A) LCK, (B) HMGCR, (C) FDFT1, and (D) CYP51A1. The expression of these genes demonstrates significant variation between normal and tumor samples, highlighting their potential role in COAD progression.

Summary of the methylation difference between tumor and normal samples of inputted genes in the selected cancers and the profile of correlations between methylation and mRNA expression of inputted genes in the specific cancers.
Molecular Docking Analysis
The binding affinities of Simvastatin and Lovastatin to various protein structures were analyzed through their respective PDB IDs, with results expressed in kcal·mol−1. The binding affinities revealed some differences between the two statins, indicating variations in their binding strengths to specific proteins (Table 4). For PDB ID 3LCK, Simvastatin demonstrated a stronger binding affinity of −8.4 kcal·mol−1 compared to Lovastatin (−7.9 kcal·mol−1), suggesting that Simvastatin may bind more effectively to this particular target. However, in PDB ID 3WEG, Lovastatin exhibited a significantly stronger binding affinity (−9.5 kcal·mol−1) compared to Simvastatin (−8.2 kcal·mol−1), highlighting that the binding strength can vary depending on the protein target. Similarly, in PDB ID 8SBI, Lovastatin again showed a stronger binding affinity (−9.4 kcal·mol−1) compared to Simvastatin (−8.2 kcal·mol−1), suggesting that Lovastatin may have a higher binding potential to certain proteins involved in lipid metabolism. On the other hand, for PDB ID 4ZYO, Lovastatin showed a marginally stronger binding affinity (−7.8 kcal·mol−1) compared to Simvastatin (−7.6 kcal·mol−1). In 1DQ8, the binding affinities of both compounds were similar, with Simvastatin at −7.3 kcal·mol−1 and Lovastatin at −7.1 kcal·mol−1, indicating comparable binding strengths to this protein target.
Docking Score in Kcal·mol−1 of Simvastatin and Lovastatin.

Figure 8A and B illustrate the Simvastatin-3LCK complex, where key hydrogen bond interactions are depicted. In Figure 8A, Simvastatin forms hydrogen bonds with Lys273, Glu288, and Val259, as indicated by the dashed green and pink lines. The Lys273 residue forms a conventional hydrogen bond at a distance of 2.19 Å, and Val259 forms a hydrophobic interaction with the molecule at 4.84 Å. The 3D representation in Figure 8B shows the spatial arrangement of the hydrogen bond interactions, with the interaction sites colored based on hydrogen bond acceptors and donors, confirming the structural stability of the complex. Figure 8C and D depict the Lovastatin-3WEG complex. Lovastatin interacts with Phe54, Ala176, and Val179, with the hydrogen bonds forming at distances of 5.29 Å and 3.85 Å. These interactions suggest that Lovastatin stabilizes its binding to the 3WEG protein via both hydrogen bonds and hydrophobic interactions. The 3D structure in Figure 8D further visualizes these interactions, showing how the molecule fits within the binding site and engages in these critical interactions. Lovastatin forms hydrogen bonds with Ala231, Phe234, and Leu488 at distances ranging from 2.42 Å to 5.01 Å (Figure 8E and F). Notably, the Phe234 interaction plays a crucial role in stabilizing the binding of Lovastatin to the 8SBI protein. The 3D representation in Figure 8F shows the spatial positioning of the binding residues and hydrogen bonds, confirming the stabilizing effect of these interactions.

2D structure of Simvastatin-3LCK complex with H-bond interaction (A & B), Lovastatin-3WEG complex 2D structure with H-bond interaction (C & D), Lovastatin-8SBI complex 2D structure with H-bond interaction (E & F).
MD Simulations and Post-MD Simulation Analysis
The MD simulations and subsequent post-MD analysis of the Simvastatin-3LCK, Lovastatin-3WEG, and Lovastatin-8SBI complexes provide valuable insights into their binding stability, conformational dynamics, and interaction behaviour. The simulation results were assessed using various techniques, including RMSD, RMSF, SASA, hydrogen bond analysis, and PCA, followed by FEL analysis, to understand the stability and flexibility of these complexes.
RMSD analysis revealed that the Simvastatin-3LCK and Lovastatin-3WEG complexes exhibited relatively stable binding, with RMSD values fluctuating around 0.15 nm. Both complexes showed minimal deviations over time, suggesting that Simvastatin and Lovastatin form stable interactions with 3LCK and 3WEG, respectively. On the other hand, the Lovastatin-8SBI complex exhibited greater RMSD fluctuations (ranging from 0.10 nm to 0.25 nm), indicating a more flexible and less stable interaction compared to the other two complexes. This suggests that Lovastatin in the 8SBI complex undergoes more conformational changes during the simulation (Figure 9A and B). Although the MD simulations were limited to 100 ns, RMSD profiles demonstrated convergence and stable plateaus after ∼40 ns, suggesting adequate sampling within this timeframe.

Plot of fluctuations in the RMSD of Simvastatin-3LCK complex (A), Lovastatin-3WEG complex (B), and Lovastatin-8SBI complex (C). RMSF of Simvastatin-3LCK complex (D).
Further analysis using RMSF demonstrated the flexibility of individual residues within each complex (Figure 9C & D and Figure 10A & B). The Simvastatin-3LCK complex showed localized regions with higher flexibility, particularly in the 300–350 residue range, while the Lovastatin-3WEG complex displayed more uniform fluctuations. In contrast, the Lovastatin-8SBI complex exhibited larger variations in flexibility, particularly in the 150–300 residue range, suggesting that Lovastatin in the 8SBI complex has a higher degree of conformational freedom, possibly indicating a weaker or more dynamic binding.

Plot of fluctuations in the RMSF of Lovastatin-3WEG complex (A), Lovastatin-8SBI complex (B). Plot of fluctuations in the SASA, Simvastatin-3LCK complex (C), Lovastatin-3WEG complex (D), Lovastatin-8SBI complex (E).
The plot of Rg shows fluctuations between approximately 2.05 nm and 2.15 nm (Figure 10C-E). These variations suggest that the system undergoes small conformational changes over time. The narrow fluctuation range indicates that the complex maintains a stable structure, without undergoing significant unfolding or large-scale rearrangements. Minor oscillations are typical in molecular systems as they adapt to the environment or undergo minor local changes.
The SASA analysis revealed consistent findings. Both the Simvastatin-3LCK and Lovastatin-3WEG complexes showed relatively stable SASA values, indicating that the interaction of Simvastatin with 3LCK and Lovastatin with 3WEG maintains a constant surface exposure to the solvent throughout the simulation. In contrast, the Lovastatin-8SBI complex showed larger fluctuations in SASA, reflecting greater variation in the exposure of the complex to the solvent, which further supports the notion that Lovastatin binding to 8SBI is more flexible (Figures 11A to C).

Plot of fluctuations in the SASA, Simvastatin-3LCK complex (A), Lovastatin-3WEG complex (B), Lovastatin-8SBI complex (C). H-bonds of Simvastatin-3LCK complex (D).
The hydrogen bond analysis demonstrated the dynamic nature of interactions within these complexes (Figure 11D and Figure 12A & B). The Simvastatin-3LCK complex showed periodic fluctuations in the number of hydrogen bonds formed, ranging between 1 and 3 hydrogen bonds throughout the simulation. The Lovastatin-3WEG complex formed stable hydrogen bonds, with fluctuations between 1 and 2 hydrogen bonds. However, the Lovastatin-8SBI complex displayed fewer hydrogen bonds, with occasional formation of up to 2 bonds, indicating a less stable interaction compared to the other two complexes.

H-bond interaction of Lovastatin-3WEG complex (A), and Lovastatin-8SBI complex (B).
The PCA showed distinct differences in the flexibility and stability of the complexes. The Simvastatin-3LCK and Lovastatin-3WEG complexes showed compact distributions in their 2D PDF plots, indicating that these complexes predominantly sample a narrow region of conformational space (Figure 13A to C and Figure 14A to C). On the other hand, the Lovastatin-8SBI complex exhibited a broader distribution, highlighting its higher flexibility and dynamic nature. The FEL analysis revealed that the Simvastatin-3LCK complex had the deepest energy basin, indicating that it maintains a highly stable and well-defined conformation during the simulation (Figure 15A to C). The Lovastatin-3WEG complex showed a shallower energy basin, reflecting a less rigid but still stable binding conformation. In contrast, the Lovastatin-8SBI complex exhibited the largest and shallowest energy landscape, signifying greater flexibility and a less stable binding interaction.

PCA plot of the Simvastatin-3LCK complex projected along the first two principal components (PC1 and PC2) (A). The trajectory points represent the dominant conformational motions extracted from the molecular dynamics. PCA projection between PC1 and PC2 OF Lovastatin-3WEG complex (B). Projection of the molecular dynamic trajectory onto the first two principal components (PC1 and PC2) obtained from PCA of Lovastatin-8SBI complex (C).

2D PDF plotted using PC1 and PC2 of the Simvastatin-3LCK complex trajectory (A). 2D PDF plot of PC1 vs PC2 OF Lovaststin-3WEG Complex (B). 2D PDF graph between PC1 and PC2 of the Lovastatin-8SBI complex (C).

FEL using the Boltzmann relation. The deep energy basin corresponds to the global minimum and reflects a highly stable conformational state of Simvastatin-3LCK complex (A). FEL based on PCA of Lovastatin-3WEG Complex (B). FEL for the Lovastatin-8SBI complex (C). The deep energy basin corresponds to the global minimum and reflects a highly stable conformational state.
The MD simulation results suggest that Simvastatin forms a more stable and rigid interaction with 3LCK, while Lovastatin exhibits greater flexibility in its interactions with 3WEG and 8SBI. The Simvastatin-3LCK complex displays stable binding with minimal fluctuations, whereas the Lovastatin-8SBI complex is more dynamic and less stable, with more significant conformational changes and a broader energy landscape. These findings provide valuable insights into the binding characteristics and dynamic behaviour of Simvastatin and Lovastatin in different protein targets.
MM-PBSA
The MM-PBSA analysis revealed the binding free energies for the Simvastatin-3LCK, Lovastatin-3WEG, and Lovastatin-8SBI complexes, providing insights into the strength of the interactions. The Simvastatin-3LCK complex exhibited a binding free energy of −56.47 ± 0.13 kcal·mol−1, suggesting consistent results across the simulations (Table 5). The Lovastatin-3WEG complex showed a stronger binding affinity, with a more negative binding free energy of −64.73 ± 0.72 kcal·mol−1, highlighting a stable yet more tightly bound interaction. In contrast, the Lovastatin-8SBI complex had the weakest binding with a binding free energy of −48.31 ± 0.75 kcal·mol−1, reflecting greater variability and flexibility in its interaction. The results suggest that Lovastatin-3WEG forms the strongest and most stable binding interaction, while the Simvastatin-3LCK complex also demonstrates strong binding, and the Lovastatin-8SBI complex shows a weaker, more flexible interaction. The mean and mean ± SD for each component were determined using block averaging over the equilibrated portion (last 50 ns) of the MD trajectories. The results are presented in Table 5. These decomposed results highlight that van der Waals and electrostatic interactions are the dominant favorable contributions, while the polar solvation term opposes binding, consistent with hydrophobic-driven stabilization typical of protein–ligand complexes.
Binding Free Energies (in kcal·mol−1) List for the 3 Complexes.

In-Vitro Validation by MTT Cell-Viability Assay
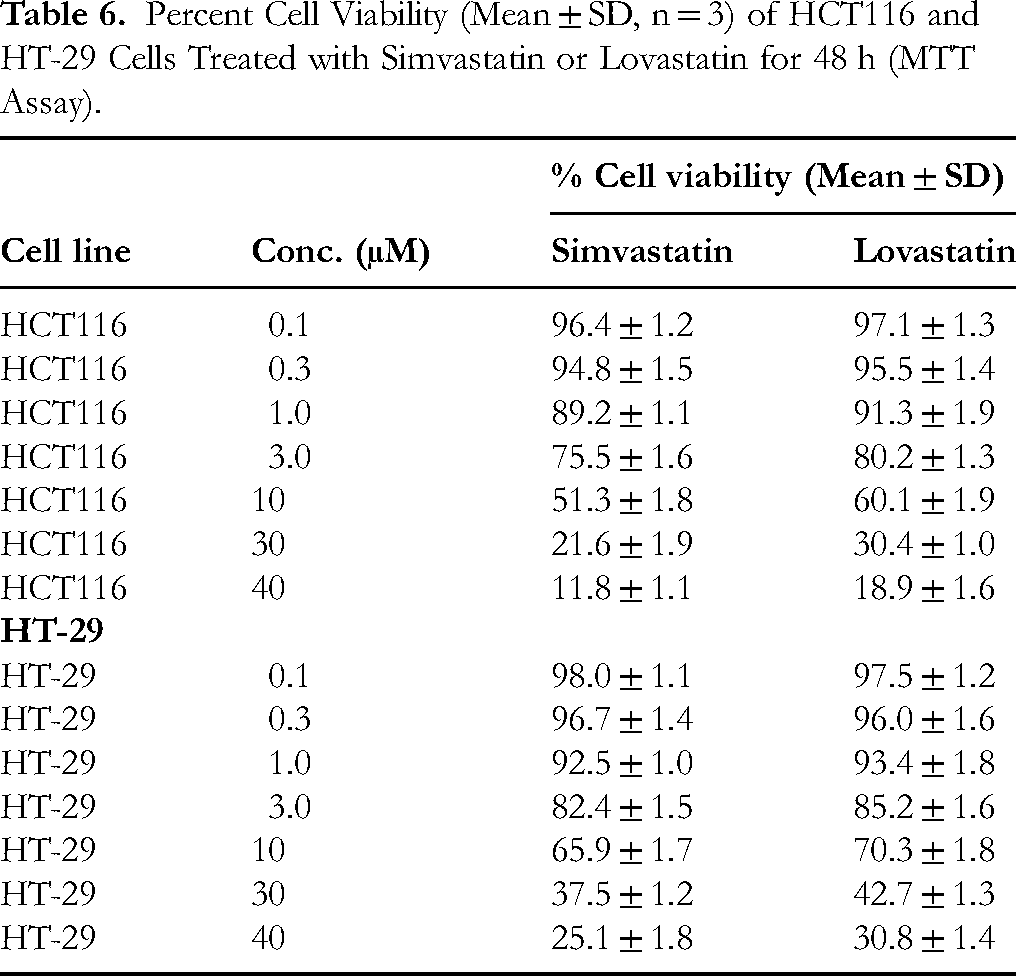
The cytotoxic potential of Simvastatin and Lovastatin was evaluated in HCT116 (KRAS G13D) and HT-29 (BRAF V600E) colorectal cancer cell lines using an MTT assay at 48 h. Both statins reduced cell viability in a concentration-dependent manner (Table 6). Simvastatin demonstrated greater potency than Lovastatin against both cell lines at equivalent concentrations. At 30 µM, Simvastatin reduced HCT116 viability to 21.6 ± 1.9%, while Lovastatin reduced it to 30.4 ± 1.0%. A similar trend was observed in HT-29 cells (37.5 ± 1.2% for Simvastatin vs 42.7 ± 1.3% for Lovastatin). Nonlinear regression analysis yielded IC50 values of approximately 8.9 ± 0.17 μM (Simvastatin) and 12.6 ± 0.32 μM (Lovastatin) in HCT116, and 14.4 ± 0.15 μM (Simvastatin) and 18.7 ± 0.53 μM (Lovastatin) in HT-29 (Table 7). These results demonstrate that statin-induced cytotoxicity is cell line–dependent, with HCT116 cells being more sensitive than HT-29, consistent with the computational predictions of stronger binding and stability in apoptotic protein targets.
Percent Cell Viability (Mean ± SD, n = 3) of HCT116 and HT-29 Cells Treated with Simvastatin or Lovastatin for 48 h (MTT Assay).
IC50 Values of Simvastatin and Lovastatin in HCT116 and HT-29 Cells (48 h, MTT Assay). Values are Presented as Mean ± SD (n = 3 Independent Experiments).

Discussion
The integrated computational–experimental framework of our study provides mechanistic evidence supporting the anticancer potential of Simvastatin and Lovastatin in colorectal cancer. Both statins, originally developed as HMG-CoA reductase inhibitors for hyperlipidemia, exhibited multi-targeted effects on metabolic and apoptotic pathways in CRC, underscoring their repurposing potential.
Our network pharmacology analysis identified five central hub genes—HMGCR, CYP51A1, FDFT1, SCD, and LCK—involved in cholesterol biosynthesis, fatty acid metabolism, and apoptosis regulation. The observed inhibition of these targets by Simvastatin and Lovastatin complements the established mechanism of statins as mevalonate pathway blockers,36,37 leading to depletion of downstream products such as farnesyl pyrophosphate and geranylgeranyl pyrophosphate, both of which are essential for prenylation and activation of oncogenic RAS and RHO proteins. Network pharmacology and PPI analysis identified five key hub genes enriched in apoptosis and lipid metabolism pathways. HMGCR (3-hydroxy-3-methylglutaryl-CoA reductase) acts as the rate-limiting enzyme of the mevalonate pathway, supporting cholesterol biosynthesis and RAS prenylation in CRC. 38 CYP51A1 (Lanosterol 14α-demethylase) mediates sterol demethylation, contributing to altered cholesterol homeostasis. 39 FDFT1 (Farnesyl-diphosphate farnesyltransferase 1) catalyses squalene synthesis, driving sterol availability and providing substrates for oncogenic prenylation. 40 SCD (Stearoyl-CoA desaturase) promotes fatty acid desaturation, enhancing membrane biosynthesis and survival under metabolic stress. 41 LCK, a non-receptor tyrosine kinase, is aberrantly expressed in CRC and supports tumor cell proliferation, migration, and evasion of apoptosis. 42 Together, these nodes illustrate how metabolic rewiring and apoptotic dysregulation converge in CRC and highlight potential mechanistic points where statins may exert anticancer activity.
In agreement with Xie et al, our computational and in-vitro findings confirm that Simvastatin can trigger apoptotic and pyroptotic responses in CRC cells through oxidative stress and caspase activation. The significant binding affinity of Simvastatin toward LCK and the stable conformational dynamics observed during MD simulations suggest interference with tyrosine kinase–mediated signaling, which may enhance caspase activation and promote apoptosis. This mechanistic convergence supports Xie's report that Simvastatin promotes pyroptosis via the ROS/caspase-1/GSDMD axis in colon cancer cells. 6
Similarly, Lovastatin showed strong interactions with CYP51A1 and FDFT1, corroborating the findings of Huang et al, who revealed that Lovastatin induces mitochondrial oxidative stress and mtDNA damage, leading to cGAS–STING–mediated apoptosis in CRC cells. The structural affinity toward lipid metabolism enzymes suggests that Lovastatin exerts its cytotoxicity through disruption of sterol synthesis and mitochondrial bioenergetics, consistent with Huang's observations. 7 Moreover, some study demonstrated that Lovastatin destabilizes cholesterol rafts in plasma and mitochondrial membranes, impairing energy metabolism8,43 —a mechanism that parallels our KEGG enrichment data, which highlight altered steroid and fatty acid biosynthesis pathways.
The MM-PBSA and MD results from our study reinforce the notion that Simvastatin forms more stable complexes with apoptotic proteins, while Lovastatin demonstrates higher flexibility in its binding dynamics. This comparative trend align the conclusions of D. Cai et al, who showed that inhibition of FDFT1 reduces cholesterol and bile acid levels to delay cancer progression through the HNF4A/ALDOB/AKT1 axis. 44 The strong negative binding energy observed for the Lovastatin–3WEG complex in our study indicates robust sterol pathway inhibition, complementing this biochemical evidence.
Our gene expression and methylation analyses revealed that HMGCR, FDFT1, and LCK are upregulated and hypomethylated in CRC tissues, suggesting their functional involvement in tumor metabolism. Similar results were reported by various study, who linked HMGCR, FDFT1, and LCK to cancer cell survival.38,45,46 The observed hypomethylation of these genes in tumor samples supports the epigenetic activation of lipid biosynthetic machinery, providing a plausible explanation for the dependency of CRC on these metabolic pathways. Statin-mediated suppression of these targets therefore represents a promising strategy to counter metabolic reprogramming in tumor cells.
The in-vitro cytotoxicity data confirmed that both statins significantly reduced CRC cell viability in a dose-dependent manner, with Simvastatin exhibiting lower IC50 values (8.9 µM in HCT116 and 14.4 µM in HT-29) compared to Lovastatin. Study showed direct inhibition of statins against two kinase (CAMK1G and TSSK1B) with an IC50 value of 8.9 μM and 3.3 μM, respectively which is the evidence of colorectal cancer therapeutic. 47 Other studies also suggested dual inhibitory nature of statin. 48 Lipophilic statins such as Simvastatin can efficiently traverse the plasma membrane, accumulate in mitochondria, and interfere with the respiratory chain, resulting in ROS overproduction and apoptotic cell death. The slightly weaker response observed for Lovastatin may be attributed to its comparatively lower lipophilicity and slower cellular uptake kinetics.
Clinically, the mechanistic overlap between statin-mediated lipid pathway inhibition and apoptotic reprogramming provides a strong rationale for repurposing statins as adjuvant agents in CRC therapy. Multiple epidemiological studies have linked long-term statin use with reduced CRC incidence and improved patient outcomes, possibly via modulation of inflammation, angiogenesis, and cell proliferation pathways. However, discrepancies exist regarding dose dependence and tumor subtype specificity. Our data offer molecular-level explanations for these inconsistencies by revealing target-dependent variations in statin–protein interactions and epigenetic regulation.
Limitations of the Study
This study is subject to certain limitations despite the promising computational findings. Although the insights gained are informative, they primarily rely on in silico analyses, which necessitate experimental validation through in vitro and in vivo studies to establish the safety and efficacy of Lovastatin and Simvastatin in the context of colon cancer. The network pharmacology analysis is based on pre-existing datasets that may not adequately capture the complexities of tumor heterogeneity or apoptotic signalling pathways. Although 100 ns MD simulations captured local stability, longer trajectories may reveal larger conformational rearrangements. The present PCA and free-energy analyses were performed at 300 K; future work will extend this investigation to multiple temperatures to better understand thermal stability. Experimentally, while MTT assays confirmed cytotoxicity, they do not directly confirm apoptosis. Future studies should incorporate Annexin-V/PI staining, caspase-3 cleavage assays, PARP cleavage, and ROS quantification in CRC models, as previously performed in different research articles.6,7,49 Such assays would provide mechanistic clarity and validate whether statin-induced viability loss indeed proceeds through apoptotic pathways. In vivo studies in xenograft or genetically engineered mouse models would further substantiate the translational potential. Furthermore, critical pharmacokinetic factors essential for clinical application, such as drug metabolism, bioavailability, and off-target effects, are not sufficiently addressed by molecular docking and dynamics simulations. To enhance and validate these computational predictions, future research should encompass experimental and clinical data.
Conclusion
This study employed molecular docking, network pharmacology, and molecular dynamics simulations to investigate the potential of Lovastatin and Simvastatin as inhibitors of apoptotic gene networks in colon cancer. Both statins displayed strong interactions with apoptotic proteins, suggesting that repurposing these cholesterol-lowering agents could effectively modulate apoptotic pathways and improve treatment outcomes for colon cancer. Experimental validation in HCT116 and HT-29 cell lines confirmed concentration-dependent cytotoxicity. These results support the hypothesis that statins suppress CRC viability by interfering with key metabolic and apoptotic pathways. While further mechanistic assays and in vivo studies are warranted, this study establishes a strong rationale for statin repurposing as a potential adjunctive therapy in CRC.
Supplemental Material
sj-docx-1-npx-10.1177_1934578X251404284 - Supplemental material for Repurposing Simvastatin and Lovastatin for Colorectal Cancer: An Integrated in-Silico and in-Vitro Study
Supplemental material, sj-docx-1-npx-10.1177_1934578X251404284 for Repurposing Simvastatin and Lovastatin for Colorectal Cancer: An Integrated in-Silico and in-Vitro Study by Kavya Manjunath, Fady H. Fayek, Shaik Sadik, Sreeharsha Nagaraja, Santosh Prasad Chaudhary Kurmi and Shankar Thapa in Natural Product Communications
Footnotes
Acknowledgements
Not applicable.
Ethics Approval
Ethics approval and consent to participate: Not applicable.
Author Contribution
Kavya Manjunath: Concept, Methodology, Analysis, and Original-manuscript writing. Fady H. Fayek and Santosh Prasad Chaudhary Kurmi: MD simulation, Molecular docking, Network Pharmacology analysis, Software. Shaik Sadik, and Sreeharsha Nagaraja: Data analysis, Visualization, and Validation. Shankar Thapa: Software, Supervision, Review and Editing. All author agreed for publication.
Funding
This work was supported by the Deanship of Scientific Research, Vice Presidency for Graduate Studies and Scientific Research, King Faisal University, Saudi Arabia [Grant No. KFU253598].
Declaration of Conflicting Interests
The authors declared no potential conflicts of interest with respect to the research, authorship, and/or publication of this article.
AI declaration: We declared that no AI tools were used during preparing this manuscript.
Availability of Data and Materials
The data included in the research report are included in the article. Further inquiries can be made directly to the corresponding author.
Supplemental Material
Supplemental material for this article is available online.
References
Supplementary Material
Please find the following supplemental material available below.
For Open Access articles published under a Creative Commons License, all supplemental material carries the same license as the article it is associated with.
For non-Open Access articles published, all supplemental material carries a non-exclusive license, and permission requests for re-use of supplemental material or any part of supplemental material shall be sent directly to the copyright owner as specified in the copyright notice associated with the article.