
Abstract
Introduction
Osteoporosis is a systemic bone disease characterized by a decrease in bone mass and deterioration of the microstructure of bones, resulting in increased bone fragility and susceptibility to fractures. The condition is prevalent in middle-aged and older individuals, particularly postmenopausal women. 1 The maintenance of bone homeostasis necessitates a precise equilibrium between the functions of osteoclasts, responsible for bone resorption, and osteoblasts, responsible for bone formation. Osteoporosis arises when the serenity of this dynamic balance is disturbed.
Chinese herbal medicine has been used in China to treat osteoporosis for more than 2000 years, and in recent years, it has gradually attracted worldwide attention because of its low side effects. 2 Modern pharmacological studies have shown that kaempferol is an extract of many herbal medicines like Eucommia, Epimedium, Rhizoma Drynariae, and Achyranthes Bidentata. 3 Some experiments proved that kaempferol can regulate bone metabolism balance and improve bone density by increasing osteoblast activity while decreasing osteoclast activity.4-8 Our preliminary experiments found that RPN1 may serve as a new target for kaempferol to improve osteoporosis. 9 Therefore, kaempferol which may be a more investigative anti-osteoporotic herbal monomer can be used as a complementary and alternative drug with promising clinical applications in the treatment of osteoporosis.
Transcriptomics involves studying the complete set of transcripts in an organism, revealing gene function at a comprehensive level. It aids in understanding molecular mechanisms of specific biological processes (BPs) and diseases. Scholars have recently applied transcriptomics to study osteoporosis-associated genes and drug intervention mechanisms.10,11 In conclusion, transcriptomics, as a mature research technology, systematically analyzes intergroup gene differences, significantly aiding in understanding osteoporosis pathogenesis, new target drug development, and clinical treatment.
Results
Pharmacodynamic Results
bone Mineral Density Test Results
In comparison to the control group which had only a small portion of fat around the ovaries removed (Sham), the ovariectomized rat model (OVX) group had a statistically significant decrease in bone mineral density (BMD) (P < .01), and all rats in the OVX group had worse BMD than the Sham group which meant we had a successful modeling. The BMD was shown to be significantly greater in the groups receiving positive control group (AL), Kaempferol low-dose group (KaeLD), Kaempferol medium dose group (KaeMD), and Kaempferol high-dose group (KaeHD) treatments, as compared to the OVX group (P < .01). BMD in the KaeLD and AL groups approached and converged with that of the Sham group. With increasing kaempferol concentration, BMD values increased (Figure 1).
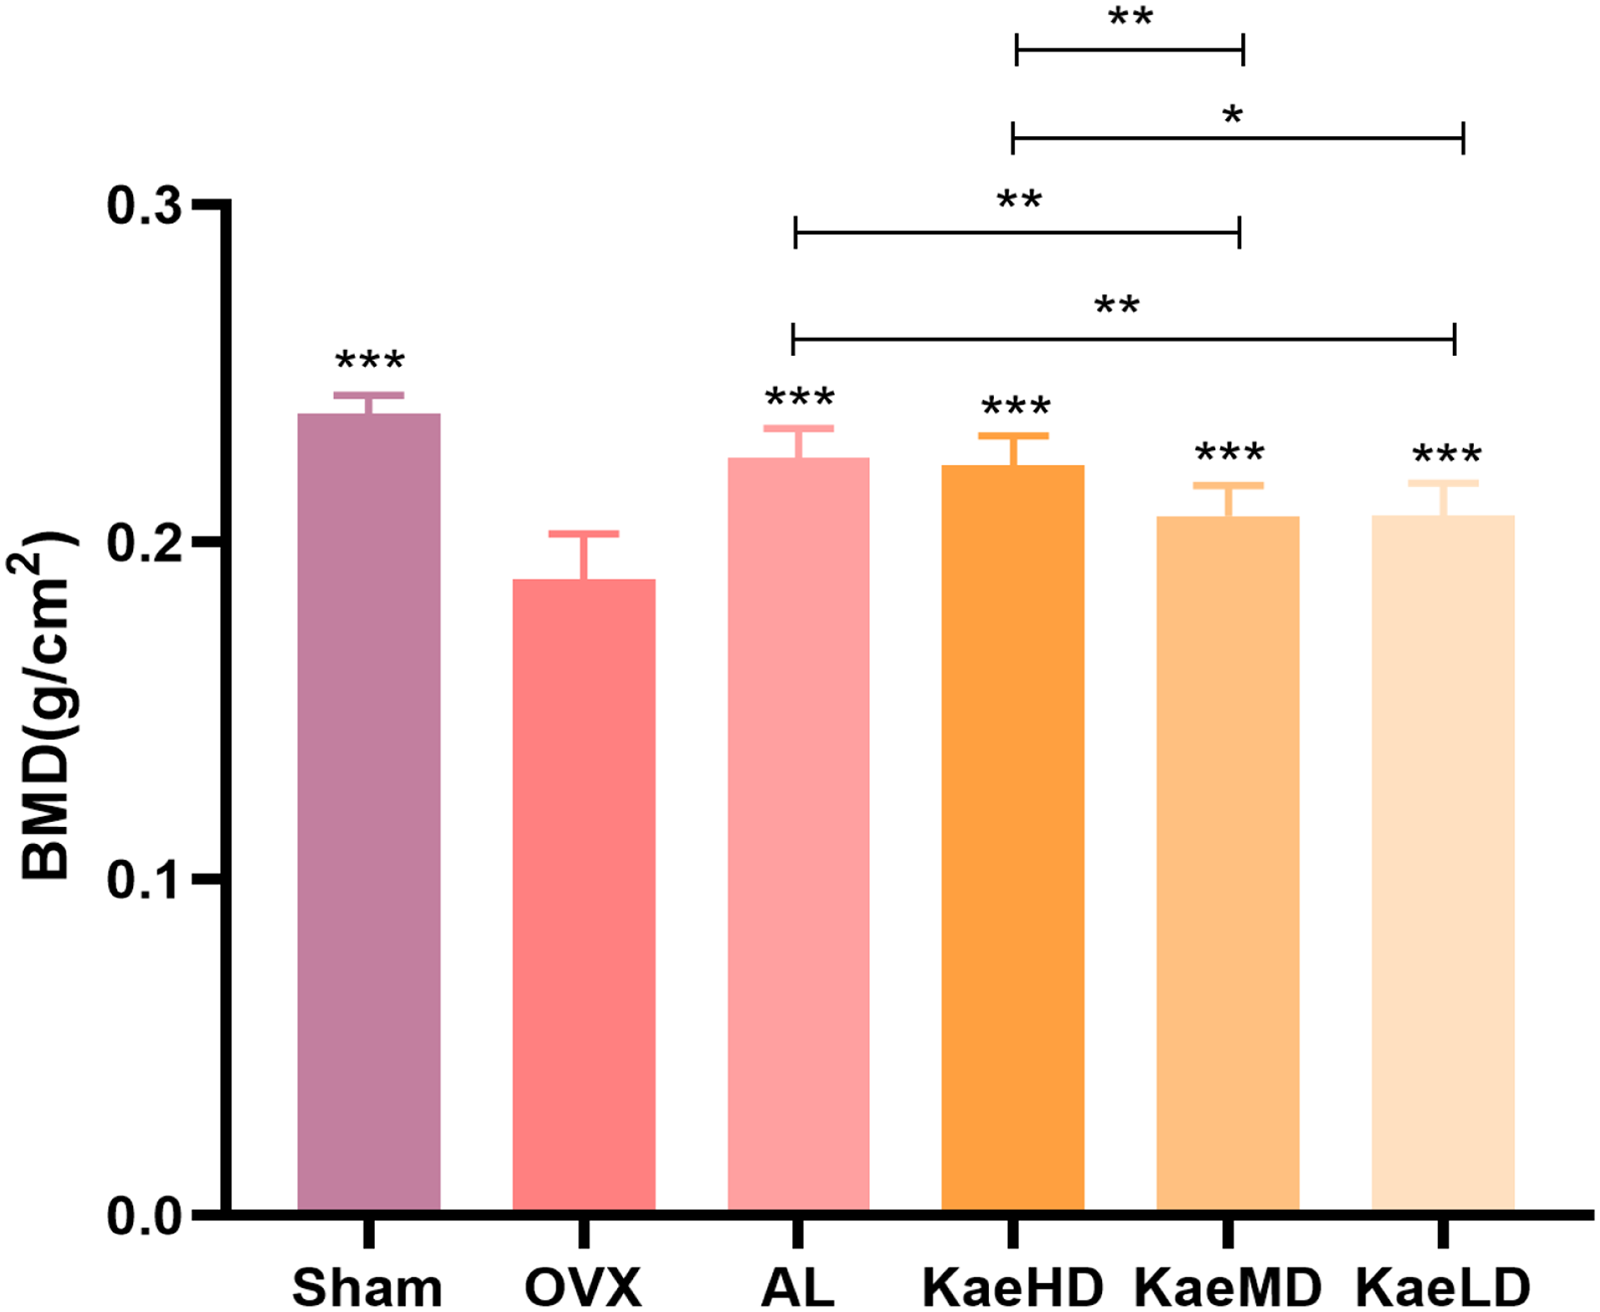
BMD test results. The relative quantitative values are expressed as the mean ± SD, and the sample size for each group was n = 10. P < .01 versus the sham group; ***P < .01 versus the OVX group; ΔΔP < .01vs. the KaeHD; group; ΔP < .05vs. the KaeHD group; ##P < .01 versus the AL group. OVX, ovariectomized rat model; BMD, bone mineral density.
Histopathological Observation of Tibia
In the control group, the tibial bone structure exhibited usual characteristics, including appropriate thickness and uninterrupted continuity beneath the epiphyseal plate. The structure was standard, and the number of cells was higher (Figure 2a). In contrast, the OVX group had a bone structure characterized by reduced thickness and a more scattered arrangement. Additionally, there were instances of interrupted continuity, incomplete structure, blind ends, and uneven thickness of small beam walls (Figure 2b). The AL group exhibited increased bone thickness, higher osteocyte count, improved structure, and enhanced bone-end connection (Figure 2c). The bone structure in the kaempferol groups gradually improved with increasing drug dose, showing increased thickness, better bone tissue connection, and overall structural enhancement (Figure 2d-f). Remarkably, it was found that by calculating the bone trabecular area, the OVX group had a much smaller bone trabecular area than the other five groups (P < .01, Figure 3).

Pathological results of rat tibia (HE staining, × 200). (a) Sham group; (b) OVX group; (c) AL group; (d) KaeHD group; (e) KaeMD group; (f) KaeLD group. The sample size for each group was n = 6. Scale bar = 500 μm. OVX, ovariectomized rat model; HE, hematoxylin-eosin.

Area of bone trabeculae. The relative quantitative values are expressed as the mean ± SD, and the sample size for each group was n = 6. ***P < .01 versus the OVX group. OVX, ovariectomized rat model.
Transcriptomics Results Analysis
Evaluation of Transcriptome Sequencing Data
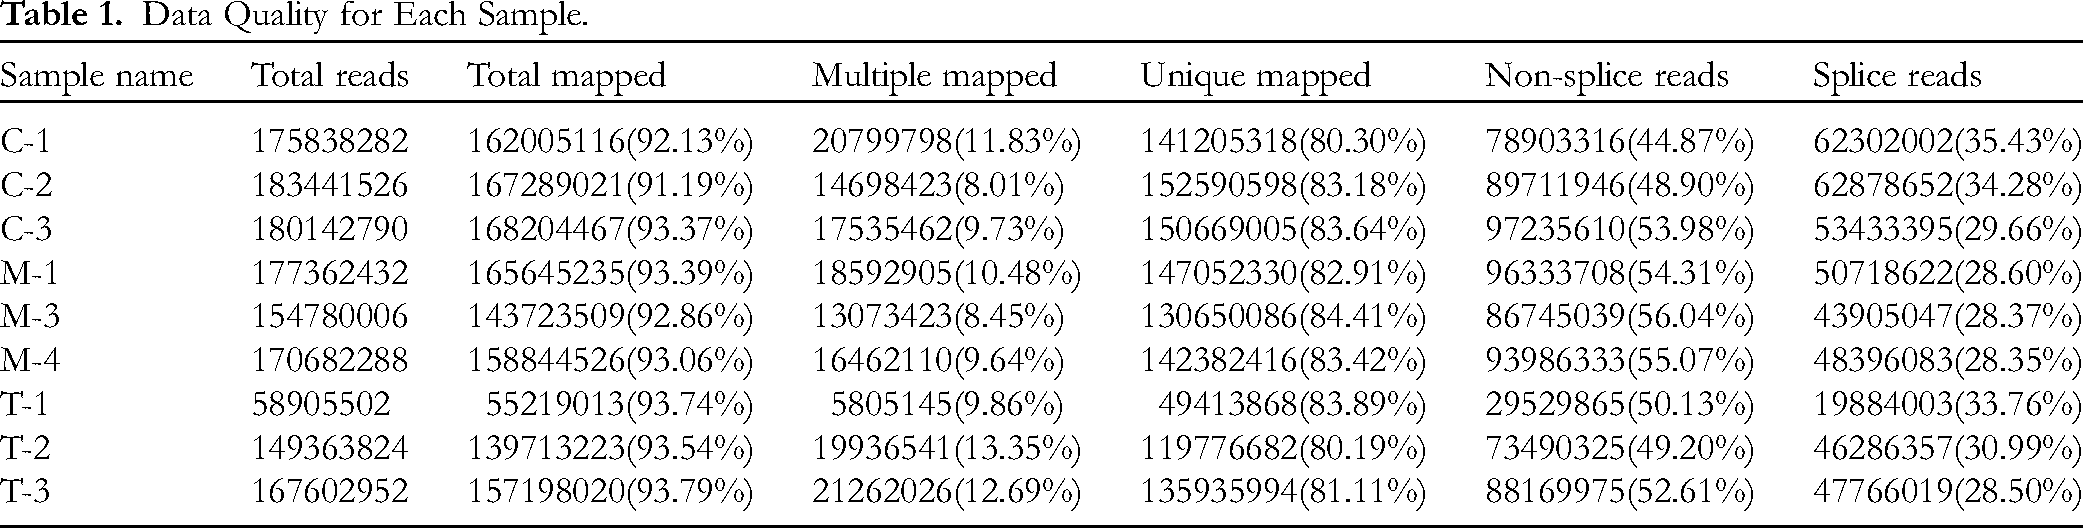
The Q20 bases for each sample were above 95%, Q30 had more than 90% bases, and GC content was around 50% (Table 1). Comparing Clean Reads with reference genes showed that each sample had a localization percentage above 90% (Table 2). Correlation coefficients among samples were all greater than .76 (Figure 4), indicating close expression pattern alignment and high correlation. These results affirm that the sequencing quality of all samples is qualified, reliable, and suitable for further analysis.
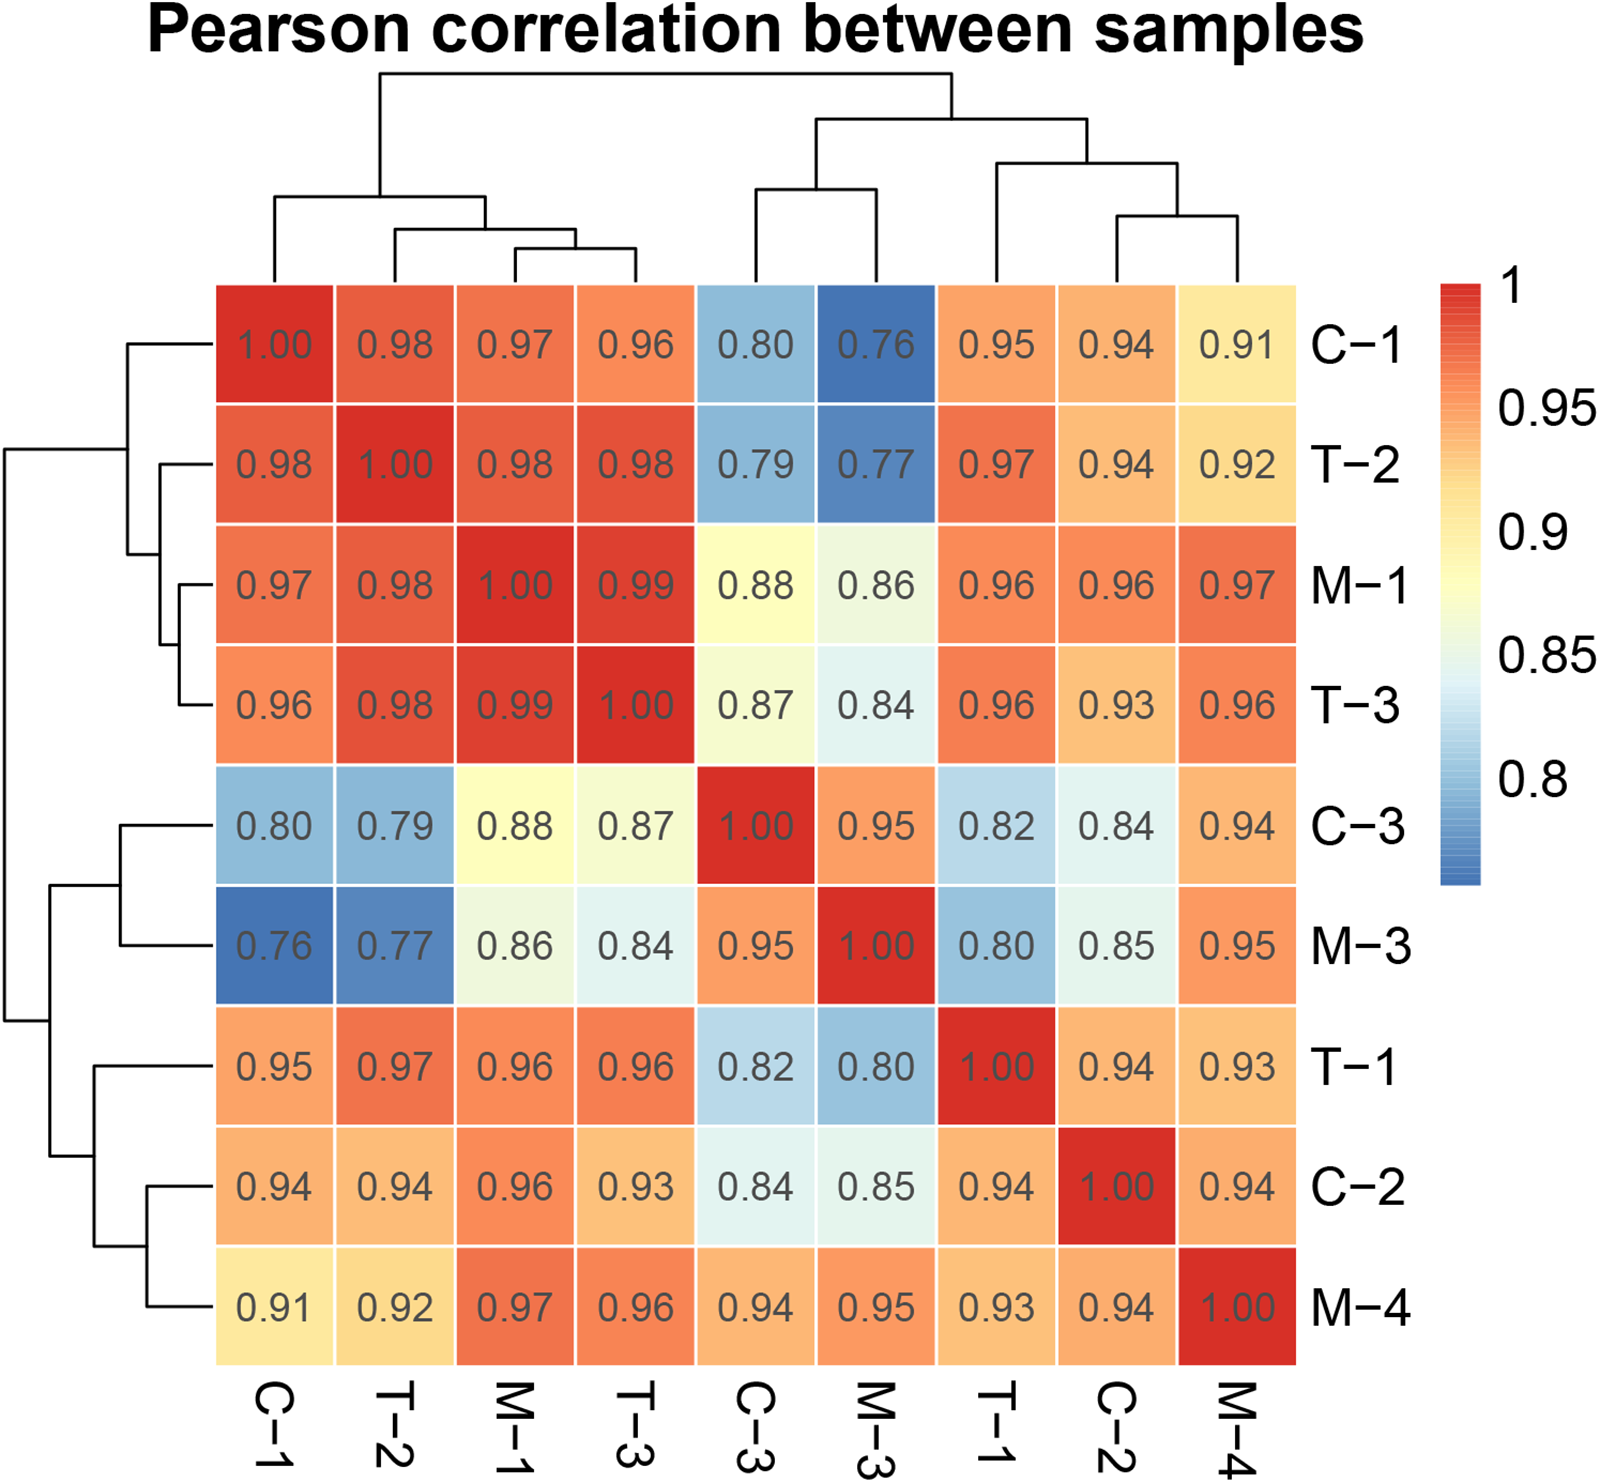
Heat map of Pearson correlation between samples. The sample size for each group was n = 3.
Data Quality for Each Sample.
Reads Versus Reference Genomes.

Results of Differentially Expressed Gene Screening
Using log2FoldChange > 0.7 or < −0.7 and Q < 0.05 as screening criteria, 156 differentially expressed genes (DEGs) were identified between Sham and OVX groups, including 74 upregulated and 82 downregulated genes. Between KaeHD and OVX groups, 1717 DEGs were identified, comprising 392 upregulated and 1325 downregulated genes. Taking the intersection of upregulated genes in Sham versus OVX with downregulated genes in KaeHD versus OVX, 19 transgenic genes were identified, such as NTN1, EBF1, LTBP4, and GSN. These genes are considered pharmacodynamic targets for osteoporosis treatment with kaempferol (Figures 5-9).

Venn diagram of common genes between upregulated genes in Sham OVX and downregulated genes in KaeHD versus OVX. The sample size for each group was n = 3. OVX, ovariectomized rat model
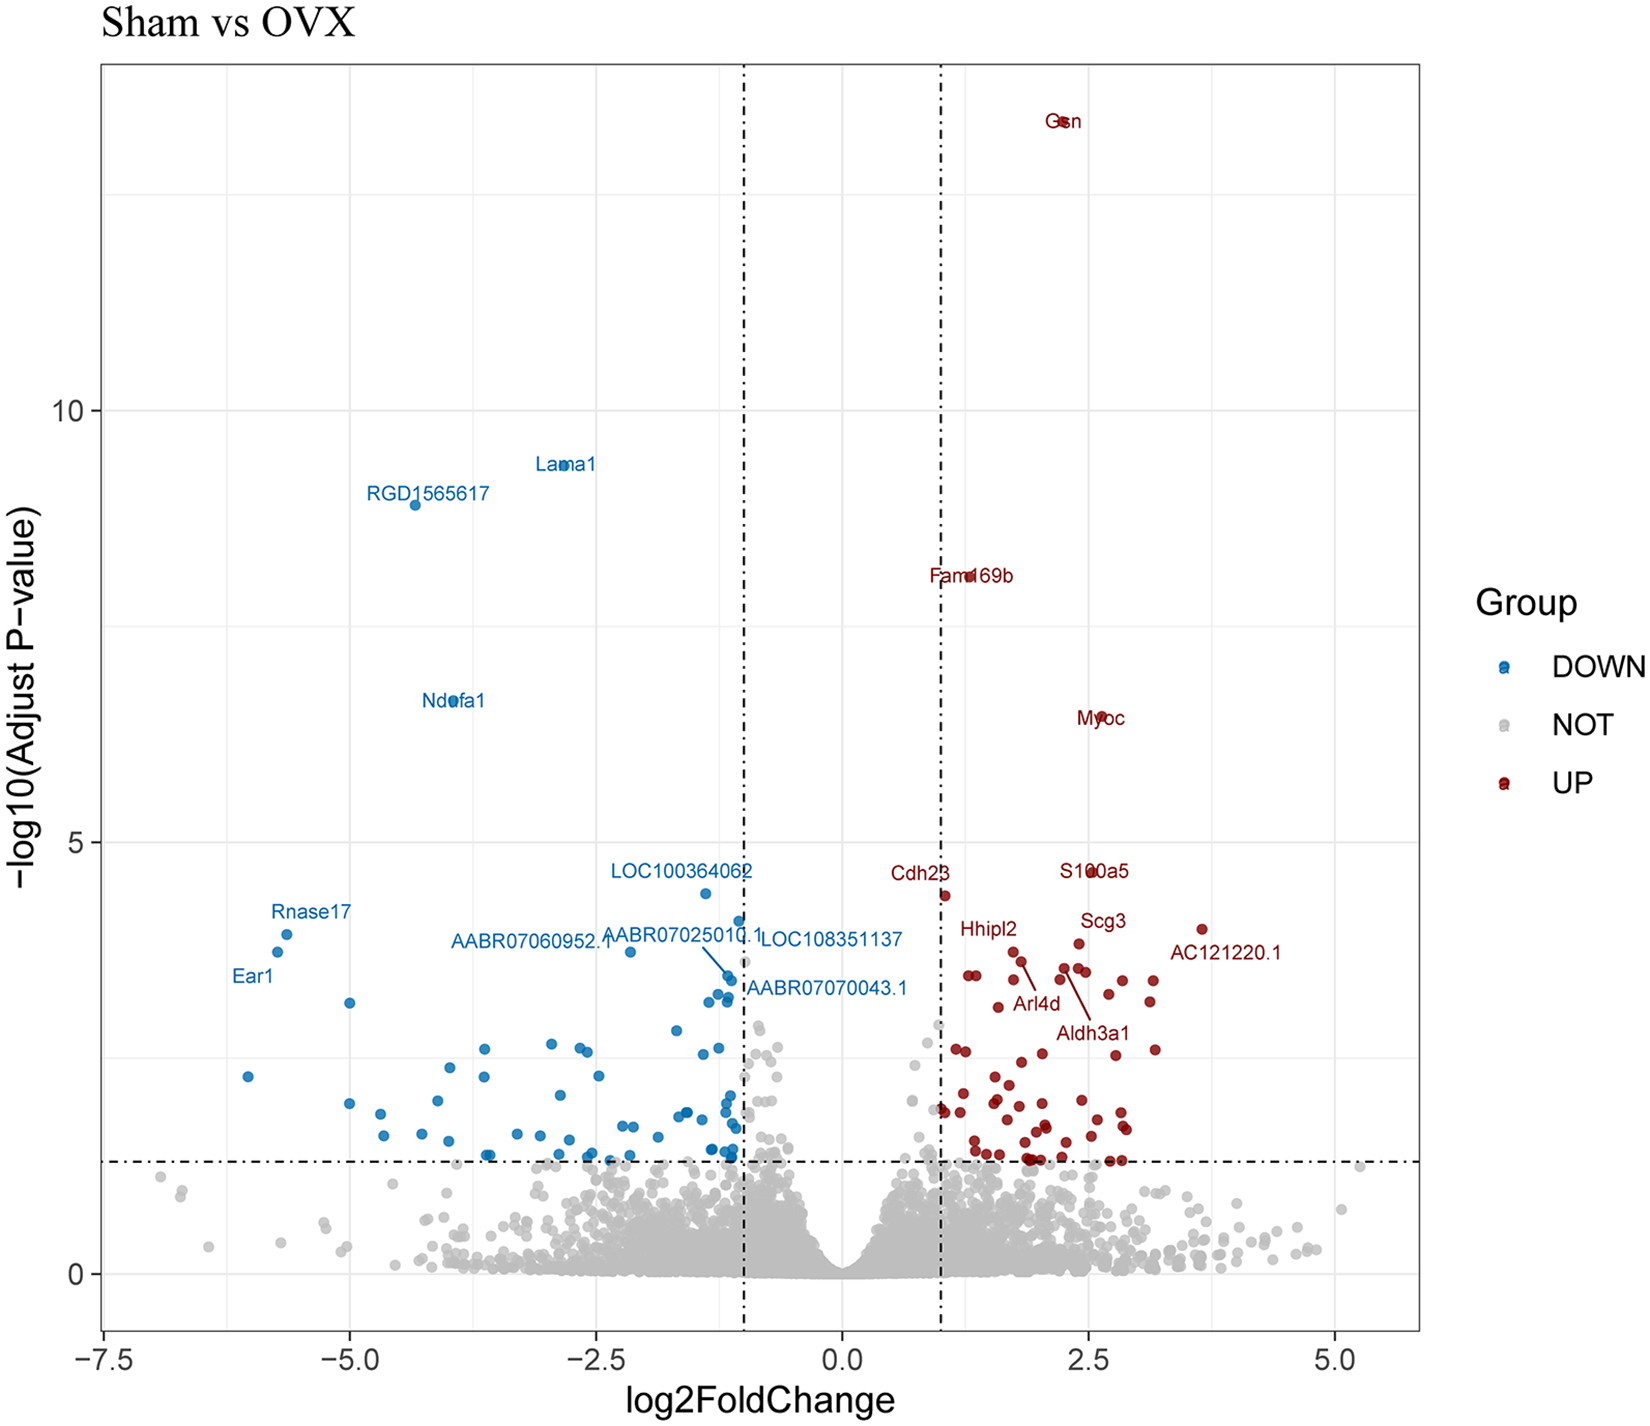
DEGs in Sham versus OVX. Volcanic map of DEGs in Sham versus OVX; the sample size for each group was n = 3. OVX, ovariectomized rat model; DEG, differentially expressed gene.
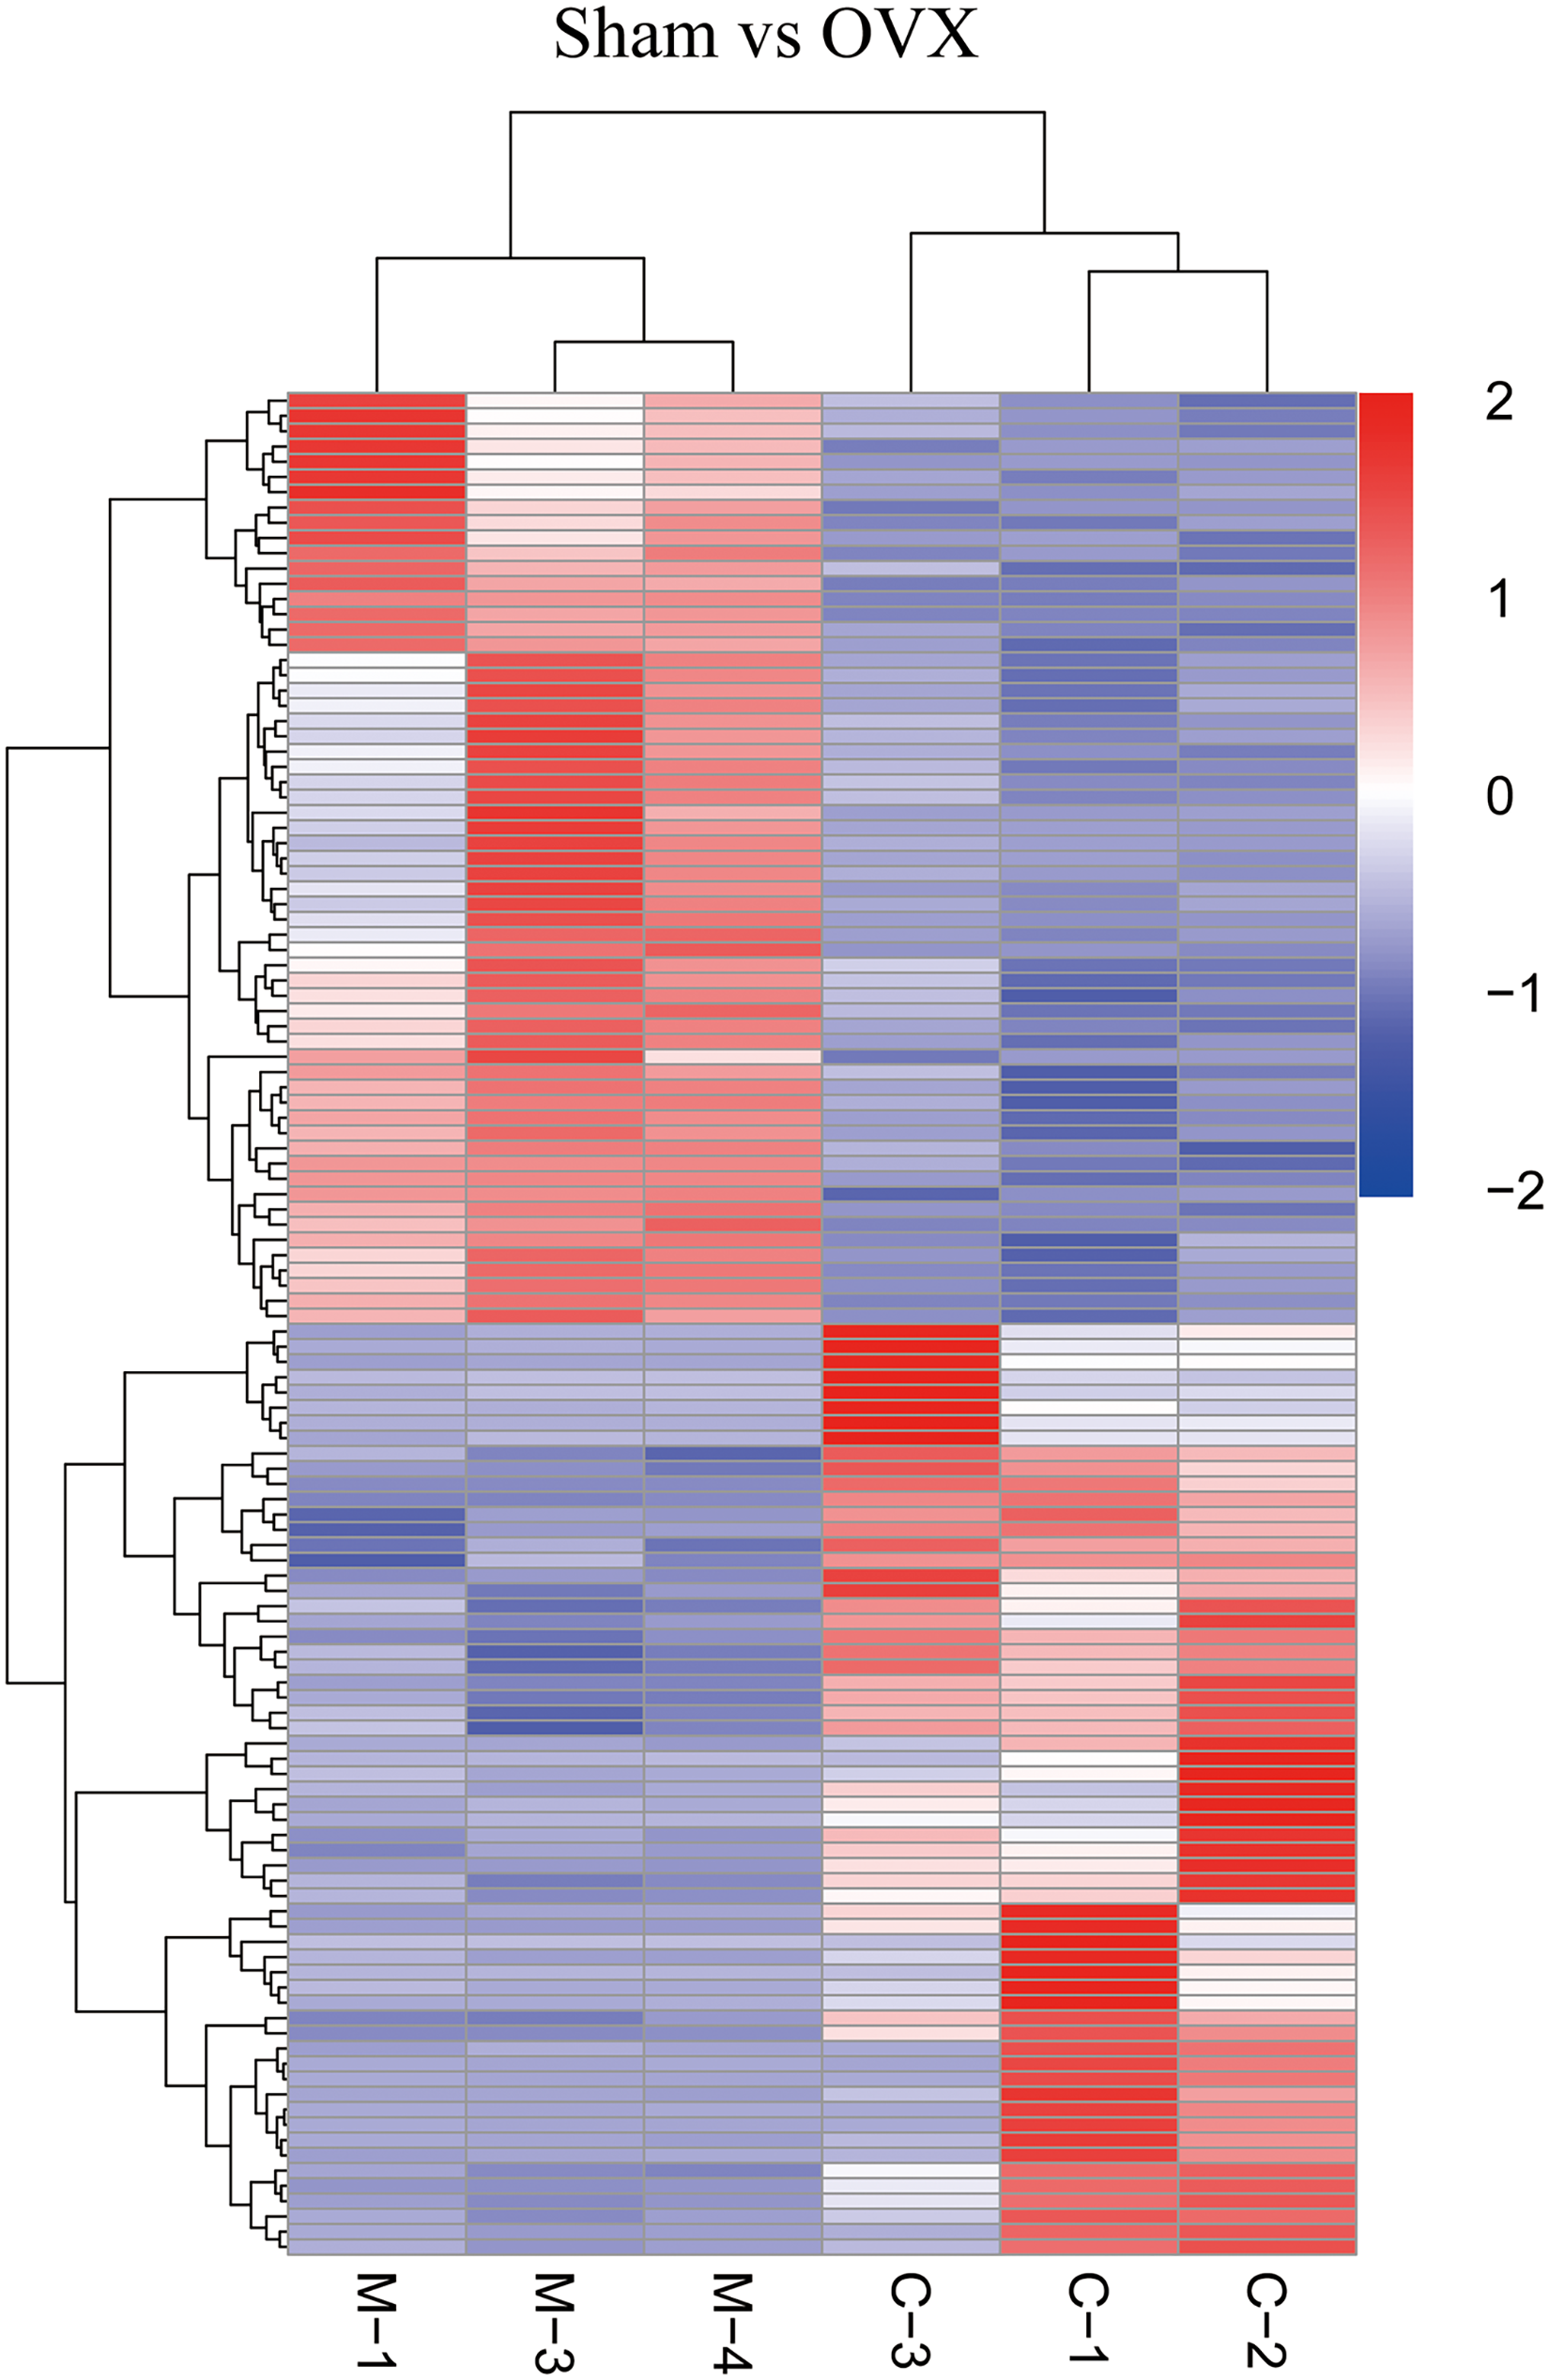
Clustering map of DEGs in Sham versus OVX. The sample size for each group was n = 3. OVX, ovariectomized rat model; DEG, differentially expressed gene.
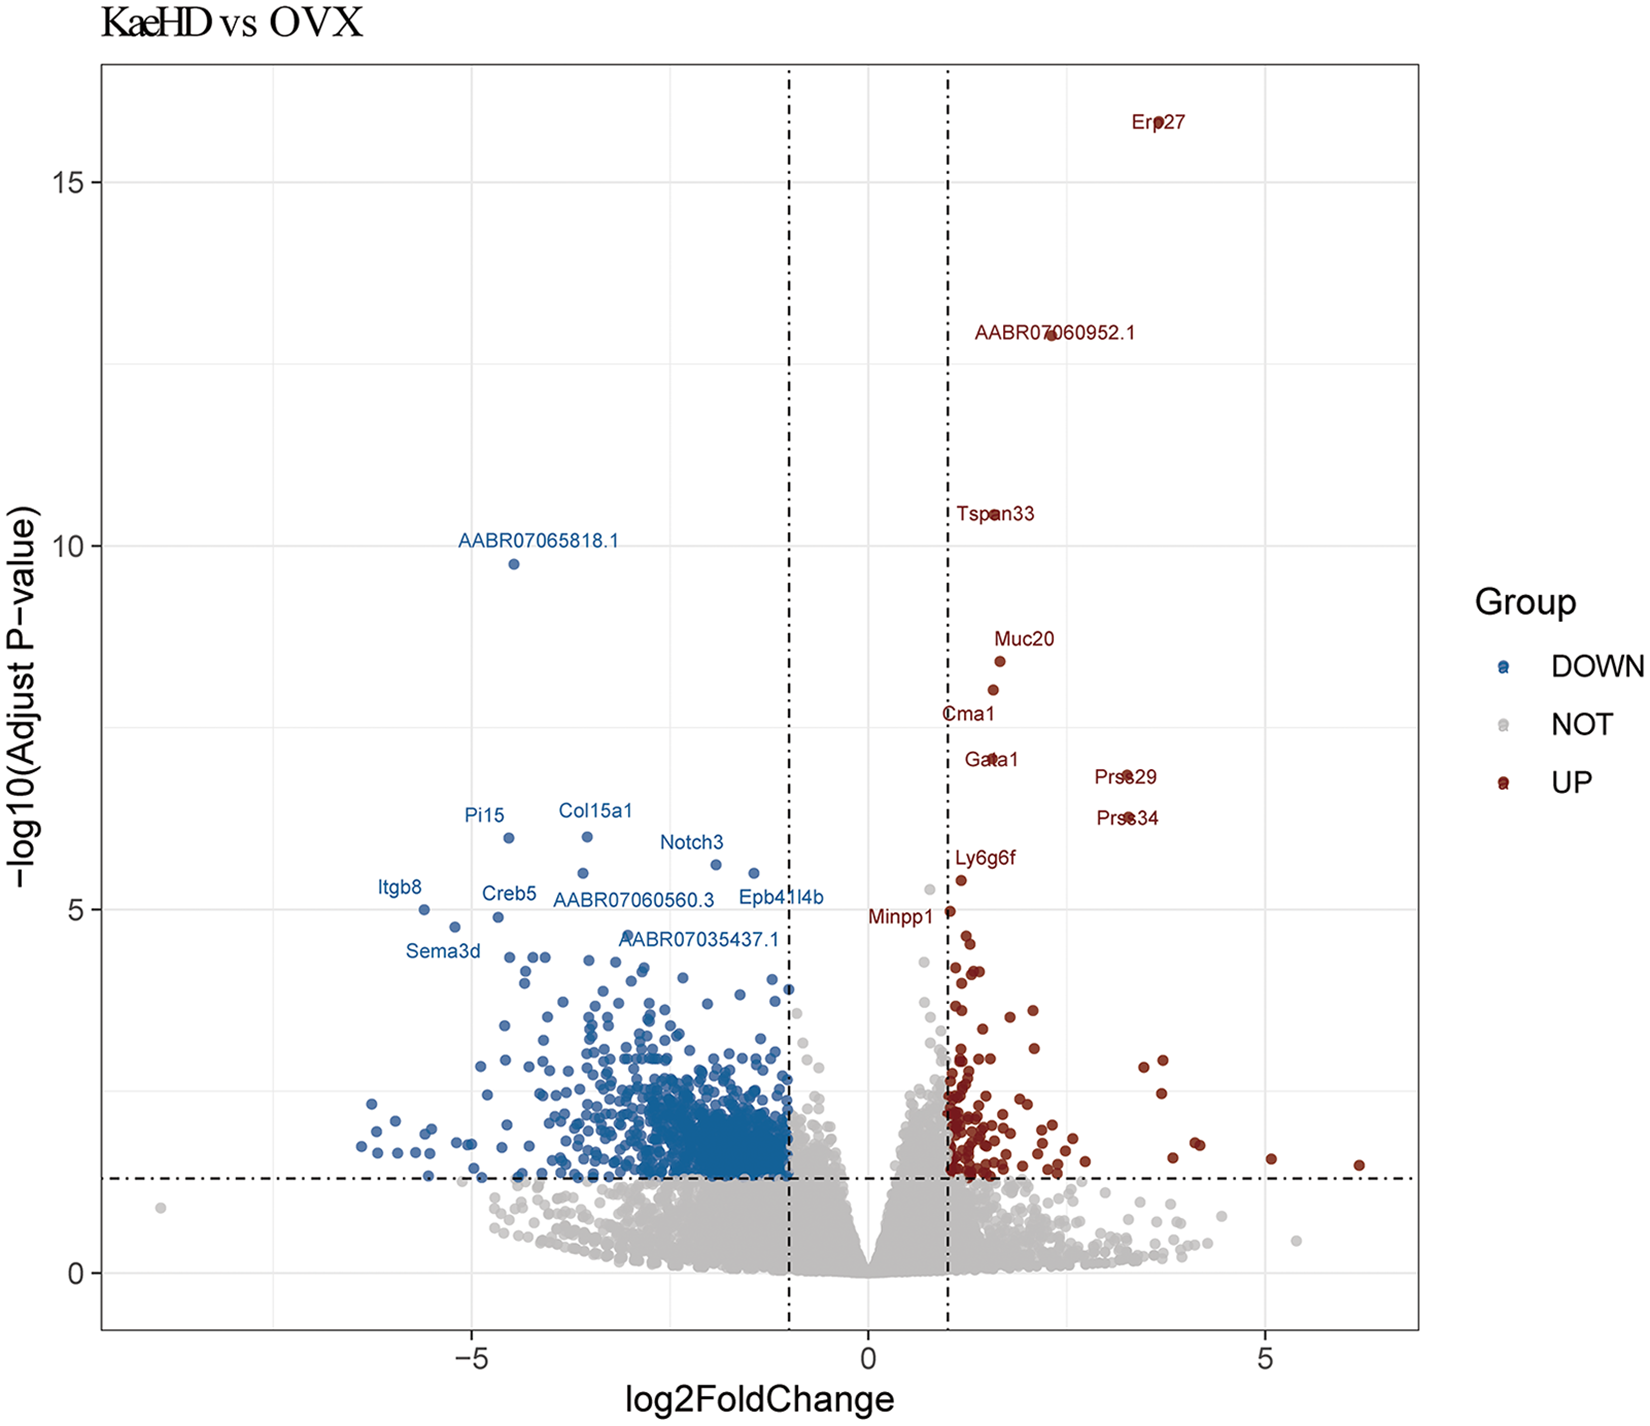
DEGs in KaeHD versus OVX. Volcanic map of DEGs in KaeHD versus OVX; the sample size for each group was n = 3. OVX, ovariectomized rat model; DEG, differentially expressed gene.

Clustering map of DEGs in KaeHD versus OVX. The sample size for each group was n = 3. OVX, ovariectomized rat model; DEG, differentially expressed gene.
Functional Annotation and Classification
Based on the functional enrichment results, DEGs between the Sham and OVX groups exhibited significant enrichment in 50 BPs terms, 8 cellular components (CCs) terms, and 19 molecular functions (MFs) terms. BP terms included positive regulation of protein processing in phagocytic vesicles, platelet formation, positive regulation of p38MAPK cascade, blood coagulation, wound healing, and positive regulation of the apoptotic process, among others. CC terms encompassed platelet alpha granule, extracellular space, ruffle, and extracellular region. MF terms comprised benzaldehyde dehydrogenase (NAD+) activity, cytoskeletal adaptor activity, oxidoreductase activity acting on the aldehyde or oxo group of donors, NAD or NADP as acceptors, GTP binding, and calcium ion binding (Figure 10).

Sham versus OVX. Top 30 GO Terms. The sample size for each group was n = 3. OVX, ovariectomized rat model; GO, Gene Ontology.
In the same vein, DEGs between the KaeHD and OVX groups exhibited significant enrichment in 581 BP terms, 100 CC terms, and 139 MF terms. BP terms included positive regulation of bone mineralization, positive regulation of osteoblast differentiation, bone development, canonical Wnt signaling pathway, and wound healing. CC terms encompassed the basement membrane, extracellular matrix, receptor complex, and extracellular region. MF terms comprised transforming growth factor beta binding, Wnt-protein binding, growth factor binding, and calcium ion binding (Figure 11).
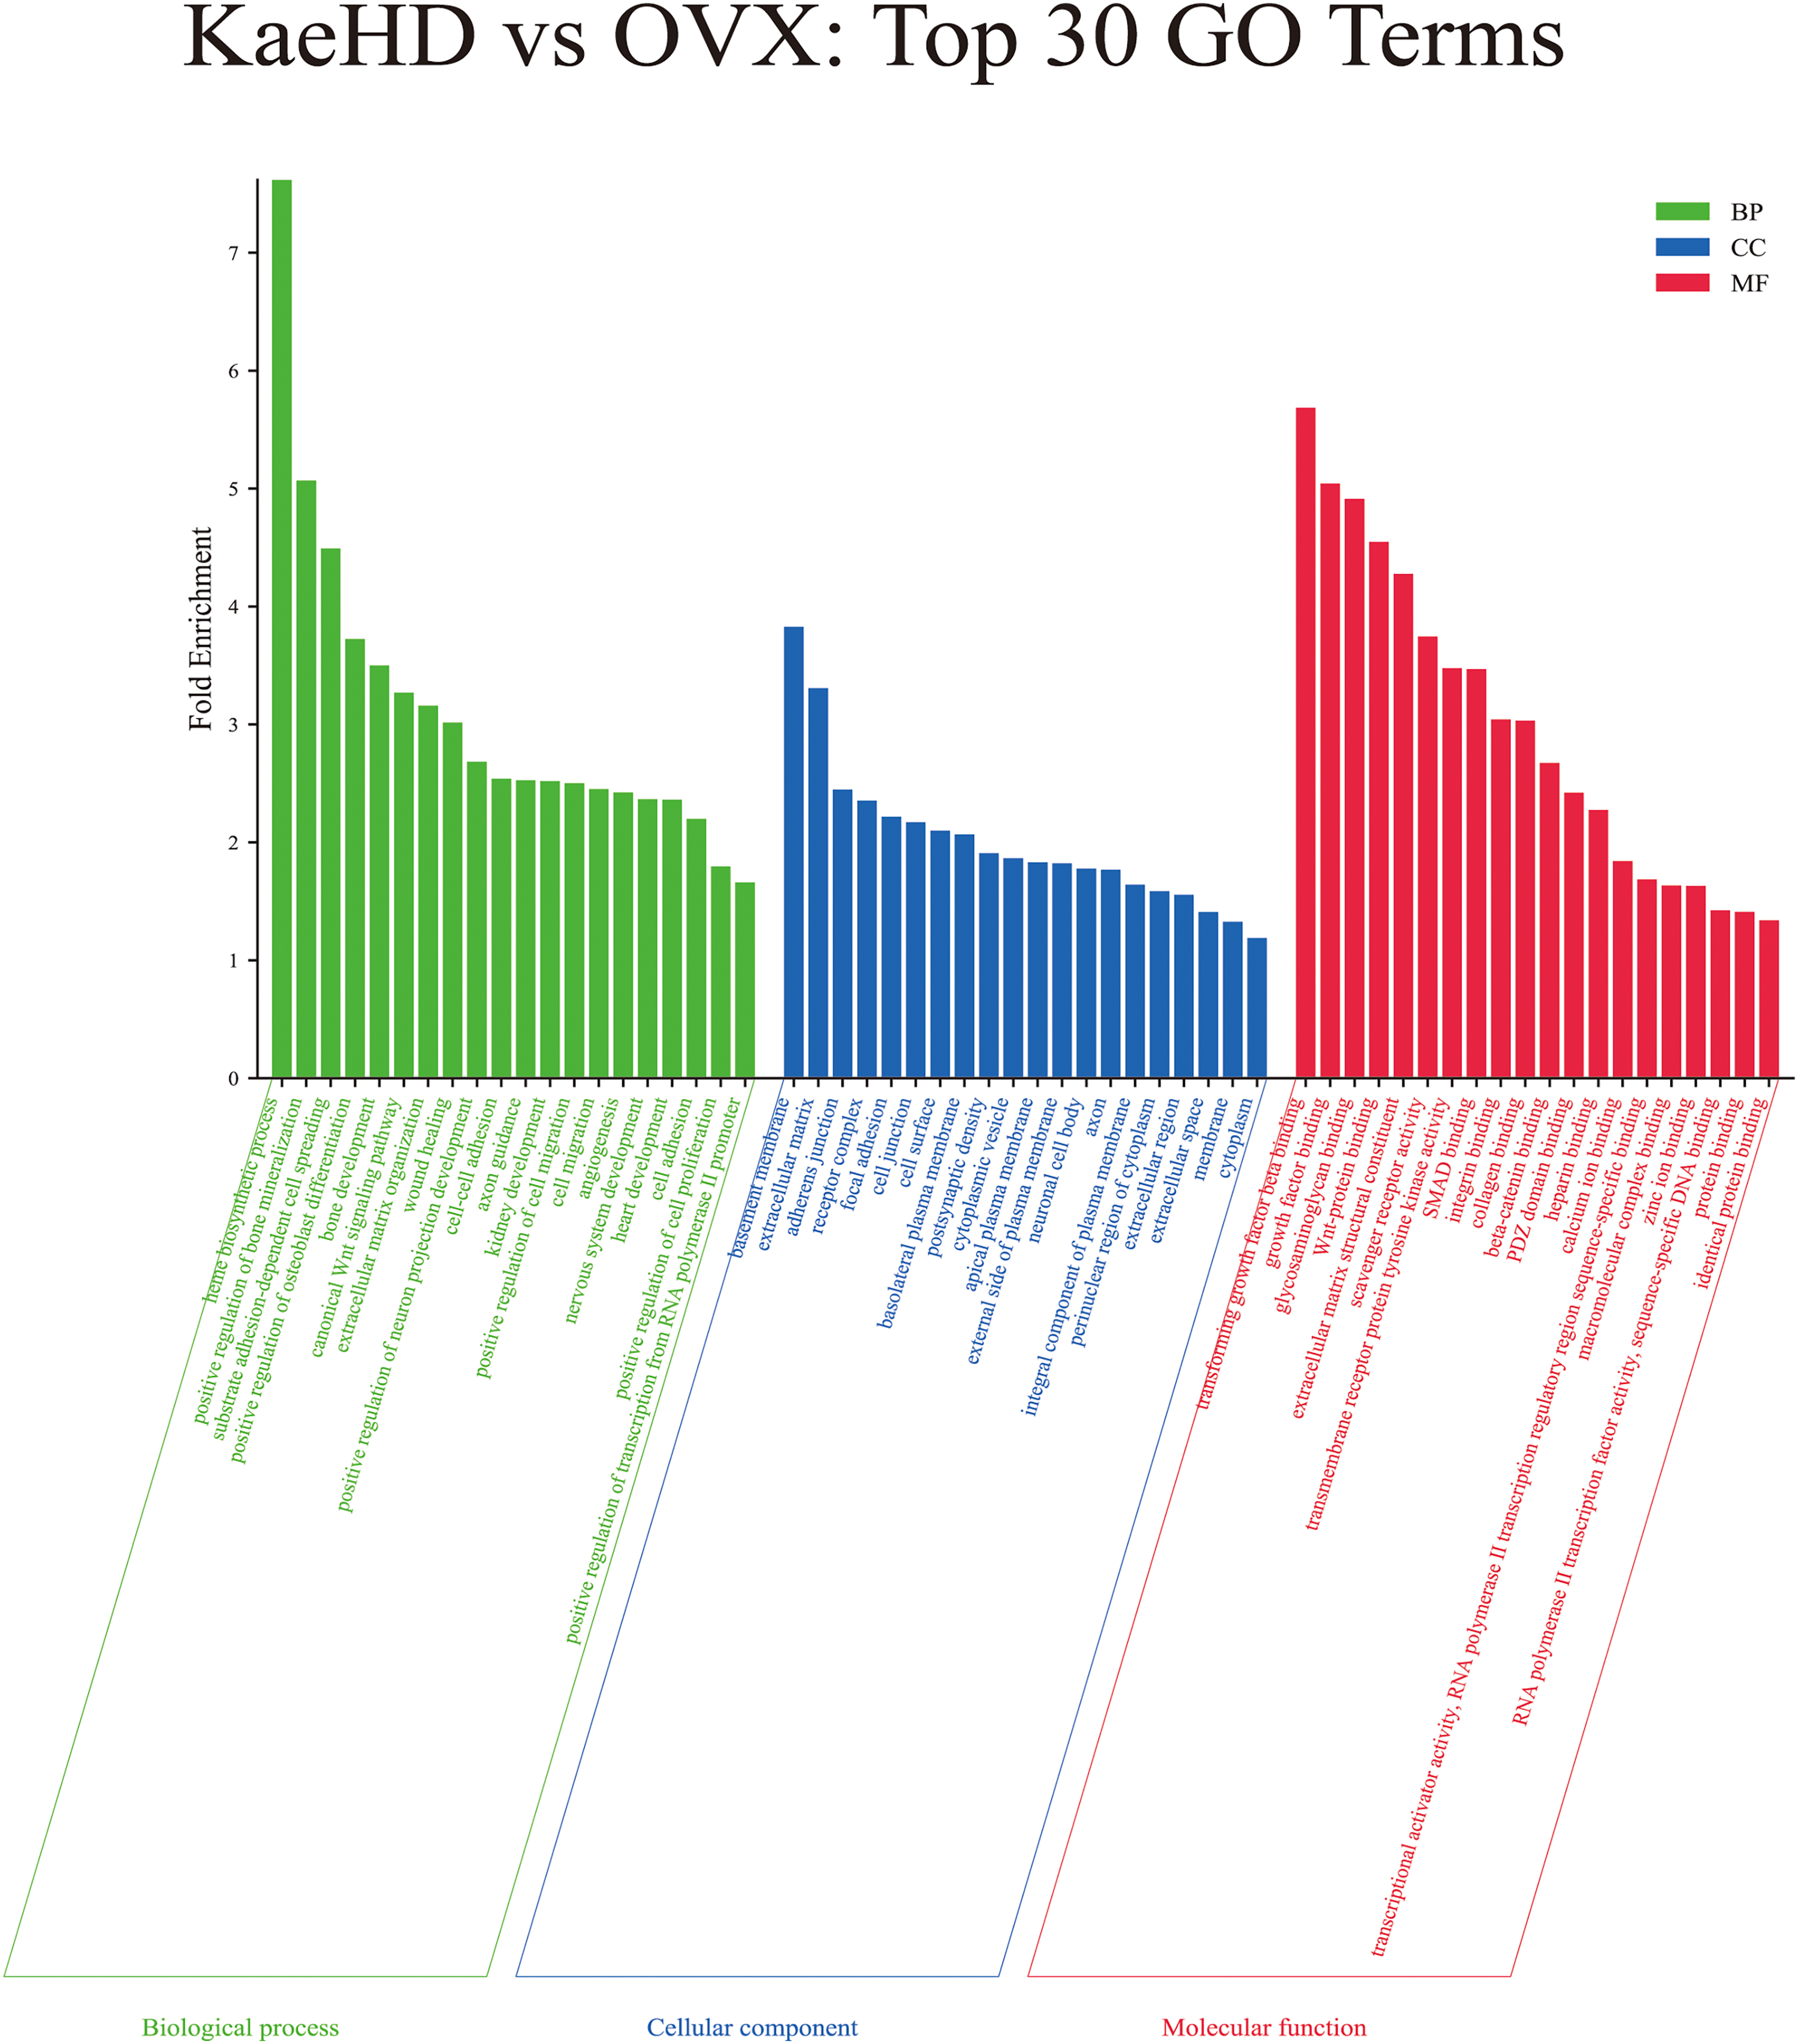
KaeHD versus OVX. Top 30 GO Terms. The sample size for each group was n = 3. OVX, ovariectomized rat model; GO, Gene Ontology.
Subsequently, Kyoto Encyclopedia of Genes and Genomes (KEGG) pathway enrichment analyses were conducted to investigate the most significantly enriched pathways in DEGs. In DEGs between the Sham and OVX groups, 10 terms were mapped into signal pathways, including Biosynthesis of amino acids, Oxocarboxylic acid metabolism, Retinol metabolism, and Metabolic pathways. On the other hand, 81 terms were mapped into signal pathways in DEGs between the KaeHD and OVX groups, encompassing the TGF-beta signaling pathway, ECM-receptor interaction, PI3K-Akt signaling pathway, calcium signaling pathway, Wnt signaling pathway, and MAPK signaling pathway (Figure 12).
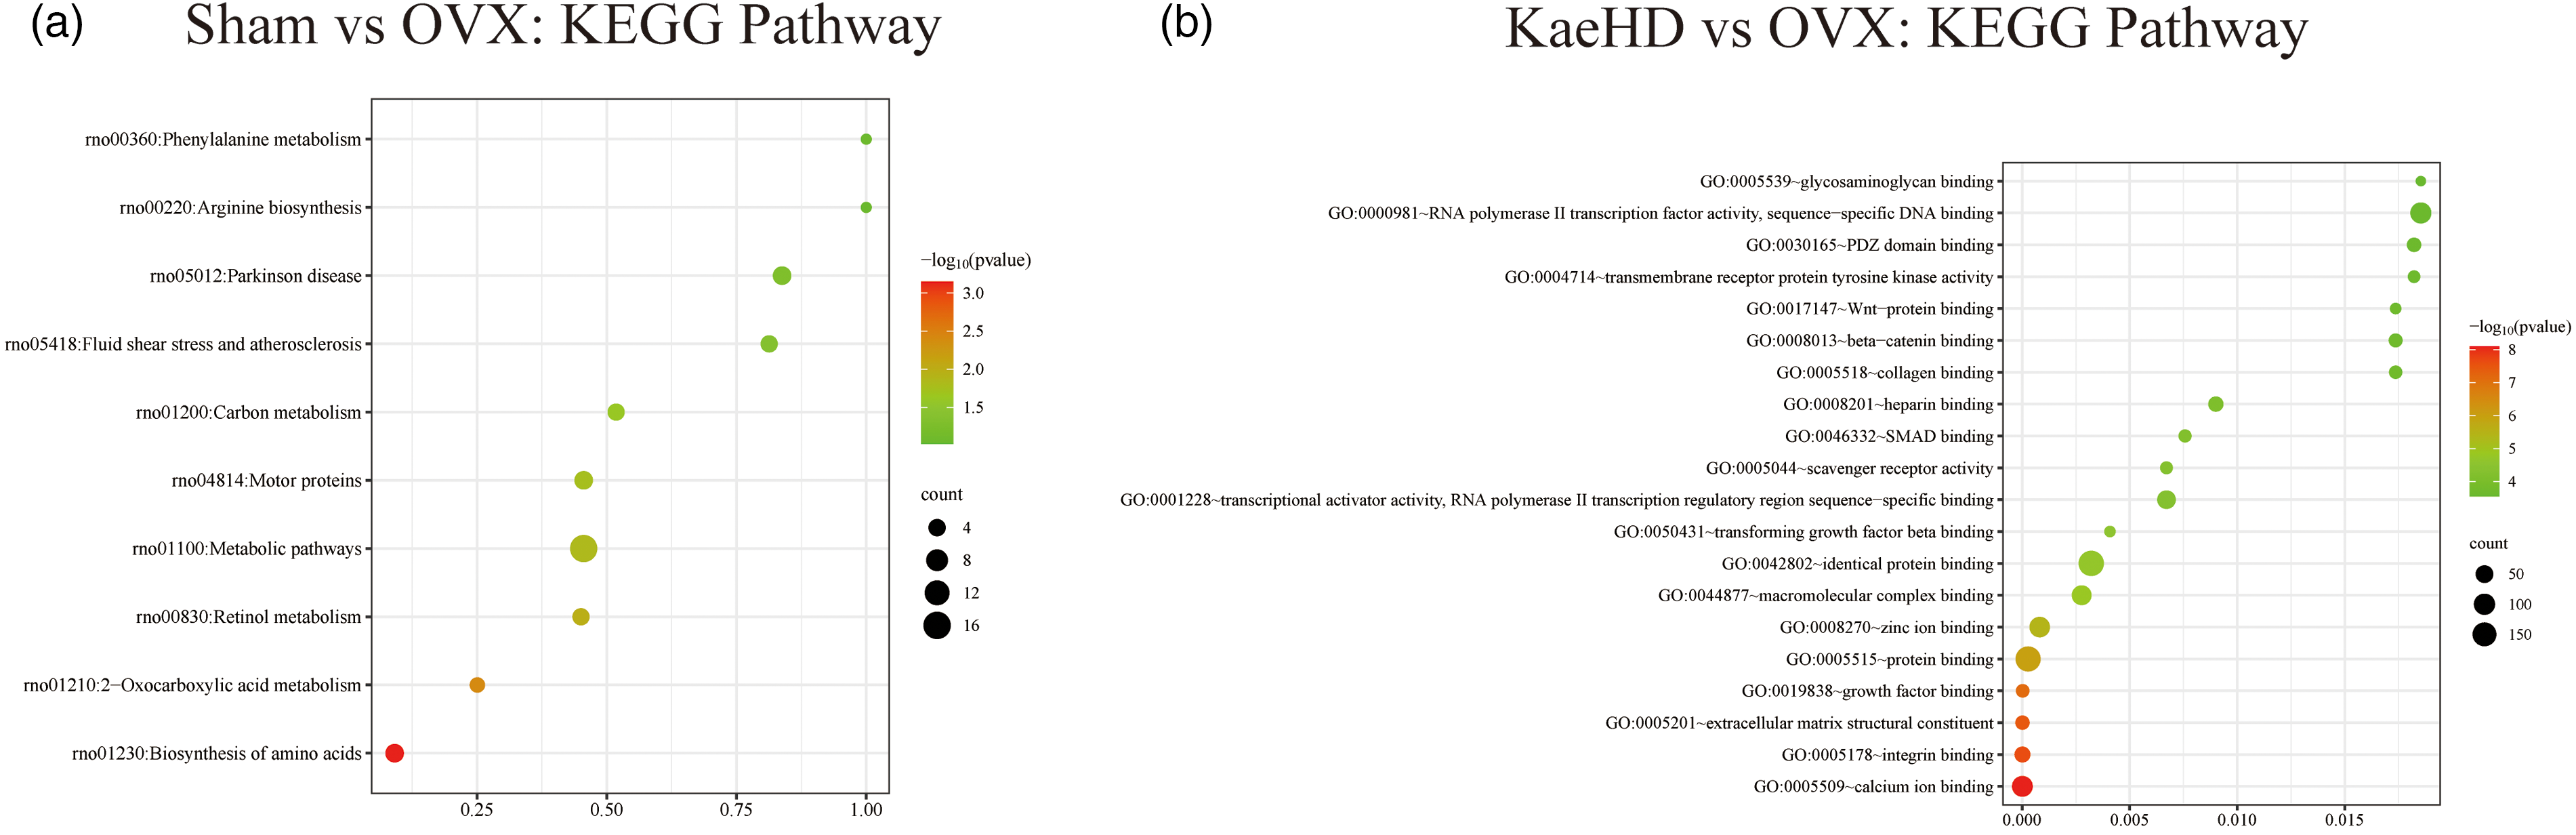
KEGG pathways. (a) KEGG Pathways in Sham versus OVX; (b) KEGG pathways in KaeHD versus OVX. The sample size for each group was n = 3. OVX, ovariectomized rat model; KEGG, Kyoto Encyclopedia of Genes and Genomes.
Results Verified by Animal Experiments
Immunohistochemistry Results
In comparison with the Sham group, NTN1 protein expression was notably higher in the OVX group (P < .01). Conversely, in contrast to the OVX group, NTN1 protein expression significantly decreased in the KaeHD group (P < .01). Similarly, EBF1 protein expression was significantly higher in the OVX group than in the Sham group (P < .01). However, EBF1 protein expression significantly decreased in the KaeHD group compared to the OVX group (P < .01). Likewise, LTBP4 protein expression was significantly higher in the OVX group than in the Sham group (P < .01). Nevertheless, LTBP4 protein expression was considerably lowered in the KaeHD group relative to the OVX group (P < .01). Lastly, GSN protein expression was significantly higher in the OVX group compared to the Sham group (P < .01). Yet, GSN protein expression significantly decreased in the KaeHD group compared to the OVX group (P < .01) (Figure 13).
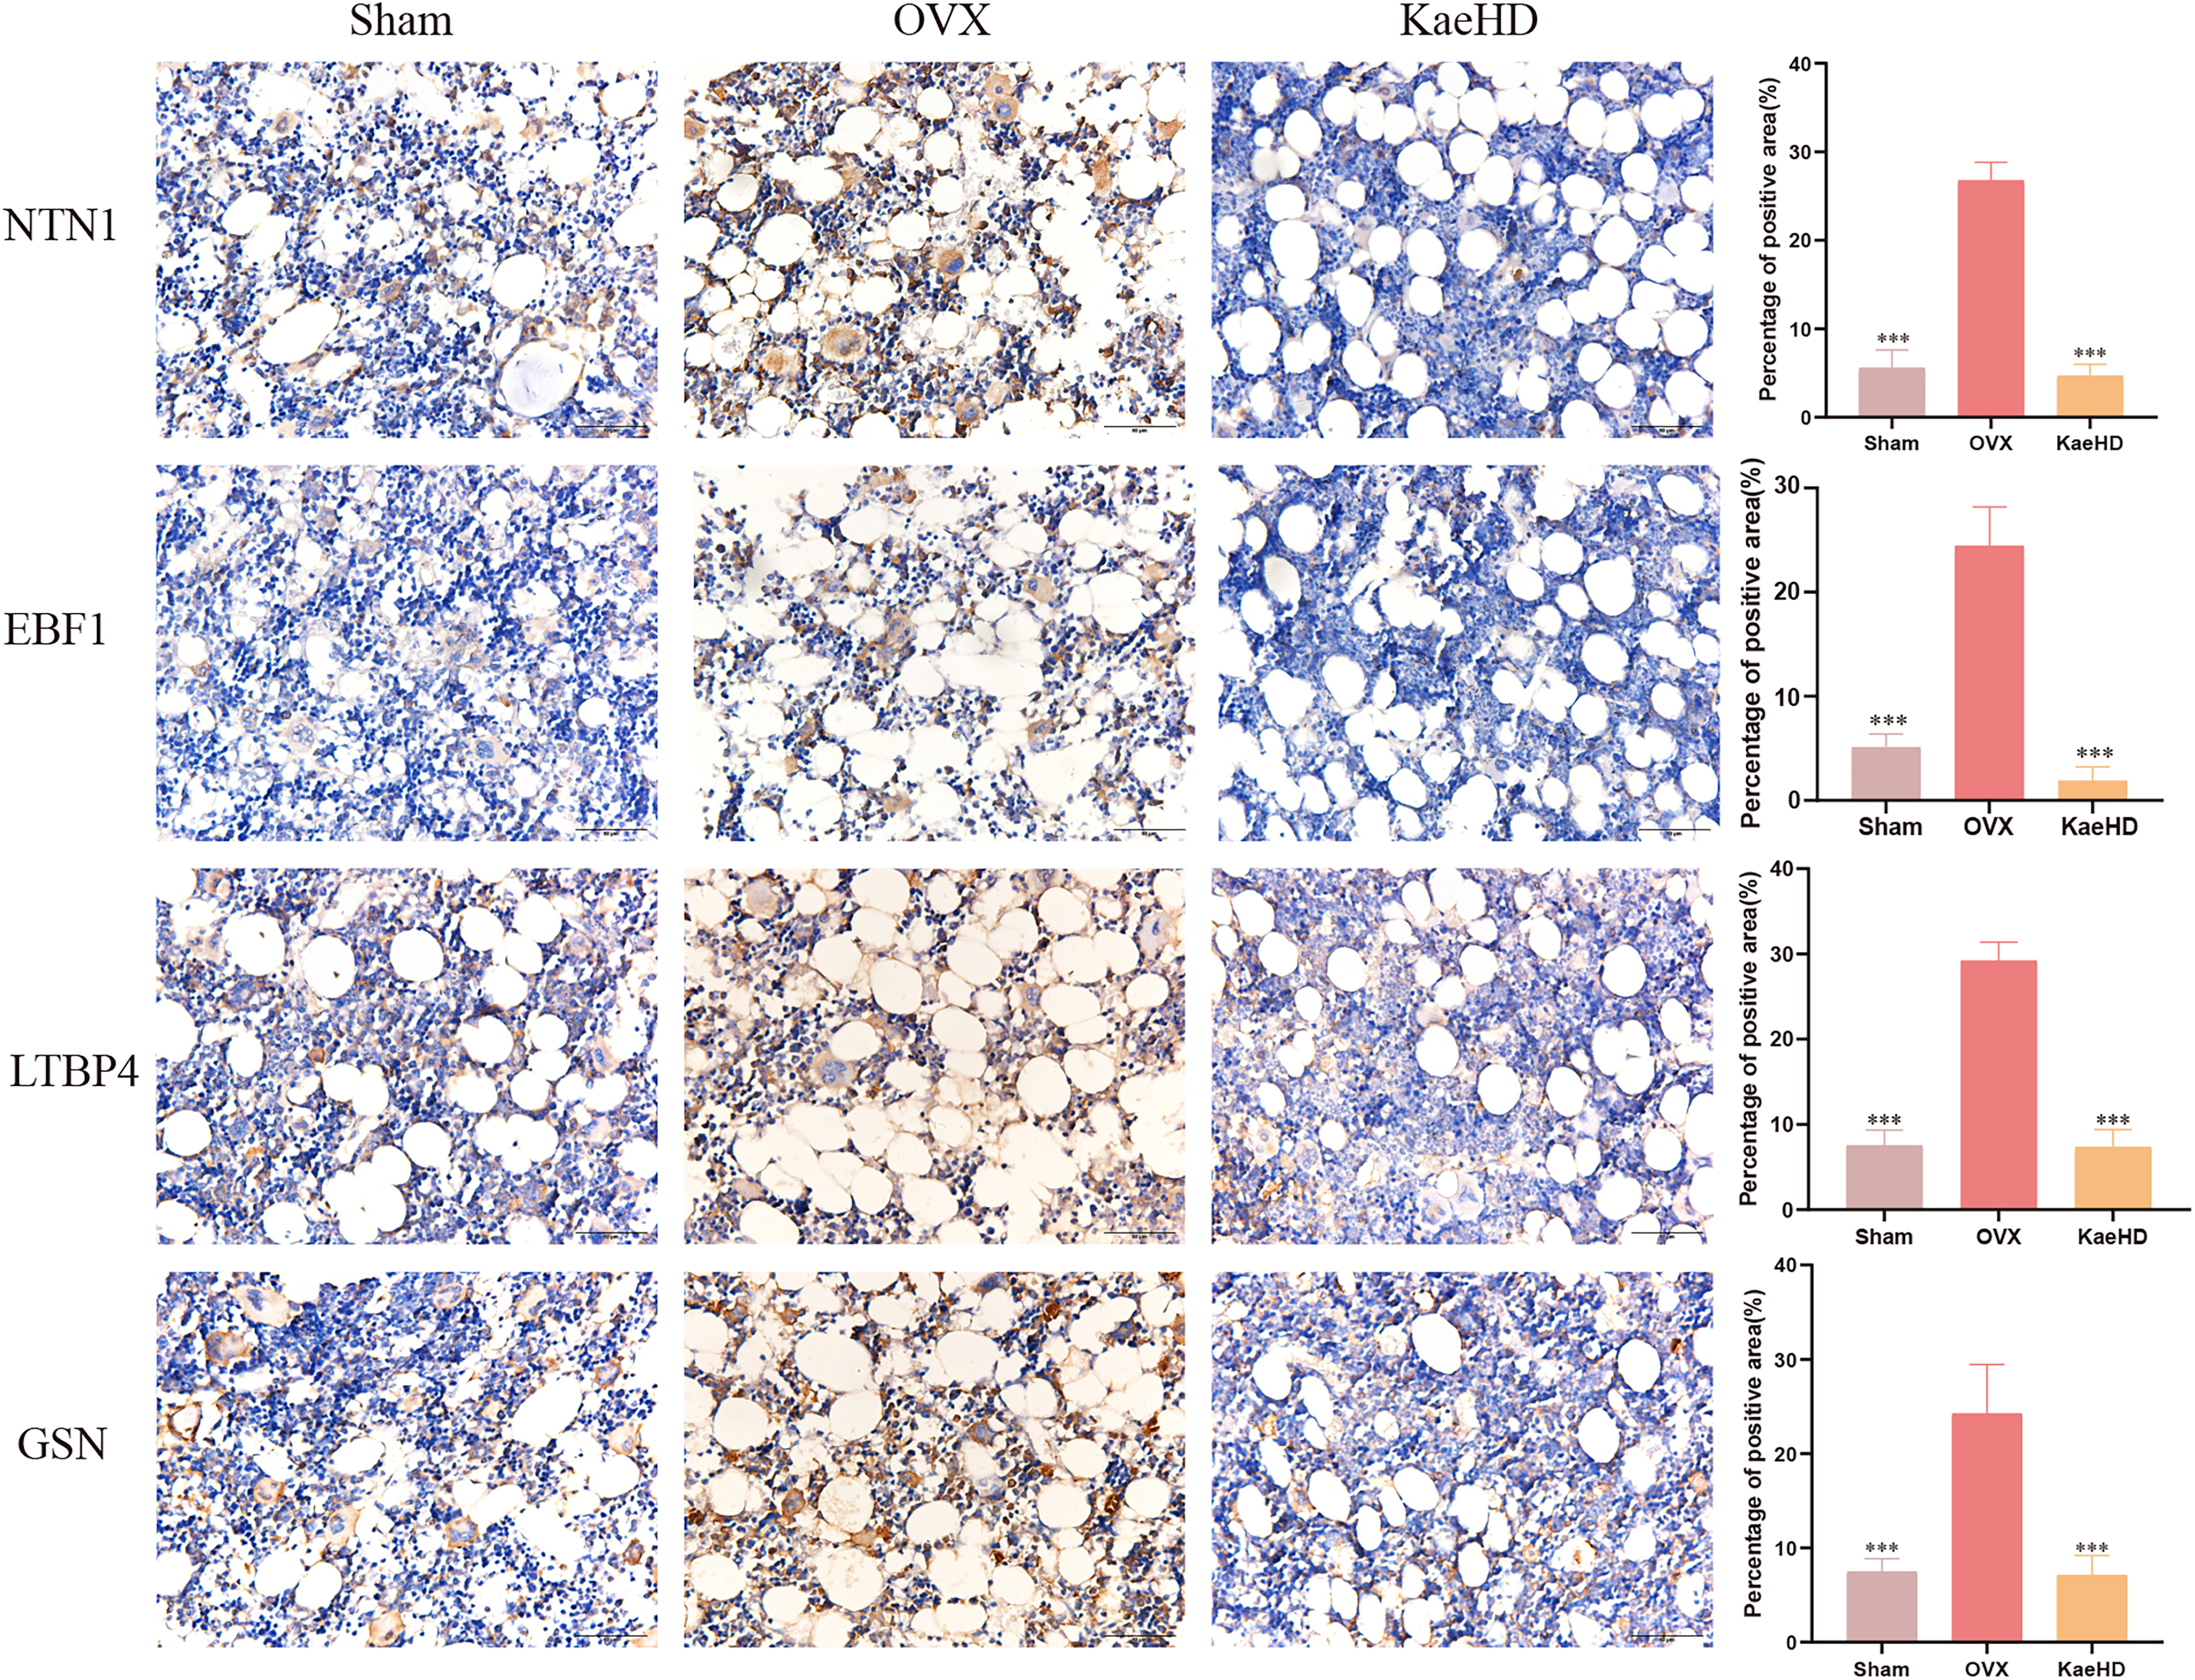
Immunohistochemical staining results of NTN1, EBF1, LTBP4, and GSN in the rat tibia. The relative quantitative values are expressed as the mean ± SD, and the sample size for each group was n = 6. Scale bar = 50 μm. ***P < .01 versus the OVX group. OVX, ovariectomized rat model.
Discussion
The primary characteristic of osteoporosis is reduced bone mass and deterioration of bone tissue, leading to increased bone frailty and fracture risk. 12 Kaempferol, the principal component in Chinese medicine Dulcimer, possesses several medicinal attributes, including bone preservation. Its minimal harm to the liver enhances its therapeutic.13,14 The maintenance of bone stability relies on the exact regulation of the activities of osteoclasts, responsible for bone resorption, and osteoblasts, responsible for bone formation. The progression of osteoporosis is frequently linked with intensified bone resorption and decreased bone formation. Bone marrow mesenchymal stem cells have the capacity to differentiate into three distinct pathways: adipocytes, osteoblasts, and chondrocytes. Combined with the results of transcriptomic analysis, it is hypothesized that kaempferol regulates bone metabolism, maintains bone homeostasis, and reduces bone loss by inhibiting the expression of NTN1, LTBP4, GSN, and EBF1 proteins, thus, enhancing the effectiveness of osteoporosis treatment as verified by animal experiments.
BMD serves as a pivotal metric for assessing bone health and determining the severity of osteoporosis, frequently employed in detecting osteoporosis. After establishing the animal model, a significant decrease in BMD was observed in the OVX group compared to the Sham group, indicating the successful induction of bone loss in ovariectomized rats. Hematoxylin-eosin (HE) staining showed that 8 weeks after ovary removal, the bone trabeculae structure in the OVX rat group was severely damaged, with destruction and a drastic reduction in their number. The bone trabeculae appeared fractured and thinned, displaying a loose and irregular arrangement. This suggests that bone homeostasis was disrupted, resulting in bone microstructure destruction and increased bone resorption after ovariectomy in rats. Following the intervention, the BMD of the AL, KaeLD, KaeMD, and KaeHD groups significantly increased, with improved and restored bone mass. The most substantial improvement was observed in the AL and KaeHD groups. HE staining illustrated that the number of bone trabeculae in all treatment groups increased to varying degrees. The bone structure exhibited a progressive improvement in response to an escalated dosage of medication. This was evident through increased thickness, enhanced connectivity between the bone and adjacent tissues, and an overall enhancement in structural integrity. The AL and KaeHD groups exhibited the most significant enhancement, resembling the microstructure of the Sham group and approaching normalcy. This suggests that kaempferol can increase bone mass, prevent the degradation of bone microstructure, and enhance BMD, thereby achieving the effect of treating osteoporosis.
To further elucidate kaempferol's regulation of bone metabolism, a mechanistic study was conducted, confirming the speculation through immunohistochemistry. EBF1 is an essential transcription factor that plays a critical role in determining and regulating the fate and function of B cells. It also has a significant impact on the formation of osteoblasts and adipocytes in living organisms. However, there are conflicting data on the role of Ebf1 in osteoblast differentiation and bone formation. Vappu Nieminen-Pihala team found that Ebf1 promotes early osteoblast differentiation but suppresses osteoblast function. 15 Immunohistochemistry (IHC) findings indicated that the level of EBF1 protein expression rose considerably in the OVX group compared to the Sham group, and this decreased to baseline levels following the intervention of drug administration. This indicates that EBF1 detrimentally affects bone health, exacerbating bone loss, and that kaempferol counters this negative impact by reducing the expression of this protein. Netrin-1 is a secreted protein generated by the NTN1 gene in humans and is produced by various tissues and cell types. Previous research has demonstrated that Netrin-1 has a role in bone remodeling by impeding the division of osteoblasts while supporting the differentiation of osteoclasts. 16 IHC results revealed a significant rise in the expression of NTN1 protein in the OVX group in comparison to the Sham group, which later decreased and stabilized after drug intervention. This indicates that kaempferol could stimulate the differentiation of osteoblasts and hinder the formation of osteoclasts by downregulating the expression of NTN1 protein to sustain the equilibrium of bone. GSN is the foundational protein in the gelsolin superfamily 17 and it holds diverse functions in mammalian and non-mammalian tissues and organs. GSN's link to osteoporosis function has been established, and it has been shown that GSN expression is increased in the serum of patients with osteoporosis. 18 IHC results indicated that GSN protein expression was significantly elevated in the OVX group compared to the Sham group. In contrast, GSN protein expression decreased and returned to normal after drug intervention. This suggests that kaempferol can inhibit osteoclast formation and reduce bone resorption by downregulating the expression of GSN protein, essentially reducing bone loss. Ltbp4 is one of the four mammalian Ltbp genes that encode proteins within the large potential complex of the growth factor TGF-b. Srinivas Ayilavarapu found that Ltbp4 expression is decreased in the bone regulatory pathway in diabetic patients. 19 IHC results indicated that LTBP4 protein expression was significantly elevated in the OVX group compared to the Sham group, while LTBP4 protein expression decreased and returned to normal after drug intervention. This suggests that kaempferol can promote osteogenic differentiation by downregulating the expression of LTBP4 protein and counteracting bone resorption to restore bone mass. These results also provide another perspective on the fact that treating osteoporosis with kaempferol involves not only a single modulation of one function but a multi-target, multifunctional approach that increases bone mass and restores bone homeostasis.
However, this study also has some limitations. We did not do cellular level exploration of the four key genes screened due to the limitation of research funding. This may lead to unclear interpretation of the effects of kaempferol on the differentiation of osteoblasts and osteoclasts value-added and their cellular functions. Further cellular experiments will be conducted as funds become available.
Conclusions
In summary, kaempferol enhances BMD levels, retards tibial bone loss with structural deterioration in OVX model rats, and promotes bone formation while curbing bone resorption through NTN1, LTBP4, GSN, and EBF1 protein down-regulation. Our study furnishes an experimental foundation for comprehending kaempferol's osteoporosis mitigation mechanism.
Materials and Methods
Laboratory Animals
Sixty female SD rats were purchased from Hunan Slaughter Kingda Laboratory Animal Co (The qualification number of this batch of rats: NO. 430727221100823516), all classified as SPF and ranged in age from 9 weeks and weight from 230 g to 250 g. All animal-related experiments were carried out with protocols approved by our school (Guangxi University of Chinese Medicine, license number of the animal center: SYXK(GUI)2019-0001). Three rats were housed in one cage. Indoor temperature was maintained at 23-25°C, humidity at 55-75%, with a 12 h alternating light-dark cycle. Rats had adlibitum access to food and water, received standard maintenance diets, and were acclimated until three months of age before experiments commenced.
Experimental Drug
Kaempferol, with 97% purity, No. K107145-25 g, was purchased from Shanghai Aladdin Biochemical Technology Co. Alendronate sodium tablets, commercially known as Fosamax, batch number U006983, were obtained from Hangzhou Merck Sharp & Dohme Pharmaceutical Co.
Animal Experiments
Sixty SD rats were randomly assigned to two groups: 50 rats in the experimental group underwent bilateral ovariectomy, while 10 rats in the control group had only a small portion of fat around the ovaries remove. 20 After 8 weeks of standard rearing, BMD testing confirmed successful modeling, pharmacological intervention commenced immediately afterward in groups. The sensor was incorporated into a homogeneous and stable suspension using 0.5% carboxymethyl cellulose sodium (CMC-Na) as a vehicle. Sham operation group: each rat received 0.5% CMC-Na solution; OVX group: each rat received 0.5% CMC-Na solution; positive control group (AL): each rat received 1.05 mg/kg alendronate; KaeLD group: each rat received 10 mg/kg kaempferol; KaeMD group: each rat received 20 mg/kg kaempferol; KaeHD group: each rat received 40 mg/kg kaempferol. Drug administration was continued for 12 weeks.
Assessment of BMD
Prior to the modeling process and upon completion of the intervention cycle, rats were subjected to anesthesia using isoflurane after a period of fasting overnight. Subsequently, bone mineral content was assessed using dual-energy bone densitometry. The experimental procedure involved positioning rats in the prone position on the operating table in order to quantify their whole-body BMD using a dual-energy X-ray BMD meter. The selection of measurement types encompassed the entirety of the tiny animal's body, the standard mode, and specific measurement characteristics. The dimensions of the object under study are as follows: the length measures 75.7 cm, while the breadth measures 25.0 cm. The exposure parameters utilized in the experiment were a voltage of 76 kV, a current of 0.15 mA, and an exposure time of 4 min and 8 s. The scanning dosage applied during the experiment amounted to 1.8 µGy. The unit for BMD is grams per cubic centimeter (g/cm2) (Tables 3 and 4).
The Manufacturers and Models of the Main Instruments.
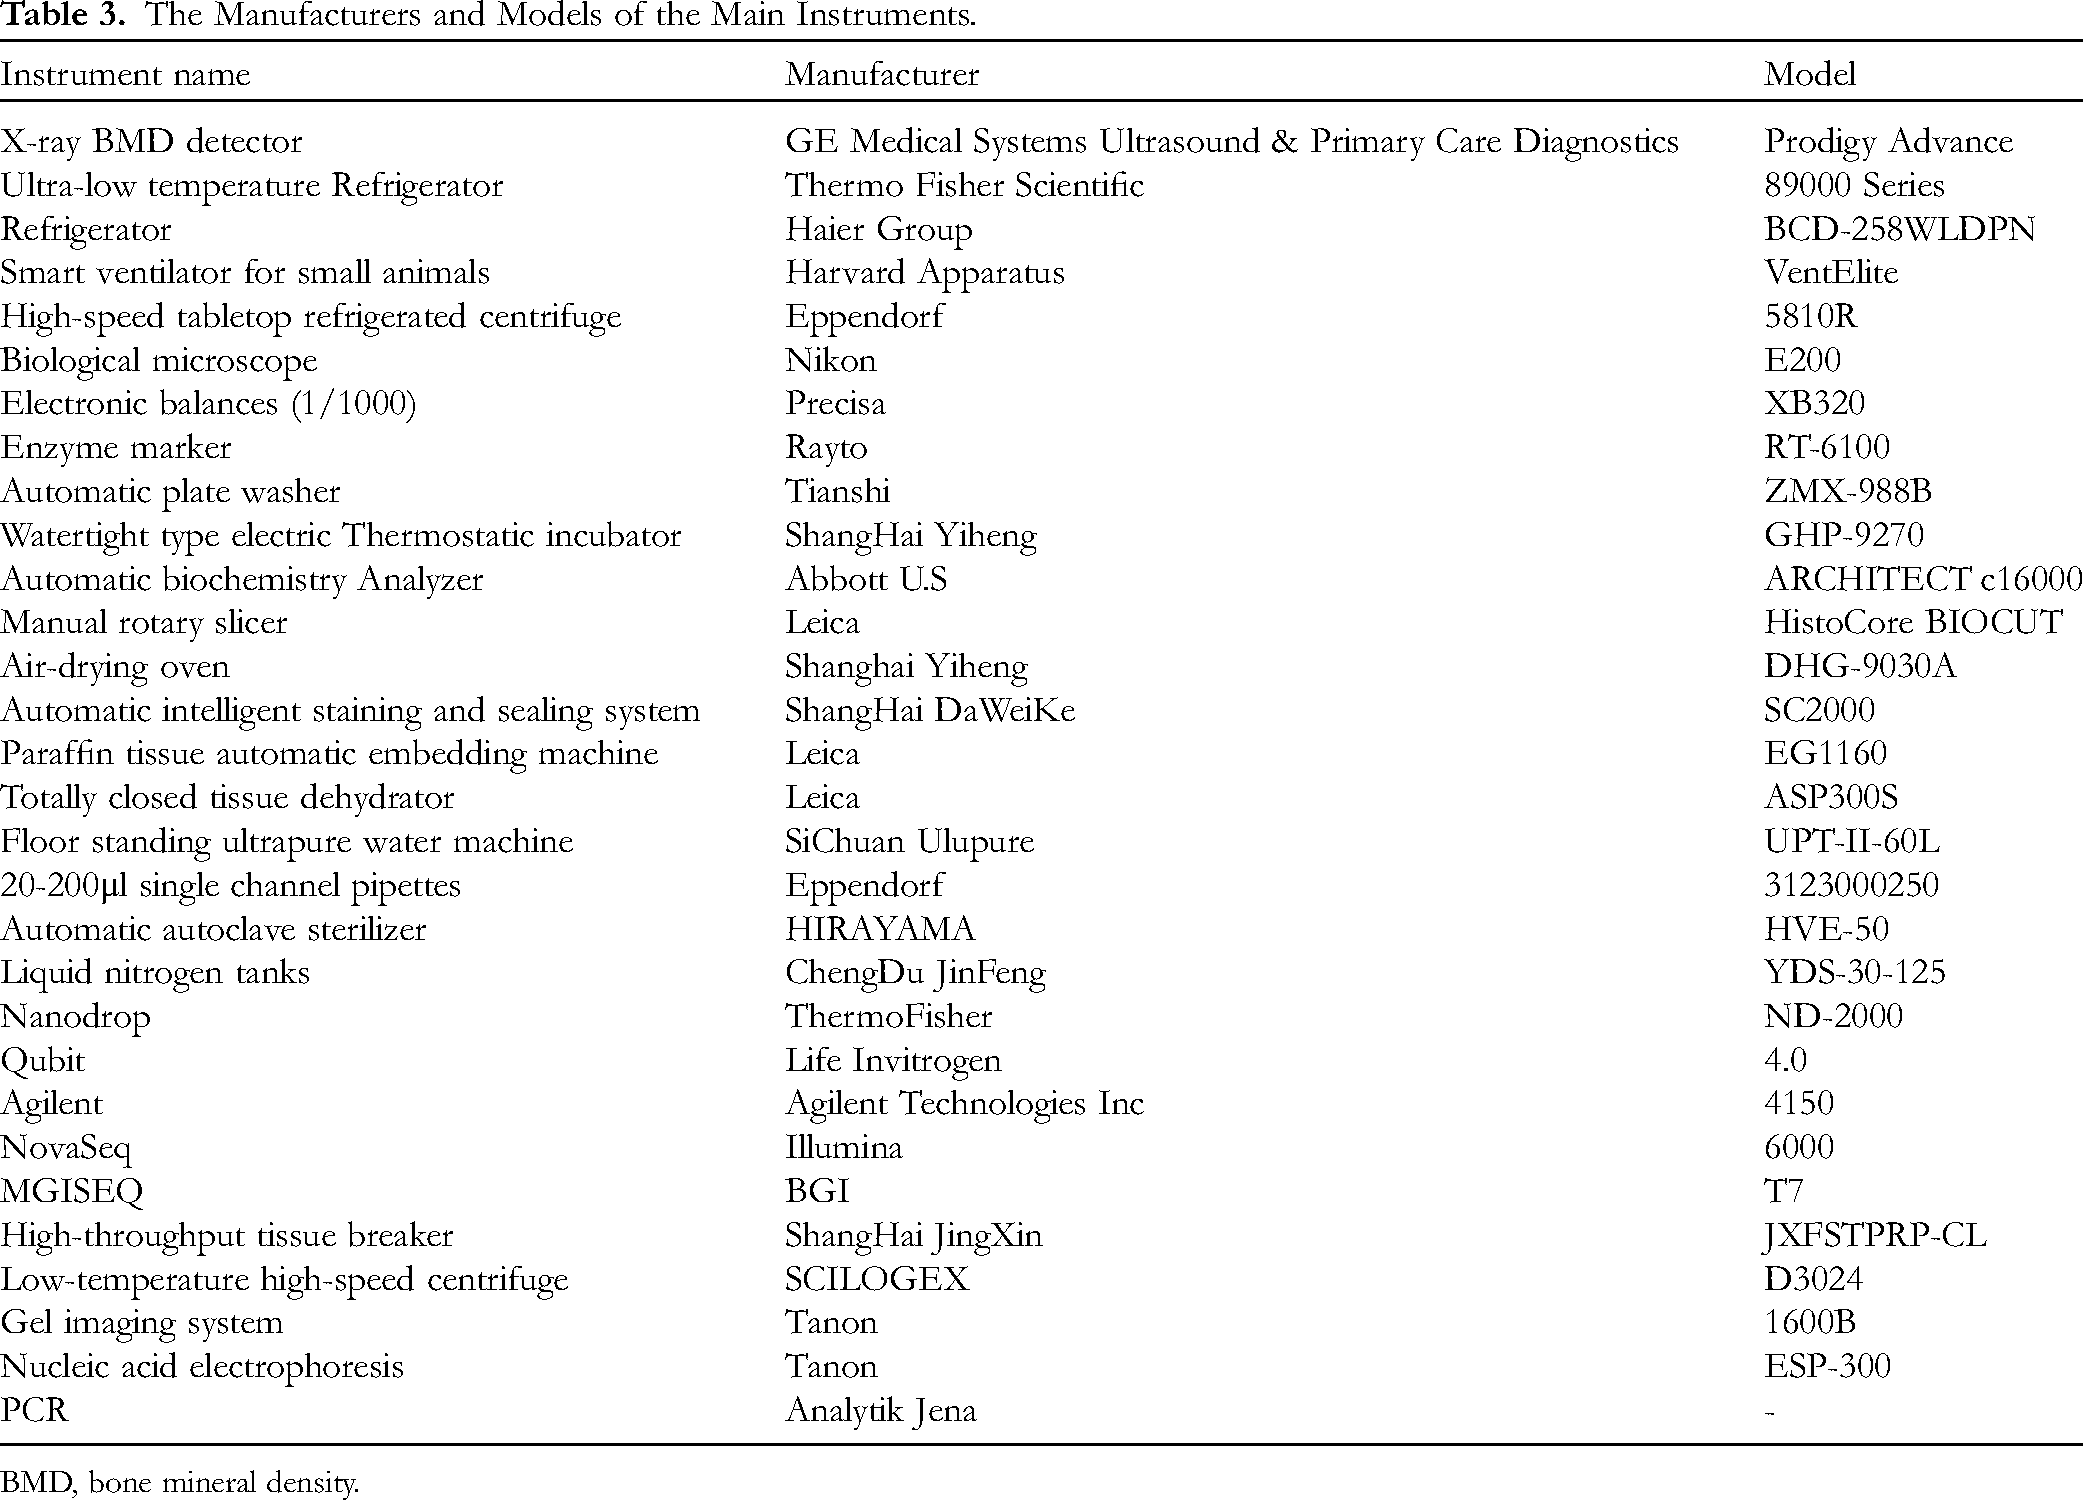
BMD, bone mineral density.
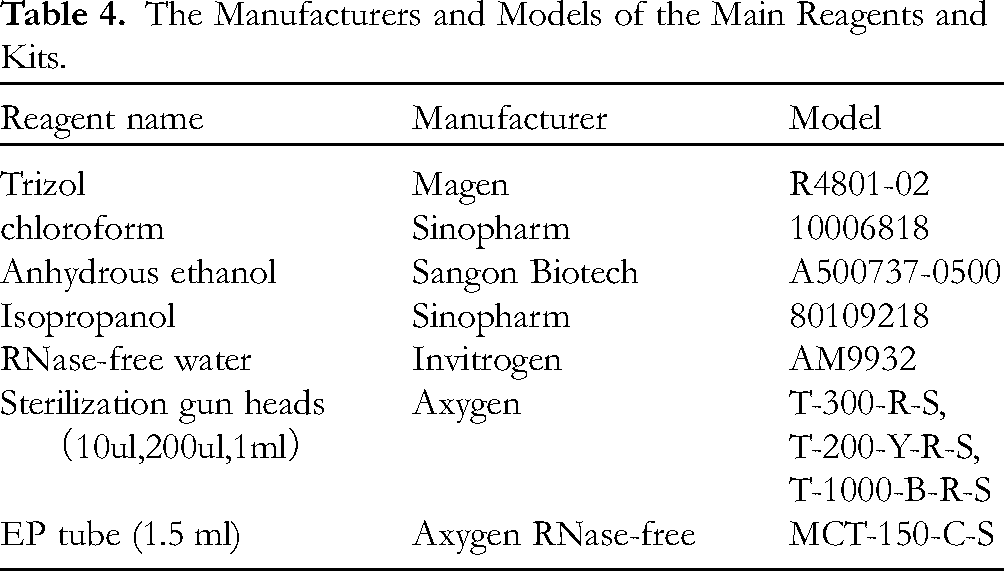
The Manufacturers and Models of the Main Reagents and Kits.
HE Staining of Bone Tissue
The tibia was immersed in a 4% paraformaldehyde solution for a duration of 24 h prior to being transferred into an EDTA decalcification solution for the purpose of decalcification therapy. The decalcification solution was replenished on a weekly basis for a period of 8 weeks. Following the process of decalcification, the specimens were subsequently cut to a suitable dimension in preparation for paraffin embedding. The paraffin blocks were subsequently sectioned into slices measuring 5 µm in thickness using a microtome. These slices were then flattened in hot water and transferred onto glass slides. Thereafter, the sections underwent deparaffinization, staining and were thereafter examined using an electron microscope to assess histological alterations in the femur. Area of bone trabeculae was measured by Image J software.
Transcriptomics Analysis
The tibiae of three rats from each of the Sham, OVX, and KaeHD groups were randomly selected for transcriptomic sequencing. After sequencing, the raw data obtained from sequencing were filtered, and the filtered high-quality clean reads were compared with the reference sequences. Based on the comparison results, analyses such as new transcript prediction were performed, followed by quantitative analysis of known and unknown genes. Known and unique genes were further quantitatively analyzed. Differential expression analysis was conducted based on gene expression in different sample groups. More in-depth mining analysis was carried out on the differential genes obtained from screening. The differential genes obtained from screening underwent more detailed analysis and exploration.
DEG Analysis
Differential genes were screened using log2FoldChange > 0.7 or < −0.7 with padj (Q)< 0.05 as the screening criterion. Firstly, genes considered as causative for osteoporosis were identified by their low expression in the Sham group and high expression in the OVX group. Secondly, genes recognized as therapeutic targets of kaempferol in osteoporosis treatment were identified by their high expression in the OVX group and low expression in the KaeHD group. The genes obtained from the intersection of causative and therapeutic genes were considered to be the pharmacological targets of kaempferol for osteoporosis treatment.
Gene Ontology and KEGG Enrichment Analysis
For functional enrichment analysis, all DEGs were mapped to terms in the DAVID database (https://david-d.ncifcrf.gov/). Gene Ontology (GO) terms or KEGG pathways in the DEGs were identified using a threshold of P < .05. GO terms were categorized into three sub-groups: BP, CC, MF.
IHC for NTN1, EBF1, LTBP4, GSN Protein Expression
The paraffin sections were subjected to deparaffinization and hydration processes using xylene and ethanol, respectively. The method of antigen retrieval was conducted utilizing citric acid with the application of heat, then followed by rinsing with phosphate-buffered saline. The sections were then treated with 3% H2O2 for 15 min at room temperature. Blocking was done using sera homologous to the secondary antibody, followed by a 30-min incubation at 37°C. The primary antibodies (NTN1, EBF1, LTBP4, GSN antibodies) were introduced and subjected to an overnight incubation at a temperature of 4°C within a refrigerated environment. The sections underwent a washing process, followed by treatment with the secondary antibody. Subsequently, they were incubated at a temperature of 37°C for a duration of 30 min. The sections were then subjected to development using 3,3-diaminobenzidine and subsequently stained for imaging. Data analysis was performed using Image J software.
Statistical Analysis
SPSS 23.0 and GraphPad Prism 7 were used for statistical analysis of the experimental data. The measurement data were represented as the mean value plus or minus the standard deviation (mean ± SD). The researchers employed an independent sample t-test to compare the two groups. The one-way analysis of variance was used to compare several groups. Statistical differences were considered significant when the P-value was <0.05.
Footnotes
Declaration of Conflicting Interests
The authors declared no potential conflicts of interest with respect to the research, authorship, and/or publication of this article.
Ethical Approval
The experiment procedures adhered to the Principles of Laboratory Animal Care. Prior to initiation of the research work carried out on animals, the legal and ethical of the experiment protocol has been reviewed and approved by Guangxi University of Chinese Medicine Institutional Welfare and Ethical Committee (APPROVAL NUMBER: DW2022014-008).
Funding
The authors disclosed receipt of the following financial support for the research, authorship, and/or publication of this article: This research was funded by the Guangxi Natural Science Foundation (2021GXNSFAA220089), Research Foundation Ability Enhancement Project for Young and Middle aged Teachers in Guangxi Universities (2024KY0295), Guangxi Chinese Medicine Multidisciplinary Interdisciplinary Innovation Team Project (GZKJ2310), Guangxi University of Chinese Medicine's Scientific Research Start-up Fund Project for Introducing Doctor (2023BS043), and Innovation Project of Guangxi Graduate Education under Grant (YCBXJ2023034).
Statement of Human and Animal Rights
All procedures in this study were conducted in accordance with Guangxi University of Chinese Medicine Institutional Welfare and Ethical Committee (APPROVAL NUMBER: DW2022014-008).
Statement of Informed Consent
There are no human subjects in this article and informed consent is not applicable.